Attached files
| file | filename |
|---|---|
| EX-4.8 - EXHIBIT 4.8 - FORM OF UNDERWRITER WARRANT - PIONEER POWER SOLUTIONS, INC. | v354317_ex4-8.htm |
| EX-5.1 - EXHIBIT 5.1 - FORM OF OPINION OF HAYNES AND BOONE, LLP - PIONEER POWER SOLUTIONS, INC. | v354317_ex5-1.htm |
| EX-1.1 - EXHIBIT 1.1 - FORM OF UNDERWRITING AGREEMENT - PIONEER POWER SOLUTIONS, INC. | v354317_ex1-1.htm |
| EX-23.1 - EXHIBIT 23.1 - CONSENT OF RICHTER LLP - PIONEER POWER SOLUTIONS, INC. | v354317_ex23-1.htm |
As filed with the Securities and Exchange Commission on September 10, 2013.
SEC File No. 333- 190302
UNITED STATES
SECURITIES AND EXCHANGE COMMISSION
WASHINGTON, D.C. 20549
AMENDMENT NO. 1 TO
FORM S-1
REGISTRATION STATEMENT UNDER THE SECURITIES ACT OF 1933
PIONEER POWER SOLUTIONS, INC.
(Exact name of registrant as specified in its charter)
| Delaware | 3612 | 27-1347616 |
|
(State or other jurisdiction of incorporation or organization) |
(Primary Standard Industrial Classification Code Number) |
(I.R.S. Employer Identification No.) |
400 Kelby Street, 9th Floor
Fort Lee, New Jersey 07024
(212) 867-0700
(Address, including zip code, and telephone
number,
including area code, of registrant’s principal executive offices)
Nathan J. Mazurek
Chief Executive Officer
Pioneer Power Solutions, Inc.
400 Kelby Street, 9th Floor
Fort Lee, New Jersey 07024
(212) 867-0700
(Name, address, including zip code, and telephone number,
including area code, of agent for service)
Copies of all communications, including communications sent to agent for service, should be sent to:
|
Rick A. Werner, Esq. Haynes and Boone, LLP 30 Rockefeller Plaza, 26th Floor New York, New York 10112 Tel. (212) 659-7300 Fax (212) 884-8234 |
Robert L. Frome, Esq. Kenneth A. Schlesinger, Esq. Olshan Frome Wolosky LLP Park Avenue Tower 65 East 55th Street New York, NY 10022 Tel. (212) 451-2300 Fax (212) 451-2222 |
Approximate date of commencement of proposed sale to the public: As soon as practicable after the effective date of this Registration Statement.
If any of the securities being registered on this Form are to be offered on a delayed or continuous basis pursuant to Rule 415 under the Securities Act of 1933 check the following box. o
If this Form is filed to register additional securities for an offering pursuant to Rule 462(b) under the Securities Act, please check the following box and list the Securities Act registration statement number of the earlier effective registration statement for the same offering. o
If this Form is a post-effective amendment filed pursuant to Rule 462(c) under the Securities Act, check the following box and list the Securities Act registration statement number of the earlier effective registration statement for the same offering. o
If this Form is a post-effective amendment filed pursuant to Rule 462(d) under the Securities Act, check the following box and list the Securities Act registration statement number of the earlier effective registration statement for the same offering. o
Indicate by check mark whether the registrant is a large accelerated filer, an accelerated filer, a non-accelerated filer, or a smaller reporting company. See the definitions of “large accelerated filer,” “accelerated filer” and “smaller reporting company” in Rule 12b-2 of the Exchange Act. (Check one):
| Large accelerated filer | o | Accelerated filer | o |
| Non-accelerated filer | o | Smaller reporting company | x |
| (Do not check if a smaller reporting company) |
The registrant hereby amends this registration statement on such date or dates as may be necessary to delay its effective date until the registrant shall file a further amendment which specifically states that this registration statement shall thereafter become effective in accordance with section 8(a) of the Securities Act of 1933 or until the registration statement shall become effective on such date as the Commission acting pursuant to said section 8(a), may determine.
The information in this prospectus is not complete and may be changed. We may not sell these securities until the registration statement filed with the Securities and Exchange Commission is effective. This prospectus is not an offer to sell these securities and it is not soliciting an offer to buy these securities in any state where the offer or sale is not permitted.
SUBJECT TO COMPLETION, DATED SEPTEMBER 10, 2013
1,000,000 Shares

Pioneer Power Solutions, Inc.
Common Stock
$ per share
We are offering 1,000,000 shares of our common stock. Our common stock is quoted on the OTCQB under the symbol “PPSI.” On September 9, 2013, the last reported sale price of our common stock was $7.00 per share.
We have applied to list our shares of common stock for quotation on the Nasdaq Capital Market under the symbol “PPSI.”
We anticipate that the offering price per share of our common stock will be between $7.00 and $8.00.
Investing in our common stock is highly speculative and involves a high degree of risk. See “Risk Factors” beginning on page 10 of this prospectus before making a decision to purchase our common stock.
| Per Share | Total | ||
| Public offering price | $ | $ | |
| Underwriting discount (1) | $ | $ | |
| Proceeds, before expenses, to Pioneer Power Solutions, Inc. | $ | $ |
| (1) | See “Underwriting” beginning on page 66 for disclosure regarding compensation payable to the underwriters by us. |
We have granted the underwriters an option to purchase up to 150,000 additional shares of common stock from us at the public offering price, less the underwriting discount, within 30 days from the date of this prospectus to cover over-allotments, if any.
Neither the Securities and Exchange Commission nor any state securities commission has approved or disapproved of these securities or passed upon the adequacy or accuracy of this prospectus. Any representation to the contrary is a criminal offense.
The underwriters expect to deliver the shares against payment in New York, New York on , 2013.
The date of this prospectus is , 2013
Sole Book-Running Manager
Roth Capital Partners
Co-Manager
Monarch Capital Group
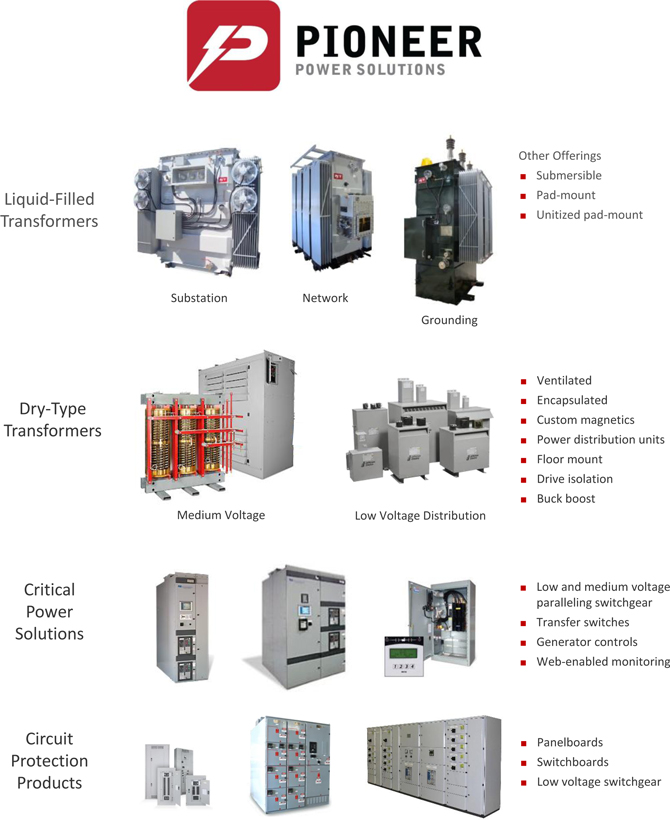
TABLE OF CONTENTS
You should rely only on the information contained in this prospectus. We have not authorized any other person to provide you with information different from or in addition to that contained in this prospectus. If anyone provides you with different or inconsistent information, you should not rely on it. We are not making an offer to sell these securities in any jurisdiction where an offer or sale is not permitted. You should assume that the information appearing in this prospectus is accurate only as of the date on the front cover of this prospectus. Our business, financial condition, results of operations and prospects may have changed since that date.
Industry and Market Data
In this prospectus, we rely on and refer to information and statistics regarding our industry. We obtained this statistical, market and other industry data and forecasts from publicly available information. While we believe that the statistical data, market data and other industry data and forecasts are reliable, we have not independently verified the data.
Prospectus Artwork
The photograph on the inside back cover of this prospectus is published pursuant to a license available at creativecommons.org/licenses/by/2.0/deed.en
| i |
This summary highlights information contained in other parts of this prospectus. Because it is a summary, it does not contain all of the information that you should consider in making your investment decision. Before investing in our common stock, you should read the entire prospectus carefully, including our consolidated financial statements and the related notes included in this prospectus and the information set forth under the headings “Risk Factors” and “Management’s Discussion and Analysis of Financial Condition and Results of Operations.”
When used herein, unless the context requires otherwise, references to the “Company,” “Pioneer,” “we,” “our” and “us” refer to Pioneer Power Solutions, Inc., and, where appropriate, its consolidated subsidiaries.
The Company
Overview
We manufacture specialty electrical transmission and distribution equipment and provide a broad range of custom-engineered and general purpose solutions for applications in the utility, industrial and commercial markets. Our product lines include a wide range of liquid-filled and dry-type power, distribution and specialty electrical transformers, which are magnetic products used in the control and conditioning of electrical current for critical processes. Through an acquisition in March 2013, we expanded our product range to include certain classes of low and medium voltage switchgear and control systems. Generally, this equipment is used to distribute, monitor and control the flow of electricity, while isolating and protecting critical equipment such as transformers, motors and other machinery. We believe demand for our products will continue to increase based on the aging and overburdened power grid in North America, increasing use of on-site distributed generation and renewables and rapid expansion in critical power needs. We are headquartered in Fort Lee, New Jersey and operate from eight additional locations in the U.S., Canada and Mexico for manufacturing, centralized distribution, engineering, sales and administration.
Our largest customers are primarily located in North America and include many recognized national and regional utilities, industrial companies and engineering, procurement and construction (EPC) firms. In 2012, our two largest customers were Hydro-Quebec Utility Company and Siemens Industry, Inc., both of which have been customers of ours for more than 10 years. In addition, we sell our products to hundreds of electrical distributors served by our direct sales force, independent sales representatives and by our network of 14 independently-operated stocking locations throughout the U.S. We intend to grow our business through acquisitions and internal product development by increasing the scope of highly-engineered solutions we offer our customers for their electrical applications.
Recent Acquisitions
On March 6, 2013, our wholly-owned subsidiary, Pioneer Critical Power Inc., acquired Power Systems Solutions, Inc., a Minneapolis-based provider of paralleling switchgear, transfer switches and engine generator control systems. Common applications for these products are to ensure reliable backup power at critical locations, such as data centers and hospitals, and to operate power generation sources at remote operations not connected to the power grid. We intend to make significant new investments in this area of our electrical business, increasing our penetration into the growing markets for emergency backup power and distributed generation products.
On August 19, 2013, our wholly-owned subsidiary Pioneer Custom Electrical Products Corp., or Pioneer CEP, hired all the employees and acquired all the machinery and equipment, certain inventory assets and all of the intellectual property of Pico Electrical Equipment, Inc. and Pico Metal Products, Inc. Pioneer CEP is a manufacturer of electrical switchboards, panelboards and custom electrical enclosures operating from a 40,000 square foot facility in the Los Angeles metropolitan area. This acquisition reflects the implementation of our strategy to expand our product offerings and become a larger and more value-added supplier to our customers.
Financial Results and Guidance
In the year ended December 31, 2012, our revenue and earnings from continuing operations per share grew to $84.0 million and $0.54, respectively, as compared to revenue of $68.8 million and earnings from continuing operations per share of $0.42 in the year ended December 31, 2011. As of June 30, 2013, our order backlog was $24.4 million, up from $23.6 million as of December 31, 2012.
On September 10, 2013, we updated our previously-issued revenue guidance and increased our earnings guidance to take into account our mid-year results and to reflect the Pioneer CEP acquisition completed in August 2013. We expect that our revenue will increase to between $89 and $95 million in the year ending December 31, 2013, of which we expect $2 to $3 million to be comprised of revenue from the Pioneer Critical Power Inc. and Pioneer CEP business units we established during 2013. We expect that that our non-GAAP net earnings per diluted share will be between $0.80 and $0.86, before giving effect to this offering. Including additional shares to be outstanding after this offering, and our anticipated use of the net proceeds, we expect that our non-GAAP net earnings per diluted share will be between $0.76 and $0.82 for the year ending December 31, 2013. For an explanation of non-GAAP net earnings per diluted share, a reconciliation of GAAP net earnings to non-GAAP net earnings and a description of how management uses non-GAAP measures, please see page 30 of this prospectus. With respect to factors that could impact our expected operating results, please see “Cautionary Note Regarding Forward-Looking Statements” beginning on page 23 of this prospectus.
| 1 |
Key Trends in Our Industry
We believe that we are well positioned to capitalize on projected expenditures for power transmission and distribution related infrastructure in the North American electric grid and on capital investment by commercial and industrial companies in on-site generation assets to power their own operations. We expect to benefit from the following industry trends:
| · | Aging and Overburdened North American Power Grid — The aging and overburdened North American power grid is expected to require significant capital expenditures to upgrade the existing infrastructure over the next several years to maintain adequate levels of reliability and efficiency. According to the North American Electric Reliability Corp. (NERC), Level 5 Transmission Load Relief (TLR) events, which are triggered when power outages are imminent or in progress, grew at a 27% compounded annual growth rate from 2002 to 2012. These events demonstrate the current power grid’s inadequate capacity to accommodate all requests for reliable power. Significant capital investment will be required to relieve congestion, meet growing demand, achieve targets for efficiency, emissions and use of renewable sources and to replace components of the U.S. power grid operating at, near or past their planned service lives. |
| · | Increasing Long-Term Demand for Electricity and Reliable Power — The Department of Energy’s Energy Information Administration, or EIA, forecasts that total electricity use in the U.S. will increase by approximately 28% from 2011 to 2040. This increase is driven by anticipated population growth, economic expansion, increasing dependence on computing power throughout the economy and the increased use of electrical devices in the home. In order to meet growing demand for electricity in North America, substantial investment in increased electrical grid capacity and efficiency will be required, as well as the addition of specialized equipment to help ensure the reliability and quality of electricity for critical applications. In response to these challenges, there is an increasing trend among commercial and industrial companies to invest in on-site power sources, both for standby purposes in the event of a catastrophic power outage, or to reduce the amount of electricity they draw from the utility grid during peak periods. |
| · | Growth in Critical Power Applications and the Data Center Market — The number of mission-critical facilities, sites where a power disturbance or outage could cause failure of business operations, safety concerns or regulatory non-compliance, continues to grow exponentially worldwide. In the U.S., the single largest driver for demand in critical power applications is the data center market, followed by the health care industry. The amount of information managed by data centers is expected to grow by a factor of 50 over the next decade, according to General Electric, fueling increasing needs for data storage (for corporate data, content delivery, social networking, handheld devices, online retail and gaming) and the information technology evolution (cloud computing and outsourced hosting). The 2012 DatacenterDynamics Industry Census projects that global investment in data centers will increase 14.5% in 2013 to $120 billion. Much of this growth will be for spending in the electrical sector, including switchgear, uninterruptible power supplies and generators, systems that typically represent over 40% of data center development cost. Coinciding with demand for mission-critical facilities is the need for efficient, reliable primary power to support their essential applications, and for backup generator plants in case the utility feed becomes unavailable. Electricity is the highest operating cost of a data center, a factor supporting investment in on-site alternative energy systems to reduce base load and peak-demand utility costs. These systems require paralleling switchgear, such as we provide, operated by hardware embedded with sophisticated programming and logic to synchronize multiple power sources reliably and efficiently. |
| 2 |
| · | Greater Adoption of Renewable Power Sources — Many North American federal, state, provincial, and local governments have enacted or are considering legislation and regulations aimed at increasing energy efficiency and encouraging expansion of renewable energy generation. In particular, 29 states and the District of Columbia have adopted mandatory renewable portfolio standards, or RPS, which require utilities to supply a specified percentage of their electricity from renewable sources. In the long term, the EIA forecasts that renewable energy generation capacity additions will account for 32% of overall growth in electricity generation from 2011 to 2040. We believe these factors will drive investment growth in infrastructure to transport and integrate electricity from various sources within the transmission and distribution grid, as well as increased spending on products we manufacture for the on-site conversion and distribution of power from wind, solar and non-renewable energy plants. |
Competitive Strengths
We believe that we are well positioned for significant growth in the niche markets within the electrical transmission and distribution equipment industry in which we compete. Our competitive strengths include:
| · | Focus on Attractive Niche Markets — We focus on niche markets in the utility, industrial and commercial sectors of the electrical transmission and distribution industry that we believe are underserved by our larger competitors and have either attractive growth or profitability characteristics. Our key target markets include utility distribution, oil and gas, mining, data centers and renewable energy. Our customers in these and other markets often require equipment with specific electrical and mechanical attributes that we design and manufacture for them on an engineered-to-order basis in low quantity production runs. Most orders are time-sensitive, as other critical work is frequently being scheduled against the delivery and installation of our equipment, or because our equipment is a key sub-component of an original equipment manufacturer’s product offering to its customers. Competition in the markets we serve is very fragmented and conditioned by a number and combination of factors including application complexity, the capability to provide the range and specifications of equipment required, the diverse categories of end users, technological standards and time frames for quotation and delivery demanded by customers. |
| · | Recurring and Balanced Customer Base — We believe that our established, long-standing customer relationships provide us with a stable and recurring revenue base. We sold our products to approximately 1,900 individual customers in 2012 and our 20 largest customers represented 66% of our consolidated revenue. Approximately 89% of our revenue in 2012 originated from customers that ordered from us in 2011. We believe this customer continuity is a direct result of our uncompromising commitment to service, as evidenced by our high supplier scorecard ratings with several of our largest customers. In addition, we have developed a number of designs specifically for our customers and we have found that they are typically reluctant to switch suppliers once a favorable service track record has been established, even in cases where orders for our products are routinely released for competitive bidding. We believe that the historical growth of our product range, end-markets and revenues is due in large part to close relationships with our customers. Our strong customer relationships enable us to often anticipate our customers’ needs and collaborate with our customers to identify new, often highly-engineered applications. |
| · | Integration and Enhancement of Acquisitions — Our management team has a long track record of acquiring companies, including four businesses since 2010, and business combinations have been integral to our growth in revenue and earnings over the past three years. These recent acquisitions have and should provide us with new products and services, additional sales channels and markets, manufacturing facilities, technical expertise, purchasing economies and administrative efficiencies. We believe that our management’s ability to identify and integrate acquisitions will allow us to implement our growth plans and compete more effectively in the markets we serve. |
| · | Experienced Management Team — Our management team has extensive experience in the electrical equipment and components industry. Our senior management team includes seasoned professionals with industry, finance, transaction and operational experience that averages over 20 years per person. The prior companies owned and operated by our chief executive officer, Nathan J. Mazurek, have been focused on transformer, switchgear, circuit breaker and film capacitor products. Mr. Mazurek and his team have developed an extensive network of relationships with domestic and international companies in the electrical equipment and components industry. |
| 3 |
Growth Strategy
We believe that we have a diverse product portfolio, proven capabilities to provide customized equipment solutions and a strong presence in several key markets. We intend to grow organically and through strategic acquisitions, capitalizing on our existing competitive strengths to maximize stockholder value. The key elements of our growth strategy are:
| · | Expand Our Product and Service Offerings — We intend to expand our product and service offerings to both existing and new customers, through internal development and by acquiring new businesses. We are focused on products and end-markets that we expect should benefit from the repair and replacement cycle of an aging electric grid, rising electricity demand, the transition to renewable energy sources and investment in on-site power generation assets for backup, prime power and peak-shaving applications. In anticipation of increased volumes, we initiated expansion projects at three of our manufacturing plants in the last five years. In 2013, we established our critical power business unit to focus on opportunities in the data center market and our Pioneer CEP business unit to deepen our relationships with electrical distributors. Also in 2013, we established a new corporate sales group to market the full breadth of our product portfolio, design, engineering and manufacturing capabilities, particularly to EPC firms and large commercial contractors. We expect to continually evaluate opportunities to expand organically or through acquisitions to broaden our relationships with existing and new customers. |
| · | Focus on Operating Efficiencies — We intend to continue to efficiently manage and invest in our assets and operations. We have introduced new products from companies we acquired into our existing sales channels in order to maximize the productivity of our salespersons and distribution network. We have demonstrated our ability to integrate new production facilities into our existing operations, while maintaining or improving profitability, and intend to examine joint purchasing and production capabilities between our companies to further improve our operating results. We are focused on improving product mix, enhancing our supply chain management, optimizing the use of our available capacity and continuing to manage project costs efficiently throughout their lifecycle. For example, in 2013 we began deployment of a new ERP system and performance management information platform which we believe will support improved productivity in all business process areas and connect all of our operations, enabling us to do business internally and externally with substantially improved efficiency. |
| · | Pursue Targeted Strategic Acquisitions — We intend to accelerate our growth through a disciplined acquisition strategy to broaden and augment our product and service offerings, technical expertise, customers, end-markets and sales channels. Our strategy is to capitalize on potential market opportunities and operating efficiencies created by each business combination, thereby enhancing the performance of companies we acquire, as well as our pre-existing business operations. Our acquisitions of Jefferson Electric, Inc., Bemag Transformer Inc., Power Systems Solutions, Inc. and Pico Electrical Equipment, Inc. are four examples of our implementation of this strategy. The electrical transmission and distribution equipment market is very fragmented with a large number of potential acquisition candidates that focus on highly-specialized applications, select end-markets or more regionally defined market areas. We favor candidates that have competencies and business characteristics similar to our own, and those that we expect will benefit from some of the major trends affecting our industry. We intend to continually evaluate acquisition targets. |
Risks Associated with Our Business
Our ability to operate our business and achieve our goals and strategies is subject to numerous risks as discussed more fully in the section titled “Risk Factors,” including, without limitation:
| 4 |
| · | General economic conditions and their effect on demand for electrical equipment, particularly in the commercial construction market, but also in the power generation, industrial production, data center, oil and gas, marine and infrastructure industries. |
| · | The effects of fluctuations in sales on our business, revenues, expenses, net income, earnings per share, margins, profitability, cash flow, liquidity, financial condition and results of operations. |
| · | Many of our competitors are better established and have significantly greater resources, and may subsidize their competitive offerings with other products and services, which may make it difficult for us to attract and retain customers. |
| · | We depend on Hydro-Quebec Utility Company and Siemens Industry, Inc. for a large portion of our business, and any change in the level of orders from Hydro-Quebec Utility Company or Siemens Industry, Inc. could have a significant impact on our results of operations. |
| · | The potential loss or departure of key personnel, including Nathan J. Mazurek, our chairman, president and chief executive officer. |
| · | Our ability to expand our business through strategic acquisitions. |
| · | Our ability to integrate acquisitions and related businesses. |
| · | Our ability to generate internal growth, maintain market acceptance of our existing products and gain acceptance for our new products. |
| · | Unanticipated increases in raw material prices or disruptions in supply could increase production costs and adversely affect our profitability. |
| · | Restrictive loan covenants or our ability to repay or refinance debt under our credit facilities could limit our future financing options and liquidity position and may limit our ability to grow our business. |
| · | Our ability to realize revenue reported in our backlog. |
| · | Operating margin risk due to competitive pricing and operating efficiencies, supply chain risk, material, labor or overhead cost increases, interest rate risk and commodity risk. |
| · | Strikes or labor disputes with our employees may adversely affect our ability to conduct our business. |
| · | A majority of our revenue and a significant portion of our expenditures are derived or spent in Canadian dollars. However, we report our financial condition and results of operations in U.S. dollars. As a result, fluctuations between the U.S. dollar and the Canadian dollar will impact the amount of our revenues and earnings. |
| · | The impact of geopolitical activity on the economy, changes in government regulations such as income taxes, climate control initiatives, the timing or strength of an economic recovery in our markets and our ability to access capital markets. |
| · | Our chairman controls a majority of our combined voting power, and may have, or may develop in the future, interests that may diverge from yours. |
| · | Future sales of large blocks of our common stock may adversely impact our stock price. |
| · | The liquidity and trading volume of our common stock. |
Any of the above risks as well as others discussed herein could materially and negatively affect our business, financial condition and operating results. Investing in our common stock involves a high degree of risk. You should carefully consider the information set forth in “Risk Factors” and other information in this prospectus before making a decision to invest in our common stock.
Mr. Mazurek’s Voting Rights and Our Status as a Controlled Company
Mr. Mazurek, who after this offering will control approximately 67% of the voting power of our outstanding capital stock through his ownership interest in the general partner of Provident Pioneer Partners, L.P., will have the ability to control the outcome of matters submitted to our stockholders for approval, including the election of our directors, as well as the overall management and direction of our company.
| 5 |
Because Mr. Mazurek controls a majority of our outstanding voting power, we are a “controlled company” under the corporate governance rules for NASDAQ-listed companies. Therefore, we are not required to have a majority of our board of directors be independent, nor are we required to have a compensation committee or an independent nominating function. In light of our status as a controlled company, our board of directors has determined not to have a majority of independent directors or an independent nominating or compensation function and to have the full board of directors be directly responsible for compensation matters and for nominating members of our board.
Corporate and Other Information
Our principal executive offices are located at 400 Kelby Street, 9th Floor, Fort Lee, New Jersey, 07024. Our telephone number is (212) 867-0700. Our website address is http://www.pioneerpowersolutions.com. Information on or accessed through our website is not incorporated into this prospectus and is not a part of this prospectus.
| 6 |
| The Offering | |
| Common stock offered by us: | 1,000,000 shares
|
| Common stock outstanding prior to the offering: | 5,907,255 shares
|
| Common stock outstanding after this offering: | 6,907,255 shares
|
Offering price:
|
$7.00 to $8.00 per share (estimate) |
| Over-allotment option to be offered by us: | 150,000 shares
|
| Use of proceeds: | We estimate that our net proceeds from the sale of shares of our common stock will be approximately $6.6 million, assuming that the public offering price will be $7.50 per share, the midpoint of the range set forth on the cover page of this prospectus.
We intend to use the proceeds of this offering to pay down our outstanding borrowings under our U.S. revolving credit line with Bank of Montreal, Chicago Branch. We intend to use the remaining net proceeds, if any, and the resulting additional availability under our revolving credit line, to fund acquisitions, working capital and other general corporate purposes. See “Use of Proceeds” beginning on page 25 of this prospectus.
|
| OTCQB symbol: | PPSI
|
Proposed Nasdaq Capital Market symbol:
|
PPSI |
| Risk factors: | Investing in our common stock involves a high degree of risk. See “Risk Factors” beginning on page 10 of this prospectus. |
The number of shares of common stock outstanding after this offering excludes:
| · | 640,000 shares of common stock issuable upon the exercise of warrants with a weighted average exercise price of $14.00 per share; | |
| · | 40,000 shares of common stock issuable upon the exercise of warrants to be issued to the underwriters as underwriter compensation in this offering at an exercise price equal to the public offering price of our common stock hereunder; |
| · | 246,400 shares of common stock issuable upon the exercise of currently outstanding options with a weighted average exercise price of $9.89 per share; and |
| · | 453,600 shares of common stock available for future issuance under our 2011 Long-Term Incentive Plan. |
Unless otherwise stated, all information contained in this prospectus assumes no exercise of the over-allotment option granted to the underwriters.
| 7 |
Summary Consolidated Financial Information
(in thousands, except per share data)
The following summary consolidated financial data should be read in conjunction with the consolidated financial statements and the related notes thereto and the section entitled “Management’s Discussion and Analysis of Financial Condition and Results of Operations” included elsewhere in this prospectus. We derived the statement of operations data for the years ended December 31, 2011 and 2012, and balance sheet data as of December 31, 2011 and 2012 from the audited financial statements in this prospectus. Those financial statements were audited by Richter LLP, an independent registered public accounting firm. We derived the statement of operations data for the year ended December 31, 2010 and the balance sheet data as of December 31, 2010 from the financial statements audited by Richter LLP that are not included in this prospectus. We derived the statement of operations data for the six months ended June 30, 2013 and 2012 and the balance sheet data at June 30, 2013 from the unaudited financial statements in this prospectus. We believe that the unaudited, non-GAAP historical financial statement information contains all adjustments needed to present fairly the information included in those statements, and that the adjustments made consist only of normal recurring adjustments.
| Years Ended | Six Months Ended | |||||||||||||||||||||||
| December 31, | June 30, | |||||||||||||||||||||||
| 2010 | 2011 | 2012 | 2012 | 2013 | ||||||||||||||||||||
| Statement of Operations Data: | ||||||||||||||||||||||||
| Revenues | $ | 47,236 | $ | 68,790 | $ | 83,960 | $ | 42,137 | $ | 44,546 | ||||||||||||||
| Cost of goods sold | 35,637 | 52,813 | 65,020 | 32,783 | 33,885 | |||||||||||||||||||
| Gross profit | 11,599 | 15,977 | 18,940 | 9,354 | 10,661 | |||||||||||||||||||
| Operating expenses | ||||||||||||||||||||||||
| Selling, general and administrative | 7,635 | 11,070 | 13,181 | 6,551 | 7,052 | |||||||||||||||||||
| Foreign exchange (gain) loss | (133 | ) | 197 | (188 | ) | (86 | ) | 47 | ||||||||||||||||
| Total operating expenses | 7,502 | 11,267 | 12,993 | 6,465 | 7,099 | |||||||||||||||||||
| Operating income | 4,096 | 4,710 | 5,947 | 2,889 | 3,562 | |||||||||||||||||||
| Interest expense | 182 | 646 | 933 | 443 | 368 | |||||||||||||||||||
| Other expense | 353 | 820 | 92 | 30 | 167 | |||||||||||||||||||
| Earnings from continuing operations before income taxes | 3,561 | 3,244 | 4,922 | 2,416 | 3,027 | |||||||||||||||||||
| Provision for income taxes | 327 | 773 | 1,733 | 697 | 852 | |||||||||||||||||||
| Earnings from continuing operations | 3,234 | 2,471 | 3,189 | 1,719 | 2,175 | |||||||||||||||||||
| Loss from discontinued operations, net of income taxes | (288 | ) | (2,531 | ) | (199 | ) | (161 | ) | - | |||||||||||||||
| Net earnings (loss) | $ | 2,946 | $ | (60 | ) | $ | 2,990 | $ | 1,558 | $ | 2,175 | |||||||||||||
| Earnings from continuing operations per diluted share | $ | 0.55 | $ | 0.42 | $ | 0.54 | $ | 0.29 | $ | 0.37 | ||||||||||||||
| Weighted average diluted common shares outstanding | 5,931 | 5,949 | 5,913 | 5,907 | 5,922 | |||||||||||||||||||
| Other Data: | ||||||||||||||||||||||||
| Non-GAAP net earnings | $ | 2,945 | $ | 3,307 | $ | 4,121 | $ | 1,940 | $ | 2,495 | ||||||||||||||
| Non-GAAP net earnings per diluted common share | 0.50 | 0.56 | 0.70 | 0.33 | 0.42 | |||||||||||||||||||
| Adjusted EBITDA (Non-GAAP measure) | 5,251 | 6,050 | 7,753 | 3,751 | 4,392 | |||||||||||||||||||
| Acquisition of subsidiaries and related assets | 832 | 7,830 | - | - | 655 | |||||||||||||||||||
| Balance Sheet Data: | ||||||||||||||||||||||||
| Cash and cash equivalents | $ | 516 | $ | 1,398 | $ | 467 | $ | 150 | $ | 822 | ||||||||||||||
| Working capital | 2,558 | 4,244 | 6,883 | 4,718 | 5,775 | |||||||||||||||||||
| Total assets | 32,103 | 48,838 | 52,178 | 52,198 | 52,873 | |||||||||||||||||||
| Total debt | 6,080 | 17,885 | 17,130 | 18,352 | 16,953 | |||||||||||||||||||
| Total liabilities | 17,011 | 34,070 | 34,263 | 35,851 | 33,118 | |||||||||||||||||||
| Total shareholders’ equity | 15,092 | 14,768 | 17,915 | 16,347 | 19,755 | |||||||||||||||||||
| 8 |
Use of Non-GAAP Financial Measures
We have presented non-GAAP measures such as non-GAAP net earnings and Adjusted EBITDA because many of our investors use these non-GAAP measures to monitor our performance. These non-GAAP measures should not be considered as an alternative to GAAP measures as an indicator of our operating performance.
Non-GAAP net earnings is defined by us as net earnings before amortization of acquisition-related intangibles, stock-based compensation, non-recurring acquisition costs and reorganization expense, impairments, other unusual gains or charges and any tax effects related to these items. We define Adjusted EBITDA as net earnings before interest, income tax expense, depreciation and amortization, non-cash compensation and non-recurring acquisition costs and reorganization expenses and other non-recurring or non-cash items.
Generally, a non-GAAP financial measure is a numerical measure of a company’s performance, financial position or cash flow that either excludes or includes amounts that are not normally excluded or included in the most directly comparable measure calculated and presented in accordance with GAAP. The non-GAAP measures included below, however, should be considered in addition to, and not as a substitute for or superior to, operating income, cash flows, or other measures of financial performance prepared in accordance with GAAP. A reconciliation of non-GAAP to GAAP financial measures is set forth in the table below.
Reconciliation of GAAP Measures to Non-GAAP Measures
(In thousands, except per share data)
| Years Ended | Six Months Ended | |||||||||||||||||||
| December 31, | June 30, | |||||||||||||||||||
| 2010 | 2011 | 2012 | 2012 | 2013 | ||||||||||||||||
| Non-GAAP Net Earnings and Diluted EPS: | ||||||||||||||||||||
| Earnings per share from continuing operations (GAAP measure) | $ | 0.55 | $ | 0.42 | $ | 0.54 | $ | 0.29 | $ | 0.37 | ||||||||||
| Earnings from continuing operations (GAAP measure) | $ | 3,234 | $ | 2,471 | $ | 3,189 | $ | 1,719 | $ | 2,175 | ||||||||||
| Amortization of acquisition intangibles | 144 | 252 | 285 | 143 | 142 | |||||||||||||||
| Stock-based compensation expense | 161 | 254 | 270 | 133 | 108 | |||||||||||||||
| Stock and warrant issuance expense for services | 232 | - | - | - | - | |||||||||||||||
| Non-recurring acquisition and reorganization costs | 353 | 334 | 55 | 32 | 169 | |||||||||||||||
| (Gain) on sale of assets | - | - | (8 | ) | (2 | ) | (2 | ) | ||||||||||||
| Withdrawn financing transaction costs | - | 487 | 45 | - | - | |||||||||||||||
| Non-recurring tax (recoveries) non-cash charges, net | (831 | ) | (26 | ) | 411 | - | - | |||||||||||||
| Tax effects | (347 | ) | (464 | ) | (126 | ) | (85 | ) | (97 | ) | ||||||||||
| Non-GAAP net earnings | $ | 2,945 | $ | 3,307 | $ | 4,121 | $ | 1,940 | $ | 2,495 | ||||||||||
| Non-GAAP net earnings per diluted share | $ | 0.50 | $ | 0.56 | $ | 0.70 | $ | 0.33 | $ | 0.42 | ||||||||||
| Weighted average diluted shares outstanding | 5,931 | 5,949 | 5,913 | 5,907 | 5,922 | |||||||||||||||
| Reconciliation to Adjusted EBITDA: | ||||||||||||||||||||
| Earnings from continuing operations (GAAP measure) | $ | 3,234 | $ | 2,471 | $ | 3,189 | $ | 1,719 | $ | 2,175 | ||||||||||
| Interest expense | 182 | 646 | 933 | 443 | 368 | |||||||||||||||
| Provision for income taxes | 327 | 773 | 1,733 | 697 | 852 | |||||||||||||||
| Depreciation and amortization | 763 | 1,086 | 1,536 | 730 | 722 | |||||||||||||||
| Non-recurring acquisition and reorganization costs | 353 | 334 | 55 | 32 | 169 | |||||||||||||||
| (Gain) on sale of assets | - | - | (8 | ) | (2 | ) | (2 | ) | ||||||||||||
| Withdrawn financing transaction costs | - | 487 | 45 | - | - | |||||||||||||||
| EBITDA | 4,859 | 5,797 | 7,483 | 3,618 | 4,284 | |||||||||||||||
| Adjustments to EBITDA: | ||||||||||||||||||||
| Stock-based compensation expense | 161 | 254 | 270 | 133 | 108 | |||||||||||||||
| Stock and warrant issuance expense for services | 232 | - | - | - | - | |||||||||||||||
| Adjusted EBITDA (Non-GAAP measure) | $ | 5,251 | $ | 6,050 | $ | 7,753 | $ | 3,751 | $ | 4,392 | ||||||||||
Note: Amounts may not foot due to rounding
| 9 |
Investing in our common stock involves a high degree of risk. Before investing in our common stock you should carefully consider the following risks, together with the financial and other information contained in this prospectus. Additional risks and uncertainties that we are unaware of may become important factors that affect us. If any of the following events occur, our business, financial conditions and operating results may be materially and adversely affected. In that event, the trading price of our common stock may decline, and you could lose all or part of your investment.
Risks Relating to Our Business and Industry
We are vulnerable to economic downturns in the commercial construction market, which may reduce the demand for some of our products and adversely affect our sales, earnings, cash flow or financial condition.
Portions of our business, in particular those of Jefferson Electric, Inc. and Bemag Transformer Inc., involve sales of our products in connection with commercial and industrial construction. Our sales to this sector are affected by the levels of discretionary business spending. During economic downturns in this sector, the levels of business discretionary spending may decrease. This decrease in spending will likely reduce the demand for some of our products and may adversely affect our sales, earnings, cash flow or financial condition.
The commercial and industrial building and maintenance sectors began to experience a significant decline in 2008. The downturn in these segments contributed to a decline in the demand for our standard distribution transformer products and adversely affected Jefferson Electric, Inc.’s sales and earnings in 2008 through 2010. We cannot predict the timing, duration or severity of another such downturn in these segments which may adversely impact sales, earnings and cash flow.
Our operating results may vary significantly from quarter to quarter, which makes our operating results difficult to predict and can cause our operating results in any particular period to be less than comparable quarters and expectations from time to time.
Our quarterly results may fluctuate significantly from quarter to quarter due to a variety of factors, many of which are outside our control and have the potential to materially and adversely affect our results. Factors that affect our operating results include the following:
| · | the size, timing and terms of sales and orders, especially large customer orders; |
| · | variations caused by customers delaying, deferring or canceling purchase orders or making smaller purchases than expected; |
| · | the timing and volume of work under new agreements; |
| · | the spending patterns of customers; |
| · | customer orders received; |
| · | a change in the mix of our products having different margins; |
| · | a change in the mix of our customers, contracts and business; |
| · | increases in design and manufacturing costs; |
| · | the length of our sales cycles; |
| · | the rates at which customers renew their contracts with us; |
| · | changes in pricing by us or our competitors, or the need to provide discounts to win business; |
| · | a change in the demand or production of our products caused by severe weather conditions; |
| · | our ability to control costs, including operating expenses; |
| · | losses experienced in our operations not otherwise covered by insurance; |
| · | the ability and willingness of customers to pay amounts owed to us; |
| · | the timing of significant investments in the growth of our business, as the revenue and profit we hope to generate from those expenses may lag behind the timing of expenditures; |
| · | costs related to the acquisition and integration of companies or assets; |
| · | general economic trends, including changes in equipment spending or national or geopolitical events such as economic crises, wars or incidents of terrorism; and |
| 10 |
| · | future accounting pronouncements and changes in accounting policies. |
Accordingly, our operating results in any particular quarter may not be indicative of the results that you can expect for any other quarter or for an entire year.
Our industry is highly competitive.
The electrical transmission and distribution equipment industry is highly competitive. Principal competitors in our markets include ABB Ltd., Carte International, Inc., Eaton Corporation plc, Emerson Electric Company, General Electric Company, Hammond Power Solutions Inc., Howard Industries, Inc., Partner Technologies, Inc., Russelectric, Inc. and Schneider Electric SA. Many of these competitors, as well as other companies in the broader electrical equipment manufacturing and service industry where we expect to compete, are significantly larger and have substantially greater resources than we do and are able to achieve greater economies of scale and lower cost structures than us and may, therefore, be able to provide their products and services to customers at lower prices than we are able to. Moreover, our competitors could develop the expertise, experience and resources to offer products that are superior in both price and quality to our products. While we seek to compete by providing more customized, highly-engineered products, there are few technical or other barriers to prevent much larger companies in our industry from putting more emphasis on this same strategy. Similarly, we cannot be certain that we will be able to market our business effectively in the face of competition or to maintain or enhance our competitive position within our industry, maintain our customer base at current levels or increase our customer base. Our inability to manage our business in light of the competitive forces we face could have a material adverse effect on our results of operations.
Because we currently derive a significant portion of our revenues from two customers, any decrease in orders from these customers could have an adverse effect on our business, financial condition and operating results.
We depend on Hydro-Quebec Utility Company and Siemens Industry, Inc. for a large portion of our business, and any change in the level of orders from Hydro-Quebec Utility Company or Siemens Industry, Inc., has, in the past, had a significant impact on our results of operations. In particular, Hydro-Quebec Utility Company represented approximately 19% and 21% of our net sales in the years ended December 31, 2012 and 2011, respectively. In addition, Siemens Industry, Inc. accounted for 12% and 11% of our net sales in the years ended December 31, 2012 and 2011, respectively. Our long term supply agreements with Hydro-Quebec Utility Company had an initial term expiring in April 2012, and two one-year extension options, the second of which was exercised by Hydro-Quebec Utility Company and which extended our contracts through April 2014. We therefore cannot assure you that Hydro-Quebec Utility Company will continue to purchase transformers from us in quantities consistent with the past or at all. In addition, our pricing agreement with Siemens Industry, Inc. does not obligate Siemens Industry, Inc. to purchase transformers from us in quantities consistent with the past or at all. If either of these customers was to significantly cancel, delay or reduce the amount of business it does with us for any reason, there would be a material adverse effect on our business, financial condition and operating results.
The departure or loss of key personnel could disrupt our business.
We depend heavily on the continued efforts of Nathan J. Mazurek, our principal executive officer, and on other senior officers who are responsible for the day-to-day management of our operations. In addition, we rely on our current electrical and mechanical design engineers, along with trained coil winders, many of whom are important to our operations and would be difficult to replace. We cannot be certain that any of these individuals will continue in their respective capacities for any particular period of time. The departure or loss of key personnel, or the inability to hire and retain qualified employees, could negatively impact our ability to manage our business.
| 11 |
We may not be able to expand our business through strategic acquisitions, which could decrease our profitability.
A key element of our strategy is to pursue strategic acquisitions that either expand or complement our business in order to increase revenue and earnings. We may not be able to identify additional attractive acquisition candidates on terms favorable to us or in a timely manner. We may require additional debt or equity financing for future acquisitions, which may not be available on terms favorable to us, if at all. Moreover, we may not be able to integrate any acquired businesses into our business or to operate any acquired businesses profitably. Recently acquired businesses (such as Power Systems Solutions, Inc. and Pioneer CEP) may operate at lower profit margins, which could negatively impact our results of operations. Each of these factors may contribute to our inability to grow our business through strategic acquisitions, which could ultimately result in increased costs without a corresponding increase in revenues, causing decreased profitability.
Any acquisitions that we complete may not perform as planned and could disrupt our business and harm our financial condition and operations.
In an effort to effectively compete in the specialty electrical equipment manufacturing and service businesses, where increasing competition and industry consolidation prevail, we will seek to acquire complementary businesses in the future. In the event of any future acquisitions, we could:
| · | issue additional securities that would dilute our current stockholders’ percentage ownership or provide the purchasers of the additional securities with certain preferences over those of common stockholders, such as dividend or liquidation preferences; |
| · | incur debt and assume liabilities; and |
| · | incur large and immediate write-offs of intangible assets, accounts receivable or other assets. |
These events could result in significant expenses and decreased revenue, which could adversely affect the market price of our common stock.
In addition, integrating product acquisitions and completing any future acquisitions involve numerous operational and financial risks. These risks include difficulty in assimilating acquired operations, diversion of management’s attention and the potential loss of key employees or customers of acquired operations. Furthermore, companies acquired by us may not generate financial results consistent with our management’s plans at the time of acquisition. To this end, through transactions completed in June and August 2010, we acquired substantially all the assets and the capital stock of AAER Inc. to form Pioneer Wind Energy Systems Inc., a business that sought to provide project integration solutions, including equipment sales, procurement, after-sales services and financing to community wind and industrial customers. In September 2011, following weak domestic wind energy market conditions, combined with our inability to establish an arrangement, on commercially acceptable terms, with a qualified third party to provide outsourced parts procurement and assembly services, we decided to discontinue this business. On a cumulative basis, from formation through to the discontinuation of Pioneer Wind Energy Systems Inc., our results from operations were impacted by a cumulative net loss of $3.0 million.
If we do not conduct an adequate due diligence investigation of a target business that we acquire, we may be required subsequently to take write downs or write-offs, restructuring and impairment or other charges that could have a significant negative effect on our financial condition, results of operations and our stock price, which could cause you to lose some or all of your investment.
As part of our acquisition strategy, we will need to conduct a due diligence investigation of one or more target businesses. Intensive due diligence is time consuming and expensive due to the operations, accounting, finance and legal professionals who must be involved in the due diligence process. We may have limited time to conduct such due diligence. Even if we conduct extensive due diligence on a target business that we acquire, we cannot assure you that this diligence will uncover all material issues relating to a particular target business, or that factors outside of the target business and outside of our control will not later arise. If our diligence fails to identify issues specific to a target business or the environment in which the target business operates, we may be forced to write-down or write-off assets, restructure our operations, or incur impairment or other charges that could result in us reporting losses. Even though these charges may be non-cash items and not have an immediate impact on our liquidity, the fact that we report charges of this nature could contribute to negative market perceptions about us or our common stock. In addition, charges of this nature may cause us to violate net worth or other covenants that we may be subject to under our credit facilities.
| 12 |
Our revenue may be adversely affected by fluctuations in currency exchange rates.
A majority of our revenue and a significant portion of our expenditures are derived or spent in Canadian dollars. However, we report our financial condition and results of operations in U.S. dollars. As a result, fluctuations between the U.S. dollar and the Canadian dollar will impact the amount of our revenues and earnings. For example, if the Canadian dollar appreciates relative to the U.S. dollar, the fluctuation will result in a positive impact on the revenues that we report. However, if the Canadian dollar depreciates relative to the U.S. dollar, there will be a negative impact on the revenues we report due to such fluctuation. It is possible that the impact of currency fluctuations will result in a decrease in reported sales even though we have experienced an increase in sales when reported in the Canadian dollar. Conversely, the impact of currency fluctuations may result in an increase in reported sales despite declining sales when reported in the Canadian dollar. The exchange rate from the U.S. dollar to the Canadian dollar has fluctuated substantially in the past and may continue to do so in the future. Though we may choose to hedge our exposure to foreign currency exchange rate changes in the future, there is no guarantee such hedging, if undertaken, will be successful.
We may be unable to generate internal growth.
Our ability to generate internal growth will be affected by, among other factors, our ability to attract new customers, increases or decreases in the number or size of orders received from existing customers, hiring and retaining skilled employees and increasing volume utilizing our existing facilities. Many of the factors affecting our ability to generate internal growth may be beyond our control, and we cannot be certain that our strategies will be implemented with positive results or that we will be able to generate cash flow sufficient to fund our operations and to support internal growth. If we do not achieve internal growth, our results of operations will suffer and we will likely not be able to expand our operations or grow our business.
Fluctuations in the price and supply of raw materials used to manufacture our products may reduce our profits.
Our raw material costs represented approximately 64% and 60% of our revenues for the years ended December 31, 2012 and 2011, respectively. The principal raw materials purchased by us are electrical core steel, copper wire, aluminum strip and insulating materials including transformer oil. We also purchase certain electrical components from a variety of suppliers including bushings, switches, fuses and protectors. These raw materials and components are available from, and supplied by, numerous sources at competitive prices, although there are more limited sources of supply for electrical core steel and transformer oil. Unanticipated increases in raw material prices or disruptions in supply could increase production costs and adversely affect our profitability. We cannot provide any assurances that we will not experience difficulties sourcing our raw materials in the future.
Our Bemag Transformer Inc. subsidiary currently derives a significant portion of its revenues from three electrical distributor groups; any decrease in orders from these distributors could have an adverse effect on Bemag Transformer Inc.’s financial condition and operating results.
Bemag Transformer Inc. depends on three electrical distributor groups for a large portion of its business, and any change in the level of orders from these distributors, has, in the past, had a significant impact on Bemag Transformer Inc.’s results of operations. Collectively, purchases from these distributor groups represented approximately 50% of Bemag Transformer Inc.’s sales in 2012 and approximately 9% of our sales on a consolidated basis. We expect aggregate sales to these distributor groups to continue to represent less than 10% of our consolidated sales in 2013. Our Bemag Transformer Inc. subsidiary has pricing and rebate agreements with these distributor groups that are negotiated annually and, if the pricing and rebate agreements are modified or not renewed in future periods or are less favorable than those offered by competitors, we cannot assure you that these distributor groups will continue to purchase transformers from us in quantities consistent with the past or at all. If any of these distributor groups were to influence our customers to cancel, significantly delay or reduce the amount of business they do with Bemag Transformer Inc., there could be a material adverse effect on our business, financial condition and operating results. Moreover, although Bemag Transformer Inc. has agreements for the sale of its products through these three distributor groups, these agreements do not obligate the groups to distribute transformers from Bemag Transformer Inc. in quantities consistent with the past or at all. If any of these distributor groups were to become insolvent, our business, financial condition and operating results could also be materially adversely affected.
| 13 |
We have, and expect to continue to have, credit facilities with restrictive loan covenants that may impact our ability to operate our business and to pursue our business strategies, and our failure to comply with these covenants could result in an acceleration of our indebtedness.
While we expect to use the proceeds from this offering to pay down our outstanding borrowings under our revolving credit line with the Bank of Montreal, Chicago Branch, we expect to rely on our credit facilities for a significant portion of the working capital to operate our business and execute our strategy. These credit facilities contain certain covenants that restrict our ability to, among other things:
| · | undergo a change in control; |
| · | incur new indebtedness or other obligations, subject to certain exceptions; |
| · | pay cash dividends; |
| · | create or incur new liens, subject to certain exceptions; |
| · | make new acquisitions or investments in other entities, subject to certain exceptions; |
| · | wind up, liquidate or dissolve our affairs; |
| · | change the nature of our core business; |
| · | alter our capital structure in a manner that would be materially adverse to our lenders; and |
| · | make investments or advancements to affiliated or related companies. |
The majority of the liquidity derived from our credit facilities is based on availability determined by a borrowing base. Specifically, the availability of credit is dependent upon eligible receivables, inventory and certain liens. We may not be able to maintain adequate levels of eligible assets to support our required liquidity.
In addition, our credit facilities require us to meet certain financial ratios, including a total leverage ratio, a funded debt to total capitalization ratio and a fixed charge coverage ratio and, in the case of our Canadian domiciled subsidiaries, maintenance of a minimum fixed charge coverage ratio, a maximum funded debt to EBITDA ratio and a maximum total debt to capitalization ratio. Our ability to meet these financial provisions may be affected by events beyond our control. If, as or when required, we are unable to repay, refinance or restructure our indebtedness under, or amend the covenants contained in, our credit facilities, our lenders could institute foreclosure proceedings against the assets securing borrowings under those facilities, which would harm our business, financial condition and results of operations.
The indebtedness under our credit facilities with Bank of Montreal is secured by substantially all of our consolidated assets. As a result of these security interests, such assets would only be available to satisfy claims of our general creditors or to holders of our equity securities if we were to become insolvent to the extent the value of such assets exceeded the amount of our indebtedness and other obligations. In addition, the existence of these security interests may adversely affect our financial flexibility.
Indebtedness under our credit facilities with Bank of Montreal is secured by a lien on substantially all of our assets. Accordingly, if an event of default were to occur under our credit facilities, Bank of Montreal would have a prior right to our assets, to the exclusion of our general creditors in the event of our bankruptcy, insolvency, liquidation, or reorganization. In that event, our assets would first be used to repay in full all indebtedness and other obligations secured by them (including all amounts outstanding under our senior secured credit agreement), resulting in all or a portion of our assets being unavailable to satisfy the claims of our unsecured indebtedness. Only after satisfying the claims of our unsecured creditors and our subsidiaries’ unsecured creditors would any amount be available for our equity holders. The pledge of these assets and other restrictions may limit our flexibility in raising capital for other purposes. Because substantially all of our assets are pledged under these financing arrangements, our ability to incur additional secured indebtedness or to sell or dispose of assets to raise capital may be impaired, which could have an adverse effect on our financial flexibility.
We may not be able to fully realize the revenue value reported in our backlog.
We routinely have a backlog of work to be completed on contracts representing a significant portion of our annual sales. As of June 30, 2013, our order backlog was $24.4 million. Orders included in our backlog are represented by customer purchase orders and contracts that we believe to be firm. Backlog develops as a result of new business taken, which represents the revenue value of new customer orders received by us during a given period. Backlog consists of customer orders that either (1) have not yet been started or (2) are in progress and are not yet completed. In the latter case, the revenue value reported in backlog is the remaining value associated with work that has not yet been completed. From time to time, customer orders are canceled that appeared to have a high certainty of going forward at the time they were recorded as new business taken. In the event of a customer order cancellation, we may be reimbursed for certain costs but typically have no contractual right to most of the revenue reflected in our backlog. In addition to us being unable to recover certain direct costs, canceled customer orders may also result in additional unrecoverable costs due to the resulting underutilization of our assets.
We are subject to pricing pressure from our larger customers.
We face significant pricing pressures in all of our business segments from our larger customers, including Hydro-Quebec Utility Company and Siemens Industry, Inc. Because of their purchasing size, our larger customers can influence market participants to compete on price terms. Such customers also use their buying power to negotiate lower prices. If we are not able to offset pricing reductions resulting from these pressures by improved operating efficiencies and reduced expenditures, those price reductions may have an adverse impact on our financial results.
| 14 |
Deterioration in the credit quality of several major customers could have a material adverse effect on our operating results and financial condition.
A significant asset included in our working capital is accounts receivable from customers. If customers responsible for a significant amount of accounts receivable become insolvent or are otherwise unable to pay for products and services, or become unwilling or unable to make payments in a timely manner, our operating results and financial condition could be adversely affected. A significant deterioration in the economy could have an adverse effect on the servicing of these accounts receivable, which could result in longer payment cycles, increased collection costs and defaults in excess of management’s expectations. Deterioration in the credit quality of Hydro-Quebec Utility Company, Siemens Industry, Inc. or of any other major customers could have a material adverse effect on our operating results and financial condition.
We rely on third parties for key elements of our business whose operations are outside our control.
We rely on arrangements with third party shippers and carriers such as independent shipping companies for timely delivery of our products to our customers. As a result, we may be subject to carrier disruptions and increased costs due to factors that are beyond our control, including labor strikes, inclement weather, natural disasters and rapidly increasing fuel costs. If the services of any of these third parties become unsatisfactory, we may experience delays in meeting our customers’ product demands and we may not be able to find a suitable replacement on a timely basis or on commercially reasonable terms. Any failure to deliver products to our customers in a timely and accurate manner may damage our reputation and could cause us to lose customers.
We also utilize third party distributors and manufacturer’s representatives to sell, install and service certain of our products. While we are selective in whom we choose to represent us, it is difficult for us to ensure that our distributors and manufacturer’s representatives consistently act in accordance with the standards we set for them. To the extent any of our end-customers have negative experiences with any of our distributors or manufacturer’s representatives, it could reflect poorly on us and damage our reputation, thereby negatively impacting our financial results.
We may face impairment charges if economic environments in which our business operates and key economic and business assumptions substantially change.
Assessment of the potential impairment of property, plant and equipment, goodwill and other identifiable intangible assets is an integral part of our normal ongoing review of operations. Testing for potential impairment of long-lived assets is dependent on numerous assumptions and reflects our best estimates at a particular point in time, which may vary from testing date to testing date. The economic environments in which our businesses operate and key economic and business assumptions with respect to projected product selling prices and materials costs, market growth and inflation rates, can significantly affect the outcome of impairment tests. Estimates based on these assumptions may differ significantly from actual results. Changes in factors and assumptions used in assessing potential impairments can have a significant impact on both the existence and magnitude of impairments, as well as the time at which such impairments are recognized. Future changes in the economic environment and the economic outlook for the assets being evaluated could also result in additional impairment charges. Any significant asset impairments would adversely impact our financial results.
Our business requires skilled labor, and we may be unable to attract and retain qualified employees.
Our ability to maintain our productivity and profitability will be limited by our ability to employ, train and retain skilled personnel necessary to meet our requirements. We may experience shortages of qualified personnel. We cannot be certain that we will be able to maintain an adequate skilled labor force necessary to operate efficiently and to support our growth strategy or that our labor expenses will not increase as a result of a shortage in the supply of skilled personnel. Labor shortages, increased labor costs or loss of our most skilled workers could impair our ability to deliver on time to our customers (thereby creating a risk that we lose our customers to competition) and would inhibit our ability to maintain our business or grow our revenues, and may adversely impact our profitability.
| 15 |
Our business operations are dependent upon our ability to engage in successful collective bargaining with our unionized workforce.
Approximately 69% of our workforce is unionized. Our current collective bargaining agreements with our unionized workforces in Canada expire in May 2015, in the case of Pioneer Transformers Ltd., and in the case of Bemag Transformer Inc., expired in March 2013. We are in the process of negotiating a new collective bargaining agreement with our unionized workforce at Bemag Transformer Inc. which may take several months to complete. There can be no assurance we will be successful in this effort. We have similar labor agreements with our unionized workforce in Santa Fe springs, California and in Reynosa, Mexico that have indefinite terms, and are subject to annual review and negotiation of key provisions. If we are unable to renew our collective bargaining agreements, or if additional segments of our workforce become unionized, we may be subject to work interruptions or stoppages. Strikes or labor disputes with our employees may adversely affect our ability to conduct our business.
Deploying a new enterprise resource planning system could interfere with our business or operations and could adversely impact our financial position, results of operations and cash flows.
We are in the process of deploying a new enterprise resource planning, or ERP, system. This project requires significant investment of capital and human resources, the re-engineering of many processes of our business and the attention of many employees who would otherwise be focused on other aspects of our business. Any disruptions, delays or deficiencies in the design and integration of the new ERP system could result in potentially much higher costs than we had anticipated and could adversely affect our ability to develop and commercialize products, provide services, fulfill contractual obligations, file reports with the Securities Exchange Commission in a timely manner and/or otherwise operate our business, or otherwise impact our controls environment. Any of these consequences could have an adverse effect on our results of operations and financial condition.
We are subject to the risks of owning real property.
We own real property, including the land and buildings at two of our manufacturing locations. The ownership of real property subjects us to risks, including: the possibility of environmental contamination and the costs associated with fixing any environmental problems and the risk of damages resulting from such contamination; adverse changes in the value of the property due to interest rate changes, changes in the neighborhood in which the property is located or other factors; ongoing maintenance expenses and costs of improvements; the possible need for structural improvements in order to comply with zoning, seismic, disability act or other requirements; and possible disputes with neighboring owners or others.
Our risk management activities may leave us exposed to unidentified or unanticipated risks.
Although we maintain insurance policies for our business, these policies contain deductibles and limits of coverage. We estimate our liabilities for known claims and unpaid claims and expenses based on information available as well as projections for claims incurred but not reported. However, insurance liabilities are difficult to estimate due to various factors and we may be unable to effectively anticipate or measure potential risks to our company. If we suffer unexpected or uncovered losses, any of our insurance policies or programs are terminated for any reason or are not effective in mitigating our risks, we may incur losses that are not covered by our insurance policies or that exceed our accruals or that exceed our coverage limits and could adversely impact our consolidated results of operations, cash flows and financial position.
Regulatory, environmental, monetary and other governmental policies could have a material adverse effect on our profitability.
We are subject to international, federal, provincial, state and local laws and regulations governing environmental matters, including emissions to air, discharge to waters and the generation and handling of waste. We are also subject to laws relating to occupational health and safety. The operation of manufacturing plants involves a high level of susceptibility in these areas, and there is no assurance that we will not incur material environmental or occupational health and safety liabilities in the future. Moreover, expectations of remediation expenses could be affected by, and potentially significant expenditures could be required to comply with, environmental regulations and health and safety laws that may be adopted or imposed in the future. Future remediation technology advances could adversely impact expectations of remediation expenses.
| 16 |
Future litigation could impact our financial results and condition.
Our business, results of operations and financial condition could be affected by significant future litigation or claims adverse to us. Types of potential litigation cases include product liability, contract, employment-related, labor relations, personal injury or property damage, intellectual property, stockholder claims and claims arising from any injury or damage to persons, property or the environment from hazardous substances used, generated or disposed of in the conduct of our business.
Our international operations subject us to additional risks, which risks and costs may differ in each country in which we do business and may cause our profitability to decline.
Most of our products are manufactured at our facilities in Canada and Mexico, and we depend on a number of suppliers for raw materials and component parts that are located outside of the U.S., including Asia and Western Europe. We generate a significant portion of our revenue from our operations in Canada and currently derive most of our revenue in the U.S. from products we manufacture in Mexico. Our international operations are subject to a variety of risks that we do not face in the U.S., and that we may face only to a limited degree in Canada, including:
| · | building and managing highly experienced foreign workforces and overseeing and ensuring the performance of foreign subcontractors; |
| · | increased travel, infrastructure and legal and compliance costs associated with multiple international locations; |
| · | additional withholding taxes or other taxes on our foreign income, and tariffs or other restrictions on foreign trade or investment; |
| · | imposition of, or unexpected adverse changes in, foreign laws or regulatory requirements, many of which differ from those in the U.S.; |
| · | changes in foreign currency exchange rates, principally fluctuations in the Canadian dollar and Mexican peso; |
| · | longer payment cycles for sales in some foreign countries and potential difficulties in enforcing contracts and collecting accounts receivable; |
| · | difficulties in repatriating overseas earnings; |
| · | general economic conditions in the countries in which we operate; and |
| · | political unrest, civil disturbances, corruption, crime, war, incidents of terrorism, or responses to such events. |
We may be unable to maintain policies and strategies that will be effective in managing these risks in each country where we do business. Our failure to manage these risks could cause us to fail to reap our investments in these markets and could harm our international operations, reduce our international sales and increase our costs, thus adversely affecting our international and overall business, financial condition and operating results.
Market disruptions caused by domestic or international financial crises could affect our ability to meet our liquidity needs at a reasonable cost and our ability to meet long-term commitments, which could adversely affect our financial condition and results of operations.
We rely on credit facilities with our lenders, amongst other avenues, to satisfy our liquidity needs. Disruptions in the domestic or international credit markets or deterioration of the banking industry’s financial condition (such as occurred beginning in 2008), may discourage or prevent our lenders and other lenders from meeting their existing lending commitments, extending the terms of such commitments or agreeing to new commitments, such as for acquisitions or to refinance existing credit facilities. Market disruptions may also limit our ability to issue debt securities in the capital markets. We can provide no assurances that our lenders or any other lenders we may have will meet their existing commitments or that we will be able to access the credit markets in the future on terms acceptable to us or at all.
| 17 |
Longer term disruptions in the domestic or international capital and credit markets as a result of uncertainty, reduced financing alternatives or failures of significant financial institutions could adversely affect our access to the liquidity needed for our business. Any disruption could require us to take measures to conserve cash until the market stabilizes or until alternative financing can be arranged. Such measures could include deferring capital expenditures and reducing other discretionary expenditures. Market disruptions could cause a broad economic downturn that may lead to increased incidence of customers’ failure to pay for services delivered, which could adversely affect our financial condition, results of operations and cash flow.
Capital market disruptions could result in increased costs related to variable rate debt. As a result, continuation of market disruptions could increase our interest expense and adversely impact our results of operations. Disruption in the capital markets and its actual or perceived effects on particular businesses and the greater economy also adversely affects the value of the investments held within our pension plans. Significant declines in the value of the investments held within our pension plans may require us to increase contributions to those plans in order to meet future funding requirements if the actual asset returns do not recover these declines in value in the foreseeable future. These trends may also adversely impact our results of operations, net cash flows and financial positions, including our stockholders’ equity.
Risks Relating to Our Organization
We have elected to take advantage of the “controlled company” exemption to the corporate governance rules for NASDAQ-listed companies, which could make our common stock less attractive to some investors or otherwise harm our stock price.
Because we qualify as a “controlled company” under the corporate governance rules for NASDAQ-listed companies, we are not required to have a majority of our board of directors be independent, nor are we required to have a compensation committee or an independent nominating function. In light of our status as a controlled company, our board of directors has determined not to have a majority of independent directors or an independent nominating or compensation committee and to have the full board of directors be directly responsible for compensation matters and for nominating members of our board. Accordingly, should the interests of our controlling stockholder differ from those of other stockholders, the other stockholders may not have the same protections afforded to stockholders of companies that are subject to all the corporate governance rules for NASDAQ-listed companies. Our status as a controlled company could make our common stock less attractive to some investors or otherwise harm our stock price.
Delaware law and our corporate charter and bylaws contain anti-takeover provisions that could delay or discourage takeover attempts that stockholders may consider favorable.
Our board of directors is authorized to issue shares of preferred stock in one or more series and to fix the voting powers, preferences and other rights and limitations of the preferred stock. Accordingly, we may issue shares of preferred stock with a preference over our common stock with respect to dividends or distributions on liquidation or dissolution, or that may otherwise adversely affect the voting or other rights of the holders of common stock. Issuances of preferred stock, depending upon the rights, preferences and designations of the preferred stock, may have the effect of delaying, deterring or preventing a change of control, even if that change of control might benefit our stockholders. In addition, we are subject to Section 203 of the Delaware General Corporation Law. Section 203 generally prohibits a public Delaware corporation from engaging in a “business combination” with an “interested stockholder” for a period of three years after the date of the transaction in which the person became an interested stockholder, unless (i) prior to the date of the transaction, the board of directors of the corporation approved either the business combination or the transaction which resulted in the stockholder becoming an interested stockholder; (ii) the interested stockholder owned at least 85% of the voting stock of the corporation outstanding at the time the transaction commenced, excluding for purposes of determining the number of shares outstanding (a) shares owned by persons who are directors and also officers and (b) shares owned by employee stock plans in which employee participants do not have the right to determine confidentially whether shares held subject to the plan will be tendered in a tender or exchange offer; or (iii) on or subsequent to the date of the transaction, the business combination is approved by the board and authorized at an annual or special meeting of stockholders, and not by written consent, by the affirmative vote of at least 66 2/3% of the outstanding voting stock which is not owned by the interested stockholder.
| 18 |
Section 203 could delay or prohibit mergers or other takeover or change in control attempts with respect to us and, accordingly, may discourage attempts to acquire us even though such a transaction may offer our stockholders the opportunity to sell their stock at a price above the prevailing market price.
Your ability to influence corporate decisions may be limited because Provident Pioneer Partners, L.P. owns a controlling percentage of our common stock.
Provident Pioneer Partners, L.P., which is controlled by Nathan J. Mazurek, our chief executive officer, president and chairman of the board of directors, will beneficially own approximately 67.0% of our outstanding common stock after this offering. As a result of this stock ownership, Provident Pioneer Partners, L.P. and Mr. Mazurek can control all matters submitted to our stockholders for approval, including the election of directors and approval of any merger, consolidation or sale of all or substantially all of our assets. This concentration of voting power could delay or prevent an acquisition of our company on terms that other stockholders may desire. In addition, as the interests of Provident Pioneer Partners, L.P. and our minority stockholders may not always be the same, this large concentration of voting power may lead to stockholder votes that are inconsistent with the best interests of our minority stockholders or the best interest of us as a whole.
Furthermore, pursuant to the terms of our credit agreement with Bank of Montreal, Chicago Branch, we are restricted from, among other things, entering into merger agreements or agreements for the sale of any or all of our assets. As such, even if certain corporate transactions may be approved by our stockholders, Bank of Montreal, Chicago Branch, as the lender under our credit agreement, has final authority to approve or reject certain of our transactions. This could lead to us not being able to effect certain transactions that may be in the best interests of our stockholders or our business.
We are subject to financial reporting and other requirements for which our accounting, internal audit and other management systems and resources may not be adequately prepared.
We are subject to reporting and other obligations under the Securities Exchange Act of 1934, as amended, including the requirements of Section 404 of the Sarbanes-Oxley Act. Section 404 requires us to conduct an annual management assessment of the effectiveness of our internal controls over financial reporting. These reporting and other obligations place significant demands on our management, administrative, operational, internal audit and accounting resources. Any failure to maintain effective internal controls could have a material adverse effect on our business, operating results and stock price.
In addition, our internal controls will also include those of any company or business that we may acquire in the future. Acquired companies or businesses are likely to have different standards, controls, contracts, procedures and policies, making it more difficult to implement and harmonize company-wide financial, accounting, information and other systems. As a result, our internal controls may become more complex and we may require significantly more resources to ensure they remain effective. Failure to implement required new or improved controls, or difficulties encountered in their implementation, either in our existing business or in businesses that we may acquire, could harm our operating results or cause us to fail to meet our reporting obligations.
Risks Relating to this Offering and our Common Stock
Purchasers in this offering will experience immediate and substantial dilution in the book value of their investment.
The public offering price of our common stock will be substantially higher than the net tangible book value per share of our common stock immediately after this offering. Therefore, if you purchase our common stock in this offering, you will incur an immediate dilution of $5.57 (or 74%) in net tangible book value per share from the price you paid, based on the public offering price of $7.50 per share. In addition, the exercise of in-the-money outstanding stock options and warrants may result in further dilution of your investment. In addition, if we raise funds by issuing additional shares or convertible securities in the future, the newly issued shares may further dilute your ownership interest.
| 19 |
We may apply the proceeds of this offering to uses that ultimately do not improve our operating results or increase the value of your investment.
We intend to use the net proceeds from this offering to repay certain indebtedness and to fund acquisitions, working capital and for general corporate purposes. Depending on several factors, including the availability of alternate sources of capital and the possibility that the execution or timing of our business plans may change, we may use these proceeds in a manner different than originally intended. These proceeds could be applied in ways that do not improve our operating results or otherwise increase the value of your investment.
There has been a limited market for our common stock and we cannot ensure investors that an active market for our common stock will be sustained.
There has been limited trading in our common stock and there can be no assurance that an active trading market in our common stock will be maintained. Due to the illiquidity of our common stock, its market price may not accurately reflect our relative value. There can be no assurance that there will be an active market for our shares of common stock either now or in the future. Because our common stock is so thinly traded, even limited trading in our shares has in the past, and might in the future, lead to dramatic fluctuations in share price and investors may not be able to liquidate their investment in us at all or at a price that reflects the value of the business.
In addition, our common stock currently trades on the OTCQB, which generally lacks the liquidity, research coverage and institutional investor following of a national securities exchange such as the Nasdaq Stock Market, the NYSE MKT or the New York Stock Exchange. While we have applied to list our common stock on the Nasdaq Capital Market, we cannot assure you that our common stock will be accepted for listing on such national securities exchange or that we will maintain compliance with all of the requirements for our common stock to remain listed. Additionally, if our common stock is accepted for listing on the Nasdaq Capital Market, there can be no assurance that trading of our common stock on such market will be sustained or desirable.
| 20 |
Our stock price may be volatile, which could result in substantial losses for investors.
The market price of our common stock is highly volatile and could fluctuate widely in response to various factors, many of which are beyond our control, including the following:
| · | technological innovations or new products and services by us or our competitors; |
| · | additions or departures of key personnel, including Nathan J. Mazurek, our chairman, president and chief executive officer; |
| · | sales of our common stock, including management shares; |
| · | limited availability of freely-tradable “unrestricted” shares of our common stock to satisfy purchase orders and demand; |
| · | our ability to execute our business plan; |
| · | operating results that fall below expectations; |
| · | loss of any strategic relationship; |
| · | industry developments; |
| · | economic and other external factors; |
| · | our ability to manage the costs of maintaining adequate internal financial controls and procedures in connection with the acquisition of additional businesses; |
| · | period-to-period fluctuations in our financial results; and |
| · | announcement of acquisitions. |
In addition, the securities markets have from time to time experienced significant price and volume fluctuations that are unrelated to the operating performance of particular companies. These market fluctuations may also significantly affect the market price of our common stock.
A significant number of our shares will be eligible for sale and their sale or potential sale may depress the market price of our common stock.
Sales of a significant number of shares of our common stock in the public market could harm the market price of our common stock. When this offering is completed, we will have a total of 6,907,255 shares of common stock outstanding, assuming no exercise of the underwriters’ over-allotment option and no exercise of outstanding stock options or warrants. The 1,000,000 shares offered by this prospectus will be freely tradeable unless they are purchased by our “affiliates,” as defined in Rule 144 under the Securities Act of 1933, as amended. Pursuant to an effective registration statement, an additional 1,000,000 shares are currently freely tradeable unless they are purchased by our “affiliates,” as defined in Rule 144 under the Securities Act of 1933, as amended. The remaining shares outstanding may be resold only through registration under the Securities Act of 1933, as amended, or under an available exemption from registration, such as Rule 144.
In addition, 886,400 shares are issuable upon exercise of options and warrants. Pursuant to an effective registration statement, 400,000 shares issuable upon exercise of outstanding warrants are freely tradeable unless they are purchased by our “affiliates,” as defined in Rule 144 under the Securities Act of 1933, as amended. If any options or other warrants are exercised, the shares issued upon exercise will also be restricted, but may be sold under Rule 144 after the shares have been held for six months. Sales under Rule 144 may be subject to volume limitations and other conditions.
The holders of 4,661,423 shares of common stock have agreed with Roth Capital Partners, LLC to a 90 day “lock-up” with respect to these shares. This generally means that they cannot sell these shares during the 90 days following the date of this prospectus. See “Underwriting” for additional details. After the 90 day lock-up period, these shares may be sold in accordance with Rule 144 or pursuant to an effective registration statement.
In addition to the possibility that actual sales of significant amounts of our common stock in the public market could harm our common stock price, the fact that our stockholders have the ability to make such sales could create a circumstance commonly referred to as an “overhang,” in anticipation of which the market price of our common stock could fall. The existence of an overhang, whether or not sales have occurred or are occurring, could also make it more difficult for us to raise additional financing through the sale of equity or equity-related securities in the future at a time and price that we deem reasonable or appropriate.
| 21 |
We do not expect to pay cash dividends in the future. As a result, any return on investment may be limited to the value of our common stock.
We do not anticipate paying cash dividends on our common stock in the foreseeable future. The payment of dividends on our common stock will depend on our earnings, financial condition and other business and economic factors as our board of directors may consider relevant. In addition, our credit agreement with Bank of Montreal, Chicago Branch restricts our ability to pay cash dividends. If we do not pay dividends, our common stock may be less valuable because a return on your investment will only occur if our stock price appreciates.
If securities or industry analysts do not publish research or publish inaccurate or unfavorable research about our business, our stock price and trading volume could decline.
The trading market for our common stock will depend in part on the research and reports that securities or industry analysts publish about us or our business. We do not currently have research coverage by securities and industry analysts and you should not invest in our common stock in anticipation that we will obtain such coverage. If we obtain securities or industry analyst coverage and if one or more of the analysts who covers us downgrades our stock or publishes inaccurate or unfavorable research about our business, our stock price would likely decline. If one or more of these analysts ceases coverage of us or fails to publish reports on us regularly, demand for our stock could decrease, which could cause our stock price and trading volume to decline.
| 22 |
CAUTIONARY NOTE REGARDING FORWARD-LOOKING STATEMENTS
This prospectus contains “forward-looking statements,” which include information relating to future events, future financial performance, financial projections, strategies, expectations, competitive environment and regulation. Words such as “may,” “should,” “could,” “would,” “predicts,” “potential,” “continue,” “expects,” “anticipates,” “future,” “intends,” “plans,” “believes,” “estimates,” and similar expressions, as well as statements in future tense, identify forward-looking statements. Forward-looking statements should not be read as a guarantee of future performance or results and may not be accurate indications of when such performance or results will be achieved. Forward-looking statements are based on information we have when those statements are made or management’s good faith belief as of that time with respect to future events, and are subject to risks and uncertainties that could cause actual performance or results to differ materially from those expressed in or suggested by the forward-looking statements. Important factors that could cause such differences include, but are not limited to:
| · | General economic conditions and their effect on demand for electrical equipment, particularly in the commercial construction market, but also in the power generation, industrial production, data center, oil and gas, marine and infrastructure industries. |
| · | The effects of fluctuations in sales on our business, revenues, expenses, net income, earnings per share, margins, profitability, cash flow, liquidity, financial condition and results of operations. |
| · | Many of our competitors are better established and have significantly greater resources, and may subsidize their competitive offerings with other products and services, which may make it difficult for us to attract and retain customers. |
| · | We depend on Hydro-Quebec Utility Company and Siemens Industry, Inc. for a large portion of our business, and any change in the level of orders from Hydro-Quebec Utility Company or Siemens Industry, Inc. could have a significant impact on our results of operations. |
| · | The potential loss or departure of key personnel, including Nathan J. Mazurek, our chairman, president and chief executive officer. |
| · | Our ability to expand our business through strategic acquisitions. |
| · | Our ability to integrate acquisitions and related businesses. |
| · | Our ability to generate internal growth, maintain market acceptance of our existing products and gain acceptance for our new products. |
| · | Unanticipated increases in raw material prices or disruptions in supply could increase production costs and adversely affect our profitability. |
| · | Restrictive loan covenants and/or our ability to repay or refinance debt under our credit facilities could limit our future financing options and liquidity position and may limit our ability to grow our business. |
| · | Our ability to realize revenue reported in our backlog. |
| · | Operating margin risk due to competitive pricing and operating efficiencies, supply chain risk, material, labor or overhead cost increases, interest rate risk and commodity risk. |
| · | Strikes or labor disputes with our employees may adversely affect our ability to conduct our business. |
| · | A majority of our revenue and a significant portion of our expenditures are derived or spent in Canadian dollars. However, we report our financial condition and results of operations in U.S. dollars. As a result, fluctuations between the U.S. dollar and the Canadian dollar will impact the amount of our revenues and earnings. |
| · | The impact of geopolitical activity on the economy, changes in government regulations such as income taxes, climate control initiatives, the timing or strength of an economic recovery in our markets and our ability to access capital markets. |
| · | Our chairman controls a majority of our combined voting power, and may have, or may develop in the future, interests that may diverge from yours. |
| · | Future sales of large blocks of our common stock may adversely impact our stock price. |
| · | The liquidity and trading volume of our common stock. |
| 23 |
The foregoing does not represent an exhaustive list of factors that may affect the forward-looking statements contained herein or risk factors that we are faced with that may cause our actual results to differ from those anticipated in our forward-looking statements. Please see “Risk Factors” for additional risks which could adversely impact our business and financial performance. Moreover, new risks regularly emerge and it is not possible for us to predict or articulate all risks we face, nor can we assess the impact of all risks on our business or the extent to which any risk, or combination of risks, may cause actual results to differ from those contained in any forward-looking statements. All forward-looking statements included in this prospectus are based on information available to us on the date of this prospectus. Except to the extent required by applicable laws or rules, we undertake no obligation to publicly update or revise any forward-looking statement, whether as a result of new information, future events or otherwise. All subsequent written and oral forward-looking statements attributable to us or persons acting on our behalf are expressly qualified in their entirety by the cautionary statements contained above and throughout this prospectus.
| 24 |
We estimate that the net proceeds from the sale of the shares of common stock we are offering will be approximately $6.6 million. If the underwriters fully exercise the over-allotment option, the net proceeds of the shares we sell will be $7.6 million. “Net proceeds” is what we expect to receive after paying the underwriting discount and other expenses of the offering. For the purpose of estimating net proceeds, we are assuming that the public offering price will be $7.50 per share, the midpoint of the range set forth on the cover page of this prospectus.
We intend to use the net proceeds as follows:
| · | approximately $6.6 million to pay down our outstanding borrowings under our demand U.S. revolving credit line with Bank of Montreal, Chicago Branch that is payable on demand and bore interest at June 30, 2013 at the LIBOR rate plus 2.25% per annum; and |
| · | the balance of the net proceeds, if any, for acquisitions, working capital and general corporate purposes. |
Investors are cautioned, however, that expenditures may vary substantially from these estimates. Investors will be relying on the judgment of our management, who will have broad discretion regarding the application of the proceeds of this offering. The amounts and timing of our actual expenditures will depend upon numerous factors, including our potential investments in new businesses, the amount of cash generated by our operations, the amount of competition and other operational factors. We may find it necessary or advisable to use portions of the proceeds from this offering for other purposes.
From time to time, we evaluate these and other factors and we anticipate continuing to make such evaluations to determine if the existing allocation of resources, including the proceeds of this offering, is being optimized.
Circumstances that may give rise to a change in the use of proceeds include:
| · | our ability to negotiate definitive agreements with acquisition candidates; |
| · | the availability and terms of debt financing to fund a portion of the purchase price(s) for potential acquisitions; |
| · | the need or desire on our part to accelerate, increase or eliminate existing initiatives due to, among other things, changing market conditions and competitive developments; and |
| · | the availability of other sources of cash including cash flow from operations and new bank debt financing arrangements, if any. |
Pending other uses, we intend to invest the proceeds to us in investment-grade, interest-bearing securities such as money market funds, certificates of deposit, or direct or guaranteed obligations of the U.S. government, or hold as cash. We cannot predict whether the proceeds invested will yield a favorable, or any, return.
| 25 |
MARKET FOR OUR COMMON STOCK AND RELATED STOCKHOLDER MATTERS
The following table sets forth the high and low closing bid prices for our common stock for the periods indicated, as provided by OTC Markets Group, Inc. The quotations reflect inter-dealer prices, without retail mark-up, mark-down or commission, and may not represent actual transactions. The quotes are adjusted to reflect a one-for-five reverse stock split that occurred on June 20, 2011.
| Fiscal Year | Period | High | Low | |||
| 2011 | First Quarter Ended March 31 | 15.30 | 10.75 | |||
| Second Quarter Ended June 30 | 12.50 | 0.35 | ||||
| Third Quarter Ended September 30 | 6.00 | 0.60 | ||||
| Fourth Quarter Ended December 31 | 5.00 | 2.00 | ||||
| 2012 | First Quarter Ended March 31 | 4.50 | 2.00 | |||
| Second Quarter Ended June 30 | 5.00 | 2.00 | ||||
| Third Quarter Ended September 30 | 5.51 | 4.55 | ||||
| Fourth Quarter Ended December 31 | 6.50 | 5.51 | ||||
| 2013 | First Quarter Ended March 31 | 5.60 | 5.60 | |||
| Second Quarter Ended June 30 | 6.50 | 5.60 | ||||
| Third Quarter (through September 9, 2013) | 8.00 | 6.15 |
The last reported sales price of our common stock on the OTCQB on September 9, 2013, was $7.00 per share. As of September 9, 2013, there were 22 holders of record of our common stock.
| 26 |
The following table summarizes our cash and cash equivalents and capitalization as of June 30, 2013:
| · | on an actual basis; and | |
| · | on a pro forma, as adjusted basis, giving effect to (1) our receipt of the net proceeds from the sale by us in this offering of shares of common stock at an assumed public offering price of $7.50 per share, the midpoint of the range set forth on the cover page of this prospectus, after deducting estimated underwriting discounts and commissions and estimated offering expenses payable by us and (2) the application of the net proceeds we will receive from this offering in the manner described in “Use of Proceeds.” |
| June 30, 2013 | ||||||||
| Actual | As Adjusted | |||||||
| (in thousands) | ||||||||
| Cash and cash equivalents | $ | 822 | $ | 1,863 | ||||
| Short-term debt, including current portion of long-term debt | $ | 8,476 | $ | 2,967 | ||||
| Long-term debt, less current portion | 8,477 | 8,477 | ||||||
| Stockholders’ equity (1): | ||||||||
| Preferred stock, par value $0.001; 5,000,000 shares authorized, no shares issued and outstanding | - | - | ||||||
| Common stock; par value $0.001; 30,000,000 shares authorized, 5,907,255 shares issued and outstanding, actual; 6,907,255 shares issued and outstanding, as adjusted | 6 | 7 | ||||||
| Additional paid-in capital | 8,184 | 14,733 | ||||||
| Accumulated other comprehensive (loss) | (1,390 | ) | (1,390 | ) | ||||
| Retained earnings | 12,955 | 12,955 | ||||||
| Total stockholders’ equity | 18,824 | 26,305 | ||||||
| Total capitalization | $ | 37,753 | $ | 37,749 | ||||
| 27 |
Our net tangible book value on June 30, 2013, was approximately $6.8 million, or $1.14 per share. “Net tangible book value” is total assets minus the sum of liabilities and intangible assets. “Net tangible book value per share” is net tangible book value divided by the total number of shares outstanding.
After giving effect to adjustments relating to the offering, our pro forma net tangible book value on June 30, 2013, would have been $13.3 million or $1.93 per share. The adjustments made to determine pro forma net tangible book value per share are the following:
| · | an increase in total assets to reflect the net proceeds of the offering as described under “Use of Proceeds” (assuming that the public offering price will be $7.50 per share, the midpoint of the range set forth on the cover page of this prospectus), and |
| · | the addition of the number of shares offered by this prospectus to the number of shares outstanding. |
The following table illustrates the pro forma increase in net tangible book value of $0.79 per share and the dilution (the difference between the offering price per share and net tangible book value per share) to new investors:
| Assumed public offering price per share | $ | 7.50 | ||
| Net tangible book value per share as of June 30, 2013 | $ | 1.14 | ||
| Increase in net tangible book value per share attributable to the offering | $ | 0.79 | ||
| Pro forma net tangible book value per share as of June 30, 2013, after giving effect to the offering | $ | 1.93 | ||
| Dilution per share to new investors in the offering | $ | 5.57 |
The following table shows the difference between existing stockholders and new investors with respect to the number of shares purchased from us, the total consideration paid and the average price paid per share. The table assumes that the public offering price will be $7.50 per share, the midpoint of the range set forth on the cover page of this prospectus.
| Shares Purchased | Total Consideration | Average Price | ||||||||||||||||||
| Number | Percent | Amount | Percent | Per Share | ||||||||||||||||
| Existing stockholders | 5,907,255 | 85.5 | % | $ | 6,825,432 | 47.6 | % | $ | 1.16 | |||||||||||
| New investors | 1,000,000 | 14.5 | % | $ | 7,500,000 | 52.4 | % | $ | 7.50 | |||||||||||
| Total | 6,907,255 | 100.0 | % | $ | 14,325,432 | 100.0 | % | |||||||||||||
The foregoing tables and calculations are based on the number of shares of our common stock outstanding as of June 30, 2013, and exclude:
| · | 640,000 shares of common stock issuable upon the exercise of warrants with a weighted average exercise price of $14.00 per share; |
| · | 40,000 shares of common stock issuable upon the exercise of warrants to be issued to the underwriters as underwriter compensation in this offering at an exercise price equal to the public offering price of our common stock hereunder; |
| · | 246,400 shares of common stock issuable upon the exercise of currently outstanding options with a weighted average exercise price of $9.89 per share; and |
| · | 453,600 shares of common stock available for future issuance under our 2011 Long-Term Incentive Plan. |
To the extent any of these outstanding options or warrants are exercised, the dilution to new investors would be reduced. To the extent all of such outstanding options and warrants had been exercised as of June 30, 2013, the pro forma as adjusted net tangible book value per share after this offering would be $3.19, and total dilution per share to new investors would be $4.31.
If the underwriters exercise their over-allotment option in full, our existing stockholders would own 84% and our new investors would own 16% of the total number of shares of our common stock outstanding upon the completion of this offering.
| 28 |
SELECTED CONSOLIDATED FINANCIAL DATA
This section presents our selected historical financial data. You should read carefully the financial statements included in this prospectus, including the notes to the financial statements. The selected data in this section is not intended to replace the financial statements.
We derived the statement of operations data for the years ended December 31, 2011 and 2012, and balance sheet data as of December 31, 2011 and 2012 from the audited financial statements in this prospectus. Those financial statements were audited by Richter LLP, an independent registered public accounting firm. We derived the statement of operations data for the year ended December 31, 2010 and the balance sheet data as of December 31, 2010 from the financial statements audited by Richter LLP that are not included in this prospectus. We derived the statement of operations data for the six months ended June 30, 2013 and 2012 and the balance sheet data at June 30, 2013 from the unaudited financial statements in this prospectus. We believe that the unaudited, non-GAAP historical financial statement information contains all adjustments needed to present fairly the information included in those statements, and that the adjustments made consist only of normal recurring adjustments.
Selected Consolidated Financial Data
(In thousands, except per share data)
| Years Ended | Six Months Ended | |||||||||||||||||||||||
| December 31, | June 30, | |||||||||||||||||||||||
| 2010 | 2011 | 2012 | 2012 | 2013 | ||||||||||||||||||||
| Statement of Operations Data: | ||||||||||||||||||||||||
| Revenues | $ | 47,236 | $ | 68,790 | $ | 83,960 | $ | 42,137 | $ | 44,546 | ||||||||||||||
| Cost of goods sold | 35,637 | 52,813 | 65,020 | 32,783 | 33,885 | |||||||||||||||||||
| Gross profit | 11,599 | 15,977 | 18,940 | 9,354 | 10,661 | |||||||||||||||||||
| Operating expenses | ||||||||||||||||||||||||
| Selling, general and administrative | 7,635 | 11,070 | 13,181 | 6,551 | 7,052 | |||||||||||||||||||
| Foreign exchange (gain) loss | (133 | ) | 197 | (188 | ) | (86 | ) | 47 | ||||||||||||||||
| Total operating expenses | 7,502 | 11,267 | 12,993 | 6,465 | 7,099 | |||||||||||||||||||
| Operating income | 4,096 | 4,710 | 5,947 | 2,889 | 3,562 | |||||||||||||||||||
| Interest expense | 182 | 646 | 933 | 443 | 368 | |||||||||||||||||||
| Other expense | 353 | 820 | 92 | 30 | 167 | |||||||||||||||||||
| Earnings from continuing operations before income taxes | 3,561 | 3,244 | 4,922 | 2,416 | 3,027 | |||||||||||||||||||
| Provision for income taxes | 327 | 773 | 1,733 | 697 | 852 | |||||||||||||||||||
| Earnings from continuing operations | 3,234 | 2,471 | 3,189 | 1,719 | 2,175 | |||||||||||||||||||
| Loss from discontinued operations, net of income taxes | (288 | ) | (2,531 | ) | (199 | ) | (161 | ) | - | |||||||||||||||
| Net earnings (loss) | $ | 2,946 | $ | (60 | ) | $ | 2,990 | $ | 1,558 | $ | 2,175 | |||||||||||||
| Earnings from continuing operations per diluted share | $ | 0.55 | $ | 0.42 | $ | 0.54 | $ | 0.29 | $ | 0.37 | ||||||||||||||
| Weighted average diluted common shares outstanding | 5,931 | 5,949 | 5,913 | 5,907 | 5,922 | |||||||||||||||||||
| Other Data: | ||||||||||||||||||||||||
| Non-GAAP net earnings | $ | 2,945 | $ | 3,307 | $ | 4,121 | $ | 1,940 | $ | 2,495 | ||||||||||||||
| Non-GAAP net earnings per diluted common share | 0.50 | 0.56 | 0.70 | 0.33 | 0.42 | |||||||||||||||||||
| Adjusted EBITDA (Non-GAAP measure) | 5,251 | 6,050 | 7,753 | 3,751 | 4,392 | |||||||||||||||||||
| Acquisition of subsidiaries and related assets | 832 | 7,830 | - | - | 655 | |||||||||||||||||||
| Balance Sheet Data: | ||||||||||||||||||||||||
| Cash and cash equivalents | $ | 516 | $ | 1,398 | $ | 467 | $ | 150 | $ | 822 | ||||||||||||||
| Working capital | 2,558 | 4,244 | 6,883 | 4,718 | 5,775 | |||||||||||||||||||
| Total assets | 32,103 | 48,838 | 52,178 | 52,198 | 52,873 | |||||||||||||||||||
| Total debt | 6,080 | 17,885 | 17,130 | 18,352 | 16,953 | |||||||||||||||||||
| Total liabilities | 17,011 | 34,070 | 34,263 | 35,851 | 33,118 | |||||||||||||||||||
| Total shareholders’ equity | 15,092 | 14,768 | 17,915 | 16,347 | 19,755 | |||||||||||||||||||
| 29 |
Use of Non-GAAP Financial Measures
We have presented non-GAAP measures such as non-GAAP net earnings and Adjusted EBITDA because many of our investors use these non-GAAP measures to monitor our performance. These non-GAAP measures should not be considered as an alternative to GAAP measures as an indicator of our operating performance.
Non-GAAP net earnings is defined by us as net earnings before amortization of acquisition-related intangibles, stock-based compensation, non-recurring acquisition costs and reorganization expense, impairments, other unusual gains or charges and any tax effects related to these items. We define Adjusted EBITDA as net earnings before interest, income tax expense, depreciation and amortization, non-cash compensation and non-recurring acquisition costs and reorganization expenses and other non-recurring or non-cash items.
Generally, a non-GAAP financial measure is a numerical measure of a company’s performance, financial position or cash flow that either excludes or includes amounts that are not normally excluded or included in the most directly comparable measure calculated and presented in accordance with GAAP. The non-GAAP measures included below, however, should be considered in addition to, and not as a substitute for or superior to, operating income, cash flows, or other measures of financial performance prepared in accordance with GAAP. A reconciliation of non-GAAP to GAAP financial measures is set forth in the table below.
Reconciliation of GAAP Measures to Non-GAAP Measures
(In thousands, except per share data)
| Years Ended | Six Months Ended | |||||||||||||||||||
| December 31, | June 30, | |||||||||||||||||||
| 2010 | 2011 | 2012 | 2012 | 2013 | ||||||||||||||||
| Non-GAAP Net Earnings and Diluted EPS: | ||||||||||||||||||||
| Earnings per share from continuing operations (GAAP measure) | $ | 0.55 | $ | 0.42 | $ | 0.54 | $ | 0.29 | $ | 0.37 | ||||||||||
| Earnings from continuing operations (GAAP measure) | $ | 3,234 | $ | 2,471 | $ | 3,189 | $ | 1,719 | $ | 2,175 | ||||||||||
| Amortization of acquisition intangibles | 144 | 252 | 285 | 143 | 142 | |||||||||||||||
| Stock-based compensation expense | 161 | 254 | 270 | 133 | 108 | |||||||||||||||
| Stock and warrant issuance expense for services | 232 | - | - | - | - | |||||||||||||||
| Non-recurring acquisition and reorganization costs | 353 | 334 | 55 | 32 | 169 | |||||||||||||||
| (Gain) on sale of assets | - | - | (8 | ) | (2 | ) | (2 | ) | ||||||||||||
| Withdrawn financing transaction costs | - | 487 | 45 | - | - | |||||||||||||||
| Non-recurring tax (recoveries) non-cash charges, net | (831 | ) | (26 | ) | 411 | - | - | |||||||||||||
| Tax effects | (347 | ) | (464 | ) | (126 | ) | (85 | ) | (97 | ) | ||||||||||
| Non-GAAP net earnings | $ | 2,945 | $ | 3,307 | $ | 4,121 | $ | 1,940 | $ | 2,495 | ||||||||||
| Non-GAAP net earnings per diluted share | $ | 0.50 | $ | 0.56 | $ | 0.70 | $ | 0.33 | $ | 0.42 | ||||||||||
| Weighted average diluted shares outstanding | 5,931 | 5,949 | 5,913 | 5,907 | 5,922 | |||||||||||||||
| Reconciliation to Adjusted EBITDA: | ||||||||||||||||||||
| Earnings from continuing operations (GAAP measure) | $ | 3,234 | $ | 2,471 | $ | 3,189 | $ | 1,719 | $ | 2,175 | ||||||||||
| Interest expense | 182 | 646 | 933 | 443 | 368 | |||||||||||||||
| Provision for income taxes | 327 | 773 | 1,733 | 697 | 852 | |||||||||||||||
| Depreciation and amortization | 763 | 1,086 | 1,536 | 730 | 722 | |||||||||||||||
| Non-recurring acquisition and reorganization costs | 353 | 334 | 55 | 32 | 169 | |||||||||||||||
| (Gain) on sale of assets | - | - | (8 | ) | (2 | ) | (2 | ) | ||||||||||||
| Withdrawn financing transaction costs | - | 487 | 45 | - | - | |||||||||||||||
| EBITDA | 4,859 | 5,797 | 7,483 | 3,618 | 4,284 | |||||||||||||||
| Adjustments to EBITDA: | ||||||||||||||||||||
| Stock-based compensation expense | 161 | 254 | 270 | 133 | 108 | |||||||||||||||
| Stock and warrant issuance expense for services | 232 | - | - | - | - | |||||||||||||||
| Adjusted EBITDA (Non-GAAP measure) | $ | 5,251 | $ | 6,050 | $ | 7,753 | $ | 3,751 | $ | 4,392 | ||||||||||
Note: Amounts may not foot due to rounding
| 30 |
We have not declared or paid cash dividends on our common stock during the two most recent fiscal years or in 2013, and we do not intend to pay any cash dividends on our common stock during the foreseeable future. Rather, we intend to retain future earnings (if any) to fund the operation and expansion of our business and for general corporate purposes. Subject to legal and contractual limits, our board of directors will make any decision as to whether to pay dividends in the future. In addition, our credit agreement with Bank of Montreal, Chicago Branch, dated June 28, 2013, restricts our ability to pay cash dividends.
| 31 |
MANAGEMENT’S DISCUSSION AND ANALYSIS
OF FINANCIAL
CONDITION AND RESULTS OF OPERATIONS
You should read the following discussion and analysis of our financial condition and results of operations together with our financial statements and related notes appearing elsewhere in this prospectus. In addition to historical financial information, the following discussion contains forward-looking statements that reflect our plans, estimates and beliefs. Our actual results could differ materially from those discussed in the forward-looking statements. Factors that could cause or contribute to these differences include those discussed below and elsewhere in this prospectus, particularly in the sections entitled “Risk Factors” and “Cautionary Note Regarding Forward-Looking Statements.”
Overview and Recent Events
We manufacture specialty electrical transmission and distribution equipment and provide a broad range of custom-engineered and general purpose solutions for applications in the utility, industrial and commercial markets. We are headquartered in Fort Lee, New Jersey and operate from eight additional locations in the U.S., Canada and Mexico for manufacturing, centralized distribution, engineering, sales and administration.
On March 6, 2013, through our wholly-owned subsidiary Pioneer Critical Power Inc., we acquired substantially all of the assets and assumed certain liabilities of Power Systems Solutions, Inc., a Minneapolis-based provider of paralleling switchgear and engine generator controls used in on-site backup power and distributed generation applications.
On August 19, 2013, our wholly-owned subsidiary Pioneer Custom Electrical Products Corp., or Pioneer CEP, acquired all the machinery and equipment, certain inventory assets and all of the intellectual property of Pico Electrical Equipment, Inc. and Pico Metal Products, Inc., a Los Angeles-based manufacturer of electrical switchboards, panelboards and custom electrical enclosures.
| 32 |
Foreign Currency Exchange Rates
Although we have elected to report our results in accordance with U.S. GAAP and in U.S. dollars, several of our subsidiaries are Canadian entities whose functional currencies are the Canadian dollar. As such, the financial position, results of operations, cash flows and equity of these subsidiaries are initially consolidated in Canadian dollars. The subsidiaries’ assets and liabilities are then translated from Canadian dollars to U.S. dollars by applying the foreign currency exchange rate in effect at the balance sheet date, while the results of their operations and cash flows are translated to U.S. dollars by applying the average foreign currency exchange rate in effect during the reporting period. The resulting translation adjustments are included in other comprehensive income or loss.
The financial position and operating results of our Canadian subsidiaries have been translated to U.S. dollars by applying the following exchange rates, expressed as the number of Canadian dollars to one U.S. dollar for each period reported:
| 2013 | 2012 | 2011 | ||||||||||||||||||||||||||||||||||
| Consolidated Balance Sheet | Consolidated
Statements of Earnings and Comprehensive Income | Consolidated Balance Sheet | Consolidated Statements of Earnings and Comprehensive Income | Consolidated Balance Sheet | Consolidated Statements of Earnings and Comprehensive Income | |||||||||||||||||||||||||||||||
| Quarter Ended | End of Period | Period Average | Cumulative Average | End of Period | Period Average | Cumulative Average | End of Period | Period Average | Cumulative Average | |||||||||||||||||||||||||||
| March 31 | $ | 1.0160 | $ | 1.0089 | $ | 1.0089 | $ | 0.9975 | $ | 1.0012 | $ | 1.0012 | $ | 0.9696 | $ | 0.9860 | $ | 0.9860 | ||||||||||||||||||
| June 30 | 1.0518 | 1.0234 | 1.0161 | $ | 1.0181 | $ | 1.0102 | $ | 1.0057 | $ | 0.9645 | $ | 0.9676 | $ | 0.9768 | |||||||||||||||||||||
| September 30 | $ | 0.9832 | $ | 0.9948 | $ | 1.0021 | $ | 1.0482 | $ | 0.9802 | $ | 0.9780 | ||||||||||||||||||||||||
| December 31 | $ | 0.9949 | $ | 0.9913 | $ | 0.9994 | $ | 1.0170 | $ | 1.0231 | $ | 0.9891 | ||||||||||||||||||||||||
Critical Accounting Policies
Use of Estimates. The preparation of financial statements in accordance with U.S. GAAP requires us to make estimates and assumptions that affect the reported amounts of assets and liabilities and disclosures of contingent assets and liabilities at the date of the financial statements and the reported amounts of revenues and expenses during the reporting period. The financial statements include estimates based on currently available information and our judgment as to the outcome of future conditions and circumstances. Significant estimates in these financial statements include pension expense, inventory provisions, useful lives and impairment of long-lived assets, warranty accruals, income tax determination, stock-based compensation, allowance for doubtful accounts and estimates related to purchase price allocation. Changes in the status of certain facts or circumstances could result in material changes to the estimates used in the preparation of the financial statements and actual results could differ from the estimates and assumptions.
Revenue Recognition Policies. Revenue is recognized when (1) persuasive evidence of an arrangement exists, (2) delivery occurs, (3) the sales price is fixed or determinable, (4) collectability is reasonably assured and (5) customer acceptance criteria, if any, have been successfully demonstrated. Revenue is recognized on the sale of goods when the significant risks and rewards of ownership have been transferred to the buyer upon delivery, provided that we maintain neither managerial involvement to the degree usually associated with ownership, nor effective control over the goods sold. There are no further obligations on our part subsequent to revenue recognition, except when customers have the right of return or when we warrant the product. We record a provision for future returns, based on historical experience at the time of shipment of products to customers. We warrant some of our products against defects in design, materials and workmanship for periods ranging from one to three years depending on the model. We record a provision for estimated future warranty costs based on the historical relationship of warranty claims to sales at the time of shipment of products to customers. We periodically review the adequacy of our product warranties and adjust, if necessary, the warranty percentage and accrued warranty reserve for actual experience.
| 33 |
Changes in Accounting Principles
No significant changes in accounting principles were adopted during 2011 and 2012, except for the following:
Fair Value Measurements. We adopted certain amendments to Accounting Standards Codification, or ASC, 820, “Fair Value Measurements,” effective January 1, 2012. These amendments include a consistent definition of fair value, enhanced disclosure requirements for “Level 3” fair value adjustments and other changes to required disclosures. Their adoption did not have a material impact on our consolidated financial statements.
Comprehensive Income. We adopted the amendments to ASC 220, “Comprehensive Income,” effective January 1, 2012. The amendments pertained to presentation and disclosure only.
Intangibles – Goodwill & Other. We adopted the amendments to ASC 350, “Intangibles-Goodwill and Others,” effective January 1, 2012. The amended guidance allows us to do an initial qualitative assessment of relevant events and circumstances to determine if fair value of a reporting unit is more likely than not to be less than its carrying value, prior to performing the two-step quantitative goodwill impairment test. The adoption of these amendments did not have a material impact on our consolidated financial statements.
Results of Operations
Three Months and Six Months Ended June 30, 2013 Compared to Three and Six Months Ended June 30, 2012
Revenue . For the three months ended June 30, 2013, our consolidated revenue increased to $22.0 million, up from $21.8 million during the three months ended June 30, 2012. The $0.2 million overall increase in our revenue includes $0.5 million of switchgear sales by Pioneer Critical Power Inc., our newest business which was launched in March 2013. During the three months ended June 30, 2013, as compared to the three months ended June 30, 2012, sales of our transformer products decreased by $0.3 million to $21.5 million. The 1.5% decrease in our transformer revenue was comprised of a 3.9% decrease in dry-type transformer sales, driven mostly by lower sales in Canada, and was partially offset by a 1.2% increase in our liquid-filled transformer sales (driven mostly by increased sales to U.S. customers).
For the six months ended June 30, 2013, our consolidated revenue increased by $2.4 million, or 5.7%, to $44.5 million, up from $42.1 million during the six months ended June 30, 2012. Approximately $1.9 million of the increase in our revenue was derived from transformer sales, which increased by 4.5% to $44.0 million, as compared to $42.1 million for the six months ended June 30, 2012. This increase in our transformer sales was driven mostly by several large orders for liquid-filled products, sales of which grew 14.5% on a year-over-year basis, particularly from customers in Alberta’s utility and oil & gas sectors. Offsetting these increases was a 4.2% decline in dry-type unit sales, due primarily to two factors — a large order that was recognized during the first six months of 2012 and not repeated, and our decision to reduce sales discounts in the Canadian distribution channel which we believe also reduced demand this quarter. The remaining $0.5 million increase in our overall revenue during the 2013 period resulted from four additional months of operations for our Pioneer Critical Power Inc. business.
Gross Margin . For the three months ended June 30, 2013, our gross margin percentage was 25.4% of revenues, as compared to 21.8% during the three months ended June 30, 2012. The increase in our gross margin percentage reflects favorable year-over-year comparisons for all of our general product categories. Our gross margin percentage on sales of liquid-filled transformers increased by 5.3% during the three months ended June 30, 2013, driven by strong demand for larger, custom-designed substation-class transformers. In addition, our unit volume of network transformers, a design used exclusively by utilities, was also up significantly during the three months ended June 30, 2013, as compared to the same period of 2012. Our average dry-type gross margin percentage increased 1.2% during the three months ended June 30, 2013, as compared to the same period of 2012, mostly as a result of manufacturing efficiencies implemented at our Canadian dry-type facility. Our gross margin percentage on switchgear sales, although still a small contributor in terms of total gross profit dollars, also had the effect of increasing our overall gross margin during the three months ended June 30, 2013 as compared to the three months ended June 30, 2012.
| 34 |
For the six months ended June 30, 2013, our gross margin percentage increased to 23.9% of revenues, compared to 22.2% during the six months ended June 30, 2012. The 1.7% increase in our gross margin was due to several of the factors described above, but was also a result of a shift in mix towards our more profitable product categories. We generally achieve higher gross margins from sales of our engineered-to-order products (principally liquid-filled transformers and switchgear) than we do from the sale of our dry-type transformers, a large portion of which consists of catalogue designs sold on a wholesale basis through our distribution network. For the six months ended June 30, 2013, as compared to the six months ended June 30, 2012, liquid-filled transformers represented 50.4% of our consolidated revenue (up from 46.5%), switchgear represented 1.1% (up from 0.0%) and dry-type transformers represented 48.5% (down from 53.5%).
Selling, General and Administrative Expense . For the three months ended June 30, 2013, our selling, general and administrative expense increased by approximately $0.2 million, or 6.7%, to $3.5 million, as compared to $3.3 million during the three months ended June 30, 2012. The increase in our selling, general and administrative expense during the three months ended June 30, 2013, as compared to the same period of 2012, was primarily due to due to the inclusion of three months of operations of our new switchgear business, as well as to an increase in our corporate expenses. As a percentage of total revenue, our selling, general and administrative expense increased to 16.1% during the three months ended June 30, 2013, as compared to 15.2% during the three months ended June 30, 2012.
For the six months ended June 30, 2013, our selling, general and administrative expense increased by approximately $0.5 million, or 7.6%, to $7.1 million, as compared to $6.6 million during the six months ended June 30, 2012. Approximately half of the increase was due to the inclusion of four full months of operations of our new switchgear business. Another one-third of the increase in our selling, general and administrative expense was attributable to higher corporate expenses, consisting primarily of higher personnel costs and professional fees. The remaining increase of approximately $0.1 million in our selling, general and administrative expense resulted from our transformer businesses. As a percentage of total revenue, our selling, general and administrative expense increased to 15.8% during the six months ended June 30, 2013, as compared to 15.5% during the six months ended June 30, 2012.
Foreign Exchange (Gain) Loss . During the three months and six months ended June 30, 2013, approximately 56% and 60% of our consolidated operating revenues were denominated in Canadian dollars and a material percentage of our expenses were denominated and disbursed in U.S. dollars. We have not historically engaged in currency hedging activities. Fluctuations in foreign currency exchange rates between the time we initiate and then settle transactions with our customers and suppliers can have an impact on our operating results. For the three months ended June 30, 2013, we recorded a gain of approximately $14,000 due to currency fluctuations, compared to a gain of approximately $14,000 during the three months ended June 30, 2012. For the six months ended June 30, 2013, we recorded a loss of approximately $47,000, compared to a gain of approximately $86,000 during the six months ended June 30, 2012.
Interest and Bank Charges . For the three and six months ended June 30, 2013, interest and bank charges were approximately $183,000 and $368,000, as compared to $230,000 and $443,000 during the three and six months ended June 30, 2012. The decrease in our interest expense was due to lower average borrowing costs under our U.S. credit facilities, together with lower average borrowings outstanding so far during 2013, as compared to 2012.
Other Expense (Income) . For the three and six months ended June 30, 2013, other non-operating expense was approximately $74,000 and $167,000, as compared to $1,000 and $30,000 during the three and six months ended June 30, 2012. Approximately $93,000 of the 2013 other expense resulted from professional fees and costs incurred by Pioneer Critical Power Inc. in connection with a business acquisition and the remaining $74,000 resulted from a reduction in force affecting our dry-type transformer business during the second quarter. The 2012 other expense consists primarily of professional fees incurred in connection with post-closing requirements related to our acquisition of Bemag Transformer Inc. in 2011.
Provision for Income Taxes . For the three and six months ended June 30, 2013, our provision for income taxes reflects an effective tax rate on earnings before income taxes of 30.1% and 28.2%, as compared to 29.4% and 28.9% during the three and six months ended June 30, 2012. Most of our taxable income is derived in Canada where we are subject to lower corporate tax rates relative to our U.S. operations.
Earnings from Continuing Operations . We generated net earnings from continuing operations of $1.3 million and $2.2 million for the three and six months ended June 30, 2013, as compared to $0.9 million and $1.7 million during the three and six months ended June 30, 2012. Earnings from continuing operations per basic and diluted share for the three and six months ended June 30, 2013 were $0.21 and $0.37, as compared to $0.15 and $0.29 for the three and six months ended June 30, 2012. Our earnings from continuing operations benefitted from a higher operating income margin on increased sales, together with lower interest expense for the reasons described above. These improvements, as compared to the three and six months ended June 30, 2012, were partially offset by foreign exchange losses and increased non-operating expenses primarily due to an acquisition.
Backlog . Our order backlog at June 30, 2013 was $24.4 million, as compared to $23.6 million at December 31, 2012 and $24.3 million at June 30, 2012. Our backlog is based on orders expected to be delivered in the future, most of which is expected to occur during the next six months.
Year Ended December 31, 2012 Compared to the Year Ended December 31, 2011
Revenue. For the year ended December 31, 2012, our consolidated revenue increased by $15.2 million, or 22.1%, to $84.0 million, up from $68.8 million during the year ended December 31, 2011. Approximately $7.0 million of the revenue increase reflects year-over-year growth in our dry-type transformer products (15.1%) and our liquid-filled transformer products (2.8%). On a combined basis, these respective increases correspond to 10.2% overall organic growth in our revenue during the year ended December 31, 2012. The remaining $8.2 million increase in our revenue during 2012, as compared to 2011, resulted from our acquisition of Bemag Transformer Inc.. During 2012, we had six additional months of operations for this business unit.
| 35 |
In 2012, sales to distributors and to engineering, procurement and construction, or EPC, firms represented approximately 50% of our consolidated revenue. Distributors typically use our products in connection with commercial construction projects and EPC firms use our products for a wide variety of applications, the exact nature of which is not always disclosed to us. In the U.S., sales to these customer classes grew by approximately 22%, driven by a renewed pace of commercial construction orders and the expansion of our supply arrangement with a key brand label customer. Excluding growth from the effect of the acquisition we completed in 2011, our Canadian distributor and EPC firm sales were flat in comparison to the prior year, with a mid-single digit percentage increase in our dry-type transformer volume, offset by a decrease in shipments of our liquid-filled product types.
Sales to utilities in 2012 represented approximately 32% of our consolidated revenue and grew by 23% as compared to 2011. Our utility sales benefitted from strong, mostly cyclically-driven increases among many of our perennial customers. Sales to our commercial and industrial customers represented the remaining 18% of our consolidated revenue and decreased by approximately 2% as compared to 2011. In any one period, our commercial and industrial revenue is usually derived from a concentrated group of customers and is tied to several large projects which by their nature are non-recurring. The small decrease in our commercial and industrial sales in 2012 was driven by fewer orders for industrial projects, as compared to 2011 which benefitted from one particularly large Canadian energy project order.
Gross Margin. For the year ended December 31, 2012, our gross margin percentage decreased to 22.6% of revenues, compared to 23.2% during the year ended December 31, 2011. This decrease was anticipated due to the acquisition-driven shift in our sales mix towards dry-type transformers, which represented approximately 54% of consolidated sales during 2012, as compared to only 46% in 2011. We generally expect this product line to achieve lower gross margins than our liquid-filled transformers because approximately 77% of our dry-type sales volume consists of general purpose units sold wholesale to a large number of electrical distributors in the more price-competitive distribution sales channel. By contrast, the majority of our liquid-filled transformer sales are on a direct-to-customer basis and they are frequently engineered-to-order, which generally warrants a higher gross margin percentage.
During the year ended December 31, 2012, we experienced a 2.8% gross margin increase in our liquid-filled product line due mainly to variations in sales mix. In our dry-type transformer line, gross margin declined 3.2% driven by significantly higher sales of standardized units into the commercial construction market, including to our brand label customers.
Selling, General and Administrative Expense. For the year ended December 31, 2012, selling, general and administrative expense increased by approximately $2.1 million, or 19.1%, to $13.2 million, as compared to $11.1 million during the year ended December 31, 2011. Approximately half the increase was due to the fact that our selling, general and administrative expense for the year ended December 31, 2012 included six additional months of operations for the business we acquired during 2011. The remainder of the increase was primarily attributable to higher variable selling costs associated with the increase in our sales to distributors. As a percentage of our consolidated revenue, selling, general and administrative expense decreased to 15.7% in 2012, as compared to 16.1% in 2011.
Foreign Exchange (Gain) Loss. For the year ended December 31, 2012, approximately 63% of our consolidated operating revenues were denominated in Canadian dollars, and the majority of our expenses were denominated and disbursed in U.S. dollars. We have not historically engaged in currency hedging activities. Fluctuations in foreign currency exchange rates between the time we initiate and then settle transactions with our customers and suppliers can have an impact on our operating results. For the year ended December 31, 2012, we recorded a gain of $0.2 million due to currency fluctuations, compared to a loss of approximately $0.2 million during the year ended December 31, 2011.
| 36 |
Interest Expense. For the year ended December 31, 2012, our interest expense was approximately $0.9 million, as compared to $0.6 million for the year ended December 31, 2011. Our interest expense consists primarily of charges related to our credit facilities and bank term loans. The aggregate outstanding balance of our total debt decreased by $0.8 million during the year ended December 31, 2012, but our average outstanding borrowings were higher as compared to 2011 due to the acquisition debt financing we completed in July 2011.
Other Expense. For the year ended December 31, 2012, our other non-operating expense of $0.1 million consists of a deposit that was forfeited due to our withdrawal from a proposed debt financing transaction, as well as professional fees incurred in connection with the post-closing requirements of our 2011 acquisition. For the year ended December 31, 2011, our other expense of $0.8 million consisted of approximately $0.4 million of professional fees and restructuring costs related to the acquisition, plus $0.5 million of expense related to our public offering of common stock that was withdrawn due to market conditions.
Provision for Income Taxes. Our provision reflects an effective tax rate on earnings from continuing operations of 35.2% in 2012, as compared to 23.8% in 2011. The increase in our effective tax rate during 2012 primarily reflects a one-time write-off of a $0.4 million deferred tax asset. The write-off resulted from an intercompany ownership transfer of certain manufacturing equipment between our U.S. and Canadian subsidiaries in connection with a financing transaction. Without the effect of this non-cash charge, our effective tax rate would have been 26.9% during the year ended December 31, 2012. Most of our taxable income is derived in Canada where we are subject to lower corporate tax rates relative to our U.S. operations.
Earnings from Continuing Operations. We generated net earnings from continuing operations of $3.2 million for the year ended December 31, 2012, as compared to $2.5 million during the year ended December 31, 2011. In 2012, our earnings from continuing operations per basic and diluted share was $0.54, as compared to $0.42 during the year ended December 31, 2011. There was no change in the number of common shares we had outstanding between 2012 and 2011. Our earnings from continuing operations benefitted from a higher operating income margin on increased sales, together with lower non-operating costs for the reasons described above. These improvements, as compared to the prior year, were partially offset by increased interest expense, a one-time income tax charge and the effect of a higher effective income tax rate.
Backlog. Our order backlog at December 31, 2012 was $23.6 million, as compared to $24.8 million at December 31, 2011. Approximately 85% of our backlog is derived from utility, commercial and industrial customer orders for our liquid-immersed transformers. These products generally entail longer lead times and higher average selling prices than our dry-type transformers. The $1.2 million decrease in our backlog between 2012 and 2011 resulted from our receipt and shipment of several large dry-type transformer orders to construction projects that were non-recurring in nature. Our backlog is based on orders expected to be delivered in the future, most of which is expected to occur during 2013. New orders placed during the year ended December 31, 2012 totaled $88.7 million, an increase of approximately 13% compared to new orders of $78.4 million that were placed during the year ended December 31, 2011.
Discontinued Operations
As a result of our activities to liquidate Pioneer Wind Energy Systems Inc., the assets and liabilities of the business are considered held for sale at December 31, 2012 and therefore its financial results are reported as discontinued operations in the consolidated financial statements. See “Note 5. Discontinued Operations” to our audited financial statements for the year ended December 31, 2012 included in this prospectus for further information. The following table summarizes the results of discontinued operations (in thousands):
| Year Ended December 31, | ||||||||
| 2012 | 2011 | |||||||
| Net sales | $ | 230 | $ | - | ||||
| Loss from operations of discontinued business (1) | (199 | ) | (2,531 | ) | ||||
| Income tax expense | - | - | ||||||
| Loss from discontinued operations, net of tax | $ | (199 | ) | $ | (2,531 | ) | ||
(1) Includes non-cash asset impairment charges of $1.6 million during the year ended December 31, 2011.
| 37 |
Liquidity and Capital Resources
General . At June 30, 2013, we had cash and cash equivalents of approximately $0.8 million and total debt, including capital lease obligations, of $17.0 million. We have historically met our cash needs through a combination of cash flows from operating activities and short-term bank borrowings. Our cash requirements are generally for operating activities, debt repayment, capital improvements and acquisitions. We believe that working capital, borrowing capacity available under our credit facilities and funds generated from operations should be sufficient to finance our cash requirements for anticipated operating activities, capital improvements and principal repayments of debt through at least the next twelve months.
Six Months Ended June 30, 2013 Compared to Six Months Ended June 30, 2012
Cash Provided by (Used in) Operating Activities . Cash provided by our operating activities was approximately $1.2 million during the six months ended June 30, 2013, compared to cash used in our operating activities of $1.0 million during the six months ended June 30, 2012. The principal elements of cash provided by operating activities during the six months ended June 30, 2013 were $2.2 million of earnings from continuing operations and $0.8 million of non-cash expenses consisting of depreciation, amortization and stock-based compensation. These sources of cash during the period were partially offset by $1.5 million of cash used for working capital and $0.3 million related to deferred taxes and pension costs.
Cash Provided by (Used in) Investing Activities . Cash used in investing activities during the six months ended June 30, 2013 was approximately $2.4 million, as compared to $1.7 million during the six months ended June 30, 2012. During the six months ended June 30, 2013 our cash used in investing activities increased by approximately $1.4 million for the expansion of our Canadian dry-type transformer manufacturing facility. In addition, during the six months ended June 30, 2013, we used approximately $0.7 million of cash for the acquisition of Power Systems Solutions, Inc. Our uses of cash in investing activities during the six months ended June 30, 2012 included $1.1 million for the purchase of our Canadian dry-type transformer manufacturing facility, and for a $0.3 million loan we made to the developer of a renewable energy project for the purpose of securing a purchase order for our transformers. Additions to our property, plant and equipment in the ordinary course of business were $0.3 million during the six month periods ended June 30, 2013 and June 30, 2012.
Cash Provided by (Used in) Financing Activities . Cash provided by our financing activities was approximately $1.5 million during the six months ended June 30, 2013 and June 30, 2012. During the six months ended June 30, 2013, our cash provided by financing activities included $2.4 million of increased bank overdrafts and borrowings under our revolving credit facilities, offset by principal payments of $0.9 million on our long-term debt. During the six months ended June 30, 2012, bank overdrafts and borrowings under our revolving credit facilities provided cash of $1.4 million, new borrowings of long-term debt provided cash of $1.1 million, and we made scheduled principal repayments on our long-term debt of $1.0 million.
Working Capital . As of June 30, 2013, we had net working capital of $5.8 million, including $0.8 million of cash and equivalents, compared to net working capital of $6.9 million, including $0.5 million of cash and equivalents at December 31, 2012. Our current assets were approximately 1.3 times our current liabilities at June 30, 2013, and at December 31, 2012. At June 30, 2013 and December 31, 2012, we had $4.6 million and $4.7 million, respectively, of available and unused borrowing capacity from our revolving credit facilities. However, the availability of this capacity under our revolving credit facilities is subject to restrictions on the use of proceeds and is dependent upon our ability to satisfy certain financial and operating covenants, including financial ratios.
Year Ended December 31, 2012 Compared to the Year Ended December 31, 2011
Cash Provided by (Used in) Operating Activities. Our operating activities generated cash flow of $2.4 million during the year ended December 31, 2012, as compared to cash flow from operating activities of $1.6 million during the year ended December 31, 2011. The $0.8 million increase in our operating cash flow during 2012 was primarily due to our improved earnings from continuing operations, for the reasons described above, together with a reduction in cash used by our former wind energy business, the discontinuation of which we announced on September 30, 2011. The principal elements of cash flow from operating activities during 2012 were net earnings from continuing operations of $3.2 million, plus $1.8 million of non-cash expenses consisting of depreciation, amortization and stock-based compensation, less $2.3 million of cash used for working capital to support our revenue growth, $0.2 million of cash used by discontinued operations and $0.1 million related to deferred taxes and pension expense.
| 38 |
Cash Provided by (Used in) Investing Activities . Cash used in our investing activities during the year ended December 31, 2012 was approximately $2.4 million, as compared to $9.5 million during the year ended December 31, 2011. During 2012, our cash used in investing activities included the purchase and current expansion of the property comprising our Canadian dry-type transformer manufacturing facility for approximately $1.4 million. Also during 2012, we made a second loan installment of $0.3 million to the developer of a renewable energy project for the purpose of securing a purchase order for our transformers. Additions to our property, plant and equipment in the ordinary course of business were $0.7 million during the year ended December 31, 2012. During 2011, we used approximately $7.8 million to acquire Bemag Transformer Inc., including the machinery and equipment assets of its former U.S. affiliate, Vermont Transformer, Inc. We also made additions to our property, plant and equipment of $1.4 million, consisting primarily of expenditures to complete the expansion of our liquid-filled transformer facility in Quebec, as well as logistics and installation costs related to the assets we acquired from Vermont Transformer, Inc. In 2011, we made the first $0.3 million loan installment to the renewable energy project developer referred to above.
Cash Provided by (Used in) Financing Activities. Cash used in our financing activities was approximately $1.0 million during the year ended December 31, 2012, as compared to $8.8 million of cash provided by financing activities during the year ended December 31, 2011. During the 2012 period, the net decrease in our outstanding borrowings reflected the combination of $2.4 million of scheduled term loan amortization and the payoff of all our U.S. bank term debt that was due, approximately $1.1 million of cash flow used to pay down our revolving credit facilities, offset by $2.5 million of new term loan borrowings used to purchase one of our Canadian facilities and to finance existing equipment at our Mexico location. During the 2011 period, we obtained $10.0 million of new long-term borrowings under our Canadian credit facilities for acquisitions and major capital projects. Offsetting this increase in our long-term debt, we used $3.7 million of cash to repay, rather than assume, the debt of Bemag Transformer Inc. ($2.8 million), as well as to make principal payments on the debt of our other subsidiaries. In addition, during the year ended December 31, 2011, our short term bank borrowings and overdrafts increased by $2.5 million.
Working Capital. As of December 31, 2012, we had net working capital of $6.5 million, including $0.5 million of cash and equivalents, compared to net working capital of $3.8 million, including $1.4 million of cash and equivalents at December 31, 2011. Our current assets were 1.3 times our current liabilities at December 31, 2012, as compared to 1.2 times at the end of the prior year. At December 31, 2012 and 2011, we had $4.7 million and $4.8 million, respectively, of available and unused borrowing capacity from our revolving credit facilities. However, the availability of this capacity under our revolving credit facilities is subject to restrictions on the use of proceeds and is dependent upon our ability to satisfy certain financial and operating covenants, including financial ratios.
Credit Facilities and Long-Term Debt
Canadian Credit Facilities . Our Canadian subsidiaries have maintained credit facilities with Bank of Montreal since October 2009. In June 2011, Pioneer Electrogroup Canada Inc., our wholly owned subsidiary and the parent company of all our active subsidiaries in Canada entered into a letter loan agreement with Bank of Montreal (the “Canadian Facilities”) that replaced and superseded all of our prior financing arrangements with the bank.
Our Canadian Facilities provide for up to $23.0 million Canadian dollars (“CAD”) (approximately $22.6 million expressed in U.S. dollars) consisting of a $10.0 million CAD demand revolving credit facility (“Facility A”) to finance ongoing operations, a $2.0 million CAD term credit facility (“Facility B”) that financed a plant expansion, a $10.0 million CAD term credit facility (“Facility C”) to finance acquisitions, capital expenditures or to provide funding to our U.S. corporations, a $50,000 CAD Corporate MasterCard credit facility and a $1.0 million CAD foreign exchange settlement risk facility.
| 39 |
The Canadian Facilities require us to comply on a consolidated Canadian basis with various financial covenants, including maintaining a minimum fixed charge coverage ratio, a maximum funded debt to EBITDA ratio and a limitation on funded debt as a percent of capitalization.
Facility A is subject to margin criteria and borrowings bear interest at Bank of Montreal’s prime rate plus 0.50% per annum on amounts borrowed in Canadian dollars, or its U.S. base rate plus 0.50% per annum or LIBOR plus 2.00% per annum on amounts borrowed in U.S. dollars.
Borrowings under Facility B bear interest at Bank of Montreal’s prime rate plus 1.00% per annum with principal repayments becoming due on a five year amortization schedule.
Borrowings under Facility C are repayable according to a five year principal amortization schedule and bear interest at the following rates: if the funded debt to EBITDA ratio is equal to or greater than 2.00, Bank of Montreal’s prime rate plus 1.25% per annum on amounts borrowed in Canadian dollars, or its U.S. base rate plus 1.25% per annum or LIBOR plus 2.50% per annum on amounts borrowed in U.S. dollars; or, if the funded debt to EBITDA ratio is less than 2.00, Bank of Montreal ’s prime rate plus 1.00% per annum on amounts borrowed in Canadian dollars, or its U.S. base rate plus 1.00% per annum or LIBOR plus 2.25% per annum on amounts borrowed in U.S. dollars. In addition, Facility C is subject to a standby fee which is calculated monthly using the unused portion of the facility at either 0.625% per annum if the funded debt to EBITDA ratio is equal to or greater than 2.00, or 0.5625% per annum if the funded debt to EBITDA ratio is less than 2.00.
On June 28, 2013, Pioneer Electrogroup Canada Inc. and certain subsidiary guarantors amended and restated the letter loan agreement with Bank of Montreal in order to, among other things, provide an additional six months to borrow any amounts not already drawn from Facility C. We also entered into a guaranty agreement to guarantee the obligations under the amended and restated letter loan agreement.
As of June 30, 2013, we had approximately $10.2 million in U.S. dollar equivalents outstanding under our Canadian Facilities and were in compliance with our financial covenant requirements. Our borrowings consisted of approximately $0.9 million outstanding under Facility A, $1.3 million outstanding under Facility B and $8.0 million outstanding under Facility C.
United States Credit Facilities . Our Jefferson Electric, Inc. subsidiary had a loan agreement with Johnson Bank that included a revolving credit facility with a borrowing base limit of $6.0 million. Effective as of October 31, 2012, the credit facility was extended for an additional year, with interest ranging from 2.25% to 3.50% above one month LIBOR, depending on Jefferson Electric, Inc.’s debt service coverage ratio.
On June 28, 2013, in connection with entering into a credit agreement with Bank of Montreal, Chicago Branch (the “U.S. Facilities”), we repaid all amounts outstanding under the Johnson Bank facility. The U.S. Facilities consist of a $10.0 million demand revolving credit facility that was used to repay Johnson Bank and will be used to finance ongoing operations; and a $6.0 million term loan facility, with principal repayments becoming due on a five year amortization schedule, that is to be used to finance certain permitted acquisitions by us and our subsidiaries.
The U.S. Facilities require our U.S. operations to comply with various financial covenants, including maintaining minimum fixed charge coverage ratios, a maximum funded debt to capitalization ratio and maximum funded debt to adjusted EBITDA ratios. The U.S. Facilities also restrict our ability to incur indebtedness, create or incur liens, make investments, make distributions or dividends and enter into merger agreements or agreements for the sale of any or all our assets.
| 40 |
Borrowings under the demand revolving credit facility bear interest, at our option, at the bank’s prime rate plus 1.00% per annum on U.S. prime rate loans, or an adjusted LIBOR rate plus 2.25% per annum on Eurodollar loans. Borrowings under the term loan facility bear interest, at our option, at the bank’s prime rate plus 1.25% per annum on U.S. prime rate loans, or an adjusted LIBOR rate plus 2.50% per annum on Eurodollar loans. In addition, the term loan facility is subject to a standby fee from June 28, 2013 to December 28, 2013, which is calculated monthly, using the unused portion of the facility, at a rate of 0.625% per annum.
Our obligations under the U.S. Facilities are guaranteed by our wholly-owned U.S. subsidiaries, Pioneer Critical Power Inc. and Jefferson Electric, Inc. In addition, we and our wholly-owned U.S. subsidiaries granted a security interest in substantially all of our assets, including 65% of the shares of Pioneer Electrogroup Canada Inc. held by us, to secure our obligations for borrowed money under the U.S. Facilities.
As of June 30, 2013, we had approximately $5.5 million outstanding under the demand revolving credit facility, the term loan facility was undrawn and were in compliance with its financial covenant requirements.
Nexus Promissory Note . On July 25, 2012, Nexus Magneticos de Mexico, S. de R.L. de C.V., a subsidiary of Jefferson Electric, Inc., entered into a $1.7 million term loan agreement with GE CF Mexico, S.A. de C.V. The term loan from GE CF Mexico, S.A. de C.V. is payable in 60 consecutive monthly installments and bears interest, payable monthly, at a rate of 6.93% per annum. We provided a guaranty to GE CF Mexico, S.A. de C.V. of all of Nexus Magneticos de Mexico, S. de R.L. de C.V.’s obligations under the term loan agreement. As of June 30, 2013, there was approximately $1.2 million outstanding.
Capital Lease Obligations . As of March 31, 2013, the principal amount of equipment loans and capital lease obligations we had outstanding was immaterial. These equipment loans and capital lease obligations are scheduled to be repaid in full by December 2013.
Capital Expenditures
In June 2012, we completed the acquisition of the land and building comprising our dry-type transformer facility in Canada at a cost of approximately $1.1 million. We recently completed construction to expand the location’s manufacturing floor space by approximately 16,000 square feet. Including the cost of new machinery and equipment to be purchased, the capital budget for the entire expansion project is approximately $1.9 million, all of which is expected to be disbursed before the end of 2013. Otherwise, we have no major future capital projects planned, or significant replacement spending anticipated during 2013.
Factors That May Affect Future Operations
We believe that our future operating results will continue to be subject to quarterly variations based upon a wide variety of factors, including the cyclical nature of the electrical equipment industry and the markets for our products and services. Our operating results could also be impacted by a weakening of the Canadian dollar, changing customer requirements and exposure to fluctuations in prices of important raw supplies, such as copper, steel and aluminum. We attempt to minimize increases resulting from fluctuations in supply costs through the inclusion of escalation clauses with respect to commodities in our customer contracts. In addition to these measures, we attempt to recover other cost increases through improvements to our manufacturing efficiency and through increases in prices where competitively feasible. Lastly, other economic conditions we cannot foresee may affect customer demand. We predominately sell to customers in the utility, industrial production and commercial construction markets. Accordingly, changes in the condition of any of our customers may have a greater impact than if our sales were more evenly distributed between different end markets. For a further discussion of factors that may affect future operating results see the sections entitled “Risk Factors” and “Cautionary Note Regarding Forward-Looking Statements.”
Off Balance Sheet Transactions and Related Matters
We have no off-balance sheet transactions, arrangements, obligations (including contingent obligations), or other relationships with unconsolidated entities or other persons that have, or may have, a material effect on our financial condition, changes in financial condition, revenues or expenses, results of operations, liquidity, capital expenditures or capital resources.
New Accounting Pronouncements
The information required by this Item is provided in “Note 2. Summary of Significant Accounting Policies” to our audited financial statements for the year ended December 31, 2012 included in this prospectus.
| 41 |
Recent Accounting Pronouncements
In December 2011, the FASB issued Update No. 2011-11, “Balance Sheet (Topic 210): Disclosures about Offsetting Assets and Liabilities”. The objective of this Update is to provide enhanced disclosures that will enable users of its financial statements to evaluate the effect or potential effect of netting arrangements on an entity’s financial position. This includes the effect or potential effect of rights of setoff associated with an entity’s recognized assets and recognized liabilities within the scope of this Update. The amendments require enhanced disclosures by requiring improved information about financial instruments and derivative instruments that are either (1) offset in accordance with either Section 210-20-45 or Section 815-10-45 or (2) subject to an enforceable master netting arrangement or similar agreement, irrespective of whether they are offset in accordance with either Section 210-20-45 or Section 815-10-45. ASU 2011-11 is effective for annual reporting periods beginning on or after January 1, 2013, and interim periods within those annual periods. Retrospective disclosure is required for all comparative periods presented.
In December 2011, the FASB issued Update No. 2011-12, “Comprehensive Income (Topic 220): Deferral of the Effective Date for Amendments to the Presentation of Reclassifications of Items Out of Accumulated Other Comprehensive Income in Accounting Standards Update No. 2011-05”. The amendments in this Update supersede changes to those paragraphs in Update 2011-05 that pertain to how, when, and where reclassification adjustments are presented.
In July 2012, the FASB has issued Update No. 2012-02, “Intangibles—Goodwill and Other (Topic 350): Testing Indefinite-Lived Intangible Assets for Impairment”. This Update states that an entity has the option first to assess qualitative factors to determine whether the existence of events and circumstances indicates that it is more likely than not that the indefinite-lived intangible asset is impaired. If, after assessing the totality of events and circumstances, an entity concludes that it is not more likely than not that the indefinite-lived intangible asset is impaired, then the entity is not required to take further action. However, if an entity concludes otherwise, then it is required to determine the fair value of the indefinite-lived intangible asset and perform the quantitative impairment test by comparing the fair value with the carrying amount. An entity also has the option to bypass the qualitative assessment for any indefinite-lived intangible asset in any period and proceed directly to performing the quantitative impairment test. An entity will be able to resume performing the qualitative assessment in any subsequent period. The amendments in this Update are effective for annual and interim impairment tests performed for fiscal years beginning after September 15, 2012. Early adoption is permitted, including for annual and interim impairment tests performed as of a date before July 27, 2012, if a public entity’s financial statements for the most recent annual or interim period have not yet been issued.
| 42 |
Overview
We manufacture specialty electrical equipment and provide a broad range of custom-engineered and general purpose electrical transformers and switchgear for applications in the utility, industrial and commercial segments of the electrical transmission and distribution industry. We are headquartered in Fort Lee, New Jersey and operate from eight additional locations in the U.S., Canada and Mexico for manufacturing, centralized distribution, engineering, sales and administration.
Our largest customers, which include a number of recognized national and regional utilities and industrial companies, are located in North America. In addition, we sell our products through hundreds of electrical distributors served by our network of 14 independently-operated stocking locations throughout the U.S. and Canada. We intend to grow our business, both through acquisitions and internal product development, by increasing the scope of highly-engineered solutions we offer our customers for their specific electrical applications.
Recent Events
On March 6, 2013, we acquired Power Systems Solutions, Inc., a Minneapolis-based provider of paralleling switchgear, transfer switches and engine generator control systems. We intend to make significant new investments in this area of our electrical business, increasing our penetration into markets for emergency backup power and distributed generation products.
On August 19, 2013, we acquired a substantial portion of the assets comprising the business of Pico Electrical Equipment, Inc. and Pico Metal Products, Inc., a Los Angeles-based manufacturer of electrical switchboards, panelboards and custom electrical enclosures.
Products
We design, develop, manufacture and sell a wide range of electrical transmission and distribution equipment comprising two product categories – electrical transformers and switchgear and switchboard apparatus products. Our emphasis within these product categories is to provide custom engineered, manufactured to order equipment, which we estimate currently represents approximately two-thirds of our revenue. We believe that demand for our custom solutions is driven primarily by end user maintenance programs to repair, replace or retrofit aging equipment, as well as to upgrade or expand their electrical distribution system to accommodate growth and other changes in their operations. The remaining one-third of our consolidated revenue is currently derived from transformers we manufacture primarily to stock and which are used for general purpose applications, primarily in commercial construction.
Overview of Electrical Transformers
Our liquid-filled and dry-type power, distribution and specialty electrical transformers are magnetic products used in the control and conditioning of electrical current for critical processes. An electric transformer is used to reduce or increase the voltage of electricity traveling through a wire. This increase or decrease in voltage is accomplished by transferring electric energy from one internal coil or winding to another coil through electromagnetic induction. Electric power generating plants use generator transformers to “step-up,” or increase, voltage that is transferred through power lines in order to transmit the electricity more efficiently and over long distances. When the high voltage electricity nears its final destination, a “step-down” transformer reduces its voltage. A distribution transformer makes a final step-down in voltage to a level usable in businesses and homes.
Transformers are integral to every electrical transmission and distribution system. Electric utilities use transformers for the construction and maintenance of their power networks. Industrial firms use transformers to supply factories with electricity and to distribute power to production machinery. The renewable energy industry uses transformers to connect new sources of electricity generation to the power grid. The construction industry uses transformers for the supply of electricity to new homes and buildings and original equipment manufacturers use custom transformers as a component part of the systems they make.
| 43 |
Our operating subsidiaries distinguish themselves by producing a wide range of engineered-to-order and standard equipment, sold either directly to end users, through engineering and construction firms or through electrical distributors. We serve customers in a variety of industries including electric utilities, industrial customers, information technology companies, commercial construction companies and renewable energy producers.
Liquid-Filled Transformers
Our liquid-filled transformer products are manufactured by our wholly-owned subsidiary, Pioneer Transformers Ltd. Liquid-filled transformers are typically used for applications requiring utility or industrial-level electrical loads, such as in a substation, and are most commonly found in outdoor settings given the risk of leakage and flammable properties of the liquid coolant. We manufacture these products in electrical power ranges from 25 kVA (kilovolt amperes) to 30 MVA (megavolt amperes) and at up to 69 kV (kilovolts) in voltage. In recent years, we have focused primarily on the small power market, generally considered to include transformers between 1 MVA and 10 MVA, as well as on specialty transformers such as network and submersible models used by utilities to ensure reliability of service. We sell these products to electrical utilities, independent power providers, electrical co-ops, industrial companies, commercial users and electric equipment wholesalers. Our primary categories of liquid-filled transformers are as follows:
| Transformer Type | Range of Sizes | Applications | ||
| Small and Medium Power | 300 kVA to 30 MVA | Power conversion for the utility, industrial and commercial markets, typically found in electrical substations | ||
| Network | 300 kVA to 3.75 MVA | Subway and vault-type transformers designed to withstand harsh environments and typically used by utilities and municipal power authorities to ensure reliability of service | ||
| Pad-Mount | 75 kVA to 10 MVA | Distribution transformers commonly used in underground power or distribution systems and in wind farm power projects | ||
| Unitized Pad-Mount | Up to 5 MVA | Combines pad-mounts with other equipment in a product that can be substituted for conventional unit substations at apartment complexes, shopping centers, hospitals and similar commercial facilities | ||
| Mini-Pad | 25 kVA to 167 kVA | Single phase, low profile pad-mounted distribution transformers for residential and underground distribution | ||
| Platform-Mount | 250 kVA to 2.5 MVA | Single phase units from 250 kVA to 1 MVA, also supplied for substation installation up to 2.5 MVA |
Dry-Type Transformers
Our dry-type transformer products are manufactured by our wholly-owned subsidiaries, Jefferson Electric, Inc. and Bemag Transformer Inc. Our product scope includes over 3,500 standard designs for low voltage distribution transformers, equipment which is typically used indoors to provide power to commercial and industrial machines and equipment requiring 50 VA through 1 MVA of power transformation capacity in voltages at or below 600 V (volts). In our medium voltage and power-dry product classes, our range extends to 10 MVA in capacity and from 600 V to 35kV in voltage. Medium voltage and power-dry transformers are used in metropolitan areas and are increasingly being used for industrial applications, such as in mining and oil drilling. They are well-suited to operate in outdoor or harsh environments and in situations where the transformer needs to be installed close to the area where the electricity will ultimately be used. Our primary categories of dry-type transformers are as follows:
| 44 |
| Transformer Type | Range of Sizes | Applications | ||
| Medium Voltage | 30 kVA to 10 MVA | Available in standard and custom designs in voltages from 208 to 35,000 volts. Common applications include offshore drilling and mining | ||
| Ventilated Single & Three Phase |
25 kVA to 100 kVA 15 kVA to 1 MVA |
Ventilated transformers designed for general loads, indoors or out, including for lighting, data centers, industrial and commercial applications | ||
| Encapsulated Single & Three Phase |
50 VA to 50 kVA 3 kVA to 75 kVA |
General purpose encapsulated transformers for lighting, industrial and commercial applications. Suitable for indoor or outdoor use | ||
| Floor Mount Encapsulated | 30 kVA to 75 kVA | For all general loads in rugged environment areas including refineries, factories, chemical plants, marine duty, ship docks, and grain mills | ||
| Buck Boost Transformers | 50 VA to 10 kVA | Single phase transformers for correcting voltage line drops, landscape lighting, low voltage lighting, international voltage adaptation and motor applications | ||
| Non-Linear Transformers | 15 kVA to 300 kVA | Jefferson Plus™ line of non-linear transformers are designed to meet the load demands caused by computers and other electronic office equipment | ||
| Other Transformers | Various size ranges | Drive isolation, industrial control and custom designed transformers, lighting ballasts, reactors, filters and associated other parts |
Switchgear and Switchboard Apparatus Products
There are many different classes of switchgear, a term which refers to a system of electrical disconnects, fuses and circuit breakers whose general function is to distribute, monitor and control the flow of electrical energy, while isolating and protecting critical equipment such as transformers, motors and other machinery. The primary function of our switchgear is to reliably switch the power source to the load, protect and operate the power generation source(s), meter output and provide paralleling and load sharing capability between multiple on-site power sources and the utility grid.
Our Pioneer Critical Power Inc. subsidiary is focused on paralleling switchgear (PSG), products that are an integral component to ensuring optimal power generation and electrical distribution system performance, both for primary and backup power installations. These installations typically include data centers, hospitals, industrial facilities, office complexes, remote locations not connected to the power grid and other sites where emergency backup power sources are a necessity to protect operations from the consequences of power outages. Our focus is on larger installations where a single generator is not sufficient or where multiple generator sets may be required to provide system resilience. We believe that our PSG customer solutions represent a scalable, cost-effective and intelligent automation option through their embedded programming and logic to synchronize multiple on-site power sources, and the capability to operate them in concert with the utility feed(s).
Our Pioneer CEP business unit, established through an acquisition in August 2013, is primarily focused on manufactured-to-order, low voltage electrical switchboards and panelboards, mostly for the Southern California market. Pioneer CEP’s equipment is typically used to provide circuit protection for shopping centers, office towers and in other commercial and light industrial applications. We sell these products primarily through electrical distributors and our concentration is on applications requiring electrical and/or mechanical customization, as well as on meeting expedited delivery requirements of customers.
Business Strategy
We believe we have established a stable platform from which to develop and grow our business lines, revenues, earnings and shareholder value. We intend to expand rapidly over the next several years through a two-pronged strategy. First, we are focused on internal growth through operating efficiencies, customer focus and our continued migration towards more highly-engineered products and specialized services. We intend to significantly increase the percentage of our sales derived from engineered-to-order products and believe this can be accomplished by targeting market segments, such as data centers and renewable energy, which have growth characteristics exceeding the norm in our industry. The second element of our growth strategy is to pursue strategic acquisitions that provide us with complementary product and service offerings, new sales channels, end-markets and scalable operations.
| 45 |
Internal Growth
We intend to build our revenue and earnings at rates exceeding industry norms by continuing our sales and product mix advancement towards more highly valued, specialized products. We intend to accomplish this goal within our liquid-filled transformer business by emphasizing the sale of more small and medium power, network and subsurface transformers to new and existing utility customers, particularly in the U.S. In 2012, we completed an expansion of our Granby, Quebec facility to increase our manufacturing capacity for these more sophisticated products.
We expect our internal growth objectives for dry-type transformers to be met primarily through the 2011 addition of medium voltage units to our customer offering. During 2012, we purchased the land and building in Farnham, Quebec where these products are manufactured as part of our plan to add 16,000 square feet of production space dedicated entirely to these products. The building expansion is complete and we believe the new production space will be fully operational during the fourth quarter of 2013. In addition, we intend to meet our growth objectives by expanding the geographic coverage, productivity and range of products available through our national distribution network, as well as by continuing to expand our direct sales channel with original equipment manufacturers (OEMs) and brand label customers.
Acquisitions
We believe a disciplined acquisition program is a key component to accelerating our growth and we intend to acquire businesses that broaden the range of customer solutions we provide, increase our market share or expand our geographic reach. In addition to transformer and switchgear manufacturers, we also intend to acquire producers of other technically-advanced, customized, ancillary or complementary products that address market segments where we seek further penetration — such as in data centers, rail transportation, mining, oil drilling and refining, backup power and renewable energy. We operate in a highly fragmented industry that is served by a few global diversified electrical equipment manufacturers and numerous small manufacturing companies that provide niche products and services to various sub-segments of the power transmission and distribution market. We favor candidates that have competencies and business characteristics similar to our own, and those that we expect will benefit from some of the major trends affecting our industry. Our acquisitions since 2010 of Jefferson Electric, Inc., Bemag Transformer Inc., Power Systems Solutions, Inc. and Pico Electrical Equipment, Inc. are examples of the implementation of our acquisition strategy.
Our Industry
The market for electric transmission and distribution (T&D) equipment is large and has grown over the last several decades. According to a May 2013 study by The Freedonia Group, a market research firm, total U.S. demand for electric T&D equipment was $24.0 billion in 2012 and was distributed by product category as follows: switchgear and switchboard apparatus (54%), transformers (34%), meters (6%) and pole/transmission line hardware (6%). The Freedonia Group forecasts demand to climb 4.8% annually to $30.4 billion in 2017, as compared to 2.2% annually between 2007 and 2012, driven by rising utilization of renewable energy sources and increasing demand from the industrial and non-utility generator markets.
Most of our business today consists of manufacturing power, distribution and non-utility transformers. Utilities purchase transformers to replace old equipment, maintain system reliability, achieve efficiency improvements and for grid expansion. Demand is also sensitive to overall economic conditions, particularly with respect to the level of industrial production and investment in commercial and residential construction. Other market demand factors include voltage conversion, voltage unit upgrades, electrical equipment failures, higher energy costs, stricter environmental regulations and investment in sources of renewable and distributed energy generation.
According to the Freedonia Group report, total demand for transformers is forecast to grow from $8.1 billion in 2012 to approximately $10.3 billion by 2017. Based on the classes of transformers surveyed by the market research firm, we estimate that our product portfolio addresses a $4.7 billion U.S. market (in 2012) which is expected to grow to $6.1 billion by 2017, or by approximately 5.5% per year. The market for switchgear and related equipment is larger and significantly more complex given the number and classes of products available. We believe that our switchgear and switchboard apparatus products address annual demand of approximately $4.0 billion. We believe several of the key industry trends supporting the growth outlook for our industry are as follows:
| 46 |
| · | Aging and Overburdened North American Power Grid — The aging and overburdened North American power grid is expected to require significant capital expenditures to upgrade the existing infrastructure over the next several years to maintain adequate levels of reliability and efficiency. According to the North American Electric Reliability Corp. (NERC), Level 5 Transmission Load Relief (TLR) events, which are triggered when power outages are imminent or in progress, grew at a 27% compounded annual growth rate from 2002 to 2012. These events demonstrate the current power grid’s inadequate capacity to accommodate all requests for reliable power. Significant capital investment will be required to relieve congestion, meet growing demand, achieve targets for efficiency, emissions and use of renewable sources and to replace components of the U.S. power grid operating at, near or past their planned service lives. |
| · | Increasing Long-Term Demand for Electricity and Reliable Power — The Department of Energy’s Energy Information Administration, or EIA, forecasts that total electricity use in the U.S. will increase by approximately 28% from 2011 to 2040. This increase is driven by anticipated population growth, economic expansion, increasing dependence on computing power throughout the economy and the increased use of electrical devices in the home. In order to meet growing demand for electricity in North America, substantial investment in increased electrical grid capacity and efficiency will be required, as well as the addition of specialized equipment to help ensure the reliability and quality of electricity for critical applications. In response to these challenges, there is an increasing trend among commercial and industrial companies to invest in on-site power sources, both for standby purposes in the event of a catastrophic power outage, or to reduce the amount of electricity they draw from the utility grid during peak periods. |
| · | Growth in Critical Power Applications and the Data Center Market — The number of mission-critical facilities, sites where a power disturbance or outage could cause failure of business operations, safety concerns or regulatory non-compliance, continues to grow exponentially worldwide. In the U.S., the single largest driver for demand in critical power applications is the data center market, followed by the health care industry. The amount of information managed by data centers is expected to grow by a factor of 50 over the next decade, according to General Electric, fueling increasing needs for data storage (for corporate data, content delivery, social networking, handheld devices, online retail and gaming) and the information technology evolution (cloud computing and outsourced hosting). The 2012 DatacenterDynamics Industry Census projects that global investment in data centers will increase 14.5% in 2013 to $120 billion. Much of this growth will be for spending in the electrical sector, including switchgear, uninterruptible power supplies and generators, systems that typically represent over 40% of data center development cost. Coinciding with demand for mission-critical facilities is the need for efficient, reliable primary power to support their essential applications, and for backup generator plants in case the utility feed becomes unavailable. Electricity is the highest operating cost of a data center, a factor supporting investment in on-site alternative energy systems to reduce peak-demand expenses. These systems require paralleling switchgear, such as we provide, operated by hardware embedded with sophisticated programming and logic to synchronize multiple power sources reliably and efficiently. |
| · | Greater Adoption of Renewable Power Sources — Many North American federal, state, provincial, and local governments have enacted or are considering legislation and regulations aimed at increasing energy efficiency and encouraging expansion of renewable energy generation. In particular, 29 states and the District of Columbia have adopted mandatory renewable portfolio standards, or RPS, which require utilities to supply a specified percentage of their electricity from renewable sources. In the long term, the EIA forecasts that renewable energy generation capacity additions will account for 32% of overall growth in electricity generation from 2011 to 2040. We believe these factors will drive investment growth in infrastructure to transport and integrate electricity from various sources within the transmission and distribution grid, as well as increased spending on products we manufacture for the on-site conversion and distribution of power from wind, solar and non-renewable energy plants. |
| 47 |
The market for electrical transmission and distribution equipment is very fragmented due to the range of sizes, voltages and technological standards required by different categories of end users for their specific applications. Many orders are custom-engineered and tend to be time-sensitive since other critical work is frequently being coordinated around the customer’s electrical equipment installation. The vast majority of North American demand for transmission and distribution is satisfied by producers in the U.S. and Canada. According to industry reports by IBISWorld Inc., there are over 2,400 electrical equipment manufacturers in North America, of which we believe at least 200 manufacture products similar to ours.
Customers
In 2012, approximately 62% of our sales were to Canadian customers, including many of Canada’s electrical utilities, municipal power systems, large industrial companies, engineering and construction firms and a number of electrical distributors. Another 36% of our sales in 2012 were to U.S. customers, represented in large part by companies involved in commercial construction. The remaining 2% of our sales were to export customers primarily serving the Central and Latin American markets. We sold our electrical transformers to approximately 1,900 individual customers in 2012 and our twenty five largest customers represented approximately 67% of our consolidated revenue.
We have a significant number of repeat customers and long-standing relationships with engineering, procurement and construction (EPC) firms hired by end-users to select products such as ours. Our customers order from us as their needs may require, and the level of such orders may change significantly from period to period based on changes in the scheduling of their projects or size of their capital budget. Despite these factors causing variability in our revenue, our repeat order frequency has been very consistent from year to year. Approximately 89% of our revenue in 2012 originated from customers who also ordered from us in 2011.
Approximately 19% and 21% of our sales in 2012 and 2011, respectively, were made to Hydro-Quebec Utility Company, a provincial government-owned utility in the Province of Quebec, Canada. The majority of our sales to Hydro-Quebec Utility Company are made pursuant to a long-term contract for the supply of pad-mount transformers that was renewed in 2010, at which time we were also awarded an additional contract by Hydro-Quebec Utility Company for the supply of submersible transformers. Both contracts had two-year initial terms that expired during the second quarter of 2012, and two one-year renewal options at Hydro-Quebec Utility Company’s option that provided for a maximum term of four years each. In February 2013, Hydro-Quebec Utility Company exercised its last remaining option to extend each contract by another year, to April 2014. The contracts set forth the terms, conditions and rights of the parties with respect to the supply of the subject products including ordering and delivery procedures, required technical specifications, minimum performance standards, product pricing and price adjustment mechanisms, terms of payment and rights of termination. The contracts do not require Hydro-Quebec Utility Company to order any minimum quantity of products from us and do not grant us any form of supply exclusivity. Hydro-Quebec Utility Company has been a customer of ours and our predecessors for approximately 45 years, over which time we have been party to consecutive long-term contracts for an uninterrupted period spanning several decades. We believe the status of our business relationship with Hydro-Quebec Utility Company to be good.
In addition, Siemens Industry, Inc. and its affiliated companies accounted for 12% and 11% of our consolidated sales in 2012 and 2011, respectively, primarily through purchases from our Jefferson Electric, Inc. subsidiary. Our pricing agreement with Siemens Industry, Inc. does not obligate Siemens Industry, Inc. to purchase transformers from us in quantities consistent with the past or at all. While the loss of a significant number of customers would have a material adverse effect on our business, aside from Hydro-Quebec Utility Company and Siemens Industry, Inc., we do not believe that the loss of any specific customer would have a material adverse effect on our business.
Marketing, Sales and Distribution
A substantial portion of the transformers manufactured by us, and most of the switchgear products we offer, are sold directly to customers by our 21 full-time sales personnel and 5 members of our executive management team operating from our office locations in the U.S. and Canada. Our products are also sold through our network of approximately 50 independent sales agencies throughout North America that sell primarily to full-line electrical distributors and to maintenance, repair and overhaul organizations. Our direct sales force markets to end users and to third parties, such as original equipment manufacturers and engineering firms that prescribe the specifications and parameters that control the applications of our products.
| 48 |
Sales Backlog
Backlog reflects the amount of revenue we expect to realize upon the shipment of customer orders for our products that are not yet complete or for which work has not yet begun. Our sales backlog as of June 30, 2013 was approximately $24.4 million, as compared to $23.6 million as of December 31, 2012. We anticipate that most of our current backlog will be delivered during 2013. Orders included in our sales backlog are represented by customer purchase orders and contracts that we believe to be firm.
Competition
We experience intense competition from a large number of electrical equipment manufacturers and from distributors of such equipment. The number and size of our competitors varies considerably by product line, with many of our competitors tending to be small, highly specialized or focused on a certain geographic market area or customer. However, several of our competitors have substantially greater financial and technical resources than us, including some of the world’s largest electrical products companies. A representative list of our competitors includes ABB Ltd., Actuant Corporation, Carte International, Inc., Eaton Corporation plc, Emerson Electric Company, General Electric Company, Schneider Electric SA, Hammond Power Solutions Inc., Howard Industries, Inc., Partner Technologies, Inc. and Russelectric Inc.
We believe that we compete primarily on the basis of technical support and application expertise, engineering and manufacturing capabilities, equipment rating, quality, scheduling and price. In all our electrical equipment businesses, our objective is to focus our efforts on more specialized, proprietary and complex applications. Accordingly, a critical element to the success of our business is responsiveness and flexibility in providing custom-engineered solutions to satisfy customer needs. We believe that our strongest product niches are in the manufacture and design of small power and distribution electrical transformers and in custom-engineered paralleling switchgear for on-site power applications serving data centers, hospitals and other businesses with critical power needs. As a result of our long-time presence in the industry, we possess a number of special designs and libraries of programming code for our equipment that were engineered and developed specifically for our customers. We believe these factors give us a competitive advantage and that they are a major contributor to our frequency of repeat customer orders and the longevity of our customer relationships.
Raw Materials and Suppliers
The principal raw materials purchased by us are core steel, copper wire, aluminum strip and insulating materials including transformer oil. We also purchase certain electrical components from a variety of suppliers including bushings, switches, fuses and protectors. These raw materials and components are available from and supplied by numerous sources at competitive prices, although there are more limited sources of supply for electrical core steel and transformer oil. Unanticipated increases in raw material prices or disruptions in supply could increase production costs and adversely affect our profitability. We attempt to minimize the effect on our profit margins of unanticipated changes in the prices of raw materials by including index clauses in our customer contracts that allow us to increase or reduce our prices if the costs of raw materials unexpectedly rise or decrease. Approximately 44% of our annual sales are made pursuant to contracts that contain such index clauses, which, subject to various formulae and limitations, permit us to adjust the final prices we charge. We do not anticipate any significant difficulty in satisfying our raw material requirements on reasonable terms and have not experienced any such difficulty in the past several years. Our largest suppliers during 2012 included Essex Group, Inc., JFE Shoji Steel America, Inc., Marubeni-Itochu Corporation, Metelec Ltée and Rea Magnet Wire Co. Inc.
Employees
At September 9, 2013, we had 343 employees consisting of 103 salaried staff and 240 hourly workers. We also had six part-time employees. Our hourly employees located at our plant in Farnham, Quebec, Canada are covered by a collective bargaining agreement with a provincial labor union that expired in March 2013. We are in the process of negotiating a new labor agreement with our unionized workforce at this location which may take several months to complete. There can be no assurance that we will be successful in obtaining a new labor agreement, or that the terms of any such agreement will be favorable to us. Our hourly employees located at our plant in Granby, Quebec, Canada are covered by a collective bargaining agreement with the United Steel Workers of America Local 9414 that expires in May 2015. The hourly employees located at our manufacturing facilities in Santa Fe Springs, California and in Reynosa, Mexico are also covered by collective bargaining agreements with local labor unions that have indefinite terms, subject to annual review and negotiation of key provisions. We consider our relationship with our employees to be good.
| 49 |
Environmental
We are subject to numerous environmental laws and regulations concerning, among other areas, air emissions, discharges into waterways and the generation, handling, storing, transportation, treatment and disposal of waste materials. These laws and regulations are constantly changing and it is impossible to predict with accuracy the effect they may have on us in the future. Like many other industrial enterprises, our manufacturing operations entail the risk of noncompliance, which may result in fines, penalties and remediation costs, and there can be no assurance that such costs will be insignificant. To our knowledge, we are in substantial compliance with all federal, state, provincial and local environmental protection provisions, and believe that the future compliance cost should not have a material adverse effect on our capital expenditures, earnings or competitive position. However, legal and regulatory requirements in these areas have been increasing and there can be no assurance that significant costs and liabilities will not be incurred in the future due to regulatory noncompliance.
Corporate History
We were originally formed in the State of Nevada in 2008. On November 30, 2009, we merged with and into Pioneer Power Solutions, Inc., a Delaware corporation, for the sole purpose of changing our state of incorporation from Nevada to Delaware and changing our name to “Pioneer Power Solutions, Inc.” On December 2, 2009, pursuant to a share exchange agreement, we acquired all of the issued and outstanding capital stock of Pioneer Transformers Ltd. and our officers and directors at that time were replaced by designees of Pioneer Transformers Ltd. After the share exchange, we divested all of our pre-share exchange operating assets and succeeded to the business of Pioneer Transformers Ltd. as our sole line of business.
On April 30, 2010, we acquired Jefferson Electric, Inc. through a merger pursuant to which JEI Acquisition, Inc., our wholly-owned subsidiary, merged with and into Jefferson Electric, Inc., with Jefferson Electric, Inc. continuing as the surviving corporation and becoming a wholly-owned subsidiary of ours.
On June 7, 2010, through our wholly-owned subsidiary Pioneer Wind Energy Systems Inc., we acquired substantially all the operating assets of AAER Inc., a manufacturer of wind turbines based in Quebec, Canada. On August 13, 2010, we also purchased common shares representing 100% of the voting and economic interests of AAER Inc., including its residual assets and accumulated operating tax losses. In September 2011, we committed to a plan to wind down our Pioneer Wind Energy Systems Inc. subsidiary, which business has been classified in our financial statements under discontinued operations.
On July 1, 2011, through a Canadian wholly-owned subsidiary of ours, we acquired all the capital stock of Bemag Transformer Inc., a Quebec-based manufacturer of low and medium voltage dry-type transformers and custom magnetics.
On March 6, 2013, through our wholly-owned subsidiary Pioneer Critical Power Inc., we acquired substantially all the assets and assumed certain liabilities of Power Systems Solutions, Inc., a Minneapolis-based provider of paralleling switchgear and engine generator controls used in on-site backup power and distributed generation applications.
On August 19, 2013, our wholly-owned subsidiary Pioneer Custom Electrical Products Corp., or Pioneer CEP, acquired all the machinery and equipment, certain inventory assets and all the intellectual property assets of Pico Electrical Equipment, Inc. and Pico Metal Products, Inc., a Los Angeles-based manufacturer of electrical switchboards, panelboards and custom electrical enclosures.
| 50 |
Properties
| Location | Description | Approximate Square Footage |
Owned
or Expiration Date | |||
| Granby, Quebec | Manufacturing and administration | 50,000 | Owned | |||
| Farnham, Quebec | Manufacturing and administration | 69,000 | Owned | |||
| Reynosa, Mexico | Manufacturing | 52,000 | March 2016 | |||
| Pharr, Texas | Distribution warehouse | 22,000 | (1) | |||
| Franklin, Wisconsin | Sales, marketing, engineering and administration | 5,000 | December 2013 | |||
| Brooklyn Park, Minnesota | Manufacturing, sales, engineering and administration | 16,000 | March 2016 | |||
| Mississauga, Ontario | Sales and engineering | 1,400 | July 2016 | |||
| Santa Fe Springs, California | Manufacturing, sales, engineering and administration | 40,000 | August 2018 | |||
| Fort Lee, New Jersey | Corporate management and sales office | 1,200 | July 2015 |
| (1) | The lease for our distribution warehouse in Pharr, Texas expired in August 2013 and we are in the process of negotiating a new lease agreement. While we negotiate this new lease agreement, we continue to use the warehouse facility on a month-to-month basis. |
We believe our manufacturing and distribution facilities are well maintained, in proper condition to operate at higher than current levels and are adequately insured. We do not anticipate significant difficulty in renewing or extending existing leases as they expire, or in replacing them with equivalent facilities or office locations. Of the owned properties, both are subject to encumbrances with a bank, in amounts that we do not believe are material to our operations.
Legal Proceedings
We are not presently a party to any material legal proceedings nor are we aware of any such threatened or pending litigation.
| 51 |
The following table sets forth information regarding our executive officers and the members of our board of directors. All directors hold office for one-year terms until the election and qualification of their successors. Officers are elected by the board of directors and serve at the discretion of the board.
| Name | Age | Position |
| Nathan J. Mazurek | 51 | Chief Executive Officer, President and Chairman of the Board of Directors |
| Andrew Minkow | 44 | Chief Financial Officer, Secretary, Treasurer and Director |
| Thomas Klink | 51 | Director, President of Jefferson Electric, Inc. |
| Yossi Cohn | 35 | Director |
| David J. Landes | 57 | Director |
| Ian Ross | 69 | Director |
| David Tesler | 39 | Director |
| Jonathan Tulkoff | 52 | Director |
Nathan J. Mazurek, President, Chief Executive Officer and Chairman of the Board of Directors. Mr. Mazurek has served as our chief executive officer, president and chairman of the board of directors since December 2, 2009. From December 2, 2009 through August 12, 2010, Mr. Mazurek also served as our chief financial officer, secretary and treasurer. Mr. Mazurek has over 20 years of experience in the electrical equipment and components industry. Mr. Mazurek has served as the chief executive officer, president, vice president, sales and marketing and chairman of the board of directors of Pioneer Transformers Ltd. since 1995. Mr. Mazurek has served as the president of American Circuit Breaker Corp., a former manufacturer and distributor of circuit breakers, since 1988 and as a director of Empire Resources, Inc., a distributor of semi-finished aluminum and steel products, since 1999. From 2002 through 2007, Mr. Mazurek served as president of Aerovox, Inc., a manufacturer of AC film capacitors. Mr. Mazurek received his BA from Yeshiva College in 1983 and his JD from Georgetown University Law Center in 1986. Mr. Mazurek brings to the board extensive experience with our company and in our industry. Since he is responsible for, and familiar with, our day-to-day operations and implementation of our strategy, his insights into our performance and into the electrical equipment and components industry are critical to board discussions and to our success.
Andrew Minkow, Chief Financial Officer, Secretary and Treasurer and Director. Mr. Minkow has served as our chief financial officer, secretary and treasurer and a director since August 12, 2010. Mr. Minkow has over 20 years of industry experience in corporate finance, mergers and acquisitions, capital markets, financial reporting, forecasting and general operational and administrative management. Before joining us, Mr. Minkow was an independent financial consultant and provider of executive management, strategic planning and financial reporting services to several corporate clients, including to us. Before that, from 2001 to 2009, Mr. Minkow was a member of the investment banking division at Morgan Joseph & Co. Inc., a middle market investment bank in which he was a founding employee and shareholder. Between 1997 and 2001, he served in several investment banking and capital markets roles at the U.S. division of ING Barings (formerly known as Furman Selz). Mr. Minkow has a BA from Cornell University and an MBA from Columbia Business School. Based on Mr. Minkow’s history with us, coupled with his years of experience working with similarly situated companies in connection with a wide range of corporate finance transactions, we believe that Mr. Minkow brings a set of skills and knowledge to the board that will assist us in continuing to grow our business and realizing our strategic goals.
Thomas Klink, Director, President of Jefferson Electric, Inc. Mr. Klink has served as a director since April 30, 2010. Since 1996, he has served in various positions at Jefferson Electric, Inc., including as its chief executive officer, chief financial officer, vice president, treasurer, secretary and chairman of the board of directors. Mr. Klink previously served as a controller for U.S. Music Corporation, a manufacturer of musical instruments from 1990 through 1994. Mr. Klink received his BBA in Accounting from the University of Wisconsin – Milwaukee in 1984. Mr. Klink brings extensive industry and leadership experience to our board, including over 15 years of experience in the electrical equipment industry.
| 52 |
Yossi Cohn, Director. Mr. Cohn has served as a director since December 2, 2009. Mr. Cohn founded L3C Partners, LLC, an investor in multi-family residential properties, in June 2009, and serves as a partner in the firm. Mr. Cohn also serves as co-managing partner of YY Capital Partners, LLC, an investment firm he founded in 2007. Mr. Cohn served as a director of investor relations at IDT Corporation, a NYSE-listed telecommunications company, from September 2005 through May 2007. Prior to joining IDT Corporation, Mr. Cohn was a director of research at SAGEN Asset Management, an asset manager of funds of hedge funds, from January 2005 through May 2005. Mr. Cohn began his career as an analyst in the funds-of-funds investment group of Millburn Ridgefield Corporation, where he worked from 2001 through January 2005. Our board believes Mr. Cohn’s background at these and other companies, particularly in areas of capital markets, financial, strategic and investment management experience, makes him an effective member of our board..
David J. Landes, Director. Mr. Landes has served as a director since December 2, 2009. Mr. Landes has served as president of Provident Sunnyside, LLC, CYMA Investments LLC and 516 Churchill Associates, LLC, each private real estate and investment companies for over the past five years. Mr. Landes received a BA from Columbia University, a JD from the University of Chicago and a PhD from Princeton University. Mr. Landes practiced corporate and securities law at Shearman and Sterling in New York City. Mr. Landes’ experience as a lawyer and principal provides him with significant knowledge and insight regarding corporate governance, financing, capital markets and executive leadership. In addition, since he is a founding member of the managing partner of Provident Pioneer Partners, L.P., our sole shareholder until December 2009, Mr. Landes provides the board with a unique perspective on our history and performance.
Ian Ross, Director. Mr. Ross has served as a director since March 24, 2011. In 2000, Mr. Ross co-founded and has since served as president of Omniverter Inc., a company specializing in electrical power quality solutions for industrial producers and electrical utilities in the U.S. and Canada. He has also served as the president of KIR Resources Inc. and KIR Technologies Inc. since 1999, companies engaged in management consulting and import/export activities in the electrical equipment industry, respectively. Mr. Ross previously held positions in Canada as vice president technology with Schneider Canada, a specialist in energy management, and vice president of the distribution products business at Federal Pioneer Ltd., now part of Schneider Canada. Previously, Mr. Ross held a number of successive board level positions in UK engineering companies, culminating in five years as managing director, Federal Electric, Ltd., before moving to Canada in 1986 at the request of Federal Pioneer Ltd. He received an MA in mechanical sciences (electrical and mechanical engineering) from Cambridge University and subsequently qualified as an accountant ACMA. Our board believes that Mr. Ross’ relationships and broad experience in the electrical transmission and distribution equipment industry will assist us in continuing to grow our business and realizing our strategic goals.
David Tesler, Director. Mr. Tesler has served as a director since December 2, 2009. Mr. Tesler has served as chief executive officer of LeaseProbe, LLC, a provider of lease abstracting services, since he founded the company in 2004. In 2008, LeaseProbe, LLC acquired Real Diligence, LLC, a provider of financial due diligence services. The combined company does business as Real Diligence and operates as an integrated outsourced provider of legal and commercial due diligence services for the commercial real estate industry. Prior to 2004, Mr. Tesler practiced law at Skadden Arps Slate Meager & Flom LLP and at Jenkens & Gilchrist, Parker Chapin LLP. Mr. Tesler received his BA from Yeshiva College, an MA in medieval history from Bernard Revel Graduate School and a JD from Benjamin A. Cardozo School of Law. Mr. Tesler brings extensive legal, strategic and executive leadership experience to our board.
Jonathan Tulkoff, Director. Mr. Tulkoff has served as director since December 2, 2009. Mr. Tulkoff has served as president of Uniwire International, Ltd., a steel trading and marketing company, since 1995. Our board believes Mr. Tulkoff’s extensive strategic, international and executive leadership experience, particularly in commodity markets for metal products which represent one of the largest components of our company’s cost of manufacture, make him an effective member of our board.
There are no family relationships among any of our directors and executive officers. Messrs. Mazurek, Minkow and Klink are parties to certain agreements related to their service as executive officers and directors described in the “Executive Compensation” section of this prospectus.
| 53 |
Controlled Company
Because Mr. Mazurek controls a majority of our outstanding voting power, we are a “controlled company” under the corporate governance rules of NASDAQ. Therefore, we are not required to have a majority of our board of directors be independent, nor are we required to have a compensation committee or an independent nominating function. In light of our status as a controlled company, our board of directors has determined not to have a majority of independent directors or an independent nominating or compensation committee and to have the full board of directors be directly responsible for compensation matters and for nominating members of our board.
Board Committees
Audit Committee. We established an audit committee of the board of directors on March 24, 2011. The audit committee consists of Messrs. Cohn, Ross and Tulkoff, each of whom our board has determined to be financially literate and qualify as an independent director under Section 5605(a)(2) of the rules of the Nasdaq Stock Market. In addition, Mr. Ross qualifies as a financial expert as defined in Item 407(d)(5)(ii) of Regulation S-K. The audit committee’s duties are to recommend to our board of directors the engagement of independent auditors to audit our financial statements and to review our accounting and auditing principles. The audit committee will review the scope, timing and fees for the annual audit and the results of audit examinations performed by the internal auditors and independent public accountants, including their recommendations to improve the system of accounting and internal controls.
Code of Business Conduct and Ethics
We have adopted a Code of Business Conduct and Ethics that applies to our directors, officers and other employees and those of our subsidiaries, including our principal executive officer, principal financial officer and principal accounting officer. Copies of the code can be obtained free of charge from our web site, www.pioneerpowersolutions.com. We intend to post any amendments to, or waivers from, our Code of Business Conduct and Ethics granted to executive officers on our web site.
| 54 |
2012 and 2011 Summary Compensation Table
The following table summarizes, for each of the last two fiscal years, the compensation paid to Nathan J. Mazurek, our chief executive officer, president and chairman of the board of directors, Andrew Minkow, our chief financial officer, secretary, treasurer and a director and Thomas Klink, the president of Jefferson Electric, Inc. and a director, whom we refer to collectively in this prospectus as the “named executive officers.”
| Name and Principal Position | Year | Salary ($) | Bonus ($) | Option Awards(1) ($) | All Other Compensation (2) ($) | Total ($) | ||||||||||||||||
| Nathan J. Mazurek | 2012 | 347,385 | 90,000 | 15,587 | 4,000 | 456,972 | ||||||||||||||||
| President, Chief Executive Officer, Chairman of the Board of Directors | 2011 | 277,019 | 35,700 | 10,429 | 6,000 | 329,148 | ||||||||||||||||
| Andrew Minkow | 2012 | 248,366 | 65,000 | 36,112 | 4,000 | 353,478 | ||||||||||||||||
| Chief Financial Officer, Secretary, Treasurer and Director | 2011 | 188,750 | 24,300 | 11,182 | 6,000 | 230,232 | ||||||||||||||||
| Thomas Klink | 2012 | 312,000 | - | 6,837 | 4,000 | 322,837 | ||||||||||||||||
| President of Jefferson Electric, Inc. and Director | 2011 | 312,000 | - | 7,804 | 6,000 | 325,804 | ||||||||||||||||
| (1) | Amounts represent the aggregate grant date fair value, as determined in accordance with FASB ASC Topic 718, with the exception that the amounts shown assume no forfeitures. The assumptions used to calculate the value of share based awards are set forth in “Note 13. Stock-Based Compensation” to our audited financial statements for the year ended December 31, 2012 included in this prospectus. These amounts do not represent the actual value that may be realized by our named executive officers, as that is dependent on the long-term appreciation in our common stock. |
| (2) | Comprised of board of directors meeting fees. |
Agreements with Executive Officers
Nathan J. Mazurek
We entered into an employment agreement with Mr. Mazurek, dated as of December 2, 2009, pursuant to which Mr. Mazurek was to serve as our chief executive officer for a term of three years. Pursuant to this employment agreement, Mr. Mazurek was entitled to receive an annual base salary of $250,000 from December 2, 2009 through December 2, 2010, which was increased to $275,000 on December 2, 2010 and to $300,000 on December 2, 2011. Mr. Mazurek was entitled to receive an annual cash bonus at the discretion of our board of directors, or a committee thereof, of up to 50% of his annual base salary, which percentage was permitted to be increased in the discretion of the board. In the event that Mr. Mazurek was terminated without cause, Mr. Mazurek would have been entitled to receive his base salary for the balance of the term of the agreement.
This agreement prohibited Mr. Mazurek from competing with us for a period of four years following the date of termination, unless he was terminated without cause or due to disability or he voluntarily resigned following a breach by us of this agreement, in which case he was prohibited from competing with us for a period of only two years.
| 55 |
We entered into a new employment agreement with Mr. Mazurek, dated as of March 30, 2012, pursuant to which Mr. Mazurek will serve as our chief executive officer for a three year term ending on March 31, 2015. Pursuant to this new employment agreement, Mr. Mazurek was entitled to receive an annual base salary of $350,000 during the remainder of the 2012 calendar year, which will increase to $365,000 during the 2013 calendar year and then to $380,000 for the remainder of his employment term. The other material terms of the new employment agreement are substantially similar to those under his previous agreement, except that Mr. Mazurek has agreed not to compete with us for a period of one year following the termination of his employment for any reason.
Andrew Minkow
We entered into an employment agreement with Mr. Minkow, dated as of August 12, 2010, pursuant to which Mr. Minkow was to serve as our chief financial officer, secretary and treasurer for a term of three years. Pursuant to this employment agreement, Mr. Minkow was entitled to receive an annual base salary of $180,000 until August 12, 2011, which was increased to $205,000 on August 12, 2011 and would have been increased to $230,000 on August 12, 2012. Mr. Minkow was entitled to receive an annual cash bonus at the discretion of our board of directors, or a committee thereof, of up to 50% of his base salary, which percentage was permitted to be increased in the discretion of the board.
The employment agreement also provided that Mr. Minkow receive incentive stock options to purchase 30,000 shares of our common stock under our 2009 Equity Incentive Plan, which were granted on August 12, 2010 at an exercise price of $15.20 per share (as adjusted for the one-for-five reverse split of our common stock that occurred in June 2011). One-third of the stock options vested on each of August 12, 2011, August 12, 2012 and August 12, 2013. The stock options expire on August 12, 2020.
Under the August 12, 2010 agreement, if we terminated Mr. Minkow’s employment without cause, he would have been entitled to: (i) the continued payment of his base salary for the remainder of the term of the employment agreement; (ii) annual bonus payments based on the average bonus compensation (as a percentage of base salary) paid to Mr. Minkow during the period prior to his termination without cause and (iii) the immediate vesting of all stock options previously awarded to Mr. Minkow. Mr. Minkow also agreed not to compete with us, or to solicit employees or customers from us, until the earlier of (a) August 12, 2013, (b) the date upon which Mr. Minkow was terminated without cause, (c) the termination of Mr. Minkow’s employment due to disability or (d) Mr. Minkow’s voluntary termination of his employment following a breach by us of his employment agreement.
We entered into a new employment agreement with Mr. Minkow, dated as of March 30, 2012, pursuant to which he will serve as our as our chief financial officer, secretary and treasurer for a three year term ending on March 31, 2015. Pursuant to this new employment agreement, Mr. Minkow was entitled to receive an annual base salary of $255,000 during the remainder of the 2012 calendar year, which will increase to $265,000 during the 2013 calendar year and then to $275,000 for the remainder of his employment term. The other material terms of the new employment agreement are substantially similar to those under his previous agreement, except that (a) Mr. Minkow has agreed not to compete with us for one year following termination of his employment, for any reason and (b) upon Mr. Minkow's termination without cause, (i) his unvested options will expire immediately in accordance with his option agreements, (ii) his vested options will expire three months following his termination in accordance with his option agreements and (iii) he shall not be entitled to any bonus compensation.
Thomas Klink
On April 30, 2010, in connection with our acquisition of Jefferson Electric, Inc., Jefferson Electric, Inc. entered into an employment agreement with Thomas Klink pursuant to which Mr. Klink is serving as Jefferson Electric, Inc.’s president, subject to the authority of our chief executive officer, Mr. Mazurek, for an original term of three years. Mr. Klink was initially entitled to receive an annual base salary of $312,000. Mr. Klink’s employment may be terminated upon his death or disability, upon the occurrence of certain events that constitute “cause,” and without cause. If terminated without cause, Mr. Klink will be entitled to receive as severance an amount equal to his base salary for the remainder of the employment period under the agreement, conditioned upon his execution of a release in form reasonably acceptable to counsel of Jefferson Electric, Inc. On April 30, 2013, Jefferson Electric, Inc. and Mr. Klink entered into an amendment to this employment agreement, pursuant to which the term was extended to April 30, 2016, unless terminated earlier in accordance with its terms, and Mr. Klink’s annual base salary was reduced to $250,000.
| 56 |
Outstanding Equity Awards at Fiscal Year End
The following table provides information on the holdings of stock options of the named executive officers at December 31, 2012. This table includes unexercised and unvested options awards. Each outstanding award is shown separately for each named officer.
| Option Awards | ||||||||||||||||
| Number of | Number of | |||||||||||||||
| Securities | Securities | |||||||||||||||
| Underlying | Underlying | Option | ||||||||||||||
| Unexercised | Unexercised | Exercise | Option | |||||||||||||
| Date of | Options (#) | Options (#) | Price | Expiration | ||||||||||||
| Name | Grant | Exercisable | Unexercisable | ($) | Date | |||||||||||
| Nathan J. Mazurek | 3/23/2010 | 20,000 | (1) | 10,000 | (1) | $ | 16.25 | 3/23/2015 | ||||||||
| 3/23/2010 | 400 | (2) | - | 16.25 | 3/23/2020 | |||||||||||
| 3/24/2011 | 667 | (1) | 1,333 | (1) | 13.20 | 3/24/2016 | ||||||||||
| 3/24/2011 | 400 | (2) | - | 12.00 | 3/24/2021 | |||||||||||
| 3/23/2012 | - | 13,000 | (1) | 4.53 | 3/23/2017 | |||||||||||
| 3/23/2012 | - | 1,000 | (2) | 4.11 | 3/23/2022 | |||||||||||
| Andrew Minkow | 8/12/2010 | 20,000 | (1) | 10,000 | (1) | $ | 15.20 | 8/12/2020 | ||||||||
| 3/24/2011 | 533 | (1) | 1,067 | (1) | 12.00 | 3/24/2021 | ||||||||||
| 3/24/2011 | 400 | (2) | - | 12.00 | 3/24/2021 | |||||||||||
| 3/23/2012 | - | 20,000 | (1) | 4.11 | 3/23/2022 | |||||||||||
| 3/23/2012 | - | 1,000 | (2) | 4.11 | 3/23/2022 | |||||||||||
| Thomas Klink | 3/24/2011 | 333 | (1) | 667 | (1) | $ | 12.00 | 3/24/2021 | ||||||||
| 3/24/2011 | 400 | (2) | - | 12.00 | 3/24/2021 | |||||||||||
| 3/23/2012 | - | 3,000 | (1) | 4.11 | 3/23/2022 | |||||||||||
| 3/23/2012 | - | 1,000 | (2) | 4.11 | 3/23/2022 | |||||||||||
| (1) | Incentive stock options granted for service as an executive officer. Vests in equal annual installments upon each of the first three anniversaries of the grant date. |
| (2) | Non-qualified stock options granted for service as a director. Vests on the first anniversary of the grant date. |
2009 Equity Incentive Plan
On December 2, 2009, our board of directors and stockholders adopted the 2009 Equity Incentive Plan, pursuant to which 320,000 shares of our common stock were reserved for issuance as awards to employees, directors, consultants and other service providers. The purpose of the 2009 Equity Incentive Plan was to provide an incentive to attract and retain directors, officers, consultants, advisors and employees whose services were considered valuable, to encourage a sense of proprietorship and to stimulate an active interest of such persons in our development and financial success. Under the 2009 Equity Incentive Plan, we were authorized to issue incentive stock options intended to qualify under Section 422 of the Internal Revenue Code of 1986, as amended, non-qualified stock options, restricted stock, stock appreciation rights, performance unit awards and stock bonus awards. The 2009 Equity Incentive Plan is currently administered by our board of directors but may be subsequently administered by a compensation committee designated by our board of directors. The 2011 Long-Term Incentive Plan that we adopted in May 2011 replaced and superseded the 2009 Equity Incentive Plan in its entirety but any awards granted prior to May 21, 2011 that are still outstanding are subject to the 2009 Equity Incentive Plan.
| 57 |
2011 Long-Term Incentive Plan
On May 11, 2011, our board of directors adopted the 2011 Long-Term Incentive Plan, subject to stockholder approval, which was obtained on May 31, 2011. The 2011 Long-Term Incentive Plan replaces and supersedes the 2009 Equity Incentive Plan. Our outside directors and our employees, including the principal executive officer, principal financial officer and other named executive officers, and certain contractors are all eligible to participate in the 2011 Long-Term Incentive Plan. The 2011 Long-Term Incentive Plan allows for the granting of incentive stock options, non-qualified stock options, stock appreciation rights, restricted stock, restricted stock units, performance awards, dividend equivalent rights, and other awards, which may be granted singly, in combination, or in tandem, and upon such terms as are determined by the board or a committee of the board that is designated to administer the 2011 Long-Term Incentive Plan. Subject to certain adjustments, the maximum number of shares of our common stock that may be delivered pursuant to awards under the 2011 Long-Term Incentive Plan is 700,000 shares. The 2011 Long-Term Incentive Plan is currently administered by our board of directors but may be subsequently administered by a compensation committee designated by our board of directors.
Director Compensation
The following table provides compensation information for the one year period ended December 31, 2012 for each non-employee member of our board of directors:
2012 Fiscal Year Director Compensation Table
| Name | Fees Earned or Paid in Cash ($) | Option Awards ($)(1)(2) | Total ($) | |||||||||
| Yossi Cohn | $ | 4,000 | $ | 1,671 | $ | 5,671 | ||||||
| David J. Landes | 4,000 | 1,671 | 5,671 | |||||||||
| Ian Ross | 4,000 | 1,671 | 5,671 | |||||||||
| David Tesler | 4,000 | 1,671 | 5,671 | |||||||||
| Jonathan Tulkoff | 4,000 | 1,671 | 5,671 | |||||||||
| (1) | Amounts represent the aggregate grant date fair value, as determined in accordance with FASB ASC Topic 718, with the exception that the amounts shown assume no forfeitures. The assumptions used to calculate the value of share based awards are set forth in “Note 13. Stock-Based Compensation” to our audited financial statements for the year ended December 31, 2012 included in this prospectus. These amounts do not represent the actual value that may be realized by our non-employee directors, as that is dependent on the long-term appreciation in our common stock. |
| (2) | On March 23, 2012, we granted each director non-qualified stock options to purchase 1,000 shares of our common stock. The grants were made under our 2011 Long-Term Incentive Plan at an exercise price of $4.11 per share. All of the options vested on March 23, 2013 and will expire on March 23, 2022. |
All of our directors, including our employee directors, are paid cash compensation of $1,000 per meeting of the board of directors and reimbursed for reasonable out-of-pocket expenses incurred in connection with their attendance at such meetings.
| 58 |
CERTAIN RELATIONSHIPS AND RELATED TRANSACTIONS
In connection with our acquisition of Jefferson Electric, Inc. on April 30, 2010, we advanced $3.0 million to Jefferson Electric, Inc., which was utilized to partially repay the principal amount outstanding under Jefferson Electric, Inc.’s revolving credit facility with its bank and to partially repay the principal amount outstanding under Jefferson Electric, Inc.’s term loan facility. We subsequently advanced another $1.75 million to Jefferson Electric, Inc., which was utilized to partially repay the principal amounts outstanding under its credit facilities with its bank. Thomas Klink, President of Jefferson Electric, Inc., was a guarantor under this facility. On June 28, 2013, Jefferson Electric, Inc.’s credit facility was paid in full and Mr. Klink’s guarantee of the facility was terminated.
Mr. Klink was appointed to our board of directors effective upon our acquisition of Jefferson Electric, Inc. The merger agreement pursuant to which we effected our acquisition of Jefferson Electric, Inc. provided that, with certain exceptions, including resignation, termination or removal as a director, we would cause Mr. Klink to be nominated as a director of our company during the three year term of his employment agreement ending in April 2013. In addition, also upon our acquisition of Jefferson Electric, Inc., Mr. Klink entered into a voting agreement with Provident Pioneer Partners, L.P., pursuant to which Provident Pioneer Partners, L.P. agreed to vote all of its shares to elect Mr. Klink as a director of ours during the three year term of his employment agreement, subject to certain exceptions, including resignation, termination or removal as a director.
Generally, we do not to enter into related party transactions unless the members of the board who do not have an interest in the potential transaction have reviewed the transaction and determined that (i) we would not be able to obtain better terms by engaging in a transaction with a non-related party and (ii) the transaction is in our best interest. This policy applies generally to any transaction in which we are to be a participant and the amount involved exceeds the lesser of $120,000 or one percent of the average of our total assets at year end for the previous two completed fiscal years, and in which any related person had or will have a direct or indirect material interest. This policy is not currently in writing. In addition, our audit committee, which was established on March 24, 2011, is required to pre-approve any related party transactions pursuant to its charter.
| 59 |
SECURITY OWNERSHIP OF CERTAIN BENEFICIAL OWNERS AND MANAGEMENT
The following table sets forth information with respect to the beneficial ownership of our common stock as of September 9, 2013 by:
| · | each person know by us to beneficially own more than 5.0% of our common stock; |
| · | each of our directors; |
| · | each of the named executive officers; and |
| · | all of our directors and executive officers as a group |
The percentages of common stock beneficially owned are reported on the basis of regulations of the Securities and Exchange Commission governing the determination of beneficial ownership of securities. Under the rules of the Securities and Exchange Commission, a person is deemed to be a beneficial owner of a security if that person has or shares voting power, which includes the power to vote or to direct the voting of the security, or investment power, which includes the power to dispose of or to direct the disposition of the security. Except as indicated in the footnotes to this table, each beneficial owner named in the table below has sole voting and sole investment power with respect to all shares beneficially owned and each person’s address is c/o Pioneer Power Solutions, Inc., 400 Kelby Street, 9th Floor, Fort Lee, New Jersey 07024.
As of September 9, 2013, we had 5,907,255 shares outstanding. The percentages of beneficial ownership of our common stock after this offering is presented assuming the underwriters do not exercise their over-allotment option.
| Number of Shares | Percentage Beneficially Owned (1) | |||||||||||
| Beneficially | Before this | After this | ||||||||||
| Name of Beneficial Owner | Owned (1) | Offering | Offering | |||||||||
| 5% Owners | ||||||||||||
| Provident Pioneer Partners, L.P. | 4,760,000 | (2) | 77.9 | % | 67.0 | % | ||||||
| A. Lawrence Carroll Trust | 420,000 | (3) | 7.1 | % | 6.1 | % | ||||||
| WEC Partners LLC | 386,860 | (4) | 6.5 | % | 5.6 | % | ||||||
| Officers and Directors | ||||||||||||
| Nathan J. Mazurek | 4,781,467 | (5) | 78.1 | % | 67.1 | % | ||||||
| Thomas Klink | 300,322 | (6) | 4.9 | % | 4.2 | % | ||||||
| Andrew Minkow | 63,301 | (7) | 1.2 | % | 1.1 | % | ||||||
| Yossi Cohn | 1,800 | (8) | * | * | ||||||||
| David J. Landes | 4,761,800 | (9) | 77.9 | % | 67.0 | % | ||||||
| Ian Ross | 1,400 | (8) | * | * | ||||||||
| David Tesler | 1,800 | (8) | * | * | ||||||||
| Jonathan Tulkoff | 1,800 | (8) | * | * | ||||||||
| All directors and executive officers as a group (8 persons) | 5,169,690 | 80.6 | % | 69.8 | % | |||||||
| 60 |
*
Less than one percent (1%).
| (1) | Shares of common stock beneficially owned and the respective percentages of beneficial ownership of common stock assumes the exercise of all options, warrants and other securities convertible into common stock beneficially owned by such person or entity currently exercisable or exercisable within 60 days of September 9, 2013. Shares issuable pursuant to the exercise of stock options and warrants exercisable within 60 days are deemed outstanding and held by the holder of such options or warrants for computing the percentage of outstanding common stock beneficially owned by such person, but are not deemed outstanding for computing the percentage of outstanding common stock beneficially owned by any other person. |
| (2) | Includes (i) 4,560,000 shares of common stock held by Provident Pioneer Partners, L.P. and (ii) a currently exercisable warrant to purchase up to 200,000 shares of common stock at an exercise price of $16.25 per share held by Provident Pioneer Partners, L.P. Nathan J. Mazurek is the majority stockholder and a control person of Provident Canada Corp., the general partner of Provident Pioneer Partners, L.P., and, as such, has sole voting and investment power over these shares. |
| (3) | A. Lawrence Carroll is the trustee of the A. Lawrence Carroll Trust and, in such capacity, has voting and dispositive power over the securities held for the account of this stockholder. The beneficial owner’s address is 415 L’Ambiance Drive, #804, Longboat Key, FL 34228. |
| (4) | Comprised of (i) 236,860 shares of common stock held by certain affiliates of WEC Partners LLC and its affiliate, Genesis Capital Advisors LLC, and (ii) 150,000 shares of common stock held by WEC Partners LLC. Genesis Capital Advisors LLC also holds a warrant to purchase 200,000 shares of common stock, which shares are not included in the table above. The warrant is not convertible to the extent that after giving effect to the conversion, the holder (together with its affiliates, and any other person or entity acting as a group together with such holder or any of its affiliates) would beneficially own more than 4.99% of the number of shares of our common stock outstanding immediately after such conversion, unless such requirement is waived by the holder upon not less than 61 days’ prior notice to us to change the beneficial ownership limitation to 9.99%. Each of Daniel Saks, Jaime Hartman and Ethan Benovitz are principals of Genesis Capital Advisors LLC and of WEC Partners LLC and, as such may be deemed to have voting and dispositive power over the securities held for the account of these stockholders. The address for the beneficial owner is c/o Genesis Capital Advisors LLC, 1212 Avenue of the Americas, 19th Floor, New York, NY 10036. |
| (5) | Nathan J. Mazurek is the majority stockholder and a control person of Provident Canada Corp., the general partner of Provident Pioneer Partners, L.P., and, as such, has sole voting and investment power over the 4,560,000 shares of common stock held by Provident Pioneer Partners, L.P. and the currently exercisable warrant to purchase up to 200,000 shares of common stock at an exercise price of $16.25 per share held by Provident Pioneer Partners, L.P. In addition, includes 37,467 shares subject to stock options which are exercisable within 60 days of September 9, 2013. |
| (6) | Includes (i) 97,255 shares of common stock, (ii) a currently exercisable warrant to purchase up to 200,000 shares of common stock at an exercise price of $16.25 per share and (iii) 3,067 shares subject to stock options which are exercisable within 60 days of September 9, 2013. |
| (7) | Includes (i) 4,168 shares of common stock, (ii) a currently exercisable warrant to purchase up to 30,000 shares of common stock at an exercise price of $10.00 per share and (iii) 29,133 shares subject to stock options which are exercisable within 60 days of September 9, 2013. |
| (8) | Comprised of shares subject to stock options which are exercisable within 60 days of September 9, 2013. |
| (9) | David J. Landes is the minority stockholder and a control person of Provident Canada Corp., the general partner of Provident Pioneer Partners, L.P., and, as such, has beneficial ownership of the 4,560,000 shares of common stock held by Provident Pioneer Partners, L.P. and the currently exercisable warrant to purchase up to 200,000 shares of common stock at an exercise price of $16.25 per share held by Provident Pioneer Partners, L.P. In addition, includes 1,800 shares subject to stock options which are exercisable within 60 days of September 9, 2013. |
| 61 |
We are authorized to issue 30,000,000 shares of common stock and 5,000,000 shares of preferred stock. On September 9, 2013, there were 5,907,255 shares of common stock issued and outstanding and no shares of preferred stock issued and outstanding.
Common Stock
The holders of common stock are entitled to one vote per share. Our certificate of incorporation does not provide for cumulative voting. The holders of our common stock are entitled to receive ratably such dividends, if any, as may be declared by the board of directors out of legally available funds. Upon liquidation, dissolution or winding-up, the holders of our common stock are entitled to share ratably in all assets that are legally available for distribution. The holders of our common stock have no preemptive, subscription, redemption or conversion rights. The rights, preferences and privileges of holders of our common stock are subject to, and may be adversely affected by, the rights of the holders of any series of preferred stock, which may be designated solely by action of the board of directors and issued in the future.
Preferred Stock
The board of directors is authorized, subject to any limitations prescribed by law, without further vote or action by the stockholders, to issue from time to time shares of preferred stock in one or more series. Each such series of preferred stock shall have such number of shares, designations, preferences, voting powers, qualifications, and special or relative rights or privileges as shall be determined by the board of directors, which may include, among others, dividend rights, voting rights, liquidation preferences, conversion rights and preemptive rights.
Warrants
$10.00 Warrant
On December 2, 2009, we sold a warrant to purchase up to an aggregate of 200,000 shares of common stock for $10,000. Such warrant provides for the purchase of shares of common stock for five years at an exercise price of $10.00 per share. We are prohibited from effecting the exercise of the warrant to the extent that as a result of such exercise the holder of the exercised warrant would beneficially own more than 4.99% (or, if such limitation is waived by the holder upon no less than 61 days prior notice to us, 9.99%) in the aggregate of our issued and outstanding shares of common stock, as calculated immediately after giving effect to the issuance of shares of our common stock upon the exercise of the warrant. The warrant contains provisions that protect its holder against dilution by adjustment of the purchase price in certain events such as stock dividends, stock splits and other similar events. If at any time after the one year anniversary of the issuance date of such warrant there is no effective registration statement, or no current prospectus available for the resale of the shares of common stock underlying the warrant, then the holder of such warrant has the right to exercise the warrant by means of a cashless exercise.
$16.25 Warrant
In connection with our acquisition of Pioneer Transformers Ltd., we issued a warrant to purchase up to 200,000 shares of common stock to Provident Pioneer Partners, L.P. Such warrant provides for the purchase of shares of common stock for five years at an exercise price of $16.25 per share. This warrant contains a provision that protects its holder against dilution by adjustment of the purchase price in the event of a stock split or combination. If at any time after the one year anniversary of the issuance date of such warrant there is no effective registration statement registering, or no current prospectus available for, the resale of the shares of common stock underlying such warrant, then the holder shall have the right to exercise this warrant by means of a cashless exercise.
| 62 |
Klink Warrant
On April 30, 2010, we sold Thomas Klink a warrant to purchase up to an aggregate of 200,000 shares of common stock for $10,000. Such warrant provides for the purchase of shares of common stock for five years at an exercise price of $16.25 per share. This warrant contains a provision that protects its holder against dilution by adjustment of the purchase price in the event of a stock split or combination.
Investor Relations Warrants
On April 19, 2010, we issued four year warrants to our investor relations firm and its designees to purchase up to an aggregate of 10,000 shares of common stock at an exercise price of $16.25 per share. These warrants contain a provision that protects their holders against dilution by adjustment of the purchase price in the event of a stock split or combination. In addition, if at any time after the one year anniversary of the issuance date of the warrants there is no effective registration statement registering, or no current prospectus available for, the resale of the shares of common stock underlying the warrants, then the holders of these warrants will have the right to exercise the warrants by means of a cashless exercise.
Consultant Warrant
On April 26, 2010, we issued a five year warrant to a consultant to purchase up to an aggregate of 30,000 shares of common stock at an exercise price of $10.00 per share. This warrant contains a provision that protects its holder against dilution by adjustment of the purchase price in the event of a stock split or combination. In addition, if at any time after the one year anniversary of the issuance date of the warrant there is no effective registration statement registering, or no current prospectus available for, the resale of the shares of common stock underlying the warrant, then the holder of this warrant will have the right to exercise the warrant by means of a cashless exercise.
Registration Rights
In connection with our $5 million private placement of common stock on December 2, 2009, we agreed to use our best efforts to file a registration statement with the Securities and Exchange Commission on or before February 1, 2010 covering the resale of the shares of common stock issued in such private placement, and to cause such registration statement to be declared effective by the Securities and Exchange Commission on or before May 31, 2010. As required, we filed a registration statement on January 25, 2010, which was originally declared effective on April 20, 2010 and remains in effect.
We granted to Provident Pioneer Partners, L.P. and Genesis Capital Advisors, LLC piggyback registration rights, pursuant to which we agreed to register the shares of common stock issuable upon the exercise of the warrants held by them in the event that we determined to prepare and file a registration statement with the Securities and Exchange Commission relating to an offering of any of our equity securities for our own account or the account of others under the Securities Act of 1933, as amended, subject to certain exemptions. These shares were included in the effective registration statement described above.
Lock-up Agreements
Each of our officers and directors, as well as Provident Pioneer Partners, L.P., have agreed not to, subject to certain exemptions, sell or transfer any shares of our common stock or other securities convertible into or exchangeable or exercisable for shares of our common stock or derivatives of our common stock owned by these persons prior to this offering or common stock issuable upon exercise of options or warrants held by these persons for a period of 90 days after the date of this prospectus without the prior written consent of Roth Capital Partners, LLC. This consent may be given at any time without public notice.
Anti-Takeover Effect of Delaware Law, Certain Charter and Bylaw Provisions
So long as Provident Pioneer Partners, L.P., which is controlled by Nathan J. Mazurek, maintains a majority of the voting power of our common stock, Mr. Mazurek will effectively control all matters submitted to our stockholders for a vote, as well as the overall management and direction of our company, which may have the effect of delaying, deferring or discouraging another person from acquiring control of our company.
After such time that Provident Pioneer Partners, L.P. or any other entity controlled by Mr. Mazurek does not maintain a majority of the voting power of our common stock, the provisions of Delaware law, our certificate of incorporation and our bylaws may have the effect of delaying, deferring or discouraging another person from acquiring control of our company.
Our certificate of incorporation and bylaws contain provisions that could have the effect of discouraging potential acquisition proposals or tender offers or delaying or preventing a change of control of our company. These provisions are as follows:
| · | they provide that special meetings of stockholders may be called only by our chairman, our president or by a resolution adopted by a majority of our board of directors; |
| 63 |
| · | they do not include a provision for cumulative voting in the election of directors. Under cumulative voting, a minority stockholder holding a sufficient number of shares may be able to ensure the election of one or more directors. The absence of cumulative voting may have the effect of limiting the ability of minority stockholders to effect changes in our board of directors; and |
| · | they allow us to issue, without stockholder approval, up to 5,000,000 shares of preferred stock that could adversely affect the rights and powers of the holders of our common stock. |
We are subject to the provisions of Section 203 of the General Corporation Law of the State of Delaware, an anti-takeover law. In general, Section 203 prohibits a publicly held Delaware corporation from engaging in a “business combination” with an “interested stockholder” for a period of three years after the date of the transaction in which the person became an interested stockholder, unless the business combination is approved in a prescribed manner. For purposes of Section 203, a “business combination” includes a merger, asset sale or other transaction resulting in a financial benefit to the interested stockholder, and an “interested stockholder” is a person who, together with affiliates and associates, owns, or within three years prior did own, 15% or more of the voting stock of a corporation.
Indemnification of Directors and Officers
Section 145 of the General Corporation Law of the State of Delaware provides, in general, that a corporation incorporated under the laws of the State of Delaware, as we are, may indemnify any person who was or is a party or is threatened to be made a party to any threatened, pending or completed action, suit or proceeding (other than a derivative action by or in the right of the corporation) by reason of the fact that such person is or was a director, officer, employee or agent of the corporation, or is or was serving at the request of the corporation as a director, officer, employee or agent of another enterprise, against expenses (including attorneys’ fees), judgments, fines and amounts paid in settlement actually and reasonably incurred by such person in connection with such action, suit or proceeding if such person acted in good faith and in a manner such person reasonably believed to be in or not opposed to the best interests of the corporation and, with respect to any criminal action or proceeding, had no reasonable cause to believe such person’s conduct was unlawful. In the case of a derivative action, a Delaware corporation may indemnify any such person against expenses (including attorneys’ fees) actually and reasonably incurred by such person in connection with the defense or settlement of such action or suit if such person acted in good faith and in a manner such person reasonably believed to be in or not opposed to the best interests of the corporation, except that no indemnification will be made in respect of any claim, issue or matter as to which such person will have been adjudged to be liable to the corporation unless and only to the extent that the Court of Chancery of the State of Delaware or any other court in which such action was brought determines such person is fairly and reasonably entitled to indemnity for such expenses.
Our certificate of incorporation and bylaws provide that we will indemnify our directors, officers, employees and agents to the extent and in the manner permitted by the provisions of the General Corporation Law of the State of Delaware, as amended from time to time, subject to any permissible expansion or limitation of such indemnification, as may be set forth in any stockholders’ or directors’ resolution or by contract. Any repeal or modification of these provisions approved by our stockholders will be prospective only and will not adversely affect any limitation on the liability of any of our directors or officers existing as of the time of such repeal or modification.
We are also permitted to apply for insurance on behalf of any director, officer, employee or other agent for liability arising out of his actions, whether or not the General Corporation Law of the State of Delaware would permit indemnification.
| 64 |
Disclosure of Commission Position on Indemnification for Securities Act Liabilities
Insofar as indemnification for liabilities arising under the Securities Act of 1933, as amended, may be permitted to our directors, officers and persons controlling us, we have been advised that it is the Securities and Exchange Commission’s opinion that such indemnification is against public policy as expressed in the Securities Act of 1933, as amended, and is, therefore, unenforceable.
| 65 |
We have entered into an underwriting agreement with Roth Capital Partners, LLC, as representatives of the several underwriters, with respect to the shares subject to this offering. Subject to certain conditions, we have agreed to sell to the underwriters, and the underwriters have agreed to purchase from us on a firm commitment basis, the number of shares of our common stock set forth opposite its name in the table below:
| Underwriter | Number of Shares | |||
| Roth Capital Partners, LLC | ||||
| Monarch Capital Group, LLC | ||||
| Total | 1,000,000 | |||
The underwriting agreement provides that the underwriters will purchase all of the shares of common stock offered by this prospectus if they purchase any of the shares. This commitment does not apply to the shares of common stock subject to the over-allotment option described below.
The underwriters propose to offer to the public the shares of our common stock purchased pursuant to the underwriting agreement at the public offering price on the cover page of this prospectus. The underwriters may offer some of the shares to other securities dealers at such price less a concession of $ per share. The underwriters may also allow, and such dealers may reallow, a concession not in excess of $ per share to other dealers. After the shares are released for sale to the public, the underwriters may change the offering price and other selling terms at various times.
The factors considered in determining the public offering price included the recent market price of our common stock, the general condition of the securities market at the time of this offering, the history of, and the prospects for, the industry in which we compete, our past and present operations and our prospects for future revenues.
Commissions and Expenses
The following table provides information regarding the amount of the underwriting discounts and commissions to be paid to the underwriters by us. These amounts are shown assuming both no exercise and full exercise of the underwriter’s option to purchase additional shares to cover over-allotments, if any.
| Total | ||||||||||||
| Without | With | |||||||||||
| Per Share | Over-Allotment | Over-Allotment | ||||||||||
| Underwriting discount | $ | $ | $ | |||||||||
| Proceeds, before expenses, to us | $ | $ | $ | |||||||||
In addition, we have agreed to reimburse the underwriters for certain out-of-pocket expenses incurred by them up to an aggregate of $100,000 with respect to this offering, even in the event the offering is not consummated.
| 66 |
We have agreed to sell the shares at the offering price less the underwriting discount set forth on the cover page of this prospectus. We cannot be sure that the offering price will correspond to the price at which our common stock will trade following this offering.
At the closing of this offering, the underwriters will receive warrants to purchase a number of shares of our common stock equal to 4.0% of the shares of common stock issued in the offering. The warrants will have an exercise price equal to the public offering price of the common stock and shall only be exercisable for a period of five years from the effective date of the offering in compliance with FINRA Rule 5110(f)(2)(H)(i). In accordance with FINRA Rule 5110(g)(1), these warrants may not be sold, transferred, assigned, pledged or hypothecated, or be the subject of any hedging, short sale, derivative, put or call transaction that would result in the effective economic disposition of such warrant by any person for a period of 180 days immediately following the effective date of the registration statement, except as provided in FINRA Rule 5110(g)(2).
Over-Allotment Option
We have granted the underwriters an over-allotment option. This option, which is exercisable for up to 30 days after the date of this prospectus, permits the underwriters to purchase a maximum of 150,000 additional shares from us to cover over-allotments, if any. If the underwriters exercise all or part of this option, they will purchase shares covered by the option at the public offering price that appears on the cover page of this prospectus, less the underwriting discount.
Lock-Up Agreements
Our executive officers and directors have agreed to a 90-day “lock-up” from the date of this prospectus relating to shares of our common stock that they beneficially own, including the issuance of common stock upon the exercise of currently outstanding options and options which may be issued. This means that, for a period of 90 days following the date of this prospectus, such persons may not offer, sell, pledge or otherwise dispose of these securities without the prior written consent of Roth Capital Partners, LLC, as representative of the underwriters, subject to certain exceptions. The lock-up period described in the preceding sentence will be extended if (1) during the last 17 days of the lock-up period, we issue an earnings release or material news or a material event relating to us occurs, or (2) prior to the expiration of the initial lock-up period, we announce that we will release earnings results during the 16-day period following the last day of the initial lock-up period, in which case the lock-up period automatically will be extended until the expiration of the 18-day period beginning on the issuance of the earnings release or the occurrence of the material news or material event, as applicable, unless Roth Capital Partners, LLC, as representative of the underwriters, waives, in writing, such extension.
In addition, the underwriting agreement provides that we will not, for a period of 90 days following the date of this prospectus, offer, sell or distribute any of our securities, without the prior written consent of Roth Capital Partners, LLC, as representative of the underwriters.
Stabilization
Until the distribution of the securities offered by this prospectus is completed, rules of the Securities and Exchange Commission may limit the ability of the underwriters to bid for and to purchase our common stock. As an exception to these rules, the underwriters may engage in transactions effected in accordance with Regulation M under the Securities Exchange Act of 1934, as amended, that are intended to stabilize, maintain or otherwise affect the price of our common stock. The underwriters may engage in over-allotment sales, syndicate covering transactions, stabilizing transactions and penalty bids in accordance with Regulation M.
| · | Stabilizing transactions permit bids or purchases for the purpose of pegging, fixing or maintaining the price of the common stock, so long as stabilizing bids do not exceed a specified maximum. |
| · | Over-allotment involves sales by the underwriters of securities in excess of the number of securities the underwriters are obligated to purchase, which creates a short position. The short position may be either a covered short position or a naked short position. In a covered short position, the number of shares of common stock over-allotted by the underwriters is not greater than the number of shares of common stock that they may purchase in the over-allotment option. In a naked short position, the number of shares of common stock involved is greater than the number of shares in the over-allotment option. The underwriters may close out any covered short position by either exercising their over-allotment option or purchasing shares of our common stock in the open market. |
| 67 |
| · | Covering transactions involve the purchase of securities in the open market after the distribution has been completed in order to cover short positions. In determining the source of securities to close out the short position, the underwriters will consider, among other things, the price of securities available for purchase in the open market as compared to the price at which they may purchase securities through the over-allotment option. If the underwriters sell more shares of common stock than could be covered by the over-allotment option, creating a naked short position, the position can only be closed out by buying securities in the open market. A naked short position is more likely to be created if the underwriters are concerned that there could be downward pressure on the price of the securities in the open market after pricing that could adversely affect investors who purchase in this offering. |
| · | Penalty bids permit the underwriters to reclaim a selling concession from a selected dealer when the securities originally sold by the selected dealer are purchased in a stabilizing or syndicate covering transaction. |
These stabilizing transactions, covering transactions and penalty bids may have the effect of raising or maintaining the market price of our securities or preventing or retarding a decline in the market price of our common stock. As a result, the price of our securities may be higher than the price that might otherwise exist in the open market.
Neither we nor the underwriters make any representation or prediction as to the effect that the transactions described above may have on the prices of our securities. These transactions may occur on any trading market. If any of these transactions are commenced, they may be discontinued without notice at any time.
This prospectus may be made available in electronic format on Internet sites or through other online services maintained by the underwriters or their affiliates. In those cases, prospective investors may view offering terms online and may be allowed to place orders online. Other than this prospectus in electronic format, any information on the underwriters’ or their affiliates’ websites and any information contained in any other website maintained by the underwriters or any affiliate of the underwriters is not part of this prospectus or the registration statement of which this prospectus forms a part, has not been approved and/or endorsed by us or the underwriters and should not be relied upon by investors.
The underwriters or their affiliates may engage in transactions with, and may perform, from time to time, investment banking and advisory services for us in the ordinary course of their business and for which they would receive customary fees and expenses. In addition, in the ordinary course of their business activities, the underwriters and their affiliates may make or hold a broad array of investments and actively trade debt and equity securities (or related derivative securities) and financial instruments (including bank loans) for their own account and for the accounts of their customers. Such investments and securities activities may involve securities and/or instruments of ours or our affiliates. The underwriters and their affiliates may also make investment recommendations and/or publish or express independent research views in respect of such securities or financial instruments and may hold, or recommend to clients that they acquire, long and/or short positions in such securities and instruments.
Notice to Non-U.S. Investors
European Economic Area. In relation to each member state of the European Economic Area which has implemented the Prospectus Directive, each referred to herein as a Relevant Member State, with effect from and including the date on which the Prospectus Directive is implemented in that Relevant Member State, referred to herein as the Relevant Implementation Date, no offer of any securities which are the subject of the offering contemplated by this prospectus has been or will be made to the public in that Relevant Member State other than any offer where a prospectus has been or will be published in relation to such securities that has been approved by the competent authority in that Relevant Member State or, where appropriate, approved in another Relevant Member State and notified to the relevant competent authority in that Relevant Member State in accordance with the Prospectus Directive, except that with effect from and including the Relevant Implementation Date, an offer of such securities may be made to the public in that Relevant Member State:
| • | to any legal entity or person which is a "qualified investor" as defined in the Prospectus Directive; |
| • | to fewer than 100 or, if the Relevant Member State has implemented the relevant provision of the 2010 PD Amending Directive, 150, natural or legal persons (other than qualified investors as defined in the Prospectus Directive), as permitted under the Prospectus Directive, subject to obtaining the prior consent of the representatives of the underwriters for any such offer; or |
| • | in any other circumstances falling within Article 3(2) of the Prospectus Directive, |
provided that no such offer of securities shall require the Company or any of the underwriters to publish a prospectus pursuant to Article 3 of the Prospectus Directive or supplement a prospectus pursuant to Article 16 of the Prospectus Directive.
For the purposes of this provision, the expression an "offer to the public" in relation to any securities in any Relevant Member State means the communication in any form and by any means of sufficient information on the terms of the offer and the securities to be offered so as to enable an investor to decide to purchase or subscribe the securities, as the same may be varied in that Relevant Member State by any measure implementing the Prospectus Directive in that Relevant Member State and the expression "Prospectus Directive" means Directive 2003/71/EC (and amendments thereto, including the 2010 PD Amending Directive, to the extent implemented in the Relevant Member State), and includes any relevant implementing measure in the Relevant Member State and the expression "2010 PD Amending Directive" means Directive 2010/73/EC.
United Kingdom. This document, in so far as it constitutes an invitation or inducement to enter into investment activity (within the meaning of section 21 Financial Services and Markets Act 2000 as amended ("FSMA")) in connection with the securities which are the subject of the offering contemplated by this document, our ordinary shares or otherwise, is being directed only at (i) persons who are outside the United Kingdom or (ii) persons who have professional experience in matters relating to investments who fall within Article 19(5) ("Investment professionals") of the Financial Services and Markets Act 2000 (Financial Promotion) Order 2005 (the "Order") or (iii) certain high value persons and entities who fall within Article 49(2)(a) to (d) ("High net worth companies, unincorporated associations etc") of the Order; or (iv) any other person to whom it may lawfully be communicated (all such persons in (i) to (iv) together being referred to as "relevant persons"). The ADSs are only available to, and any invitation, offer or agreement to subscribe, purchase or otherwise acquire such ADSs will be engaged in only with, relevant persons. Any person who is not a relevant person should not act or rely on this document or any of its contents. The communication of this document or any such invitation or inducement to any persons other than relevant persons is unauthorized and may contravene FSMA.
No approved prospectus relating to the matters in this document has been made available to the public in the United Kingdom and, accordingly, the securities which are the subject of the offering contemplated by this document may not be, and will not be, offered in the United Kingdom except in circumstances which will not result in there being an offer to the public in the United Kingdom (other than an offer falling within Section 86 FSMA)..
Haynes and Boone, LLP, New York, New York, has passed upon the validity of the shares of our common stock offered by us under this prospectus. The underwriters are being represented by Olshan Frome Wolosky LLP, New York, New York, in connection with the offering.
Our financial statements as of December 31, 2012 and 2011 and for the years ended December 31, 2012 and 2011 included in this prospectus have been audited by Richter LLP, an independent registered public accounting firm, as stated in their report appearing herein, and are included in reliance upon the report of such firm given upon their authority as experts in accounting and auditing.
| 68 |
WHERE YOU CAN FIND ADDITIONAL INFORMATION
We have filed a registration statement on Form S-1 with the Securities and Exchange Commission in connection with this offering. In addition, we file annual, quarterly and current reports and other information with the Securities and Exchange Commission. You may read and copy the registration statement and any other documents we have filed at the Securities and Exchange Commission’s Public Reference Room at 100 F Street, N.W., Washington, D.C. 20549. Please call the Securities and Exchange Commission at 1-800-SEC-0330 for further information on the Public Reference Room. Our Securities and Exchange Commission filings are also available to the public at the Securities and Exchange Commission’s Internet site at “http://www.sec.gov”.
This prospectus is part of the registration statement and does not contain all of the information included in the registration statement. Whenever a reference is made in this prospectus to any of our contracts or other documents, the reference may not be complete and, for a copy of the contract or document, you should refer to the exhibits that are a part of the registration statement.
| 69 |
INDEX TO FINANCIAL STATEMENTS
| Page | ||
| Consolidated Financial Statements for the Years Ended December 31, 2012 and 2011 | ||
| Report of Independent Registered Public Accounting Firm | F-2 | |
| Consolidated Statements of Earnings | F-3 | |
| Consolidated Statements of Comprehensive Income | F-4 | |
| Consolidated Balance Sheets | F-5 | |
| Consolidated Statements of Cash Flows | F-6 | |
| Consolidated Statements of Shareholders' Equity | F-7 | |
| Notes to the Consolidated Financial Statements | F-8 | |
| Unaudited Consolidated Financial Statements as of June 30, 2013 and for the Three and Six Months Ended June 30, 2013 and 2012 | ||
| Consolidated Statements of Earnings | F-29 | |
| Consolidated Statements of Comprehensive Income | F-30 | |
| Consolidated Balance Sheets | F-31 | |
| Consolidated Statements of Cash Flows | F-32 | |
| Notes to the Consolidated Financial Statements | F-33 |
| F-1 |

Report of Independent Registered Public Accounting Firm
To the Shareholders and Board of Directors of
Pioneer Power Solutions, Inc.
We have audited the accompanying consolidated balance sheets of Pioneer Power Solutions, Inc. as at December 31, 2012 and 2011 and the related consolidated statements of earnings, comprehensive income, shareholders’ equity and cash flows for the years then ended. These financial statements are the responsibility of the Company’s management. Our responsibility is to express an opinion on these financial statements based on our audit.
We conducted our audits in accordance with the standards of the Public Company Accounting Oversight Board (United States). These standards require that we plan and perform an audit to obtain reasonable assurance whether the financial statements are free of material misstatement. The Company is not required to have, nor were we engaged to perform an audit of its internal control over financial reporting. Our audit included consideration of internal control over financial reporting as a basis for designing audit procedures that are appropriate in the circumstances, but not for the purpose of expressing an opinion on the effectiveness of the Company’s internal control over financial reporting. Accordingly, we express no such opinion. An audit also includes examining, on a test basis, evidence supporting the amounts and disclosures in the financial statements. An audit also includes assessing the accounting principles used and significant estimates made by management, as well as evaluating the overall financial statement presentation. We believe that our audits provide a reasonable basis for our opinion.
In our opinion, these consolidated financial statements present fairly, in all material respects, the financial position of the Company as at December 31, 2012 and 2011and the results of its operations, comprehensive income and its cash flows for the years then ended in accordance with accounting principles generally accepted in the United States.
Richter LLP (Signed)
Chartered Professional Accountants
Montreal, Canada
April 1, 2013
1 CPA auditor, CA, public accountancy permit No. A109611
|
T. 514.934.3400
Richter LLP 1981 McGill College Mtl (Qc) H3A 0G6 www.richter.ca |
Member RSM International
Montréal, Toronto |
 |
| F-2 |
Consolidated Statements of Earnings
(In thousands, except per share data)
| Year Ended December 31, | ||||||||
| 2012 | 2011 | |||||||
| Revenues | $ | 83,960 | $ | 68,790 | ||||
| Cost of goods sold | 65,020 | 52,813 | ||||||
| Gross profit | 18,940 | 15,977 | ||||||
| Operating expenses | ||||||||
| Selling, general and administrative | 13,181 | 11,070 | ||||||
| Foreign exchange (gain) loss | (188 | ) | 197 | |||||
| Total operating expenses | 12,993 | 11,267 | ||||||
| Operating income | 5,947 | 4,710 | ||||||
| Interest expense | 933 | 646 | ||||||
| Other expense | 92 | 820 | ||||||
| Earnings from continuing operations before income taxes | 4,922 | 3,244 | ||||||
| Provision for income taxes | 1,733 | 773 | ||||||
| Earnings from continuing operations | 3,189 | 2,471 | ||||||
| Loss from discontinued operations, net of income taxes | (199 | ) | (2,531 | ) | ||||
| Net earnings (loss) | $ | 2,990 | $ | (60 | ) | |||
| Earnings from continuing operations per share: | ||||||||
| Basic | $ | 0.54 | $ | 0.42 | ||||
| Diluted | $ | 0.54 | $ | 0.42 | ||||
| Earnings per common share: | ||||||||
| Basic | $ | 0.51 | $ | (0.01 | ) | |||
| Diluted | $ | 0.51 | $ | (0.01 | ) | |||
| Weighted average common shares outstanding: | ||||||||
| Basic | 5,907 | 5,907 | ||||||
| Diluted | 5,913 | 5,949 | ||||||
The accompanying notes are an integral part of these consolidated financial statements
| F-3 |
Consolidated Statements of Comprehensive Income
(In thousands)
| Year Ended December 31, | ||||||||
| 2012 | 2011 | |||||||
| Net earnings (loss) | $ | 2,990 | $ | (60 | ) | |||
| Other comprehensive income, net of tax | ||||||||
| Foreign currency translation adjustments | 133 | (241 | ) | |||||
| Pension adjustment, net of taxes | (246 | ) | (277 | ) | ||||
| Other comprehensive income (loss) | (113 | ) | (518 | ) | ||||
| Comprehensive income (loss) | $ | 2,877 | $ | (578 | ) | |||
The accompanying notes are an integral part of these consolidated financial statements
| F-4 |
Consolidated Balance Sheets
(In thousands)
| December 31, | ||||||||
| 2012 | 2011 | |||||||
| ASSETS | ||||||||
| Current Assets | ||||||||
| Cash and cash equivalents | $ | 467 | $ | 1,398 | ||||
| Accounts receivable | 10,579 | 8,172 | ||||||
| Inventories | 14,912 | 13,711 | ||||||
| Income taxes receivable | 69 | 517 | ||||||
| Deferred income taxes | 563 | 753 | ||||||
| Prepaid expenses and other current assets | 885 | 421 | ||||||
| Current assets of discontinued operations | 47 | 457 | ||||||
| Total current assets | 27,522 | 25,429 | ||||||
| Property, plant and equipment | 10,937 | 9,983 | ||||||
| Noncurrent deferred income taxes | 700 | 679 | ||||||
| Other assets | 798 | 300 | ||||||
| Intangible assets | 5,329 | 5,585 | ||||||
| Goodwill | 6,892 | 6,862 | ||||||
| Total assets | $ | 52,178 | $ | 48,838 | ||||
| LIABILITIES AND SHAREHOLDERS' EQUITY | ||||||||
| Current Liabilities | ||||||||
| Accounts payable and accrued liabilities | $ | 12,044 | $ | 11,316 | ||||
| Current maturities of long-term debt and capital lease obligations | 7,335 | 8,870 | ||||||
| Income taxes payable | 1,135 | 445 | ||||||
| Current liabilities of discontinued operations | 125 | 554 | ||||||
| Total current liabilities | 20,639 | 21,185 | ||||||
| Long-term debt and capital lease obligations, net of current maturities | 9,795 | 9,015 | ||||||
| Pension deficit | 837 | 569 | ||||||
| Noncurrent deferred income taxes | 2,992 | 3,301 | ||||||
| Total liabilities | 34,263 | 34,070 | ||||||
| Commitments | ||||||||
| Shareholders' Equity | ||||||||
| Preferred stock, par value $0.001; 5,000,000 shares authorized; none issued | - | - | ||||||
| Common stock, par value $0.001; 30,000,000 shares authorized; 5,907,255 shares issued and outstanding | 6 | 6 | ||||||
| Additional paid-in capital | 8,065 | 7,795 | ||||||
| Accumulated other comprehensive loss | (936 | ) | (823 | ) | ||||
| Retained earnings | 10,780 | 7,790 | ||||||
| Total shareholders' equity | 17,915 | 14,768 | ||||||
| Total liabilities and shareholders' equity | $ | 52,178 | $ | 48,838 | ||||
The accompanying notes are an integral part of these consolidated financial statements
| F-5 |
Consolidated Statements of Cash Flows
(In thousands)
| Year Ended December 31, | ||||||||
| 2012 | 2011 | |||||||
| Operating activities | ||||||||
| Net earnings (loss) | $ | 2,990 | $ | (60 | ) | |||
| Depreciation | 1,251 | 834 | ||||||
| Amortization of intangibles | 285 | 252 | ||||||
| Deferred tax expense | (153 | ) | (524 | ) | ||||
| Accrued pension | 9 | - | ||||||
| Stock-based compensation | 270 | 254 | ||||||
| Restructuring and asset impairment charges, discontinued operations | 49 | 1,815 | ||||||
| Changes in current operating assets and liabilities | ||||||||
| Accounts receivable, net | (2,288 | ) | (381 | ) | ||||
| Inventories | (1,000 | ) | (3,775 | ) | ||||
| Prepaid expenses and other assets | (658 | ) | 88 | |||||
| Income taxes | 1,137 | 1,120 | ||||||
| Accounts payable and accrued liabilities | 585 | 2,316 | ||||||
| Discontinued operations assets and liabilities, net | (69 | ) | (341 | ) | ||||
| Net cash provided by (used in) operating activities | 2,408 | 1,598 | ||||||
| Investing activities | ||||||||
| Additions to property, plant and equipment | (2,069 | ) | (1,361 | ) | ||||
| Acquisition of subsidiaries and related assets, net of cash acquired | - | (7,830 | ) | |||||
| Note receivable | (300 | ) | (300 | ) | ||||
| Net cash used in investing activities | (2,369 | ) | (9,491 | ) | ||||
| Financing activities | ||||||||
| Increase (decrease) in bank overdrafts | - | (531 | ) | |||||
| Increase (decrease) in revolving credit facilities | (1,092 | ) | 3,034 | |||||
| Increase in long-term debt | 2,496 | 10,038 | ||||||
| Repayment of long-term debt and capital lease obligations | (2,447 | ) | (3,786 | ) | ||||
| Net cash provided by (used in) financing activities | (1,043 | ) | 8,755 | |||||
| Increase (decrease) in cash and cash equivalents | (1,004 | ) | 862 | |||||
| Effect of foreign exchange on cash and cash equivalents | 73 | 20 | ||||||
| Cash and cash equivalents | ||||||||
| Beginning of year | 1,398 | 516 | ||||||
| End of Year | $ | 467 | $ | 1,398 | ||||
The accompanying notes are an integral part of these consolidated financial statements
| F-6 |
Consolidated Statements of Shareholders' Equity
(Dollars in thousands)
| Additional | Accumulated | Total | ||||||||||||||||||||||
| Common Stock | paid-in | Retained | other compre- | shareholders' | ||||||||||||||||||||
| Shares | Amount | capital | earnings | hensive (loss) | equity | |||||||||||||||||||
| Balance - December 31, 2010 | 5,907,255 | $ | 6 | $ | 7,541 | $ | 7,850 | $ | (305 | ) | $ | 15,092 | ||||||||||||
| Net loss | - | - | - | (60 | ) | - | (60 | ) | ||||||||||||||||
| Stock-based compensation | - | - | 254 | - | - | 254 | ||||||||||||||||||
| Foreign currency translation adjustment | - | - | - | - | (241 | ) | (241 | ) | ||||||||||||||||
| Pension adjustment, net of taxes | - | - | - | - | (277 | ) | (277 | ) | ||||||||||||||||
| Balance - December 31, 2011 | 5,907,255 | 6 | 7,795 | 7,790 | (823 | ) | 14,768 | |||||||||||||||||
| Net Earnings | - | - | - | 2,990 | - | 2,990 | ||||||||||||||||||
| Stock-based compensation | - | - | 270 | - | - | 270 | ||||||||||||||||||
| Foreign currency translation adjustment | - | - | - | - | 133 | 133 | ||||||||||||||||||
| Pension adjustment, net of taxes | - | - | - | - | (246 | ) | (246 | ) | ||||||||||||||||
| Balance - December 31, 2012 | 5,907,255 | $ | 6 | $ | 8,065 | $ | 10,780 | $ | (936 | ) | $ | 17,915 | ||||||||||||
The accompanying notes are an integral part of these consolidated financial statements
| F-7 |
| 1. | Business and Organization |
Pioneer Power Solutions, Inc. (the “Company”), a Delaware corporation, is a manufacturer of specialty electrical equipment and provides a broad range of custom-engineered and general purpose electrical transformers for applications in the utility, industrial and commercial segments of the electrical transmission and distribution industry. The Company is headquartered in Fort Lee, New Jersey and operates from seven additional locations in the U.S., Canada and Mexico for manufacturing, centralized distribution, engineering, sales and administration.
On April 30, 2010, the Company acquired Jefferson Electric, Inc., a Wisconsin-based manufacturer and supplier of dry-type transformers.
On June 7, 2010 and August 13, 2010, the Company acquired substantially all the operating assets and then 100% of the voting and economic interests of AAER Inc., a manufacturer of wind turbines based in Quebec, Canada, to form Pioneer Wind Energy Systems Inc. In September 2011, the Company committed to a plan to divest or wind down the Pioneer Wind Energy Systems Inc. subsidiary, which business is classified in the Company’s financial statements under discontinued operations.
On June 1, 2011, the Company’s board of directors authorized a one-for-five reverse stock split which took effect on June 20, 2011. All share and related stock option and warrant information presented in these financial statements and accompanying footnotes has been retroactively adjusted to reflect the reduced number of shares resulting from this action.
On July 1, 2011, the Company acquired all of the capital stock of Bemag Transformer Inc., a Quebec-based manufacturer of low and medium voltage dry-type transformers and custom magnetics. Also on such date, the Company acquired all the machinery and equipment assets of Vermont Transformer, Inc., the former U.S. affiliate of Bemag Transformer Inc.
| 2. | Summary of Significant Accounting Policies |
Principles of Consolidation
The consolidated financial statements include the accounts of the Company and its wholly-owned subsidiaries. All significant intercompany accounts and transactions have been eliminated on consolidation.
Reclassifications
Certain reclassifications have been made in prior years’ financial statements to conform to the presentation used in the current year. These reclassifications have not resulted in any changes to the previously reported net income for any year.
Use of Estimates
The preparation of financial statements in accordance with U.S. GAAP requires management to make estimates and assumptions that affect the reported amounts of assets and liabilities and disclosures of contingent assets and liabilities at the date of the financial statements and the reported amounts of revenues and expenses during the reporting period. The financial statements include estimates based on currently available information and management's judgment as to the outcome of future conditions and circumstances. Significant estimates in these financial statements include allowance for doubtful accounts, inventory provision, useful lives and impairment of long-lived assets, warranty accruals, income tax determination, stock-based compensation, cost of pension benefits and estimates related to purchase price allocation.
Changes in the status of certain facts or circumstances could result in material changes to the estimates used in the preparation of the financial statements and actual results could differ from the estimates and assumptions.
| F-8 |
Revenue Recognition
Revenue is recognized when (1) persuasive evidence of an arrangement exists, (2) delivery occurs, (3) the sales price is fixed or determinable, (4) collectability is reasonably assured and (5) customer acceptance criteria, if any, has been successfully demonstrated. Revenue is recognized on the sale of goods, when the significant risks and rewards of ownership have been transferred to the buyer upon delivery, provided that the Company maintains neither managerial involvement to the degree usually associated with ownership, nor effective control over the goods sold. There are no further obligations on the part of the Company subsequent to revenue recognition, except when customers have the right of return or when the Company warrants the product. The Company records a provision for future returns, based on historical experience at the time of shipment of products to customers. The Company warrants some of its products against defects in design, materials and workmanship for periods ranging from one to three years depending on the model. The Company records a provision for estimated future warranty costs based on the historical relationship of warranty claims to sales at the time of shipment of products to customers. The Company periodically reviews the adequacy of its product warranties and adjusts, if necessary, the warranty percentage and accrued warranty reserve for actual experience.
The following table provides detail of change in the Company's product warranty provision, which is a component of accrued liabilities on the consolidated balance sheets for the years ended December 31, 2012 and 2011 (in thousands):
| December 31, | ||||||||
| 2012 | 2011 | |||||||
| Balance at beginning of year | $ | 312 | $ | 291 | ||||
| Increase due to acquisition during year | - | 48 | ||||||
| Increase due to warranty expense | 108 | 284 | ||||||
| Deductions for warranty charges | (215 | ) | (308 | ) | ||||
| Change due to foreign currency translation | 6 | (3 | ) | |||||
| Balance at end of year | $ | 211 | $ | 312 | ||||
Financial Instruments
The Company estimates the fair value of its financial instruments based on current interest rates, market value and pricing of financial instruments with comparable terms. Unless otherwise indicated, the carrying value of these financial instruments approximates their fair market value.
Cash and Cash Equivalents
Cash and cash equivalents comprise cash on hand, demand deposits and investments with an original maturity at the date of purchase of three months or less.
Supplemental disclosure of cash flow information (in thousands):
| Year Ended December 31, | ||||||||
| 2012 | 2011 | |||||||
| Interest paid | $ | 936 | $ | 728 | ||||
| Income taxes paid | 952 | 1,328 | ||||||
Accounts Receivable
The Company accounts for trade receivables at original invoice amount less an estimate made for doubtful receivables based on a review of all outstanding amounts on a monthly basis. Management determines the allowance for doubtful accounts by regularly evaluating individual customer receivables and considering a customer's financial condition, credit history and current economic conditions. The Company writes off trade receivables when they are deemed uncollectible. The Company records recoveries of trade receivables previously written off when it receives them. Management considers the Company’s allowance for doubtful accounts, which was $29,000 and $54,000 as of December 31, 2012 and 2011, respectively, sufficient to cover any exposure to loss in its accounts receivable.
| F-9 |
Long-Lived Assets
Depreciation and amortization for property, plant and equipment, and finite life intangible assets, is computed and included in cost of goods sold and in selling and administrative expense, as appropriate. Long-lived assets, consisting primarily of property, plant and equipment, are stated at cost less accumulated depreciation. Depreciation is recorded using the declining balance method for buildings, furniture and fixtures at the Company’s Canadian operations. Non-Canadian property, plant and equipment are depreciated using the straight line method, based on the estimated useful lives of the assets (buildings – 25 years, machinery and equipment - 5 to 15 years, computer hardware and software - 3 to 5 years). Depreciation commences once the assets are ready for their intended use.
Finite life intangible assets consist of non-compete agreements, which have defined terms, and three categories of customer relationships for which estimated useful lives were determined based on actual historical customer attrition rates. These finite life intangible assets are amortized by the Company over periods ranging from three to twenty years.
Long-lived and finite life intangible assets are reviewed for impairment whenever events or circumstances have occurred that indicate the remaining useful life of the asset may warrant revision or that the remaining balance of the asset may not be recoverable. In addition, finite life intangible assets are tested at least once annually through quantitative analysis. Upon indications of impairment, or in the normal course of annual testing, assets and liabilities are grouped at the lowest level for which identifiable cash flows are largely independent of the cash flows of other assets and liabilities. The measurement of possible impairment is generally estimated by the ability to recover the balance of an asset group from its expected future operating cash flows on an undiscounted basis. If such assets are considered to be impaired, the impairment to be recognized is measured by the amount by which the carrying amount of the asset exceeds the fair value thereof. Determining asset groups and underlying cash flows requires the use of significant judgment.
Goodwill and Indefinite Life Intangible Assets
Goodwill is tested for impairment at the reporting unit level, which is equivalent to the Company’s subsidiary-level financial statements, and based on the net assets for each subsidiary, including goodwill and intangible assets. Goodwill is assigned to each operating subsidiary, as this represents the lowest level that constitutes a business for which discrete financial information is available, and is the level at which management regularly reviews operating results.
Goodwill and indefinite life intangible assets are evaluated for impairment annually, or immediately if events or other conditions indicate there may be a possible permanent loss of value, using either a quantitative or a qualitative analysis. The Company performs a quantitative analysis using a discounted cash flow model and other valuation techniques, but may elect to perform a qualitative analysis. A quantitative analysis is used to determine an estimated fair value representing the amount at which a reporting unit could be bought or sold in a current transaction between willing parties on an arms-length basis. The estimated fair value of each reporting unit is derived using a discounted cash flow method based on market and reporting unit-specific assumptions, including estimated future revenues and expenses, weighted average cost of capital, capital expenditures, the useful life over which cash flows will occur and other assumptions which are considered reasonable and inherent in discounted cash flow analysis. A qualitative analysis is performed by assessing certain trends and factors, including projected market outlook and growth rates, forecasted and actual sales and operating profit margins, discount rates, industry data and other relevant qualitative factors. These trends and factors are compared to, and based on, the assumptions used in the most recent quantitative assessment.
Goodwill impairment testing for 2012 and 2011 was performed by using quantitative analysis, as described above, for each of the Company’s reporting units having a carrying amount of goodwill. As a result of the quantitative analysis performed, the Company determined that no impairments were warranted for 2012, and 2011.
| F-10 |
Indefinite life intangible assets primarily consist primarily of trademarks. The fair value of these assets are determined using a royalty relief methodology similar to that employed when the associated assets were acquired, but using updated estimates of future sales, cash flows and profitability. For 2012 and 2011, the fair value of indefinite life intangible assets exceeded their respective carrying values.
Foreign Currency Translation
The functional currency for the Companies foreign subsidiaries is the local currency in which the entity is located. The financial statements of all subsidiaries with a functional currency other than the U.S. Dollar have been translated into U.S. Dollars. All assets and liabilities of foreign operations are translated into U.S. Dollars using year-end exchange rates, and all revenues and expenses are translated at average rates during the respective period. The U.S. Dollar results that arise from such translation, as well as exchange gains and losses on intercompany balances of a long-term investment nature, are included in the cumulative currency translation adjustments in accumulated other comprehensive income in stockholders’ equity.
Income Taxes
The Company accounts for income taxes under the asset and liability method, based on the income tax laws and rates in the countries in which operations are conducted and income is earned. This approach requires the recognition of deferred tax assets and liabilities for the expected future tax consequences of temporary differences between the carrying amounts and the tax basis of assets and liabilities. Developing the provision for income taxes requires significant judgment and expertise in federal, international and state income tax laws, regulations and strategies, including the determination of deferred tax assets and liabilities and, if necessary, any valuation allowances that may be required for deferred tax assets. The Company records a valuation allowance to reduce its deferred tax assets to the amount that is more likely than not to be realized. The Company believes that the deferred tax asset recorded as of December 31, 2012, is realizable through future reversals of existing taxable temporary differences and future taxable income. If the Company was to subsequently determine that it would be able to realize deferred tax assets in the future in excess of its net recorded amount, an adjustment to deferred tax assets would increase earnings for the period in which such determination was made. The Company will continue to assess the adequacy of the valuation allowance on a quarterly basis. The Company’s judgments and tax strategies are subject to audit by various taxing authorities.
The objective of accounting for income taxes is to recognize the amount of taxes payable or refundable for the current year and deferred tax liabilities and assets for the future tax consequences or events that have been recognized in the Company’s financial statements or tax returns. The Company recognizes the tax benefit from an uncertain tax position only if it is more likely than not that the tax position will be sustained on examination by the taxing authorities, based on the technical merits of the position (see “Unrecognized Tax Benefits" below).
Interest and penalties are grouped with interest expense on the consolidated statement of earnings.
Unrecognized Tax Benefits
The Company accounts for unrecognized tax benefits in accordance with Financial Accounting Standards Board (“FASB”) Accounting Standards Codification (“ASC”) "Income Taxes" ("ASC 740"). ASC 740 prescribes a recognition threshold that a tax position is required to meet before being recognized in the financial statements and provides guidance on de-recognition, measurement, classification, interest and penalties, accounting in interim periods, disclosure and transition issues. ASC 740 contains a two-step approach to recognizing and measuring uncertain tax positions. The first step is to evaluate the tax position for recognition by determining if the weight of available evidence indicates that it is more likely than not that the position will be sustained upon ultimate settlement with a taxing authority, including resolution of related appeals or litigation processes, if any. The second step is to measure the tax benefit as the largest amount that is more than 50% likely of being realized upon ultimate settlement.
Additionally, ASC 740 requires the Company to accrue interest and related penalties, if applicable, on all tax positions for which reserves have been established consistent with jurisdictional tax laws.
| F-11 |
Sales Tax
The Company discloses the amount of those taxes that are recognized on a gross basis in interim and annual financial statements for each period for which an income statement is presented if those amounts are significant. While the amounts are not material, the Company's policy is to present such taxes on a net basis in the consolidated statements of earnings.
Share-Based Payments
The Company accounts for share based payments in accordance with the provisions of FASB ASC 718 "Compensation - Stock Compensation" and accordingly recognizes in its financial statements share based payments at their fair value. In addition, it recognizes in the financial statements an expense based on the grant date fair value of stock options granted to employees and directors. The expense is recognized on a straight line basis over the expected option life while taking into account the vesting period and the offsetting credit is recorded in additional paid-in capital. Upon exercise of options, the consideration paid together with the amount previously recorded as additional paid-in capital is recognized as capital stock. The Company estimates its forfeiture rate in order to determine its compensation expense arising from stock based awards. The Company uses the Black-Scholes Merton option pricing model to determine the fair value of the options. Non-employee members of the Board of Directors are deemed to be employees for the purposes of recognizing share-based compensation expense.
Employee Benefit Plan
The Company sponsors a defined benefit plan as described in Note 15. The cost of pension benefits earned by employees is actuarially determined using the accumulated benefit method and a discount rate, used to measure interest cost on the accrued employee future benefit obligation, based on market interest rates on high-quality debt instruments with maturities that match the timing and benefits expected to be paid by the plan. Plan assets are valued using current market values and the expected return on plan assets is based on the fair value of the plan assets.
The costs that relate to employee current service are charged to income annually.
The transitional obligation created upon adoption of the FASB ASC 715 "Compensation - Retirement Benefits" is amortized over the average remaining service period of employees. For a given year, unrecognized actuarial gains or losses are recognized into income if the unamortized balance at the beginning of the year is more than 10% of the greater of the plan asset or liability balance. Any unrecognized actuarial gain or loss in excess of this threshold is recognized in income over the remaining service period of the employees.
The Company reflects the funded status of its defined pension plans as a net asset or net liability in its balance sheet, with an offsetting amount in accumulated other comprehensive income, and recognizes changes in that funded status in the year in which the changes occur through comprehensive income.
Inventories
Inventories are stated at the lower of cost or market using first-in, first-out (FIFO) or weighted-average methods and include the cost of materials, labor and manufacturing overhead. The Company uses estimates in determining the level of reserves required to state inventory at the lower of cost or market. The Company estimates are based on market activity levels, production requirements, the physical condition of products and technological innovation. Changes in any of these factors may result in adjustments to the carrying value of inventory.
Earnings Per Share
Basic earnings per share is computed by dividing the earnings for the period by the weighted average number of common shares outstanding during the period. Diluted earnings per share is computed by dividing the earnings for the period by the weighted average number of common and common equivalent shares outstanding during the period. Potentially dilutive securities composed of incremental common shares issuable upon the exercise of stock options or warrants was included in diluted earnings per share since the exercise price of some of the Company’s stock options and/or warrants were in the money (see Note 18 “Basic and Diluted Earnings Per Share”).
| F-12 |
Fair Value Measurements
FASB ASC 820 “Fair Value Measurement and Disclosure” applies to all assets and liabilities that are being measured and reported on a fair value basis. ASC 820 establishes a framework for measuring fair value in U.S GAAP, and expands disclosure about fair value measurements. ASC 820 enables the reader of the financial statements to assess the inputs used to develop those measurements by establishing a hierarchy for ranking the quality and reliability of the information used to determine fair values. ASC 820 requires that assets and liabilities carried at fair value be classified and disclosed in one of the following three categories:
| Level 1: | Quoted market prices in active markets for identical assets or liabilities. |
| Level 2: | Observable market based inputs or unobservable inputs that are corroborated by market data. |
| Level 3: | Unobservable inputs that are not corroborated by market data. |
In determining the appropriate levels, the Company performs a detailed analysis of the assets and liabilities that are subject to ASC 820. At each reporting period, all assets and liabilities for which the fair value measurement is based on significant unobservable inputs are classified as Level 3.
The fair value represents management’s best estimates based on a range of methodologies and assumptions. The carrying value of receivables and payables arising in the ordinary course of business approximate fair value because of the relatively short period of time between their origination and expected realization. These items have been classified as Level 1.
| 3. | Recent Accounting Pronouncements |
The Company adopted certain amendments to Accounting Standards Codification (“ASC”) 820, “Fair Value Measurements,” effective January 1, 2012. These amendments include a consistent definition of fair value, enhanced disclosure requirements for “Level 3” fair value adjustments and other changes to required disclosures. Their adoption did not have a material impact on the Company’s consolidated financial statements.
The Company adopted the amendments to ASC 220, “Comprehensive Income,” effective January 1, 2012. The amendments pertained to presentation and disclosure only.
The Company adopted the amendments to ASC 350, “Intangibles-Goodwill and Others,” effective January 1, 2012. The amended guidance allows the Company to do an initial qualitative assessment of relevant events and circumstances to determine if fair value of a reporting unit is more likely than not to be less than its carrying value, prior to performing the two-step quantitative goodwill impairment test. The adoption of these amendments did not have a material impact on the Company’s consolidated financial statements.
In July 2012, the Financial Accounting Standards Board amended ASC 350 to provide the option to do an initial qualitative assessment of relevant events and circumstances prior to calculating the fair value of an indefinite-lived intangible asset. This amendment is effective for annual and interim impairment tests performed for fiscal years beginning after September 15, 2012. The Company will comply with the requirements of this pronouncement when it becomes effective. This pronouncement is not expected to have a material impact on our consolidated financial statements.
| 4. | Acquisitions |
On July 1, 2011, 7834080 Canada Inc., an indirect wholly-owned subsidiary of the Company, completed the acquisition of all of the capital shares of Bemag Transformer Inc. Pursuant to the share purchase agreement, as amended, all the capital shares of Bemag Transformer Inc. were purchased in a transaction valued at approximately $9.1 million, which amount includes approximately $2.8 million of Bemag Transformer Inc.’s former revolving and long-term debt which was repaid by the Company at closing.
| F-13 |
The transaction was accounted for under the purchase method of accounting. Under the purchase method of accounting, the total estimated purchase price is allocated to the tangible and intangible assets acquired and liabilities assumed in connection with the acquisition, based on their estimated fair values as of the effective date of the acquisition. Goodwill arising from the acquisition has been determined as the excess of the purchase price over the net of the amounts assigned to acquired assets and liabilities assumed.
The allocation of the purchase price was as follows (in thousands):
| Purchase Price: | ||||
| Cash | $ | 6,231 | ||
| Debt repaid at closing | 2,830 | |||
| Total consideration | $ | 9,061 | ||
| Purchase Price Allocation: | ||||
| Cash and cash equivalents | $ | - | ||
| Accounts receivable | 2,870 | |||
| Inventory | 3,040 | |||
| Prepaid expenses | 30 | |||
| Deferred income taxes | 3 | |||
| Income taxes receivable | 181 | |||
| Property and equipment | 3,488 | |||
| Accounts payable and accrued liabilities | (2,683 | ) | ||
| Deferred tax liabilities | (744 | ) | ||
| Net tangible assets acquired | 6,185 | |||
| Intangible assets acquired | 1,476 | |||
| Goodwill | 1,400 | |||
| Total purchase price | $ | 9,061 | ||
Identifiable intangible assets having finite lives arising from the acquisition were valued at $0.9 million, consisting primarily of customer relationships and a non-compete agreement. These intangible assets are amortized on a straight-line basis with a weighted average remaining useful life of 13.5 years. None of these definite-lived intangible assets acquired are deductible for tax purposes. Indefinite-lived intangible assets acquired are valued at $0.6 million and consist of trademarks and certain technology-related industry accreditations, neither of which are deductible for tax purposes. The excess of the purchase price over the aggregate fair values, which was approximately $1.4 million, was recorded as goodwill. Goodwill has an indefinite life, is not subject to amortization and is not deductible for tax purposes. Goodwill arising from the acquisition is tested for impairment at least annually (more frequently if indicators of impairment arise). In the event that management determines that the goodwill has become impaired, the Company will incur an accounting charge for the amount of the impairment during the fiscal quarter in which the determination is made.
The Company incurred acquisition transaction costs of approximately $0.3 million for the year ended December 31, 2011. These costs were expensed in 2011.
On July 1, 2011, 7834080 Canada Inc., an indirect wholly-owned subsidiary of the Company, entered into an equipment purchase agreement with the shareholders of Vermont Transformer, Inc., the former U.S. affiliate of Bemag Transformer Inc. On such date, all of the equipment used by Vermont Transformer, Inc. in the operation of its business was acquired in exchange for $1.6 million. For accounting purposes the transaction was treated as a purchase of assets and the amount of consideration paid, plus transaction expenses, was attributed to the assets acquired consisting solely of machinery and equipment.
| F-14 |
| 5. | Discontinued Operations |
During September 2011, the Company committed to a plan to divest or wind down its Pioneer Wind Energy Systems Inc. subsidiary which was established by the Company in 2010 to market its utility scale wind turbine designs, after-sales services and equipment financing to community wind and industrial customers. This decision was part of the Company’s strategy to focus on businesses that create the most shareholder value. The decision to divest or wind down the business resulted in a non-cash asset impairment charge of $1.6 million to adjust the carrying value of the subsidiary’s assets to their fair value. This impairment charge was recognized in the third quarter of 2011 on certain inventory, property, plant and equipment and other assets. In addition, at the time the Company decided to discontinue this business the Company also recognized a $0.6 million charge related to expected future severance, rent and insurance payment obligations associated with the decision.
The results of operations for Pioneer Wind Energy Systems Inc. are reported as discontinued operations for all periods presented and are summarized as follows (in thousands):
| Year Ended December 31, | ||||||||
| 2012 | 2011 | |||||||
| Net sales | $ | 230 | $ | - | ||||
| (Loss) from operations of discontinued business (1) | (199 | ) | (2,531 | ) | ||||
| Income tax expense | - | - | ||||||
| (Loss) from discontinued operations, net of tax | $ | (199 | ) | $ | (2,531 | ) | ||
| (1) | Loss from operations before tax in 2011 includes non-cash asset impairment charges of $1.6 million. |
The following is a summary of the assets and liabilities of discontinued operations (in thousands):
| December 31, 2012 |
||||
| Prepaid expenses and other current assets | $ | 47 | ||
| Assets of discontinued operations | $ | 47 | ||
| Accounts payable | $ | 10 | ||
| Accrued liabilities | 114 | |||
| Liabilities of discontinued operations | $ | 124 |
| 6. | Inventories |
The components of inventories are summarized below (in thousands):
| December 31, | ||||||||
| 2012 | 2011 | |||||||
| Raw materials | $ | 5,130 | $ | 6,184 | ||||
| Work in process | 4,360 | 2,974 | ||||||
| Finished goods | 5,779 | 5,217 | ||||||
| Provision for excess and obsolete inventory | (357 | ) | (664 | ) | ||||
| Total inventories | $ | 14,912 | $ | 13,711 | ||||
Included in raw materials are goods in transit of approximately $0.3 million (2011 - $0.3 million).
| F-15 |
| 7. | Property, Plant and Equipment |
Property, plant and equipment are summarized below (in thousands):
| December 31, | ||||||||
| 2012 | 2011 | |||||||
| Land | $ | 113 | $ | 7 | ||||
| Buildings | 3,091 | 1,996 | ||||||
| Machinery and equipment | 11,738 | 11,108 | ||||||
| Furniture and fixtures | 209 | 195 | ||||||
| Computer hardware and software | 929 | 742 | ||||||
| Leasehold improvements | 57 | 54 | ||||||
| Construction in progress | 397 | 169 | ||||||
| 16,534 | 14,271 | |||||||
| Less: accumulated depreciation | (5,597 | ) | (4,288 | ) | ||||
| Total property, plant and equipment, net | $ | 10,937 | $ | 9,983 | ||||
| 8. | Goodwill and Other Intangible Assets |
Changes in goodwill and intangible asset balances for the years ended December 31, 2012 and 2011 consisted of the following (in thousands):
| Intangible | ||||||||
| Goodwill | assets | |||||||
| Balance December 31, 2010 | $ | 5,534 | $ | 4,436 | ||||
| Additions due to acquisitions | 1,400 | 1,476 | ||||||
| Amortization | - | (252 | ) | |||||
| Foreign currency translation | (72 | ) | (75 | ) | ||||
| Balance as of December 31, 2011 | 6,862 | 5,585 | ||||||
| Additions due to acquisitions | - | - | ||||||
| Amortization | - | (285 | ) | |||||
| Foreign currency translation | 30 | 29 | ||||||
| Balance as of December 31, 2012 | $ | 6,892 | $ | 5,329 | ||||
The components of intangible assets at December 31, 2012 are summarized below (in thousands):
| Intangible | Accumulated | Foreign currency | Net book | |||||||||||||
| assets | amortization | translation | value | |||||||||||||
| Customer relationships | $ | 2,962 | $ | (617 | ) | $ | (28 | ) | $ | 2,317 | ||||||
| Non-compete agreement | 95 | (64 | ) | (1 | ) | 30 | ||||||||||
| Trademarks | 2,049 | - | (8 | ) | 2,041 | |||||||||||
| Technology-related industry accreditations | 950 | - | (9 | ) | 941 | |||||||||||
| Total intangible assets | $ | 6,056 | $ | (681 | ) | $ | (46 | ) | $ | 5,329 | ||||||
Future scheduled annual amortization expense for finite life intangible assets is as follows (in thousands):
| Years Ending December 31, | Total | |||
| 2013 | $ | 284 | ||
| 2014 | 265 | |||
| 2015 | 265 | |||
| 2016 | 264 | |||
| 2017 | 262 | |||
| Thereafter | 1,007 | |||
| $ | 2,347 | |||
| F-16 |
| 9. | Debt |
Canadian Credit Facilities
In June 2011, Pioneer Electrogroup Canada Inc., a wholly owned subsidiary of the Company and the parent company of the Company’s active Canadian subsidiaries, Pioneer Transformers Ltd. and Bemag Transformer Inc. (the “Borrowers”), entered into a letter loan agreement with the Company’s Canadian bank (the “Canadian Facilities”) that replaced and superseded all of the Company’s prior financing arrangements with such bank. Bemag Transformer Inc. became a party to the Canadian Facilities on July 1, 2011, upon the acquisition of all of its capital shares by the Company.
The Canadian Facilities provide for up to $23.0 million CAD (approximately $23.1 million expressed in U.S. dollars) consisting of a $10.0 million demand revolving credit facility (“Facility A”) to finance ongoing operations, a $2.0 million term credit facility (“Facility B”) that financed a plant expansion, a $10.0 million term credit facility (“Facility C”) to finance acquisitions, capital expenditures or to provide funding to the Company, a $50,000 Corporate MasterCard credit facility (“Facility D”) and a $1.0 million foreign exchange settlement risk facility (“Facility E”).
The Canadian Facilities are secured by a first-ranking lien in the amount of approximately $25 million CAD on all of the present and future movable and immovable property of the Borrowers and their subsidiaries.
The Canadian Facilities require the Borrowers to comply on a consolidated basis with various financial covenants, including maintaining a minimum fixed charge coverage ratio of 1.25, a maximum funded debt to EBITDA ratio of 2.75 and a limitation on funded debt to less than 60% of capitalization. The Canadian Facilities also restrict the ability of the Borrowers to, among other things, (i) provide any funding to any person, including affiliates, in an aggregate amount exceeding $5.0 million CAD or (ii) make distributions in an aggregate amount exceeding 50% of Pioneer Electrogroup Canada Inc.’s previous year’s net income.
Facility A is subject to margin criteria and borrowings bear interest at the bank’s prime rate plus 0.50% per annum on amounts borrowed in Canadian dollars, or the U.S. base rate plus 0.50% per annum or LIBOR plus 2.00% per annum on amounts borrowed in U.S. dollars.
Borrowings under Facility B bear interest at the bank’s prime rate plus 1.00% per annum with principal repayments becoming due on a five year amortization schedule.
Borrowings under Facility C are repayable according to a five year principal amortization schedule and bear interest at the following rates: if the funded debt to EBITDA ratio is equal to or greater than 2.00, the bank’s prime rate plus 1.25% per annum on amounts borrowed in Canadian dollars, or the U.S. base rate plus 1.25% per annum or LIBOR plus 2.50% per annum on amounts borrowed in U.S. dollars; or, if the funded debt to EBITDA ratio is less than 2.00, the bank’s prime rate plus 1.00% per annum on amounts borrowed in Canadian dollars, or the U.S. base rate plus 1.00% per annum or LIBOR plus 2.25% per annum on amounts borrowed in U.S. dollars. In addition, Facility C is subject to a standby fee which is calculated monthly using the unused portion of the facility at either 0.625% per annum if the funded debt to EBITDA ratio is equal to or greater than 2.00, or 0.5625% per annum if the funded debt to EBITDA ratio is less than 2.00.
As of December 31, 2012, the Company had approximately $10.8 million in U.S. dollar equivalents outstanding under the Canadian Facilities and was in compliance with its financial covenant requirements. The Company’s borrowings consisted of approximately $0.2 million outstanding under Facility A, $1.5 million outstanding under Facility B, and $9.1 million outstanding under Facility C.
| F-17 |
United States Credit Facilities
In January 2008, the Company’s Jefferson Electric, Inc. subsidiary entered into a bank loan agreement with a U.S. bank that included a revolving credit facility and a term credit facility (the “U.S. Facilities”). As of April 30, 2010, the date the Company acquired Jefferson Electric, Inc., final payment of all outstanding amounts under the U.S. Facilities became due on October 31, 2011. The interest rate under the revolving credit facility was equal to the greater of the bank’s reference rate or 6.5% per annum. The interest rate under the term credit facility was 7.27% annually.
In November 2011, Jefferson Electric, Inc. revised its financing arrangement and extended the maturity date of the U.S. Facilities to October 31, 2012. The amended loan agreement provided for an increase in the borrowing base limit of the revolving credit facility to $6.0 million and a decrease in the interest rate to the bank’s reference rate plus 2.0%. In connection with the amendment, the Company prepaid $250,000 under the term credit facility in November 2011 and made an additional prepayment of $750,000 in January 2012. The interest rate under the term credit facility was reduced to 6.0% annually, with monthly payments of principal and accrued interest calculated based on a 5-year term and a final payment of all outstanding amounts due on October 31, 2012. In addition, the Company entered into a guaranty agreement with respect to Jefferson Electric, Inc.’s obligations under the U.S. Facilities.
In October 2012, Jefferson Electric, Inc. revised its financing arrangement and extended the maturity date of the U.S. Facilities to October 31, 2013. The interest rate under the revolving credit facility was reduced to a floating rate subject to a pricing grid, ranging from 2.25% to 3.50% above one month LIBOR, which can result in increases or decreases to the borrowing spread depending on Jefferson Electric, Inc.’s debt service coverage ratio. The term credit facility, which was repaid in full during July 2012, was removed from the U.S. Facilities in its entirety. Borrowings under the U.S. Facilities are collateralized by substantially all the U.S. assets of Jefferson Electric, Inc., and an officer of the subsidiary is a guarantor. The U.S. Facilities, as amended, require Jefferson Electric, Inc. to comply with certain financial covenants, including a requirement to exceed a minimum target for tangible net worth and maintain a minimum debt service coverage ratio. The U.S. Facilities also restrict Jefferson Electric, Inc.’s ability to pay dividends or make distributions, advances or other transfers of assets.
As of December 31, 2012, Jefferson Electric, Inc. had approximately $4.9 million outstanding under the revolving credit facility and was in compliance with its financial covenant requirements.
Nexus Promissory Note
On July 25, 2012, the Company’s indirect wholly owned Mexican subsidiary, Nexus Magneticos de Mexico, S. de R.L. de C.V. (“Nexus”), entered into a term loan agreement with GE CF Mexico, S.A. de C.V. (“GE Capital Mexico”). At closing, GE Capital Mexico advanced to Nexus $1.65 million under the term loan agreement, less a non-refundable commission of 1% and less a pledge of cash representing 10% of the loan amount. Immediately upon receiving the term loan advance, Nexus made an intercompany loan in the same principal amount to Jefferson Electric, Inc., its controlling shareholder. In turn, Jefferson Electric, Inc. used the intercompany loan proceeds to repay a portion of its outstanding secured indebtedness owed to its U.S. bank. The net proceeds were used by Jefferson Electric, Inc. to fully repay the principal and accrued interest that was then outstanding under its term credit facility with its U.S. bank, as well as to reduce the outstanding balance under its revolving credit facility.
The term loan from GE Capital Mexico is payable in 60 consecutive monthly installments and bears interest, payable monthly, at a rate of 6.93% per annum. The term loan may be prepaid by Nexus in increments of at least $100,000, subject to the application of certain prepayment and other fees as established in the term loan agreement. The term loan agreement contains customary representations and warranties, affirmative and negative covenants and events of default, including covenants that restrict Nexus’ ability to create certain liens, incur additional liabilities, make certain types of investments, engage in mergers, consolidations, significant asset sales and affiliate transactions, pay dividends, redeem or repurchase outstanding equity and make capital expenditures.
The obligations of Nexus under the term loan are secured by (i) a pledge of cash in the amount of 10% of the term loan amount, (ii) a trust agreement, pursuant to which Nexus and Jefferson Electric, Inc. transferred title to substantially all of their equipment and machinery assets located in Mexico to a Mexican bank as trustee, to serve as security for all of Nexus’ obligations under the term loan agreement, and (iii) a corporate guaranty by the Company of all of Nexus’ obligations under the term loan agreement.
| F-18 |
Capital Lease Obligations
As of December 31, 2012, the Company had equipment loans and capital lease obligations remaining of $3,000 bearing interest at rates varying from 0.0% to 18.8% and are repayable in monthly installments. These obligations are scheduled to be paid in full by December 2013.
Long-term debt consists of the following (in thousands):
| December 31, | ||||||||
| 2012 | 2011 | |||||||
| Revolving credit facilities | $ | 5,141 | $ | 6,199 | ||||
| Term credit facilities | 10,615 | 11,669 | ||||||
| Nexus promissory note | 1,371 | - | ||||||
| Capital lease obligations | 3 | 17 | ||||||
| Total debt and capital lease obligations | 17,130 | 17,885 | ||||||
| Less current portion | (7,335 | ) | (8,870 | ) | ||||
| Total long-term debt and capital lease obligations | $ | 9,795 | $ | 9,015 | ||||
The annual maturities of long-term debt at December 31, 2012, were as follows (in thousands):
| Long-term | ||||
| debt | ||||
| Years Ending December 31, | maturities | |||
| 2013 | $ | 7,335 | ||
| 2014 | 2,020 | |||
| 2015 | 2,264 | |||
| 2016 | 5,446 | |||
| 2017 | 65 | |||
| Total long-term debt maturities | $ | 17,130 | ||
| 10. | Other Assets |
In December 2011 and January 2012, the Company’s Pioneer Transformers Ltd. subsidiary funded two promissory notes, each in the amount of $0.3 million, due from a developer of a renewable energy project in the U.S. The promissory notes accrue interest at a rate of 4.5% per annum with a final payment of all unpaid principal and interest becoming fully due and payable upon the earlier to occur of (i) the four year anniversary of the issuance date of the promissory notes, or (ii) an event of default. As defined in the promissory notes, an event of default includes, but is not limited to, the following: any bankruptcy, reorganization or similar proceeding involving the borrower, a sale or transfer of substantially all the assets of the borrower, a default by the borrower relating to any indebtedness due to third parties, the incurrence of additional indebtedness by the borrower without the Company’s written consent and failure of the borrower to perform its obligations pursuant to its other agreements with the Company, including its purchase order for pad mount transformers.
Also included in Other Assets are deferred financing costs of $0.2 million at December 31, 2012.
| 11. | Commitments |
The Company leases certain offices, facilities and equipment under operating leases expiring at various dates through 2016. At December 31, 2012 the minimum annual lease commitments under the leases having terms in excess of one year were as follows (in thousands):
| F-19 |
| Operating | ||||
| Years Ending December 31, | leases | |||
| 2013 | $ | 310 | ||
| 2014 | 85 | |||
| 2015 | 56 | |||
| 2016 | 27 | |||
| 2017 | 3 | |||
| Thereafter | - | |||
| Total lease commitments | $ | 481 | ||
Rent and lease expense was approximately $0.8 million and $0.6 million for 2012 and 2011, respectively.
| 12. | Shareholders’ Equity |
The Company had common stock, $0.001 par value, outstanding of 5,907,255 shares as of December 31, 2012 and December 31, 2011, respectively.
As of December 31, 2012, the Company had warrants outstanding to purchase 640,000 shares of common stock with an average exercise price of approximately $14.00 per share. The warrants expire on dates beginning on December 2, 2014 and ending on April 30, 2015. No warrants were exercised during the years ended December 31, 2012 and 2011.
The board of directors is authorized, subject to any limitations prescribed by law, without further vote or action by the shareholders, to issue from time to time up to 5,000,000 shares of preferred stock, $0.001 par value, in one or more series. Each such series of preferred stock shall have such number of shares, designations, preferences, voting powers, qualifications, and special or relative rights or privileges as shall be determined by the board of directors, which may include, among others, dividend rights, voting rights, liquidation preferences, conversion rights and preemptive rights.
| 13. | Stock-Based Compensation |
On December 2, 2009, the Company adopted the 2009 Equity Incentive Plan (the “2009 Plan") for the purpose of issuing incentive stock options intended to qualify under Section 422 of the Internal Revenue Code of 1986, as amended, non-qualified stock options, restricted stock, stock appreciation rights, performance unit awards and stock bonus awards to employees, directors, consultants and other service providers. A total of 320,000 shares of common stock are reserved for issuance under the 2009 Plan. Options may be granted under the 2009 Plan on terms and at prices as determined by the board of directors or by the plan administrators appointed by the board of directors.
On May 11, 2011, the board of directors of the Company adopted the Pioneer Power Solutions, Inc. 2011 Long-Term Incentive Plan (the “2011 Plan”) which was subsequently approved by stockholders of the Company on May 31, 2011. The 2011 Plan replaces and supersedes the 2009 Plan. The Company’s outside directors and employees, including the Company’s principal executive officer, principal financial officer and other named executive officers, and certain contractors are all eligible to participate in the 2011 Plan. The 2011 Plan allows for the granting of incentive stock options, nonqualified stock options, stock appreciation rights, restricted stock, restricted stock units, performance awards, dividend equivalent rights, and other awards, which may be granted singly, in combination, or in tandem, and upon such terms as are determined by the Board or a committee of the Board that is designated to administer the Plan. Subject to certain adjustments, the maximum number of shares of the Company’s common stock that may be delivered pursuant to awards under the 2011 Plan is 700,000 shares. As of December 31, 2012, 168,400 stock options had been granted, consisting of 107,200 incentive stock options and 61,200 non-qualified stock options.
| F-20 |
Expense for stock-based compensation recorded for the years ended December 31, 2012 and 2011 was approximately $0.3 million and $0.3 million, respectively. All of the stock-based compensation expense is included in selling, general and administrative expenses in the accompanying consolidated statements of earnings. As of December 31, 2012, the Company had total stock-based compensation expense remaining to be recognized of approximately $0.1 million.
The fair value of the stock options granted during the years ended December 31, 2012 and 2011was measured using the Black-Scholes valuation model with the following assumptions:
| Year Ended December 31, | |||||
| 2012 | 2011 | ||||
| Expected Volatility | 39 - 43% | 46 - 50% | |||
| Expected life | 3.5 - 6.0 | 3.5 - 6.0 | |||
| Risk-free interest rate | 0.70 - 1.34% | 1.49 - 2.55% | |||
| Dividend yield | 0% | 0% | |||
A summary of stock option activity for the years ended December 31, 2012 and 2011, and changes during the years then ended is presented below:
| Weighted | ||||||||||||||||
| Stock | Weighted average | average remaining | Aggregate | |||||||||||||
| options | exercise price | contractual term | intrinsic value | |||||||||||||
| Balance December 31, 2010 | 110,000 | $ | 15.29 | - | $ | - | ||||||||||
| Granted | 8,400 | 12.29 | - | - | ||||||||||||
| Exercised | - | - | - | - | ||||||||||||
| Forfeited | - | - | - | - | ||||||||||||
| Balance December 31, 2011 | 118,400 | $ | 15.07 | 7.0 | $ | - | ||||||||||
| Exercisable as of December 31, 2011 | 38,000 | $ | 15.29 | 7.0 | $ | - | ||||||||||
| Balance December 31, 2011 | 118,400 | $ | 15.07 | 7.0 | $ | - | ||||||||||
| Granted | 50,000 | 4.22 | 7.9 | 74,500 | ||||||||||||
| Exercised | - | - | - | - | ||||||||||||
| Forfeited | - | - | - | - | ||||||||||||
| Outstanding as of December 31, 2012 | 168,400 | $ | 11.85 | 6.6 | $ | 74,500 | ||||||||||
| Exercisable as of December 31, 2012 | 78,933 | $ | 15.09 | 6.1 | $ | - | ||||||||||
Intrinsic value is the difference between the market value of the stock at December 31, 2012 and the exercise price which is aggregated for all options outstanding and exercisable. A summary of the weighted-average grant-date fair value of options, total intrinsic value of options exercised, and cash receipts from options exercised is shown below (in thousands, except per share amounts):
| Year Ended December 31, | ||||||||||||
| 2012 | 2011 | 2010 | ||||||||||
| Weighted-average fair value of options granted (per share) | $ | 1.54 | $ | 5.20 | $ | 6.70 | ||||||
| Intrinsic value gain of options exercised | - | - | - | |||||||||
| Cash receipts from exercise of options | - | - | - | |||||||||
| F-21 |
| 14. | Income Taxes |
The components of the income tax provision were as follows (in thousands):
| Year Ended December 31, | ||||||||
| 2012 | 2011 | |||||||
| Current | ||||||||
| Federal | $ | - | $ | 104 | ||||
| State | 15 | 12 | ||||||
| Foreign | 2,131 | 807 | ||||||
| Deferred | (413 | ) | (150 | ) | ||||
| Total income tax provision | $ | 1,733 | $ | 773 | ||||
The components of earnings before income taxes are summarized below (in thousands):
| Year Ended December 31, | ||||||||
| 2012 | 2011 | |||||||
| U.S. operations | $ | (343 | ) | $ | (540 | ) | ||
| Foreign | 5,265 | 3,784 | ||||||
| Income from continuing operations before income taxes | $ | 4,922 | $ | 3,244 | ||||
A reconciliation from the statutory U.S. income tax rate and the Company's effective income tax rate, as computed on earnings before income taxes, is as follows:
| Year Ended December 31, | ||||||||
| 2012 | 2011 | |||||||
| Federal Income tax at statutory rate | 35 | % | 35 | % | ||||
| State and local income tax, net | - | - | ||||||
| Foreign rate differential | (8 | ) | (9 | ) | ||||
| Uncertain tax positions | 1 | 3 | ||||||
| Foreign tax recovery | - | (11 | ) | |||||
| Other | 7 | 6 | ||||||
| Effective income tax expense rate | 35 | % | 24 | % | ||||
The Company’s provision for income taxes reflects an effective tax rate on earnings before income taxes of 35% in 2012 (24% in 2011). The increase in effective tax rate during 2012 primarily reflects a tax recovery recognized in 2011 for a settlement reached with the Canadian tax authority that partially reversed an assessment recorded in 2008.
The net deferred income tax asset (liability) was comprised of the following (in thousands):
| December 31, | ||||||||
| 2012 | 2011 | |||||||
| Current deferred income taxes | ||||||||
| Gross assets | $ | 563 | $ | 753 | ||||
| Gross liabilities | - | - | ||||||
| Net current deferred income tax asset | 563 | 753 | ||||||
| Noncurrent deferred income taxes | ||||||||
| Gross assets | 700 | 679 | ||||||
| Gross liabilities | (2,992 | ) | (3,301 | ) | ||||
| Net noncurrent deferred income tax (liability) asset | (2,292 | ) | (2,622 | ) | ||||
| Deferred liability, net | $ | (1,729 | ) | $ | (1,869 | ) | ||
| F-22 |
The tax effect of temporary differences between GAAP accounting and federal income tax accounting creating deferred income tax assets and liabilities were as follows (in thousands):
| December 31, | ||||||||
| 2012 | 2011 | |||||||
| Deferred tax assets | ||||||||
| Canada net operating loss carry forwards | $ | 244 | $ | 53 | ||||
| Pension plan | 253 | 155 | ||||||
| Foreign tax credits | 497 | 455 | ||||||
| Property and equipment | - | 404 | ||||||
| Other | 269 | 365 | ||||||
| 1,263 | 1,432 | |||||||
| Less valuation allowance | - | - | ||||||
| Net deferred tax assets | 1,263 | 1,432 | ||||||
| Deferred tax liabilities | ||||||||
| Other | (2,992 | ) | (3,301 | ) | ||||
| Deferred liability, net | $ | (1,729 | ) | $ | (1,869 | ) | ||
The Company believes that its deferred tax assets in other tax jurisdictions are more likely than not realizable through future reversals of existing taxable temporary differences and its estimate of future taxable income.
A reconciliation of the beginning and ending amount of gross unrecognized tax benefits, exclusive of interest and penalties, is as follows (in thousands):
| UTP | ||||
| Balance as of December 31, 2010 | $ | 161 | ||
| Increases related to tax positions taken during the period | 104 | |||
| Decreases related to expectations of statute of limitations | - | |||
| Balance as of December 31, 2011 | 265 | |||
| Increases related to tax positions taken during the period | 52 | |||
| Decreases related to expectations of statute of limitations | - | |||
| Balance as of December 31, 2012 | $ | 317 | ||
The Company’s policy is to recognize interest and penalties related to income tax matters as interest expense.
Management believes that an adequate provision has been made for any adjustments that may result from tax examinations. However, the outcome of tax audits cannot be predicted with certainty. If any issues addressed in the Company’s tax audits are resolved in a manner not consistent with management’s expectations, the Company could be required to adjust its provision for income taxes in the period such resolution occurs. Although timing of the resolution and/or closure of audits is highly uncertain, the Company does not believe it is reasonably possible that its unrecognized tax benefits would materially change in the next twelve months.
| F-23 |
| 15. | Pension Plan |
A Canadian subsidiary of the Company sponsors a defined benefit pension plan in which a majority of its employees are members. The employer contributes 100% to the plan. The benefits, or the rate per year of credit service, are established by the Company’s subsidiary and updated at its discretion.
Cost of Benefits
The components of the expense the Company incurred under the pension plan are as follows (in thousands):
| Year Ended December 31, | ||||||||
| 2012 | 2011 | |||||||
| Current service cost, net of employee contributions | $ | 32 | $ | 25 | ||||
| Interest cost on accrued benefit obligation | 140 | 149 | ||||||
| Expected return on plan assets | (156 | ) | (159 | ) | ||||
| Amortization of transitional obligation | 14 | 14 | ||||||
| Amortization of past service costs | 9 | 9 | ||||||
| Amortization of net actuarial gain | 46 | 33 | ||||||
| Total cost of benefit | $ | 85 | $ | 71 | ||||
Benefit Obligation
The Company’s obligation for the pension plan is valued annually as of the beginning of each fiscal year. The projected benefit obligation represents the present value of benefits ultimately payable to plan participants for both past and future services expected to be provided by the plan participants.
The Company's obligations pursuant to the pension plan are as follows (in thousands):
| December 31, | ||||||||
| 2012 | 2011 | |||||||
| Projected benefit obligation, at beginning of year | $ | 2,911 | $ | 2,732 | ||||
| Current service cost, net of employee contributions | 32 | 25 | ||||||
| Employee contributions | 39 | 35 | ||||||
| Interest cost | 140 | 149 | ||||||
| Actuarial loss | (49 | ) | - | |||||
| Impact of change in discount rate | 395 | 229 | ||||||
| Impact in change of assumptions | 36 | - | ||||||
| Benefits paid | (188 | ) | (192 | ) | ||||
| Foreign exchange adjustment | 67 | (67 | ) | |||||
| Projected benefit obligation, at end of year | $ | 3,383 | $ | 2,911 | ||||
| F-24 |
A summary of expected benefit payments related to the pension plan is as follows (in thousands):
| Year ending December 31, | Pension Plan | |||
| 2013 | $ | 201 | ||
| 2014 | 206 | |||
| 2015 | 230 | |||
| 2016 | 234 | |||
| 2017 | 240 | |||
| 2018 - 2022 | $ | 1,214 | ||
Other changes in plan assets and benefit obligations recognized in other comprehensive income are as follows (in thousands):
| Year Ended December 31, | ||||||||
| 2012 | 2011 | |||||||
| Net loss | $ | 407 | $ | 432 | ||||
| Amortization of prior service cost | (9 | ) | (8 | ) | ||||
| Amortization of gain | (47 | ) | (32 | ) | ||||
| Amortization of transitional asset | (13 | ) | (13 | ) | ||||
| 338 | 379 | |||||||
| Taxes | (92 | ) | (102 | ) | ||||
| Total recognized in other comprehensive income, net of taxes | $ | 246 | $ | 277 | ||||
The estimated net loss amortized from accumulated other comprehensive income into net periodic benefit cost over the next year amounts to approximately $47,000. The estimated prior service cost amortized from accumulated other comprehensive income into net periodic benefit cost over the next year amounts to approximately $9,000. The estimated transitional asset amortized from accumulated other comprehensive income into net periodic benefit cost over the next year amounts to approximately $13,000.
The accumulated other comprehensive loss consists of the following amounts that have not yet been recognized as components of net benefit cost (in thousands):
| December 31, | ||||||||
| 2012 | 2011 | |||||||
| Unrecognized prior service cost | $ | 120 | $ | 129 | ||||
| Unrecognized net actuarial loss | 84 | 97 | ||||||
| Unrecognized transitional obligation | 1,542 | 1,182 | ||||||
| Deferred income taxes | (507 | ) | (415 | ) | ||||
| $ | 1,239 | $ | 993 | |||||
Plan Assets
Assets held by the pension plan are invested in accordance with the provisions of the Company’s approved investment policy. The pension plan’s strategic asset allocation was structured to reduce volatility through diversification and enhance return to approximate the amounts and timing of the expected benefit payments. The asset allocation for the pension plan at the end of fiscal years 2012 and 2011 and the target allocation for fiscal year 2013, by asset category, is as follows:
| Allocation at December 31, | 2013 Target | |||||||||||
| 2012 | 2011 | Allocation | ||||||||||
| Equity securities | 57 | % | 58 | % | 57 | % | ||||||
| Fixed income securities | 30 | 34 | 30 | |||||||||
| Real estate | 9 | 6 | 9 | |||||||||
| Other | 4 | 2 | 4 | |||||||||
| Total | 100 | % | 100 | % | 100 | % | ||||||
| F-25 |
The fair market values, by asset category are as follows (in thousands):
| December 31, | ||||||||
| 2012 | 2011 | |||||||
| Equity securities | $ | 1,451 | $ | 1,359 | ||||
| Fixed income securities | 764 | 795 | ||||||
| Real estate | 229 | 141 | ||||||
| Other | 102 | 47 | ||||||
| Total | $ | 2,546 | $ | 2,342 | ||||
The Company has classified the assets as level 1. Changes in the assets held by the pension plan in the years 2012 and 2011 are as follows (in thousands):
| December 31, | ||||||||
| 2012 | 2011 | |||||||
| Fair value of plan assets, at beginning of year | $ | 2,342 | $ | 2,424 | ||||
| Actual return on plan assets | 131 | (44 | ) | |||||
| Employer contributions | 169 | 173 | ||||||
| Employee contributions | 39 | 34 | ||||||
| Benefits paid | (188 | ) | (192 | ) | ||||
| Foreign exchange adjustment | 53 | (53 | ) | |||||
| Fair value of plan assets, at end of year | $ | 2,546 | $ | 2,342 | ||||
Contributions
The Company’s policy is to fund the pension plan at or above the minimum required by law. The Company made $0.2 million of contributions to its defined benefit pension plan in each of the 2012 and 2011 years. The Company expects to make contributions of less than $0.2 million to the defined benefit pension plan in 2013. Changes in the discount rate and actual investment returns which continue to remain lower than the long-term expected return on plan assets could result in the Company making additional contributions.
Funded Status
The funded status of the pension plan is as follows (in thousands):
| December 31, | ||||||||
| 2012 | 2011 | |||||||
| Projected benefit obligation | $ | 3,383 | $ | 2,911 | ||||
| Fair value of plan assets | 2,546 | 2,342 | ||||||
| Accrued obligation (long term) | $ | 837 | $ | 569 | ||||
| F-26 |
Assumptions
Assumptions used in accounting for the pension plan are as follows:
| December 31, | ||||||||
| 2012 | 2011 | |||||||
| Weighted average discount rate used to determine the accrued benefit obligations | 3.80 | % | 4.80 | % | ||||
| Discount rate used to determine the net pension expense | 4.80 | % | 5.50 | % | ||||
| Expected long-term rate of return on plan assets | 6.50 | % | 6.50 | % | ||||
To determine the expected long-term rate of return on pension plan assets, the Company considers the current and expected asset allocations, as well as historical and expected returns on various categories of plan assets. The Company applies the expected rate of return to a market related value of the assets which reduces the underlying variability in assets to which the Company applies that expected return. The Company amortizes gains and losses as well as the effects of changes in actuarial assumptions and plan provisions over a period no longer than the average future service of employees.
Primary actuarial assumptions are determined as follows:
The expected long-term rate of return on plan assets is based on the Company’s estimate of long-term returns for equities and fixed income securities weighted by the allocation of assets in the plans. The rate is impacted by changes in general market conditions, but because it represents a long-term rate, it is not significantly impacted by short-term market swings. Changes in the allocation of plan assets would also impact this rate.
The assumed discount rate is used to discount future benefit obligations back to today’s dollars. The discount rate is reflective of yield rates on U.S. long-term investment grade corporate bonds on and around the December 31 valuation date. This rate is sensitive to changes in interest rates. A decrease in the discount rate would increase the Company’s obligation and expense.
| 16. | Major Customers |
Sales to two customers accounted for approximately 19% and 12% of the Company’s sales in 2012 (21% and 11% in 2011).
| 17. | Geographical Information |
The Company has one material operating segment, being the sale of electrical equipment. Revenues are attributable to countries based on the location of the Company's customers (in thousands):
| Year Ended December 31, | ||||||||
| 2012 | 2011 | |||||||
| Canada | $ | 53,238 | $ | 42,258 | ||||
| United States | 30,296 | 25,390 | ||||||
| Others | 426 | 1,142 | ||||||
| Total | $ | 83,960 | $ | 68,790 | ||||
The distribution of the Company’s property, plant and equipment by geographic location is approximately as follows (in thousands):
| December 31, | ||||||||
| 2012 | 2011 | |||||||
| Canada | $ | 7,202 | $ | 5,902 | ||||
| United States | 174 | 283 | ||||||
| Mexico | 3,561 | 3,798 | ||||||
| Total | $ | 10,937 | $ | 9,983 | ||||
| F-27 |
| 18. | Basic and Diluted Earnings Per Common Share |
Basic and diluted earnings per common share are calculated based on the weighted average number of shares outstanding during the period. The Company’s employee and director stock option awards, as well as incremental shares issuable upon exercise of warrants, are not considered in the calculations if the effect would be anti-dilutive. The following table sets forth the computation of basic and diluted earnings per share (in thousands, except per share data):
| Year Ended December 31, | ||||||||
| 2012 | 2011 | |||||||
| Numerator: | ||||||||
| Earnings from continuing operations | $ | 3,189 | $ | 2,471 | ||||
| Denominator: | ||||||||
| Weighted average basic shares outstanding | 5,907 | 5,907 | ||||||
| Effect of dilutive securities — equity based compensation plans | 6 | - | ||||||
| Net dilutive effect of warrants outstanding | - | 42 | ||||||
| Denominator for diluted earnings per common share | 5,913 | 5,949 | ||||||
| Earnings from continuing operations per common share: | ||||||||
| Basic | $ | 0.54 | $ | 0.42 | ||||
| Diluted | $ | 0.54 | $ | 0.42 | ||||
| Anti-dilutive securities (excluded from per share calculation): | ||||||||
| Equity based compensation plans | 118 | 112 | ||||||
| Warrants | 640 | 410 | ||||||
| F-28 |
Consolidated Statements of Earnings
(In thousands, except per share data)
(Unaudited)
| Three Months Ended | Six Months Ended | |||||||||||||||
| June 30, | June 30, | |||||||||||||||
| 2013 | 2012 | 2013 | 2012 | |||||||||||||
| Revenues | $ | 21,995 | $ | 21,820 | $ | 44,546 | $ | 42,137 | ||||||||
| Cost of goods sold | 16,415 | 17,056 | 33,885 | 32,783 | ||||||||||||
| Gross profit | 5,580 | 4,764 | 10,661 | 9,354 | ||||||||||||
| Operating expenses | ||||||||||||||||
| Selling, general and administrative | 3,531 | 3,310 | 7,052 | 6,551 | ||||||||||||
| Foreign exchange (gain) loss | (14 | ) | (14 | ) | 47 | (86 | ) | |||||||||
| Total operating expenses | 3,517 | 3,296 | 7,099 | 6,465 | ||||||||||||
| Operating income | 2,063 | 1,468 | 3,562 | 2,889 | ||||||||||||
| Interest expense | 183 | 230 | 368 | 443 | ||||||||||||
| Other expense | 74 | 1 | 167 | 30 | ||||||||||||
| Earnings from continuing operations before income taxes | 1,806 | 1,237 | 3,027 | 2,416 | ||||||||||||
| Provision for income taxes | 544 | 358 | 852 | 697 | ||||||||||||
| Earnings from continuing operations | 1,262 | 879 | 2,175 | 1,719 | ||||||||||||
| Loss from discontinued operations, net of income taxes | - | (78 | ) | - | (161 | ) | ||||||||||
| Net earnings | $ | 1,262 | $ | 801 | $ | 2,175 | $ | 1,558 | ||||||||
| Earnings from continuing operations per share: | ||||||||||||||||
| Basic | $ | 0.21 | $ | 0.15 | $ | 0.37 | $ | 0.29 | ||||||||
| Diluted | $ | 0.21 | $ | 0.15 | $ | 0.37 | $ | 0.29 | ||||||||
| Earnings per common share: | ||||||||||||||||
| Basic | $ | 0.21 | $ | 0.14 | $ | 0.37 | $ | 0.26 | ||||||||
| Diluted | $ | 0.21 | $ | 0.14 | $ | 0.37 | $ | 0.26 | ||||||||
| Weighted average common shares outstanding: | ||||||||||||||||
| Basic | 5,907 | 5,907 | 5,907 | 5,907 | ||||||||||||
| Diluted | 5,924 | 5,908 | 5,922 | 5,907 | ||||||||||||
The accompanying notes are an integral part of these consolidated financial statements
| F-29 |
Consolidated Statements of Comprehensive Income
(In thousands)
(Unaudited)
| Three Months Ended | Six Months Ended | |||||||||||||||
| June 30, | June 30, | |||||||||||||||
| 2013 | 2012 | 2013 | 2012 | |||||||||||||
| Net earnings | $ | 1,262 | $ | 801 | $ | 2,175 | $ | 1,558 | ||||||||
| Other comprehensive income, net of tax: | ||||||||||||||||
| Foreign currency translation adjustments | (350 | ) | (231 | ) | (484 | ) | (103 | ) | ||||||||
| Pension adjustment, net of taxes | (22 | ) | (65 | ) | 30 | (9 | ) | |||||||||
| Other comprehensive loss | (372 | ) | (296 | ) | (454 | ) | (112 | ) | ||||||||
| Comprehensive income | $ | 890 | $ | 505 | $ | 1,721 | $ | 1,446 | ||||||||
The accompanying notes are an integral part of these consolidated financial statements
| F-30 |
Consolidated Balance Sheets
(In thousands)
| June 30, | December 31, | |||||||
| 2013 | 2012 | |||||||
| (Unaudited) | ||||||||
| ASSETS | ||||||||
| Current Assets | ||||||||
| Cash and cash equivalents | $ | 822 | $ | 467 | ||||
| Accounts receivable | 9,643 | 10,579 | ||||||
| Inventories | 13,844 | 14,912 | ||||||
| Income taxes receivable | 65 | 69 | ||||||
| Deferred income taxes | 848 | 563 | ||||||
| Prepaid expenses and other current assets | 1,555 | 885 | ||||||
| Current assets of discontinued operations | - | 47 | ||||||
| Total current assets | 26,777 | 27,522 | ||||||
| Property, plant and equipment | 11,697 | 10,937 | ||||||
| Noncurrent deferred income taxes | 614 | 700 | ||||||
| Other assets | 782 | 798 | ||||||
| Intangible assets | 5,117 | 5,329 | ||||||
| Goodwill | 7,886 | 6,892 | ||||||
| Total assets | $ | 52,873 | $ | 52,178 | ||||
| LIABILITIES AND SHAREHOLDERS’ EQUITY | ||||||||
| Current Liabilities | ||||||||
| Bank overdrafts | $ | 1,075 | $ | - | ||||
| Accounts payable and accrued liabilities | 10,665 | 12,044 | ||||||
| Current maturities of long-term debt and capital lease obligations | 8,476 | 7,335 | ||||||
| Income taxes payable | 786 | 1,135 | ||||||
| Current liabilities of discontinued operations | - | 125 | ||||||
| Total current liabilities | 21,002 | 20,639 | ||||||
| Long-term debt and capital lease obligations, net of current maturities | 8,477 | 9,795 | ||||||
| Pension deficit | 730 | 837 | ||||||
| Noncurrent deferred income taxes | 2,909 | 2,992 | ||||||
| Total liabilities | 33,118 | 34,263 | ||||||
| Shareholders’ Equity | ||||||||
| Preferred stock, par value $0.001; 5,000,000 shares authorized; none issued | - | - | ||||||
| Common stock, par value $0.001; 30,000,000 shares authorized; 5,907,255 shares issued and outstanding | 6 | 6 | ||||||
| Additional paid-in capital | 8,184 | 8,065 | ||||||
| Accumulated other comprehensive loss | (1,390 | ) | (936 | ) | ||||
| Retained earnings | 12,955 | 10,780 | ||||||
| Total shareholders’ equity | 19,755 | 17,915 | ||||||
| Total liabilities and shareholders’ equity | $ | 52,873 | $ | 52,178 | ||||
The accompanying notes are an integral part of these consolidated financial statements
| F-31 |
Consolidated Statements of Cash Flows
(In thousands)
(Unaudited)
| Six Months Ended June 30, | ||||||||
| 2013 | 2012 | |||||||
| Operating activities | ||||||||
| Net earnings | $ | 2,175 | $ | 1,558 | ||||
| Depreciation | 579 | 587 | ||||||
| Amortization of intangibles | 142 | 143 | ||||||
| Deferred tax expense | (249 | ) | (320 | ) | ||||
| Accrued pension | (65 | ) | 3 | |||||
| Stock-based compensation | 119 | 133 | ||||||
| Restructuring and asset impairment charges, discontinued operations | - | 49 | ||||||
| Changes in current operating assets and liabilities | ||||||||
| Accounts receivable, net | 618 | (2,153 | ) | |||||
| Inventories | 622 | (1,539 | ) | |||||
| Prepaid expenses and other assets | (654 | ) | (283 | ) | ||||
| Income taxes | (343 | ) | 224 | |||||
| Accounts payable and accrued liabilities | (1,715 | ) | 656 | |||||
| Discontinued operations assets and liabilities, net | - | (55 | ) | |||||
| Net cash provided by (used in) operating activities | 1,229 | (997 | ) | |||||
| Investing activities | ||||||||
| Additions to property, plant and equipment | (1,731 | ) | (1,421 | ) | ||||
| Business acquisition, net of cash aquired | (655 | ) | - | |||||
| Note receivable | - | (300 | ) | |||||
| Net cash used in investing activities | (2,386 | ) | (1,721 | ) | ||||
| Financing activities | ||||||||
| Increase in bank overdrafts | 1,112 | 1,064 | ||||||
| Increase in revolving credit facilities | 1,329 | 392 | ||||||
| Increase in long-term debt | - | 1,074 | ||||||
| Repayment of long-term debt and capital lease obligations | (938 | ) | (982 | ) | ||||
| Net cash provided by financing activities | 1,503 | 1,548 | ||||||
| Increase (decrease) in cash and cash equivalents | 346 | (1,170 | ) | |||||
| Effect of foreign exchange on cash and cash equivalents | 9 | (78 | ) | |||||
| Cash and cash equivalents | ||||||||
| Beginning of year | 467 | 1,398 | ||||||
| End of period | $ | 822 | $ | 150 | ||||
The accompanying notes are an integral part of these consolidated financial statements
| F-32 |
| 1. | Basis of Presentation |
Unless the context requires otherwise, references in this Form 10-Q to the “Company,” “Pioneer,” “we,” “our” and “us” refer to Pioneer Power Solutions, Inc. and its subsidiaries, including Pioneer Electrogroup Canada Inc., Pioneer Transformers Ltd., Bemag Transformer Inc., Jefferson Electric, Inc. and Pioneer Critical Power Inc.
These unaudited consolidated financial statements include the accounts of the Company and its wholly-owned subsidiaries. All significant intercompany accounts and transactions have been eliminated in consolidation. Certain prior year amounts have been reclassified to conform to the current year presentation, including amounts related to discontinued operations.
These unaudited consolidated financial statements have been prepared pursuant to the rules of the Securities and Exchange Commission (“SEC”). Certain information and footnote disclosures, normally included in annual financial statements prepared in accordance with accounting principles generally accepted in the United States (“U.S. GAAP”), have been condensed or omitted pursuant to those rules and regulations. We believe that the disclosures made are adequate to make the information presented not misleading. In the opinion of management, all adjustments, consisting only of normal recurring adjustments, necessary to fairly state the financial position, results of operations and cash flows with respect to the interim consolidated financial statements have been included. The results of operations for the interim period are not necessarily indicative of the results for the entire fiscal year. The year-end balance sheet data was derived from audited financial statements, but does not include all disclosures required by U.S. GAAP.
These unaudited consolidated financial statements should be read in conjunction with the risk factors, included in this Quarterly Report on Form 10-Q and the audited consolidated financial statements and notes thereto of the Company and its subsidiaries included in the Company’s Annual Report on Form 10-K for the year ended December 31, 2012, which was filed with the SEC on April 1, 2013.
| 2. | Summary of Significant Accounting Policies |
The Company’s significant accounting policies were described in Note 2 to the audited consolidated financial statements included in the Company’s Annual Report on Form 10-K for the year ended December 31, 2012. There have been no significant changes in the Company’s accounting policies during the second quarter of 2013.
Recent Accounting Pronouncements
There have been no recent accounting pronouncements not yet adopted by the Company which would have a material impact on our financial statements.
In July 2012, the FASB issued ASU No. 2012-02, Intangibles—Goodwill and Other (Topic 350): Testing Indefinite-Lived Intangible Assets for Impairment. This standard, which amends the guidance on testing indefinite-lived intangible assets, other than goodwill, for impairment, provides companies with the option to first perform a qualitative assessment before performing the two-step quantitative impairment test. If the company determines, on the basis of qualitative factors, that the fair value of the indefinite-lived intangible asset is more likely than not to exceed its carrying amount, then the company would not need to perform the two-step quantitative impairment test. This standard does not revise the requirement to test indefinite-lived intangible assets annually for impairment. This standard became effective for the Company on January 1, 2013. The adoption of these amendments did not have a material impact on the Company’s consolidated financial statements.
In February 2013, the FASB has issued Update No. 2013-02, “Comprehensive Income (Topic 220): Reporting of Amounts Reclassified Out of Accumulated Other Comprehensive Income”. This Update has been issued to improve the transparency of reporting these reclassifications. The amendments in this Update supersede and replace the presentation requirements for reclassifications out of accumulated other comprehensive income in ASUs 2011-05 and 2011-12 for all public and private organizations. The amendments would require an entity to provide additional information about reclassifications out of accumulated other comprehensive income. Public companies are required to comply with these amendments for all reporting periods (interim and annual), effective for reporting periods beginning after December 15, 2012. The adoption of these amendments did not have a material impact on the Company’s consolidated financial statements.
| F-33 |
In December 2011, the FASB issued Update No. 2011-12, “Comprehensive Income (Topic 220): Deferral of the Effective Date for Amendments to the Presentation of Reclassifications of Items Out of Accumulated Other Comprehensive Income in Accounting Standards Update No. 2011-05”. The amendments in this Update supersede changes to those paragraphs in Update 2011-05 that pertain to how, when, and where reclassification adjustments are presented. For public entities, the amendments are effective prospectively for reporting periods beginning after December 15, 2012. For nonpublic entities, the amendments are effective prospectively for reporting periods beginning after December 15, 2013. Early adoption is permitted. This pronouncement is not expected to have a material impact on our consolidated financial statements.
In March 2013, the FASB issued Update No. 2013-05, “Foreign Currency Matters (Topic 830)—Parent’s Accounting for the Cumulative Translation Adjustment upon Derecognition of Certain Subsidiaries or Groups of Assets within a Foreign Entity or of an Investment in a Foreign Entity”. The amendments in this Update resolve the diversity in practice about whether Subtopic 810-10, Consolidation—Overall, or Subtopic 830-30, Foreign Currency Matters—Translation of Financial Statements, applies to the release of the cumulative translation adjustment into net income when a parent either sells a part or all of its investment in a foreign entity or no longer holds a controlling financial interest in a subsidiary or group of assets that is a nonprofit activity or a business (other than a sale of in substance real estate or conveyance of oil and gas mineral rights) within a foreign entity. In addition, the amendments in this Update resolve the diversity in practice for the treatment of business combinations achieved in stages (sometimes also referred to as step acquisitions) involving a foreign entity. For public entities, the amendments in this ASU are effective prospectively for fiscal years, and interim reporting periods within those years, beginning after December 15, 2013. This pronouncement is not expected to have a material impact on our consolidated financial statements.
| 3. | Acquisition |
On March 6, 2013, Pioneer Critical Power Inc., a wholly-owned subsidiary of the Company, acquired substantially all the assets and assumed certain trade liabilities comprising the business of Power Systems Solutions, Inc. The transaction was valued at approximately $1.2 million and was accounted for under the purchase method of accounting. Power Systems Solutions, Inc. is a Minneapolis-based supplier of highly specified and engineered paralleling switchgear and generator controls used in on-site backup power and distributed generation applications.
The acquisition resulted in the recognition of goodwill in the Company’s consolidated financial statements because the purchase price exceeded the net tangible asset value and reflects the future earnings and cash flow potential of the acquired business. The Company made an initial allocation of the purchase price at the date of acquisition, based upon its understanding of the fair value of the acquired assets and assumed liabilities. The Company obtained this information during due diligence and through other sources including an asset appraisal. If additional information is obtained about these assets and liabilities within the measurement period (not to exceed one year from the date of acquisition), including by learning more about the newly acquired business or revisions of preliminary estimates, the Company will then refine its estimate of fair value.
| 4. | Inventories |
The components of inventories are summarized below (in thousands):
| June 30, | December 31, | |||||||
| 2013 | 2012 | |||||||
| Raw materials | $ | 4,898 | $ | 5,130 | ||||
| Work in process | 3,743 | 4,360 | ||||||
| Finished goods | 5,485 | 5,779 | ||||||
| Provision for excess and obsolete inventory | (282 | ) | (357 | ) | ||||
| Total inventories | $ | 13,844 | $ | 14,912 | ||||
| F-34 |
Included in raw materials and finished goods at June 30, 2013 and December 31, 2012 are goods in transit of approximately $0.2 and $0.3 million, respectively.
| 5. | Goodwill and Other Intangible Assets |
Changes in goodwill and intangible asset balances for the six months ended June 30, 2013, consisted of the following (in thousands):
| Goodwill | Intangible assets | |||||||
| Balance December 31, 2012 | $ | 6,892 | $ | 5,329 | ||||
| Additions due to acquisitions | 1,068 | - | ||||||
| Amortization | - | (142 | ) | |||||
| Foreign currency translation | (74 | ) | (70 | ) | ||||
| Balance as of June 30, 2013 | $ | 7,886 | $ | 5,117 | ||||
The components of intangible assets as of June 30, 2013 are summarized below (in thousands):
| Intangible | Accumulated | Foreign currency | Net book | |||||||||||||
| assets | amortization | translation | value | |||||||||||||
| Customer relationships | $ | 2,962 | $ | (745 | ) | $ | (70 | ) | $ | 2,147 | ||||||
| Non-compete agreement | 95 | (78 | ) | (1 | ) | 16 | ||||||||||
| Trademarks | 2,049 | - | (21 | ) | 2,028 | |||||||||||
| Technology-related industry accreditations | 950 | - | (24 | ) | 926 | |||||||||||
| Total intangible assets | $ | 6,056 | $ | (823 | ) | $ | (116 | ) | $ | 5,117 | ||||||
| 6. | Other Assets |
In December 2011 and January 2012, the Company’s Pioneer Transformers Ltd. subsidiary funded two promissory notes, each in the amount of $300,000, from a developer of a renewable energy project in the U.S. The promissory notes accrue interest at a rate of 4.5% per annum with a final payment of all unpaid principal and interest becoming fully due and payable upon the earlier to occur of (i) the four year anniversary of the issuance date of the promissory notes, or (ii) an event of default. As defined in the promissory notes, an event of default includes, but is not limited to, the following: any bankruptcy, reorganization or similar proceeding involving the borrower, a sale or transfer of substantially all the assets of the borrower, a default by the borrower relating to any indebtedness due to third parties, the incurrence of additional indebtedness by the borrower without the Company’s written consent and failure of the borrower to perform its obligations pursuant to its other agreements with the Company, including its purchase order for pad mount transformers.
Also included in Other Assets are deferred financing costs of $0.2 million for the periods ended June 30, 2013 and December 31, 2012, respectively.
| 7. | Debt |
Canadian Credit Facilities
The Company’s Canadian subsidiaries have maintained credit facilities with Bank of Montreal since October 2009. In June 2011, Pioneer Electrogroup Canada Inc., together with its subsidiaries, Pioneer Transformers Ltd. and Bemag Transformer Inc., entered into a letter loan agreement with Bank of Montreal (the “Canadian Facilities”) that replaced and superseded all prior financing arrangements with the bank. Bemag Transformer Inc. became a party to the Canadian Facilities on July 1, 2011, upon the acquisition of all of its capital shares by the Company.
| F-35 |
The Canadian Facilities provide for up to $23.0 million Canadian dollars (“CAD”) (approximately $22.6 million expressed in U.S. dollars) consisting of a $10.0 million demand revolving credit facility (“Facility A”) to finance ongoing operations, a $2.0 million term credit facility (“Facility B”) that financed a plant expansion, a $10.0 million term credit facility (“Facility C”) to finance acquisitions, capital expenditures or to provide funding to the Company’s U.S. operations, a $50,000 Corporate MasterCard credit facility (“Facility D”) and a $1.0 million foreign exchange settlement risk facility (“Facility E”).
The Canadian Facilities are secured by a first-ranking lien in the amount of approximately $30 million CAD on all of the present and future movable and immovable property of the Company’s Canadian subsidiaries.
The Canadian Facilities require the Company’s Canadian operations to comply on a consolidated basis with various financial covenants, including maintaining a minimum fixed charge coverage ratio of 1.25, a maximum funded debt to EBITDA ratio of 2.75 and a limitation on funded debt to less than 60% of capitalization. The Canadian Facilities also restrict the ability of the Company’s Canadian operations to, among other things, (i) provide any funding to any person, including affiliates, in an aggregate amount exceeding $5.0 million CAD or (ii) make distributions in an aggregate amount exceeding 50% of Pioneer Electrogroup Canada Inc.’s previous year’s net income.
Facility A is subject to margin criteria and borrowings bear interest at the bank’s prime rate plus 0.50% per annum on amounts borrowed in Canadian dollars, or the bank’s U.S. base rate plus 0.50% per annum or LIBOR plus 2.00% per annum on amounts borrowed in U.S. dollars.
Borrowings under Facility B bear interest at the bank’s prime rate plus 1.00% per annum with principal repayments becoming due on a five year amortization schedule.
Borrowings under Facility C are repayable according to a five year principal amortization schedule and bear interest at the following rates: if the funded debt to EBITDA ratio is equal to or greater than 2.00, the bank’s prime rate plus 1.25% per annum on amounts borrowed in Canadian dollars, or the U.S. base rate plus 1.25% per annum or LIBOR plus 2.50% per annum on amounts borrowed in U.S. dollars; or, if the funded debt to EBITDA ratio is less than 2.00, the bank’s prime rate plus 1.00% per annum on amounts borrowed in Canadian dollars, or the U.S. base rate plus 1.00% per annum or LIBOR plus 2.25% per annum on amounts borrowed in U.S. dollars. In addition, Facility C is subject to a standby fee which is calculated monthly using the unused portion of the facility at either 0.625% per annum if the funded debt to EBITDA ratio is equal to or greater than 2.00, or 0.5625% per annum if the funded debt to EBITDA ratio is less than 2.00.
On June 28, 2013, Pioneer Electrogroup Canada Inc. and certain subsidiary guarantors amended and restated the Canadian Facilities with Bank of Montreal in order to, among other things, provide an additional six months to borrow any amounts not already drawn from Facility C. The Company also entered into a guaranty agreement to guarantee the obligations under the Canadian Facilities.
As of June 30, 2013, the Company had approximately $10.2 million in U.S. dollar equivalents outstanding under the Canadian Facilities and was in compliance with its financial covenant requirements. The Company’s borrowings consisted of approximately $0.9 million outstanding under Facility A, $1.3 million outstanding under Facility B, and $8.0 million outstanding under Facility C.
United States Credit Facilities
The Company’s Jefferson Electric, Inc. subsidiary had a loan agreement with a Johnson Bank that included a revolving credit facility and a term credit facility. In November 2011, the loan agreement was revised to provide for an increase in the borrowing base limit of the revolving credit facility to $6.0 million and a decrease in the interest rate to the U.S. prime rate plus 2.0%. In connection with the amendment, the interest rate under the term credit facility was reduced to 6.0% annually.
| F-36 |
In October 2012, the loan agreement was amended to reduce the interest rate under the revolving credit facility to a floating rate subject to a pricing grid, ranging from 2.25% to 3.50% above one month LIBOR, depending on Jefferson Electric, Inc.’s debt service coverage ratio. The term credit facility, which was repaid in full during July 2012, was removed from the Johnson Bank loan agreement in its entirety. Borrowings under the Johnson Bank loan agreement were collateralized by substantially all the U.S. assets of Jefferson Electric, Inc., and an officer of the subsidiary was a guarantor. The Johnson Bank loan agreement, as amended, required Jefferson Electric, Inc. to comply with certain financial covenants, including a requirement to exceed a minimum target for tangible net worth and maintain a minimum debt service coverage ratio. The loan agreement also restricted Jefferson Electric, Inc.’s ability to pay dividends or make distributions, advances or other transfers of assets.
On June 28, 2013, the Company and its wholly-owned U.S. subsidiaries, Pioneer Critical Power Inc. and Jefferson Electric, Inc., entered into a credit agreement with Bank of Montreal, Chicago Branch (the “U.S. Facilities”). The U.S. Facilities consist of a $10.0 million demand revolving credit facility that was used to pay off all amounts outstanding under the Johnson Bank loan agreement and will be used to finance ongoing operations; and a $6.0 million term loan facility, with principal repayments becoming due on a five year amortization schedule, that is to be used to finance certain permitted acquisitions by the Company and its subsidiaries.
The U.S. Facilities require the Company’s U.S. operations to comply with various financial covenants, including (a) maintaining a minimum fixed charge coverage ratio of (i) 1.25 for fiscal quarters ending June 30, 2013 to December 31, 2013, and (ii) 1.35 for fiscal quarters ending on or after March 31, 2014, (b) limiting funded debt to less than 50% of capitalization, and (c) maintaining a maximum funded debt to adjusted EBITDA ratio of (i) 5.25 for fiscal quarters ending June 30, 2013 to December 31, 2013, (ii) 5.00 for the fiscal quarter ending March 31, 2014, (iii) 4.50 for the fiscal quarter ending June 30, 2014, (iv) 4.00 for the fiscal quarter ending September 30, 2014, and (v) 3.75 for fiscal quarters ending on or after December 31, 2014. The U.S. Facilities also restrict the ability of the Company and its U.S. subsidiaries to incur indebtedness, create or incur liens, make investments, make distributions or dividends and enter into merger agreements or agreements for the sale of any or all assets.
Borrowings under the demand revolving credit facility bear interest, at the Company’s option, at the bank’s prime rate plus 1.00% per annum on U.S. prime rate loans, or an adjusted LIBOR rate plus 2.25% per annum on Eurodollar loans. Borrowings under the term loan facility bear interest, at the Company’s option, at the bank’s prime rate plus 1.25% per annum on U.S. prime rate loans, or an adjusted LIBOR rate plus 2.50% per annum on Eurodollar loans. In addition, the term loan facility is subject to a standby fee from June 28, 2013 to December 28, 2013, which is calculated monthly, using the unused portion of the facility, at a rate of 0.625% per annum.
In connection with the U.S. Facilities, the Company, Pioneer Critical Power Inc., Jefferson Electric, Inc. and the bank entered into a security agreement, pursuant to which the Company granted a security interest in substantially all of its assets in the U.S., and including 65% of the shares of Pioneer Electrogroup Canada Inc. held by the Company, to secure the Company’s obligations under the U.S. Facilities.
As of June 30, 2013, the Company had approximately $5.5 million outstanding under the demand revolving credit facility, the term loan facility was undrawn and the Company was in compliance with its financial covenant requirements.
Nexus Promissory Note
On July 25, 2012, the Company’s indirect wholly owned Mexican subsidiary, Nexus Magneticos de Mexico, S. de R.L. de C.V. (“Nexus”), entered into a term loan agreement with GE CF Mexico, S.A. de C.V. (“GE Capital Mexico”). At closing, GE Capital Mexico advanced to Nexus $1.65 million under the term loan agreement, less a non-refundable commission of 1% and less a pledge of cash representing 10% of the loan amount. Immediately upon receiving the term loan advance, Nexus made an intercompany loan in the same principal amount to Jefferson Electric, Inc., its controlling shareholder. In turn, Jefferson Electric, Inc. used the intercompany loan proceeds to repay a portion of its outstanding secured indebtedness owed to its U.S. bank. The net proceeds were used by Jefferson Electric, Inc. to fully repay the principal and accrued interest that was then outstanding under its term credit facility with its U.S. bank, as well as to reduce the outstanding balance under its revolving credit facility.
| F-37 |
The term loan from GE Capital Mexico is payable in 60 consecutive monthly installments and bears interest, payable monthly, at a rate of 6.93% per annum. The term loan may be prepaid by Nexus in increments of at least $100,000, subject to the application of certain prepayment and other fees as established in the term loan agreement. The term loan agreement contains customary representations and warranties, affirmative and negative covenants and events of default, including covenants that restrict Nexus’ ability to create certain liens, incur additional liabilities, make certain types of investments, engage in mergers, consolidations, significant asset sales and affiliate transactions, pay dividends, redeem or repurchase outstanding equity and make capital expenditures.
The obligations of Nexus under the term loan are secured by (i) a pledge of cash in the amount of 10% of the term loan amount, (ii) a trust agreement, pursuant to which Nexus and Jefferson Electric, Inc. transferred title to substantially all of their equipment and machinery assets located in Mexico to a Mexican bank as trustee, to serve as security for all of Nexus’ obligations under the term loan agreement, and (iii) a corporate guaranty by the Company of all of Nexus’ obligations under the term loan agreement.
Long-term debt consists of the following (in thousands):
| June 30, | December 31, | |||||||
| 2013 | 2012 | |||||||
| Revolving credit facilities | $ | 6,432 | $ | 5,141 | ||||
| Term credit facilities | 9,293 | 10,615 | ||||||
| Nexus promissory note | 1,226 | 1,371 | ||||||
| Capital lease obligations | 2 | 3 | ||||||
| Total debt and capital lease obligations | 16,953 | 17,130 | ||||||
| Less current portion | (8,476 | ) | (7,335 | ) | ||||
| Total long-term debt and capital lease obligations | $ | 8,477 | $ | 9,795 | ||||
| 8. | Shareholders’ Equity |
The Company had common stock, $0.001 par value, outstanding of 5,907,255 shares as of June 30, 2013 and December 31, 2012, respectively.
As of June 30, 2013, the Company had warrants outstanding to purchase 640,000 shares of common stock with an average exercise price of approximately $14.00 per share. The warrants expire on dates beginning on December 2, 2014 and ending on April 30, 2015. No warrants were exercised during the three months ended June 30, 2013.
The board of directors is authorized, subject to any limitations prescribed by law, without further vote or action by the shareholders, to issue from time to time up to 5,000,000 shares of preferred stock, $0.001 par value, in one or more series. Each such series of preferred stock shall have such number of shares, designations, preferences, voting powers, qualifications, and special or relative rights or privileges as shall be determined by the board of directors, which may include, among others, dividend rights, voting rights, liquidation preferences, conversion rights and preemptive rights.
| F-38 |
| 9. | Stock-Based Compensation |
A summary of stock option activity under the 2011 Long-Term Incentive Plan as of June 30, 2013, and changes during the six months ended June 30, 2013, are presented below:
| Stock | Weighted average | Weighted average remaining | Aggregate | |||||||||||||
| options | exercise price | contractual term | intrinsic value | |||||||||||||
| Balance December 31, 2012 | 168,400 | $ | 11.85 | 6.6 | $ | 119,500 | ||||||||||
| Granted | 73,000 | $ | 5.60 | 9.7 | 65,700 | |||||||||||
| Exercised | - | - | - | - | ||||||||||||
| Forfeited | - | - | - | - | ||||||||||||
| Outstanding as of June 30, 2013 | 241,400 | $ | 9.96 | 7.2 | $ | 185,200 | ||||||||||
| Exercisable as of June 30, 2013 | 143,667 | $ | 13.11 | 6.0 | $ | 58,673 | ||||||||||
As of June 30, 2013, there were 458,600 shares available for future grants under the Company’s 2011 Long-Term Incentive Plan.
Expense for stock-based compensation recorded for the six months ended June 30, 2013 and 2012 was approximately $119,000 and $133,000, respectively. At June 30, 2013, the Company had total stock-based compensation expense remaining to be recognized in the statement of earnings of approximately $0.2 million.
| 10. | Pension Plan |
One of the Company’s Canadian subsidiaries sponsors a defined benefit pension plan in which a majority of its employees are members. The subsidiary funds 100% of all contributions to the plan. The benefits, or the rate per year of credit service, are established by the Company and updated at its discretion.
The components of the expense the Company incurred under the pension plan are as follows (in thousands):
| Three Months Ended June 30, | Six Months Ended June 30, | |||||||||||||||
| 2013 | 2012 | 2013 | 2012 | |||||||||||||
| Current service cost, net of employee contributions | $ | 13 | $ | 10 | $ | 31 | $ | 21 | ||||||||
| Interest cost on accrued benefit obligation | 32 | 36 | 63 | 71 | ||||||||||||
| Expected return on plan assets | (42 | ) | (40 | ) | (83 | ) | (78 | ) | ||||||||
| Amortization of transitional obligation | 3 | 3 | 7 | 7 | ||||||||||||
| Amortization of past service costs | 2 | 2 | 4 | 4 | ||||||||||||
| Amortization of net actuarial gain | 14 | 12 | 29 | 24 | ||||||||||||
| Total cost of benefit | $ | 22 | $ | 23 | $ | 51 | $ | 49 | ||||||||
Cost of Benefits
The Company’s policy is to fund the pension plan at or above the minimum level required by law. The Company made $74,000 and $48,000 of contributions to its defined benefit pension plan during the six months ended June 30 2013 and 2012, respectively. Changes in the discount rate and actual investment returns that are lower than the long-term expected return on plan assets could result in the Company making additional contributions.
| F-39 |
| 11. | Geographical Information |
The Company has one material operating segment, being the sale of electrical equipment. Revenues are attributable to countries based on the location of the Company’s customers (in thousands):
| Three Months Ended | Six Months Ended | |||||||||||||||
| June 30, | June 30, | |||||||||||||||
| 2013 | 2012 | 2013 | 2012 | |||||||||||||
| Canada | $ | 12,336 | $ | 14,065 | $ | 26,632 | $ | 26,211 | ||||||||
| United States | 8,841 | 7,636 | 16,239 | 15,594 | ||||||||||||
| Others | 818 | 119 | 1,675 | 332 | ||||||||||||
| Total | $ | 21,995 | $ | 21,820 | $ | 44,546 | $ | 42,137 | ||||||||
| 12. | Basic and Diluted Earnings Per Share |
Basic and diluted earnings per common share are calculated based on the weighted average number of shares outstanding during the period. The Company’s employee and director stock option awards, as well as incremental shares issuable upon exercise of warrants, are not considered in the calculations if the effect would be anti-dilutive. The following table sets forth the computation of basic and diluted earnings per share (in thousands, except per share data):
| Three Months Ended | Six Months Ended | |||||||||||||||
| June 30, | June 30, | |||||||||||||||
| 2013 | 2012 | 2013 | 2012 | |||||||||||||
| Numerator: | ||||||||||||||||
| Earnings from continuing operations | $ | 1,262 | $ | 879 | $ | 2,175 | $ | 1,719 | ||||||||
| Denominator: | ||||||||||||||||
| Weighted average basic shares outstanding | 5,907 | 5,907 | 5,907 | 5,907 | ||||||||||||
| Effect of dilutive securities - equity based compensation plans | 17 | 1 | 15 | - | ||||||||||||
| Net dilutive effect of warrants outstanding | - | - | - | - | ||||||||||||
| Denominator for diluted earnings per common share | 5,924 | 5,908 | 5,922 | 5,907 | ||||||||||||
| Earnings from continuing operations per common share: | ||||||||||||||||
| Basic | $ | 0.21 | $ | 0.15 | $ | 0.37 | $ | 0.29 | ||||||||
| Diluted | $ | 0.21 | $ | 0.15 | $ | 0.37 | $ | 0.29 | ||||||||
| Anti-dilutive securities (excluded from per share calculation): | ||||||||||||||||
| Equity based compensation plans | 118 | 131 | 118 | 131 | ||||||||||||
| Warrants | 640 | 640 | 640 | 640 | ||||||||||||
| F-40 |
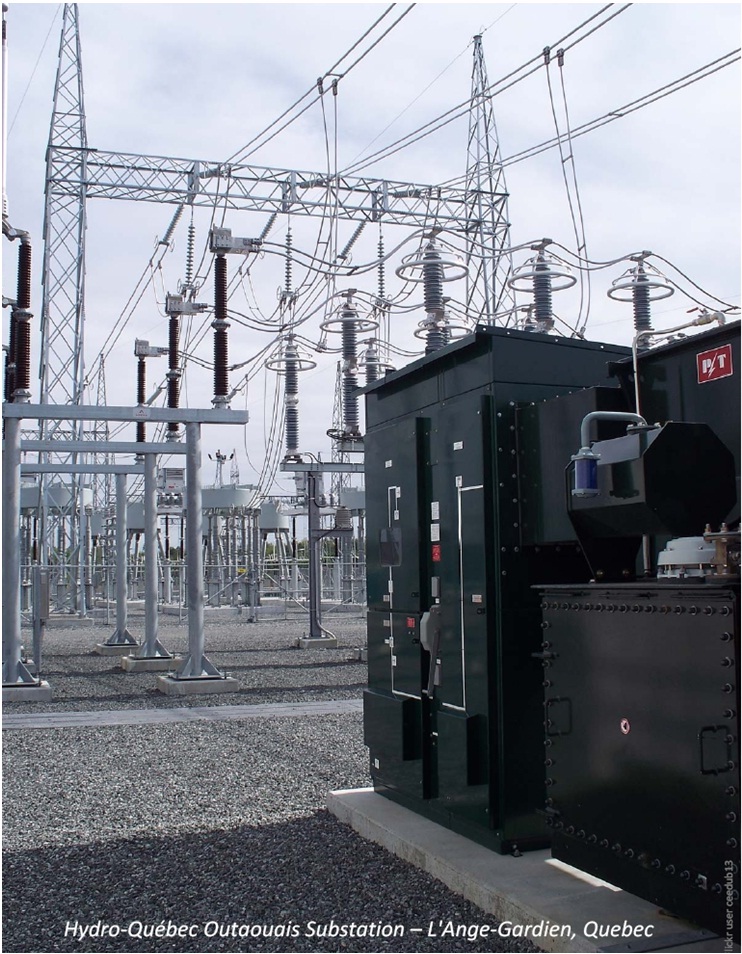
1,000,000 Shares
Pioneer Power Solutions, Inc.
Common Stock
PROSPECTUS
, 2013
_____________________________
Sole Book-Running Manager
Roth Capital Partners
Co-Manager
Monarch Capital Group
You should rely only on the information contained in this prospectus. No dealer, salesperson or other person is authorized to give information that is not contained in this prospectus. This prospectus is not an offer to sell nor is it seeking an offer to buy these securities in any jurisdiction where the offer or sale is not permitted. The information contained in this prospectus is correct only as of the date of this prospectus, regardless of the time of the delivery of this prospectus or any sale of these securities.
PART II
INFORMATION NOT REQUIRED IN PROSPECTUS
Item 13. Other Expenses of Issuance and Distribution.
The following table provides information regarding the various actual and anticipated expenses (other than underwriters’ discounts) payable by us in connection with the issuance and distribution of the common stock being registered hereby. All amounts shown are estimates except the Securities and Exchange Commission registration fee, FINRA filing fee and the Nasdaq initial listing fee:
| SEC Registration Fee | $ | 1,255.00 | ||
| Nasdaq Listing Fee | $ | 50,000.00 | ||
| FINRA Filing Fee | $ | 1,880.00 | ||
| Accounting Fees and Expenses | $ | 25,000.00 | ||
| Legal Fees and Expenses | $ | 200,000.00 | ||
| Transfer Agent Fees | $ | 10,000.00 | ||
| Printing Expenses | $ | 30,000.00 | ||
| Miscellaneous Fees and Expenses | $ | 31,865.00 | ||
| Total | $ | 350,000.00 |
Item 14. Indemnification of Directors and Officers.
Section 145 of the Delaware General Corporation Law provides, in general, that a corporation incorporated under the laws of the State of Delaware, as we are, may indemnify any person who was or is a party or is threatened to be made a party to any threatened, pending or completed action, suit or proceeding (other than a derivative action by or in the right of the corporation) by reason of the fact that such person is or was a director, officer, employee or agent of the corporation, or is or was serving at the request of the corporation as a director, officer, employee or agent of another enterprise, against expenses (including attorneys’ fees), judgments, fines and amounts paid in settlement actually and reasonably incurred by such person in connection with such action, suit or proceeding if such person acted in good faith and in a manner such person reasonably believed to be in or not opposed to the best interests of the corporation and, with respect to any criminal action or proceeding, had no reasonable cause to believe such person’s conduct was unlawful. In the case of a derivative action, a Delaware corporation may indemnify any such person against expenses (including attorneys’ fees) actually and reasonably incurred by such person in connection with the defense or settlement of such action or suit if such person acted in good faith and in a manner such person reasonably believed to be in or not opposed to the best interests of the corporation, except that no indemnification will be made in respect of any claim, issue or matter as to which such person will have been adjudged to be liable to the corporation unless and only to the extent that the Court of Chancery of the State of Delaware or any other court in which such action was brought determines such person is fairly and reasonably entitled to indemnity for such expenses.
Our certificate of incorporation and bylaws provide that we will indemnify our directors, officers, employees and agents to the extent and in the manner permitted by the provisions of the Delaware General Corporation Law, as amended from time to time, subject to any permissible expansion or limitation of such indemnification, as may be set forth in any stockholders’ or directors’ resolution or by contract. In addition, our director and officer indemnification agreements with each of our directors and officers provide, among other things, for the indemnification to the fullest extent permitted or required by Delaware law, provided that no indemnitee will be entitled to indemnification in connection with any claim initiated by the indemnitee against us or our directors or officers unless we join or consent to the initiation of the claim, or the purchase and sale of securities by the indemnitee in violation of Section 16(b) of the Securities Exchange Act of 1934, as amended.
Any repeal or modification of these provisions approved by our stockholders will be prospective only and will not adversely affect any limitation on the liability of any of our directors or officers existing as of the time of such repeal or modification.
| II-1 |
We are also permitted to apply for insurance on behalf of any director, officer, employee or other agent for liability arising out of his actions, whether or not the Delaware General Corporation Law would permit indemnification.
Item 15. Recent Sales of Unregistered Securities.
None.
Item 17. Undertakings.
Insofar as indemnification for liabilities arising under the Securities Act of 1933 may be permitted to directors, officers and controlling persons of the registrant pursuant to the foregoing provisions, or otherwise, the registrant has been advised that in the opinion of the Securities and Exchange Commission such indemnification is against public policy as expressed in the Act and is, therefore, unenforceable. In the event that a claim for indemnification against such liabilities (other than the payment by the registrant of expenses incurred or paid by a director, officer or controlling person of the registrant in the successful defense of any action, suit or proceeding) is asserted by such director, officer or controlling person in connection with the securities being registered, the registrant will, unless in the opinion of its counsel the matter has been settled by controlling precedent, submit to a court of appropriate jurisdiction the question whether such indemnification by it is against public policy as expressed in the Act and will be governed by the final adjudication of such issue.
The undersigned registrant hereby undertakes that:
| (1) | For purposes of determining any liability under the Securities Act of 1933, the information omitted from the form of prospectus filed as part of this registration statement in reliance upon Rule 430A and contained in a form of prospectus filed by the registrant pursuant to Rule 424(b)(1) or (4) or 497(h) under the Securities Act shall be deemed to be part of this registration statement as of the time it was declared effective. |
| (2) | For the purpose of determining any liability under the Securities Act of 1933, each post-effective amendment that contains a form of prospectus shall be deemed to be a new registration statement relating to the securities offered therein, and the offering of such securities at that time shall be deemed to be the initial bona fide offering thereof. |
| II-2 |
INDEX TO EXHIBITS
| Exhibit No. |
Description | |
| 1.1** | Form of Underwriting Agreement | |
| 3.1 | Composite Certificate of Incorporation of Pioneer Power Solutions, Inc. (Incorporated by reference to Exhibit 3.1 to Amendment No. 4 to the Registration Statement on Form S-1 of Pioneer Power Solutions, Inc. filed with the Securities and Exchange Commission on June 21, 2011). | |
| 3.2 | Bylaws (Incorporated by reference to Exhibit 3.2 to the Current Report on Form 8-K of Pioneer Power Solutions, Inc. filed with the Securities and Exchange Commission on December 2, 2009). | |
| 4.1 | Form of Securities Purchase Agreement (Incorporated by reference to Exhibit 10.1 to the Current Report on Form 8-K of Pioneer Power Solutions, Inc. filed with the Securities and Exchange Commission on December 7, 2009). | |
| 4.2 | Form of $10.00 Warrant (Incorporated by reference to Exhibit 10.2 to the Current Report on Form 8-K of Pioneer Power Solutions, Inc. filed with the Securities and Exchange Commission on December 7, 2009). | |
| 4.3 | Form of $16.25 Warrant (Incorporated by reference to Exhibit 10.3 to the Current Report on Form 8-K of Pioneer Power Solutions, Inc. filed with the Securities and Exchange Commission on December 7, 2009). | |
| 4.4 | Warrant to Purchase Common Stock, dated April 30, 2010, issued to Thomas Klink (Incorporated by reference to Exhibit 4.1 to the Current Report on Form 8-K of Pioneer Power Solutions, Inc. filed with the Securities and Exchange Commission on May 4, 2010). | |
| 4.5 | Warrant to Purchase Common Stock, dated April 26, 2010 (Incorporated by reference to Exhibit 4.6 to Post-Effective Amendment No. 1 to Registration Statement on Form S-1 of Pioneer Power Solutions, Inc. filed with the Securities and Exchange Commission on June 1, 2010). | |
| 4.6 | Form of Warrant to Purchase Common Stock, dated May 11, 2010, issued to investor relations firm and its designees (Incorporated by reference to Exhibit 4.7 to the Registration Statement on Form S-1 of Pioneer Power Solutions, Inc. filed with the Securities and Exchange Commission on April 20, 2011). | |
| 4.7 | Form of Common Stock Certificate (Incorporated by reference to Exhibit 4.7 to the Registration Statement on Form S-1 of Pioneer Power Solutions, Inc. filed with the Securities and Exchange Commission on August 1, 2013) | |
| 4.8** | Form of Underwriter Warrant. | |
| 5.1** | Form of Opinion of Haynes and Boone, LLP. | |
| 10.1 | Form of Director and Officer Indemnification Agreement (Incorporated by reference to Exhibit 10.1 to the Annual Report on Form 10-K of Pioneer Power Solutions, Inc. filed with the Securities and Exchange Commission for the year ended December 31, 2010). | |
| 10.2 | Pioneer Power Solutions, Inc. 2009 Equity Incentive Plan (Incorporated by reference to Exhibit 10.8 to the Current Report on Form 8-K of Pioneer Power Solutions, Inc. filed with the Securities and Exchange Commission on December 7, 2009). | |
| 10.3 | Form of 2009 Incentive Stock Option Agreement (Incorporated by reference to Exhibit 10.9 to the Current Report on Form 8-K of Pioneer Power Solutions, Inc. filed with the Securities and Exchange Commission on December 7, 2009). |
| II-3 |
| 10.4 | Form of 2009 Non-Qualified Stock Option Agreement (Incorporated by reference to Exhibit 10.10 to the Current Report on Form 8-K of Pioneer Power Solutions, Inc. filed with the Securities and Exchange Commission on December 7, 2009). | |
| 10.5 | Pioneer Power Solutions, Inc. 2011 Long-Term Incentive Plan (Incorporated by reference to Exhibit 10.1 to the Current Report on Form 8-K of Pioneer Power Solutions, Inc. filed with the Securities and Exchange Commission on May 31, 2011). | |
| 10.6 | Employment Agreement, dated December 2, 2009, by and between Pioneer Power Solutions, Inc. and Nathan J. Mazurek (Incorporated by reference to Exhibit 10.7 to the Current Report on Form 8-K of Pioneer Power Solutions, Inc. filed with the Securities and Exchange Commission on December 7, 2009). | |
| 10.7 | Employment Agreement, dated March 30, 2012, by and between Pioneer Power Solutions, Inc. and Nathan J. Mazurek (Incorporated by reference to Exhibit 10.42 to the Annual Report on Form 10-K of Pioneer Power Solutions, Inc. filed with the Securities and Exchange Commission on March 30, 2012). | |
| 10.8 | Employment and Non-Competition Agreement, dated August 12, 2010, by and between Pioneer Power Solutions, Inc. and Andrew Minkow (Incorporated by reference to Exhibit 10.1 to the Current Report on Form 8-K of Pioneer Power Solutions, Inc. filed with the Securities and Exchange Commission on August 18, 2010). | |
| 10.9 | Employment Agreement, dated March 30, 2012, by and between Pioneer Power Solutions, Inc. and Andrew Minkow (Incorporated by reference to Exhibit 10.43 to the Annual Report on Form 10-K of Pioneer Power Solutions, Inc. filed with the Securities and Exchange Commission on March 30, 2012). | |
| 10.10 | Collective Labor Agreement, dated November 26, 2010, by and between Pioneer Transformers Ltd. and United Steelworkers, Local Section 9414 (Incorporated by reference to Exhibit 10.8 to the Annual Report on Form 10-K of Pioneer Power Solutions, Inc. filed with the Securities and Exchange Commission for the year ended December 31, 2010). | |
| 10.11* | Agreement dated January 1, 2010, by and between Pioneer Transformers Ltd. and Hydro-Quebec Utility Company (Incorporated by reference to Exhibit 10.34 to Amendment No. 1 to the Registration Statement on Form S-1 of Pioneer Power Solutions, Inc. filed with the Securities and Exchange Commission on March 10, 2010). | |
| 10.12* | Agreement dated January 8, 2010, by and between Pioneer Transformers Ltd. and Hydro-Quebec Utility Company (Incorporated by reference to Exhibit 10.35 to Amendment No. 1 to the Registration Statement on Form S-1 of Pioneer Power Solutions, Inc. filed with the Securities and Exchange Commission on March 10, 2010). | |
| 10.13 | Contract Extension Agreements, Contract No. 4600017108 and 4600017040, dated March 6, 2012, by and between Pioneer Transformers Ltd. and Hydro-Quebec Utility Company (Incorporated by reference to Exhibit 10.41 to the Annual Report on Form 10-K of Pioneer Power Solutions, Inc. filed with the Securities and Exchange Commission on March 30, 2012). | |
| 10.14 | Contract Extension Agreements, Contract No. 4600017108 and 4600017040, dated February 13, 2013, by and between Pioneer Transformers Ltd. and Hydro-Quebec Utility Company (Incorporated by reference to Exhibit 10.19 to the Annual Report on Form 10-K of Pioneer Power Solutions, Inc. filed with the Securities and Exchange Commission on April 1, 2013). | |
| 10.15 | Employment Agreement, dated April 30, 2010, by and between Jefferson Electric, Inc. and Thomas Klink (Incorporated by reference to Exhibit 10.1 to the Current Report on Form 8-K of Pioneer Power Solutions, Inc. filed with the Securities and Exchange Commission on May 4, 2010). |
| II-4 |
| 10.16 | Term Loan Agreement, dated July 25, 2012, by and between Nexus Magneticos S. de R.L. de C.V. and GE CF Mexico, S.A. de C.V. (Incorporated by reference to Exhibit 10.2 to Amendment No. 1 to the Quarterly Report on Form 10-Q/A of Pioneer Power Solutions, Inc. filed with the Securities and Exchange Commission on November 16, 2012). | |
| 10.17 | Irrevocable Transfer of Title and Guaranty Trust Agreement, dated July 25, 2012, by and among, Nexus Magneticos S. de R.L. de C.V. and GE CF Mexico, S.A. de C.V., Jefferson Electric, Inc., GE CF Mexico, S.A. de C.V. and Banco Invex, S.A. (Incorporated by reference to Exhibit 10.3 to Amendment No. 1 to the Quarterly Report on Form 10-Q/A of Pioneer Power Solutions, Inc. filed with the Securities and Exchange Commission on November 16, 2012). | |
| 10.18 | Corporate Guaranty, dated July 25, 2011, by and between Pioneer Power Solutions, Inc. and GE CF Mexico, S.A. de C.V. (Incorporated by reference to Exhibit 10.4 to Amendment No. 1 to the Quarterly Report on Form 10-Q/A of Pioneer Power Solutions, Inc. filed with the Securities and Exchange Commission on November 16, 2012). | |
| 10.19 | Collective Bargaining Agreement Nexus Magneticos S. de R.L. de C.V., dated January 1, 2011 (Incorporated by reference to Exhibit 10.35 to the Annual Report on Form 10-K of Pioneer Power Solutions, Inc. filed with the Securities and Exchange Commission for the year ended December 31, 2010). | |
| 10.20 | Industrial Lease between Comercializadora Reynosa Para La Industria Maquiladora S.A. DE C.V. and Nexus Magneticos e Mexico S. de R.L. de C.V (Incorporated by reference to Exhibit 10.41 to the Annual Report on Form 10-K of Pioneer Power Solutions, Inc. filed with the Securities and Exchange Commission on April 1, 2013). | |
| 10.21 | Share Purchase Agreement, dated May 13, 2011, by and among Fiducie Familiale Mazoyer, Bon-Ange Inc., Gilles Mazoyer and 7834080 Canada Inc. (Incorporated by reference to Exhibit 10.1 to the Current Report on Form 8-K of Pioneer Power Solutions, Inc. filed with the Securities and Exchange Commission on May 19, 2011). | |
| 10.22 | Amendment Agreement, dated June 30, 2011, by and among Fiducie Familiale Mazoyer, Bon-Ange Inc., Gilles Mazoyer and 7834080 Canada Inc. (Incorporated by reference to Exhibit 10.3 to the Current Report on Form 8-K of Pioneer Power Solutions, Inc. filed with the Securities and Exchange Commission on July 5, 2011). | |
| 10.23 | Equipment Purchase Agreement, dated July 1, 2011, by and among Vermont Transformer, Inc., GCEFF Inc., Gilles Mazoyer and 7834080 Canada Inc. (Incorporated by reference to Exhibit 10.4 to the Current Report on Form 8-K of Pioneer Power Solutions, Inc. filed with the Securities and Exchange Commission on July 5, 2011). | |
| 10.24 | Collective Labor Agreement, dated June 3, 2010, by and between Bemag Transformer Inc. and Syndicat Québécois des Employées et Employés de Service, Section Locale 298 (FTQ) (Incorporated by reference to Exhibit 10.45 to the Annual Report on Form 10-K of Pioneer Power Solutions, Inc. filed with the Securities and Exchange Commission on March 30, 2012). | |
| 10.25 | First Amendment to Employment Agreement, dated April 30, 2013, by and between Jefferson Electric, Inc. and Thomas Klink (Incorporated by reference to Exhibit 10.1 to the Current Report on Form 8-K of Pioneer Power Solutions, Inc. filed with the Securities and Exchange Commission on April 30, 2013). | |
| 10.26 | Credit Agreement, dated as of June 28, 2013, by and among Pioneer Power Solutions, Inc., as borrower, Pioneer Critical Power Inc. and Jefferson Electric, Inc., as guarantors, and Bank of Montreal, Chicago Branch, as lender (Incorporated by reference to Exhibit 10.1 to the Current Report on Form 8-K of Pioneer Power Solutions, Inc. filed with the Securities and Exchange Commission on July 3, 2013). |
| II-5 |
| 10.27 | Security Agreement, dated as of June 28, 2013, by and among Pioneer Power Solutions, Inc., Pioneer Critical Power Inc. and Jefferson Electric, Inc. and Bank of Montreal, Chicago Branch (Incorporated by reference to Exhibit 10.2 to the Current Report on Form 8-K of Pioneer Power Solutions, Inc. filed with the Securities and Exchange Commission on July 3, 2013). | |
| 10.28 | Amended and Restated Letter Loan Agreement, dated as of June 28, 2013, by and among Pioneer Electrogroup Canada Inc., Pioneer Transformers Ltd. and Bemag Transformer Inc., as borrowers, and Bank of Montreal, as lender (Incorporated by reference to Exhibit 10.3 to the Current Report on Form 8-K of Pioneer Power Solutions, Inc. filed with the Securities and Exchange Commission on July 3, 2013). | |
| 10.29 | Guaranty Agreement, dated as of June 28, 2013, by Pioneer Power Solutions, Inc. in favor of Bank of Montreal (Incorporated by reference to Exhibit 10.4 to the Current Report on Form 8-K of Pioneer Power Solutions, Inc. filed with the Securities and Exchange Commission on July 3, 2013). | |
| 10.30 | First Amendment to Credit Agreement, dated as of August 7, 2013, by and among Pioneer Power Solutions, Inc., Jefferson Electric, Inc., Pioneer Critical Power Inc. and Bank of Montreal (Incorporated by reference to Exhibit 10.1 to the Quarterly Report on Form 10-Q of Pioneer Power Solutions, Inc. filed with the Securities and Exchange Commission on August 14, 2013). | |
| 21.1 | List of Subsidiaries. (Incorporated by reference to Exhibit 21.1 to the Registration Statement on Form S-1 of Pioneer Power Solutions, Inc. filed with the Securities and Exchange Commission on August 1, 2013). | |
| 23.1** | Consent of Richter LLP. | |
| 23.2** | Consent of Haynes and Boone, LLP (included in Exhibit 5.1). | |
| 24.1+ | Power of Attorney (included on signature page). | |
| 101*** | The following materials from this registration statement formatted in XBRL (eXtensible Business Reporting Language), (i) Consolidated Statements of Earnings (ii) Consolidated Statements of Comprehensive Income, (iii) Consolidated Balance Sheets, (iii) Consolidated Statements of Cash Flows, (iv) Consolidated Statements of Shareholders’ Equity and (v) the Notes to Consolidated Financial Statements. |
* Confidential treatment has been granted with respect to certain portions of this exhibit.
** Filed herewith.
*** Pursuant to Rule 406T of Regulation S-T, the Interactive Data Files on Exhibit 101 hereto are deemed not filed or part of a registration statement or prospectus for purposes of Sections 11 or 12 of the Securities Act of 1933, as amended, are deemed not filed for purposes of Section 18 of the Securities and Exchange Act of 1934, as amended, and otherwise are not subject to liability under those sections.
+ Previously filed.
| II-6 |
SIGNATURES
Pursuant to the requirements of the Securities Act of 1933, the registrant has duly caused this registration statement to be signed on its behalf by the undersigned, thereunto duly authorized, in the City of Fort Lee, State of New Jersey on September 9, 2013.
| PIONEER POWER SOLUTIONS, INC. | ||
| By: | /s/ Nathan J. Mazurek | |
| Name: Nathan J. Mazurek | ||
| Title: Chief Executive Officer |
In accordance with the requirements of the Securities Act of 1933, this registration statement has been signed by the following persons in the capacities and on the dates indicated.
| Signature | Title | Date | ||
/s/ Nathan J. Mazurek |
President, Chief Executive Officer and Chairman of the Board of Directors (Principal Executive Officer) |
September 10, 2013 | ||
| Nathan J. Mazurek | ||||
| /s/ Andrew Minkow | Chief Financial Officer, Secretary, Treasurer and Director (Principal Financial Officer and Principal Accounting Officer) |
September 10, 2013 | ||
| Andrew Minkow | ||||
| * | Director, President of Jefferson Electric, Inc. | September 10, 2013 | ||
| Thomas Klink | ||||
| * | Director | September 10, 2013 | ||
| Yossi Cohn | ||||
| * | Director | September 10, 2013 | ||
| David J. Landes | ||||
| * | Director | September 10, 2013 | ||
| Ian Ross | ||||
| * | Director | September 10, 2013 | ||
| David Tesler | ||||
| * | Director | September 10, 2013 | ||
| Jonathan Tulkoff |
| * by | /s/ Nathan J. Mazurek | |
| Nathan J. Mazurek | ||
| As Attorney-in-fact |
| II-7 |