Attached files
| file | filename |
|---|---|
| 8-K - CURRENT REPORT - LANTRONIX INC | lantronix_8k.htm |
Exhibit 99.1

| 1 |
Company Overview September 2013

Page 2 Safe Harbor This presentation contains forward - looking statements, including statements concerning our business plans, our financial and operating results, our product development strategies, and our target financial model. We have based our forward - looking statements on our current expectations and projections about trends affecting our business and industry and other future events. Although we do not make forward - looking statements unless we believe we have a reasonable basis for doing so, we cannot guarantee their accuracy. Forward - looking statements are subject to substantial risks and uncertainties that could cause our results or experiences, or future business, financial condition, results of operations or performance, to differ materially from our historical results or those expressed or implied in any forward - looking statement contained in this presentation. Some of the risks and uncertainties that may cause actual results to differ from those expressed or implied in the forward - looking statements are described in “Risk Factors” in our Annual Report on Form 10 - K filed with the Securities and Exchange Commission, or SEC, as well as in our other filings with the SEC. In addition, actual results may differ as a result of additional risks and uncertainties of which we are currently unaware or which we do not currently view as material to our business. For these reasons, investors are cautioned not to place undue reliance on any forward - looking statements. The forward - looking statements we make speak only as of the date on which they are made. We expressly disclaim any intent or obligation to update any forward - looking statements after the date hereof to conform such statements to actual results or to changes in our opinions or expectations, except as required by applicable law or the rules of the Nasdaq Stock Market, LLC. If we do update or correct any forward - looking statements, investors should not conclude that we will make additional updates or corrections. Lantronix, Inc. believes that the presentation of non - GAAP financial information provides important supplemental information to management and investors regarding financial and business trends relating to the Company's financial condition and results of operations. The non - GAAP financial measures disclosed by the Company should not be considered a substitute for, or superior to, financial measures calculated in accordance with GAAP, and the financial results calculated in accordance with GAAP and reconciliations to those financial statements should be carefully evaluated. The non - GAAP financial measures used by the Company may be calculated differently from, and therefore may not be comparable to, similarly titled measures used by other companies.
| 2 |

Page 3 Today there are more than 15B connected devices on the Internet. There are more machines on the Internet today than PC’s or Mobile devices connected to people. Source : Gartner, January 2012
| 3 |

Page 4 In 2020, the number of connected devices is expected to reach 50B. That is six devices for every person on Earth. Source: Cisco Visual Networking Index, 2011 - 2016
| 4 |

Page 5 Convergence of Mobility and M2M Systems….. Mobility: The proliferation of smartphones and tablets by users of all ages, geographies, social status, profession – everyone is going mobile. M2M: Rapid technology advances and use of machine - to - machine technologies (remote access to and management of devices and machines). BYOD : Employees are bringing their own MOBILE devices to work – and insist that IT departments make them work. Mobility M2M BYOD
| 5 |

Page 6 Where Does Lantronix Fit? Our broad portfolio of solutions bring together “mobility” and “M2M ” enabling our customers to access, monitor and manage anything from anywhere…….
| 6 |

Page 7 Lantronix Overview ( Nasdaq: LTRX ) • Established global provider of smart networking and communications solutions for machine - to - machine (M2M) applications • Results - driven management team with over 150 years of experience in M2M, communication and networking • Blue chip customer base • Broad portfolio of OEM Modules and Enterprise Solutions designed to address convergence of mobility and M2M systems • Product development strategy focused on expanding addressable market by expected ~4x • Executing on strategic plan to accelerate profitable growth by expanding sales and distribution channels worldwide Computer World’s Top 100 Innovative M2M Companies M2M Magazine’s Top 100 Most Influential M2M Companies Electronic Product Design Magazine’s “Contribution to Security” Award for WiFi Solutions Macworld 2012 “Best - in - Show” xPrintServer CES 2012 “Top 25 Must See Products” xPrintServer Engadget 2011 “Peripheral of the Year” xPrintServer
| 7 |
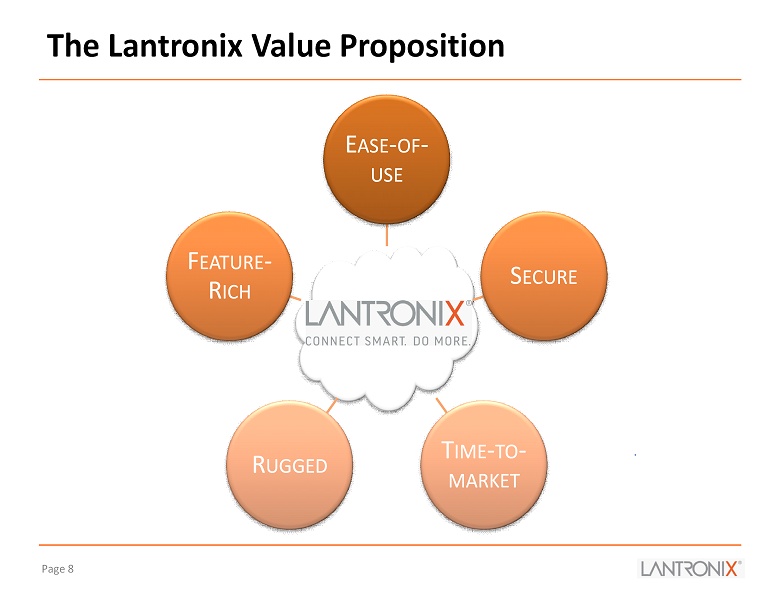
Page 8 The Lantronix Value P roposition . . E ASE - OF - USE S ECURE T IME - TO - MARKET R UGGED F EATURE - R ICH
| 8 |

Page 9 Growth Strategy Leverage our networking expertise to capitalize on market transitions relating to the convergence of mobility and M2M deployments • Address market transitions with products offering simple customization , manageability , and highest levels of security and ruggedness • Expand marketing and sales channels to sell our entire product portfolio in each of our geographic regions
| 9 |

Page 10 Accelerate Growth: Expand Addressable Market by ~4x Source: Primarily based upon internal estimates using source data from IDC & Harbor Research B ASELINE (P RIMARILY W IRED ) B ASELINE (P RIMARILY W IRED ) W IRELESS AND A NALOG M OBILE P RINTING $ - $0.5 $1.0 $1.5 $2.0 $2.5 2011 2016 Billions G ROWTH C ATALYSTS : • D ESIRE TO A CCESS , M ONITOR AND M ANAGE M ACHINES • I NTERNET - OF - T HINGS • M OBILITY • B IG D ATA • C LOUD S ERVICES • I NTELLIGENCE AT THE E DGE Expand addressable market with new product introductions
| 10 |

Page 11 M2M Solutions OEM M ODULES • Embedded M2M solutions for a manufacturer of machines and electronic devices • Typically sold to OEMs through distribution channels • Recurring revenue stream E NTERPRISE S OLUTIONS • M2M solutions for existing machines and electronic devices • Typically sold to end - users through VARs, system integrators, and distributors • Project driven revenue T YPICAL S ALES CYCLE : 0 - 18 MONTHS e valuation → project win → roll - out T YPICAL S ALES CYCLE : 12 - 24 MONTHS design win → pilot build → production
| 11 |

Page 12 Application Example - xPico Wi - Fi: Mobile Management of Heating System Customer & Application Nationwide (U.S.) provider of heating products, system services and maintenance Challenge Reduce costs and improve accuracy of service call to the customer The Solution Enable the technician to use a tablet (iPad) to securely access the heating and cooling system, without having access to the customer's network. This enabled the technician to access, review, manage, and control the heating & cooling system controls – adjust temperature levels, order addition fuel, provide real - time service.
| 12 |
Page 13 Application Example – xPrintServer Office Edition: iOS Printing for Point of Sale Application To help protect your privacy, PowerPoint prevented this external picture from being automatically downloaded. To download anddisplay this picture, click Options in the Message Bar, and then click Enable external content. Customer & Application A leading retail chain of clothing and tuxedo rentals. Challenge After deploying iPads for entering measurements to improve accuracy and customer satisfaction the retailer realized that their label printers did not support iOS printing. The Solution Selecting the xPrintServer ® Office Edition enabled all of the retailer's iOS devices to print to their existing store printers including special label printers. Previously store label printers did not support the ability to print from an iOS device. However, the xPrintServer enabled printing directly to label printers, minimizing data entry errors and streamlining the sales process.
| 13 |

Page 14 FY13 Revenue Contribution by Region and Product Line Plan to increase EMEA and Asia Pacific contribution to Enterprise Solutions sales by expanding WW sales channels and marketing E NTERPRISE S OLUTIONS 49% OEM M ODULES 51% 38% 39% 13% 10% 71% 20% 4% 6% Americas EMEA Japan Asia Pacific
| 14 |
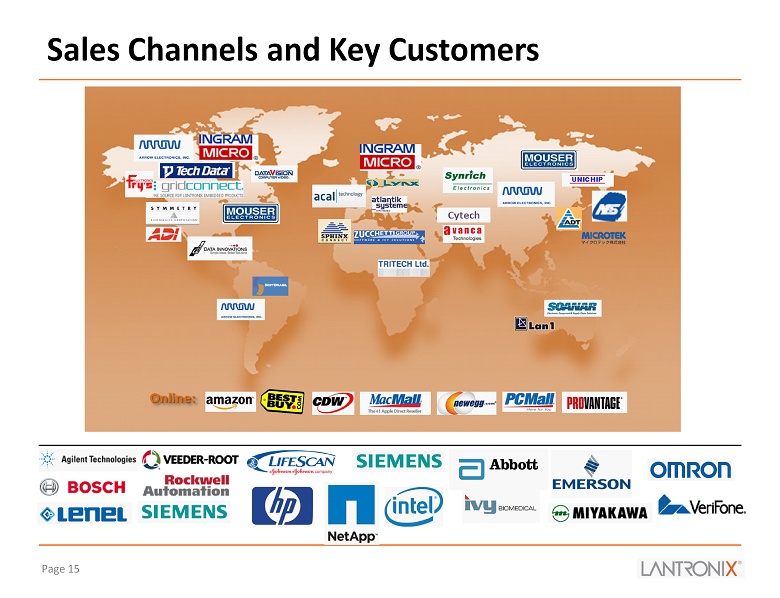
Page 15 Sales Channels and Key Customers
| 15 |

Page 16 FY12 FY13 FY14 Stabilize Execute Grow - Expect new products to outpace decline in mature products - Focus on profitable growth - Continued product development - Expanding sales channels and marketing - Financial discipline - Revenue growth of 3% - New product revenue begins to outpace decline in mature products - Expanded sales channels - Reduced GAAP loss - 7 new products launched - Revenue decline of 8% - Reduced spending & B/E point - 5 new products launched - Stabilized balance sheet - Growth plan defined
| 16 |

Page 17 Selected Income Statement Information Note: Please see Appendix A to this presentation for a reconciliation of non - GAAP measures. Non - GAAP operating income (loss) exc ludes share - based compensation, amortization & depreciation. (In millions) 2012 2013 Net Revenue $45.4 $46.7 Y/Y Change (8%) 3% Gross Profit $22.1 $22.1 % of Net Revenue 48.8% 47.4% GAAP Net Income (Loss) ($3.0) ($2.8) % of Net Revenue (7%) (6%) Non-GAAP Net Income (Loss) ($0.5) ($0.9) % of Net Revenue (1%) (2%) Years Ended June 30,
| 17 |

Page 18 Selected Condensed Balance Sheet Information (In millions, except price per share data) 2012 2013 Cash and Cash Equivalents 11.4$ 5.2$ Accounts Receivable, Net 2.7 2.6 Inventories, Net 6.0 8.7 Prepaid Expenses and Other 1.1 1.1 Total Current Assets 21.2 17.6 Total Non-Current Assets 11.4 11.8 Total Assets 32.6$ 29.4$ Accounts Payable 3.6$ 2.9$ Accrued Payroll and Other 5.9 6.0 Short-term Debt 0.7 0.2 Total Current Liabilities 10.2 9.1 Total Non-Current Liabilities 0.5 0.3 Total Liabilities 10.7 9.4 Total Stockholders' Equity 21.9 20.0 Total Liabilities and Stockholders' Equity 32.6$ 29.4$ Working Capital 11.0$ 8.5$ Common Shares Outstanding 14.55 14.58 Stock Options Outstanding 2.14 2.30 Weighted Average Exercise Price Per Share 3.20$ 2.63$ June 30,
| 18 |

Page 19 Why Lantronix? • Well positioned to address convergence of mobility and M2M systems • 12 new products introduced during last 2 - years TAM Expected to Increase by ~4x • Highly motivated and experienced leadership team with track record of execution on product development and financial discipline Experienced Team • New products starting to achieve early traction and outpacing decline in mature products • Expanding sales and distribution channels Expanded Sales & Marketing • As of October 2013, no debt outstanding • Clean capital structure Financial Discipline • Business model with significant operating leverage Business Model • 3% revenue growth in FY13 • Focused on revenue growth and positioning company for long - term profitability Executing to Plan
| 19 |

Page 20 THANK YOU
| 20 |

Page 21 Appendix A: Use of Non - GAAP Financial Measures Lantronix believes that the presentation of non - GAAP financial information, when presented in conjunction with the corresponding GAAP measures, provides important supplemental information to management and investors regarding financial and business trends relating to the Company's financial condition and results of operations. The non - GAAP financial measures disclosed by the Company should not be considered a substitute for, or superior to, financial measures calculated in accordan ce with GAAP, and the financial results calculated in accordance with GAAP and reconciliations to those financial statements sho uld be carefully evaluated. The non - GAAP financial measures used by the Company may be calculated differently from, and therefore may not be comparable to, similarly titled measures used by other companies. The Company has provided reconciliations of the non - GAAP financial measures to the most directly comparable GAAP financial measures. Management believes that non - GAAP operating expenses, non - GAAP net income (loss) and non - GAAP net income (loss) per share are important measures of the Company's business. Management uses the aforementioned non - GAAP measures to monitor and evaluate ongoing operating results and trends and to gain an understanding of our comparative operating performance. In addition, certain stockholders have expressed an interest in seeing financial performance measures, which exclude the impact of certain matters such as decisions relating to the restructuring, which while important, are not central to the core operation s o f the Company's business. Non - GAAP operating expenses consist of operating expenses excluding share - based compensation and related payroll taxes, depreciation and amortization, and restructuring charges. Non - GAAP net income (loss) consists of net income (loss) excluding ( i ) non - GAAP adjustments to operating expenses, (ii) interest income (expense), (iii) other income (expense), and (iv) income tax provision (benefit). Non - GAAP net income (loss) per share is calculated by dividing non - GAAP net income (loss) by non - GAAP weighted - average shares outstanding (diluted). For purposes of calculating non - GAAP net income (loss) per share, the calculation of GAAP weighted - average shares outstanding (diluted) is adjusted to exclude share - based compensation, which for GAAP purposes is treated as proceeds assumed to be used to repurchase shares under the GAAP treasury stock method.
| 21 |

Page 22 Appendix A: Reconciliation of Non - GAAP Financial Measures (In thousands) 2012 2013 GAAP net income (loss) (3,040)$ (2,769)$ Non-GAAP adjustments: Share-based compensation 750 850 Depreciation and amortization 987 853 Interest income (expense), net 97 59 Other income (expense), net 82 18 Provision (benefit) for income taxes 73 54 Restructuring charges 286 - Costs associated with Investigation and consulting fees for former CEO and CFO 261 - Total non-GAAP adjustments 2,536 1,834 Non-GAAP net income (loss) (504)$ (935)$ Years Ended June 30,
| 22 |
Page 23 Exhibits
| 23 |
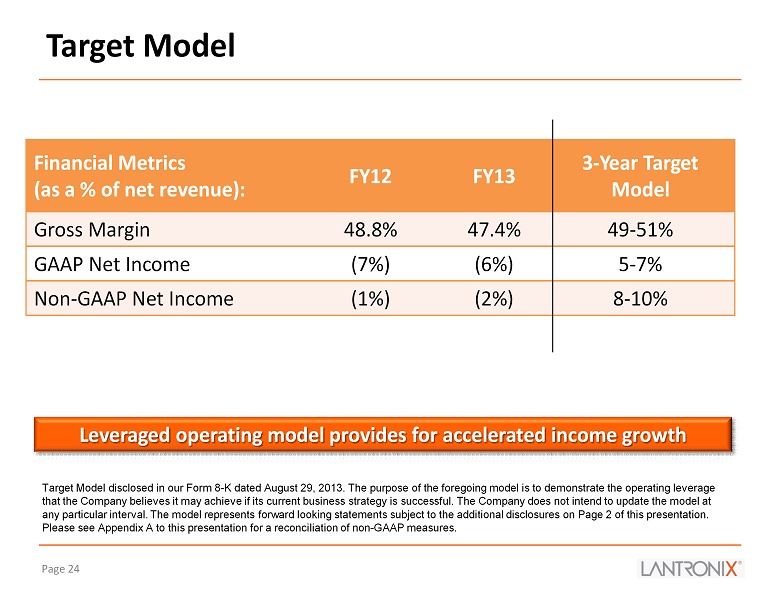
Page 24 Target Model Leveraged operating model provides for accelerated income growth Financial Metrics (as a % of net revenue): FY 12 FY 13 3 - Year Target Model Gross Margin 48.8% 47.4% 49 - 51% GAAP Net Income (7%) (6%) 5 - 7% Non - GAAP Net Income (1%) (2%) 8 - 10% Target Model disclosed in our Form 8 - K dated August 29, 2013 . The purpose of the foregoing model is to demonstrate the operating leverage that the Company believes it may achieve if its current business strategy is successful. The Company does not intend to updat e t he model at any particular interval . The model represents forward looking statements subject to the additional disclosures on Page 2 of this presentation. Please see Appendix A to this presentation for a reconciliation of non - GAAP measures.
| 24 |

Page 25 Management Team Jeremy Whitaker , Chief Financial Officer • Former Lantronix Vice President of Finance, returned to join turnaround • Broad perspective with both outside auditor (Ernst & Young) and internal finance and accounting experience at multiple publicly traded companies Tom Morton , VP, Human Resources • 30+ years human resource experience • Former experience at Mindspeed , Conexant, Rockwell Robert Robinson , VP, Worldwide Sales • 20+ years of direct and channel sales experience • Excellent background in wireless M2M applications and devices • Former experience at GlobalTRACK , Crossbow Technologies and D - Link Kurt Busch , President & CEO, Director • 20+ years technology industry experience in marketing, sales, and general management roles • Former SVP and GM of Mindspeed’s High Performance Analog Business Unit Daryl Miller , VP, Engineering • 30+ years experience in engineering, embedded systems, software, and networking • Former experience at Tektronix and NCD Michael Fink , VP, Operations • 20 years operations management experience • Formerly held key positions at Inphi Corp, Sierra Monolithics , and Mindspeed Mark Tullio , VP, Worldwide Marketing • 20+ years of marketing, PR, and strategic planning experience • Broad high - tech experience (software, hardware, wireless, internet/ecommerce) • Former marketing executive with Kaplan and NBC
| 25 |

Page 26 Board of Directors Bernhard Bruscha, Chairman and Lantronix Co - Founder (2007) • 25+ years as serial entrepreneur in technology industry • Founder of TL Investment with global investments in Europe, Asia and US Kurt Busch , Director, Lantronix President & CEO (2012) • 20+ years technology industry experience in, engineering, marketing, sales, and general management roles • Former SVP and GM of Mindspeed’s High Performance Analog Business Unit Bruce Edwards, Independent Director, Compensation Committee Chair (2012) • 20+ years technology industry veteran • Currently serves on Semtech and Emulex Boards • Former Powerwave Chairman and CEO (1996 - 2007); grew company from $36M to $780M in revenues Paul Folino, Independent Director, Governance and Nominating Committee Chair (2012) • 30+ years technology industry veteran • Currently serves on Emulex, CoreLogic and Microsemi boards • Former Emulex Executive Chairman (2006 - 2011) and CEO (1993 - 2006) • Grew Emulex from $55M to $470M in revenues Hoshi Printer, Independent Director, Audit Committee Chair (2010) • 30+ years technology industry finance executive • Former CFO Autobytel , Peerless Systems, Soane Technologies, and Catalytica
| 26 |

Page 27 Management and Board of Director Ownership Shares Owned Options O/S Kurt Busch, CEO & President, Director 12,460 570,000 Bernhard Bruscha, Director & Founder 6,115,342 141,158 Bruce Edwards, Director 11,000 25,000 Michael Fink, VP of Operations 1,000 75,000 Paul Folino, Director 25,000 34,895 Daryl Miller, VP of Engineering 13,074 177,904 Hoshi Printer, Director 4,000 58,750 Jeremy Whitaker, CFO 23,377 140,000 Updated as of September 6, 2013.
| 27 |