Attached files
| file | filename |
|---|---|
| 8-K/A - FORM 8-K/A - HomeStreet, Inc. | form8-kainvestorpresentati.htm |

SECOND QUARTER 2013 UPDATE - REVISED NASDAQ:HMST 1

Important Disclosures Forward-Looking Statements In accordance with Section 21E of the Securities Exchange Act of 1934, as amended, we caution you that we may make forward-looking statements about our industry, our future financial performance and business activity in this presentation that are subject to many risks and uncertainties. These forward-looking statements are based on our management's current expectations, beliefs, projections, future plans and strategies, anticipated events or trends and similar expressions concerning matters that are not historical facts, as well as a number of assumptions concerning future events. These statements are subject to risks, uncertainties, assumptions and other important factors set forth in our SEC filings, including but not limited to our most recent Annual Report on Form 10-K for the fiscal year ended December 31, 2012, and our most recent Quarterly Report on Form 10-Q. Many of these factors are beyond our control. Such factors could cause actual results to differ materially from the results discussed or implied in the forward-looking statements. These risks include statements predicated on our ability to expand our banking operations geographically and across market sectors, grow our franchise and capitalize on market opportunities, which outcomes are subject to our ability to manage these efforts cost-effectively and to attain the desired operational and financial outcomes; our ability to manage the losses inherent in our loan portfolio; our ability to make accurate estimates of the value of our non-cash assets and liabilities; our ability to respond to an increasingly restrictive and complex regulatory environment; and our ability to attract and retain key personnel. Actual results may fall materially short of our expectations and projections, and we may change our plans or take additional actions that differ in material ways from our current intentions. Accordingly, we can give no assurance of future performance, and you should not rely unduly on forward- looking statements. All forward looking statements are based on information available to the Company as of the date hereof, and we do not undertake to update or revise any forward looking statements, for any reason. Basis of Presentation of Financial Data Unless noted otherwise in this presentation, all reported financial data is being presented as of the period ending June 30, 2013. 2

Established Pacific Northwest Franchise 3 • 92-year diversified financial services company headquartered in Seattle • Leading Northwest mortgage lender and diversified commercial & consumer bank • Pro forma assets of $3.05 billion with branch network in Pacific Northwest, California and Hawaii (1) • 29 retail deposit branches, 34 stand-alone home loan centers and three stand-alone commercial lending centers (2) • Pro forma deposits of $2.23 billion (3) • Attractive PNW demographics Population growth Household/business formation Employment base, job creation Concentration of large high-growth employers Housing recovery (1) Assets are pro forma and include assets acquired from AmericanWest, Fortune Bank and Yakima National Bank based on data at 6/30/13. (2) Includes acquisition of four Yakima National Bank locations and two AmericanWest Bank retail deposit branches, expected to close in the fourth quarter of 2013. Fortune Bank branches will be consolidated into existing HomeStreet Bank branches upon closing of transaction. (3) Deposits are pro forma and include deposits acquired from AmericanWest, Fortune Bank and Yakima National Bank based on data at 6/30/13.

Mortgage and Traditional Banking • Originator and servicer • All retail direct originations (1) • Majority of production sold into secondary market • Fannie Mae, FHA, VA lender since programs’ inception • Portfolio products: jumbo and custom home construction Mortgage Banking • Commercial lending including SBA • Treasury and cash management services • CRE lending: construction, bridge and permanent portfolio loans • One of 25 Fannie Mae DUS® multifamily lenders; only one based in Pacific Northwest • Residential construction Primarily home building; limited land exposure • Consumer banking and lending • Investment products • Insurance products Commercial & Consumer Banking 4 (1) Includes Windermere Mortgage Services
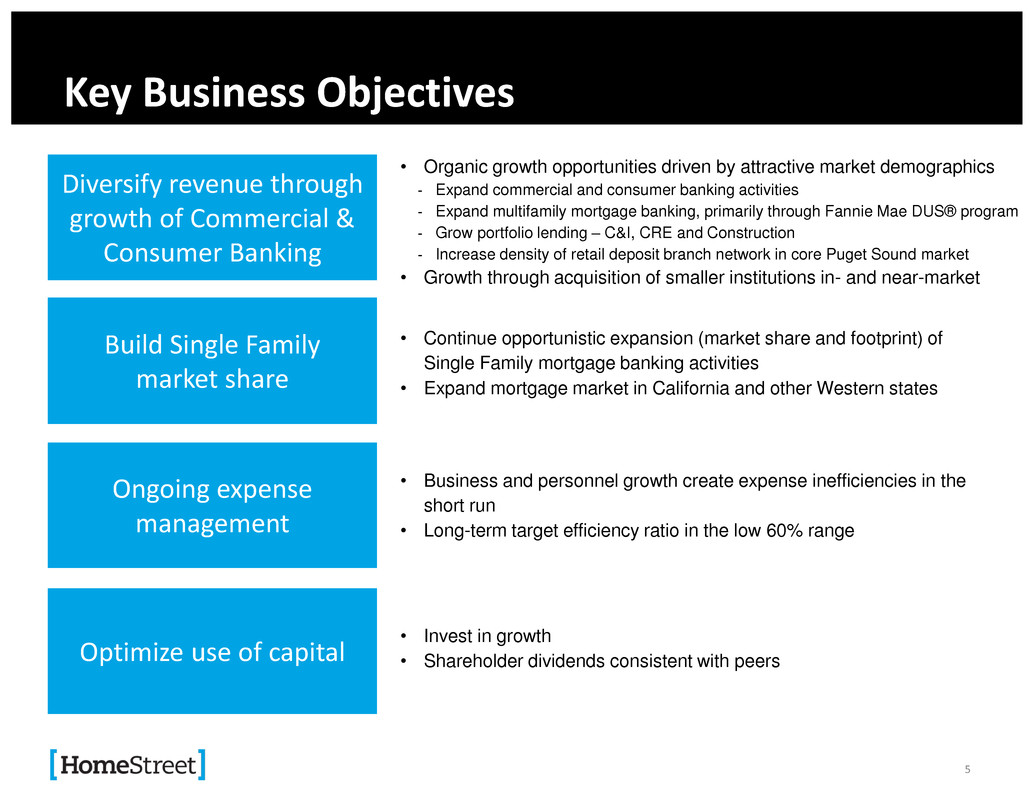
Key Business Objectives 5 Diversify revenue through growth of Commercial & Consumer Banking Build Single Family market share Ongoing expense management Optimize use of capital • Organic growth opportunities driven by attractive market demographics - Expand commercial and consumer banking activities - Expand multifamily mortgage banking, primarily through Fannie Mae DUS® program - Grow portfolio lending – C&I, CRE and Construction - Increase density of retail deposit branch network in core Puget Sound market • Growth through acquisition of smaller institutions in- and near-market • Continue opportunistic expansion (market share and footprint) of Single Family mortgage banking activities • Expand mortgage market in California and other Western states • Business and personnel growth create expense inefficiencies in the short run • Long-term target efficiency ratio in the low 60% range • Invest in growth • Shareholder dividends consistent with peers

Recent Developments - Revised • On July 9, the Company announced the execution of a definitive agreement for HomeStreet Bank to purchase two AmericanWest Bank branches in the Seattle Metro area, for which we recently received regulatory approval; the transaction is expected to close in the fourth quarter of 2013 • On July 26, the Company announced that it has entered into two separate merger agreements to acquire Fortune Bank and Yakima National Bank, subject to regulatory approval and shareholder approval of each of the proposed mergers; the transactions are expected to close in the fourth quarter of 2013 • On August 15, 2013, the Company paid a special common stock dividend of $0.11 per share to shareholders of record as of August 5, 2013 • Added six new home loan centers in Northern and Central California since the end of the second quarter • Significant increase in interest rates since May has resulted in sharp decline in mortgage production volumes (primarily refinance mortgages) and has also led to a decline in gain on sale margins. These factors are expected to result in a significant decline in earnings for the Mortgage Banking segment over the 2nd half of 2013 6

Results of Operations ($ in thousands) ROAA 1.86% 3.15% 1.81% 3.30% ROAE 17.19% 36.03% 16.58% 44.39% Net Interest Margin 3.10% 2.85% 2.96%(1) 2.68% Tier 1 Leverage Ratio (Bank) 11.89% 10.20% 11.89% 10.20% Total Risk-Based Capital (Bank) 19.15% 17.09% 19.15% 17.09% 7 For the three months ended June 30, 2013 June 30, 2012 June 30, 2013 June 30, 2012 Net interest income $ 17,415 $14,799 $ 32,650 $27,631 Provision for loan losses 400 2,000 2,400 2,000 Noninterest income 57,556 56,850 116,499 96,998 Noninterest expense 56,712 46,954 112,511 81,691 Net income before taxes 17,859 22,695 34,238 40,938 Income taxes 5,791 4,017 11,230 2,301 Net income $ 12,068 $18,678 $ 23,008 38,637 Diluted EPS $ 0.82 $ 1.26 $ 1.56 $ 3.03 For the three months ended (1) Interest expense for the first quarter included $1.4 million related to the correction of the cumulative effect of an error in prior years resulting from the under-accrual of deferred interest due on TruPS. The Company’s Net Interest Margin for the six months ended June 30, 2013, including the impact of this correction, was 3.08%. For the six months ended

Q2 12 Q3 12 Q4 12 Q1 13 Q2 13 Net Interest Margin (%) 2.85% 3.12% 3.06% 3.06% 3.10% Avg. Cost of Deposits (%) 0.95% 0.78% 0.75% 0.74% 0.51% Total Interest-Bearing COF (%) 1.11% 0.99% 0.96% 0.94% 0.64% 0.00% 0.50% 1.00% 1.50% 2.00% 2.50% 3.00% 3.50% Net Interest Margin Net Interest Margin • Q2 NIM increased 4 bps • Average cost of deposits decreased to 51 bps due to changes in composition of deposits • Cost of deposits anticipated to fall to between 43 and 45 bps in Q3 8 (1) (1) Interest expense for the first quarter included $1.4 million related to the correction of the cumulative effect of an error in prior years resulting from the under- accrual of deferred interest due on TruPS. The Company’s Net Interest Margin and Total Interest-Bearing Cost of Funds for the first quarter, including the impact of this correction, were 2.81% and 1.27%, respectively. (1)

Interest-Earning Assets • Average loans held for investment increased by $51 million or 3.8% in Q2 − Net new originations in mortgage, commercial, commercial real estate and residential construction − New loan commitments totaled $211 million for the second quarter, an increase of 84% over the first quarter • Total average interest-earning assets increased by $77 million or 3.4% 9 Avg. Yield 3.79% 3.94% 3.82% 3.80% 3.63% 3.00% 3.20% 3.40% 3.60% 3.80% 4.00% 0.0 0.5 1.0 1.5 2.0 2.5 Q2 12 Q3 12 Q4 12 Q1 13 Q2 13 $ i n bi ll io n s Interest-Earning Assets Cash & Cash Equivalents Investment Securities Loans Held for Sale Loans Held for Investment Average Yield
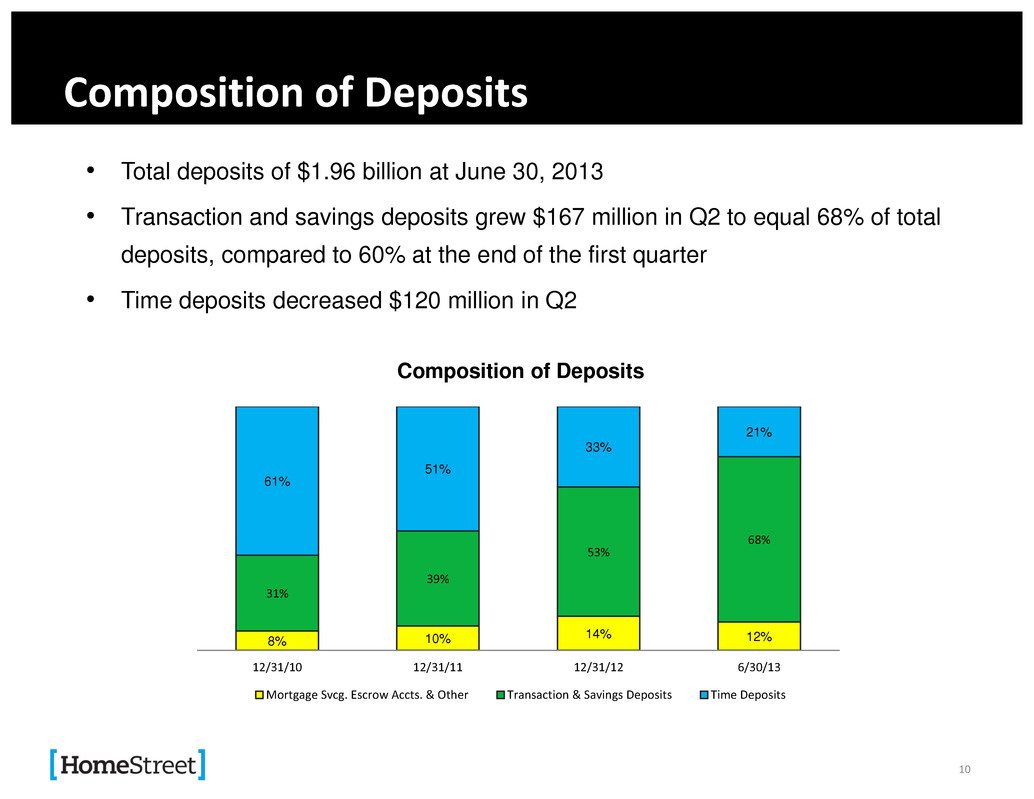
Composition of Deposits • Total deposits of $1.96 billion at June 30, 2013 • Transaction and savings deposits grew $167 million in Q2 to equal 68% of total deposits, compared to 60% at the end of the first quarter • Time deposits decreased $120 million in Q2 10 8% 10% 14% 12% 31% 39% 53% 68% 61% 51% 33% 21% 12/31/10 12/31/11 12/31/12 6/30/13 Composition of Deposits Mortgage Svcg. Escrow Accts. & Other Transaction & Savings Deposits Time Deposits

Noninterest Income • Noninterest income decreased 2% to $57.6 million for Q2 compared to Q1 due to lower mortgage loan origination and sale revenue and lower mortgage servicing income 11 Q2 12 Q3 12 Q4 12 Q1 13 Q2 13 Noninterest income $56,850 $69,091 $71,932 $58,943 $57,556 $0 $10,000 $20,000 $30,000 $40,000 $50,000 $60,000 $70,000 $80,000 Noninterest Income ($ in thousands)

Noninterest Expense • Headcount increased by 7.5% in Q2 • Increased salaries and related costs due primarily to higher mortgage commissions and incentives resulting from increased mortgage closed loan production • Lower OREO expenses due to significant reduction in properties and balances • Noninterest expense will continue to vary based on headcount and mortgage origination volume 12 Q2 12 Q3 12 Q4 12 Q1 13 Q2 13 FDIC assessments $717 $794 $803 $567 $143 Legal, consulting, occupancy, IT $5,132 $6,071 $6,780 $7,105 $8,317 OREO $6,049 $348 $1,169 $2,135 ($597) General & administrative $6,832 $7,148 $8,534 $10,930 $10,270 Salaries & related costs $28,224 $31,573 $38,680 $35,062 $38,579 Total Expenses $46,954 $45,934 $55,966 $55,799 $56,712 Headcount 913 998 1099 1,218 1,309 Efficiency ratio 65.53% 53.65% 63.22% 75.22% 75.65% 0 200 400 600 800 1000 1200 1400 $0 $10,000 $20,000 $30,000 $40,000 $50,000 $60,000 Noninterest Expense ($ in thousands) Headcount

Mortgage Origination • Purchase volume increased significantly (includes Windermere Mortgage Services) 59% of interest rate lock commitments, compared to 50% in the first quarter (1) 59% of closed loan volume, up from 37% in the first quarter Purchase mortgages made up 80% of rate lock commitments in July and 81% in August 13 (1) Servicing value and secondary marketing gains have been aggregated and are stated as a percentage of interest rate lock commitments. In previous quarters, the value of originated MSRs was presented as a separate component of the composite margin and stated as a percentage of mortgage loans sold. Prior periods have been revised to conform to the current presentation. (2) Loan origination and funding fees stated as a percentage of mortgage originations from the retail channel and excludes loans purchased from WMS. (3) Excludes the impact of a $1.3 million correction that was recorded in secondary marketing gains in the fourth quarter of 2012 for the cumulative effect of an error in prior years related to the fair value measurement of loans held for sale. Including the impact of this correction, the secondary marketing gain margin and Composite Margin were 324 and 505 basis points, respectively, in the fourth quarter of 2012. (4) Excludes the impact of a $4.3 million upward adjustment related to a change in accounting estimate that resulted from a change in the application of the valuation technique used to value the Company's interest rate lock commitments. Including the impact of this cumulative effect adjustment, the secondary marketing gain margin and Composite Margin were 265 and 454 basis points, respectively, in the first quarter of 2013. $0 $200 $400 $600 $800 $1,000 $1,200 $1,400 $1,600 Q2 12 Q3 12 Q4 12 Q1 13 Q2 13 Single Family Closed Loan Production ($ in millions) HMST WMS Rate locks Bps 0 100 200 300 400 500 Q2 12 Q3 12 Q4 12 Q1 13 Q2 13 Single Family Composite Margin (bps) Secondary gains/rate locks Loan fees/closed loans Q2 12 Q3 12 Q4 12 Q1 13 Q2 13 Secondary gains/rate locks(1) 296 424 452 (3) 385(4) 305 Loan fees/closed loans(2) 84 77 71 76 75 Composite Margin 380 501 523 461 380 Q2 12 Q3 12 Q4 12 1 13 Q2 13 HMST $847 $1,123 $1,304 $1,024 $1, 07 WMS $222 $245 $ 15 $168 $200 Total closed loans $1,069 $1,368 $1,519 $1,192 $1, 07 Rate locks $1,303 $1,313 $1,255 $1,036 $1,423

Mortgage Servicing - Weighted average servicing fee of 30 bps - MSRs represent 1.23% of ending UPB – 4.05 weighted average servicing fee multiple - Weighted average age – 24.9 months - Composition was 23% government in Q2 compared to 25% in the first quarter - Total delinquency of 1.97% (including foreclosures) at 6/30/13 - Weighted average note rate of 4.14% 14 Single Family • HomeStreet retains servicing for the majority of Single Family residential and Fannie Mae DUS loans Q2 12 Q3 12 Q4 12 Q1 13 Q2 13 Commercial (Primarily DUS) $829 $814 $780 $790 $771 SF Residential $7,469 $8,110 $8,871 $9,701 $10,405 Total $8,298 $8,924 $9,651 $10,491 $11,176 $0 $2,000 $4,000 $6,000 $8,000 $10,000 $12,000 Mortgage Servicing Portfolio ($ in millions)

Segment Financial Results 15 • Steady improvement in financials results of Commercial & Consumer Banking lines of business, with segment net income of $1.3 million in Q2 (first profit since the recession) • Prior period losses primarily attributed to recession-related credit costs 41,421 96,693 13,793 10,747 24,540 (25,302) (14,566) (2,853) 1,321 (1,532) 16,119 82,127 10,940 12,068 23,008 ($40,000) ($20,000) $0 $20,000 $40,000 $60,000 $80,000 $100,000 $120,000 TY 2011 TY 2012 Q1 2013 Q2 2013 YTD 2013 Mortgage Banking vs. Commercial & Consumer Banking ($ in thousands) Mortgage Banking Commercial & Consumer Banking Total

Diversification of Earnings Strategy: Execution Update 16 • Key HomeStreet strategy throughout 2013 to diversify earnings by returning the Commercial & Consumer Banking Segment to profitability while Mortgage Banking continues to contribute income during a shift in market conditions • Long term targeted ROE for Company of >15% Key Segment Execution Objectives • Increase production capacity and targeted expansion & recruiting • Anticipate shift in market conditions • Fixed/Semi/Variable cost management • Long term targeted ROE of >20% Mortgage Banking Segment • Build loan portfolio • Increase commercial lending capacity • Diversify loan portfolio • Expansion: In-market and new markets • Long term targeted ROE range of 8-12% ⁻ C&I lending range of 8-12% ⁻ Commercial real estate (permanent) range of 10-15% ⁻ Commercial construction range of 10-15% ⁻ Residential construction range of 20-30% ⁻ Single family residential range of 10-15% Commercial & Consumer Banking Segment

13.0% 19.9% 6.6% 60.5% 11.6% 19.9% 6.0% 62.5% 16.7% 19.2% 7.4% 56.7% Diversification of Earnings Strategy: Execution Update 17 Commercial & Consumer Banking Segment Build Loan Portfolio Increase Commercial Lending Capacity Expansion: In Market / New Markets • Opened three new retail deposit branches in Seattle Metro area • Adding two retail branches in Seattle Metro area through AmericanWest branch acquisition • Adding four branch locations in Central/Eastern Washington through Yakima National Bank acquisition * Pro forma includes balances from Yakima National Bank and Fortune Bank • Acquiring seasoned commercial lending teams through acquisitions of Yakima National and Fortune Bank • In 2012/2013, hired commercial lenders and support staff into existing HomeStreet lending groups • Rebuilding portfolio after recession – focus on improving credit quality Diversify Loan Portfolio 1,299,306 1,340,111 1,390,219 1,447,460 1,640,488 0 500,000 1,000,000 1,500,000 2,000,000 3Q12 4Q12 1Q13 2Q13 2Q13 pro forma Loan Portfolio Growth: Last 4 Qtrs & pro forma* ($000) Portfolio Loans 4Q12 2Q13 2Q13 pro forma* Non-Owner Occupied CRE Single Family & HE C&I and Owner Occupied CRE Construction, Multifamily, & Other * Pro forma includes balances from Yakima National Bank and Fortune Bank
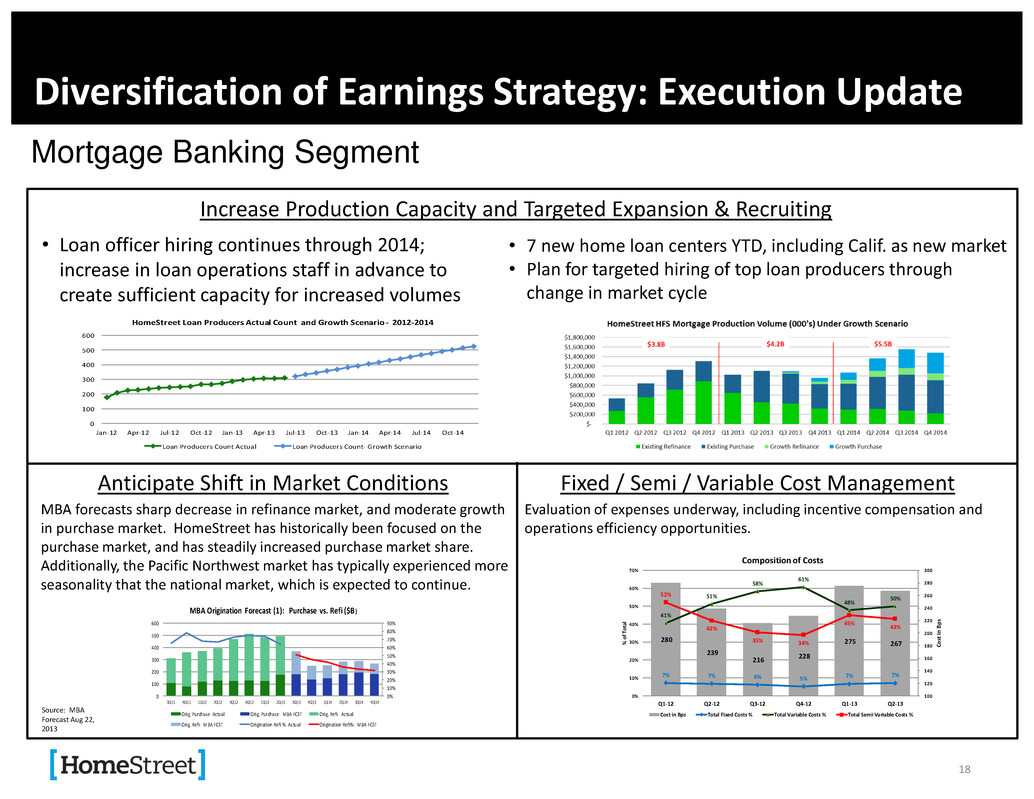
Diversification of Earnings Strategy: Execution Update 18 Mortgage Banking Segment Increase Production Capacity and Targeted Expansion & Recruiting Anticipate Shift in Market Conditions Fixed / Semi / Variable Cost Management 0 100 200 300 400 500 600 Jan-12 Apr-12 Jul-12 Oct-12 Jan-13 Apr-13 Jul-13 Oct-13 Jan-14 Apr-14 Jul-14 Oct-14 HomeStreet Loan Producers Actual Count and Growth Scenario- 2012-2014 Loan Producers Count Actual Loan Producers Count- Growth Scenario • Loan officer hiring continues through 2014; increase in loan operations staff in advance to create sufficient capacity for increased volumes 0% 10% 20% 30% 40% 50% 60% 70% 80% 90% 0 100 200 300 400 500 600 3Q11 4Q11 1Q12 2Q12 3Q12 4Q12 1Q13 2Q13 3Q13 4Q13 1Q14 2Q14 3Q14 4Q14 MBA Origination Forecast (1): Purchase vs. Refi ($B) Orig, Purchase- Actual Orig, Purchase- MBA FCST Orig, Refi- Actual Orig, Refi- MBA FCST Origination Refi %- Actual Origination Refi%- MBA FCST • 7 new home loan centers YTD, including Calif. as new market • Plan for targeted hiring of top loan producers through change in market cycle MBA forecasts sharp decrease in refinance market, and moderate growth in purchase market. HomeStreet has historically been focused on the purchase market, and has steadily increased purchase market share. Additionally, the Pacific Northwest market has typically experienced more seasonality that the national market, which is expected to continue. Source: MBA Forecast Aug 22, 2013 Evaluation of expenses underway, including incentive compensation and operations efficiency opportunities. 280 239 216 228 275 267 7% 7% 6% 5% 7% 7% 41% 51% 58% 61% 48% 50% 52% 42% 35% 34% 45% 43% 100 120 140 160 180 200 220 240 260 280 300 0% 10% 20% 30% 40% 50% 60% 70% Q1-12 Q2-1 Q3-12 Q4-12 Q1-13 Q2-13 Co st i n B ps % o f T ota l Composition of Costs Cost in Bps Total Fixed Costs % Total Variable Costs % Total Semi-Variable Costs %

Why HomeStreet? • Established and expanding franchise concentrated in the Pacific Northwest • Leading regional Single Family mortgage lender and only Fannie Mae DUS® Multifamily lender headquartered in the Northwest • Focus on growth of commercial and consumer banking to balance mortgage banking earnings • Superior historical returns on equity due to high noninterest income • Attractive valuation transition opportunity as company diversifies from mortgage banking-dominated income http://ir.homestreet.com ir@homestreet.com 19

. 20 Appendix
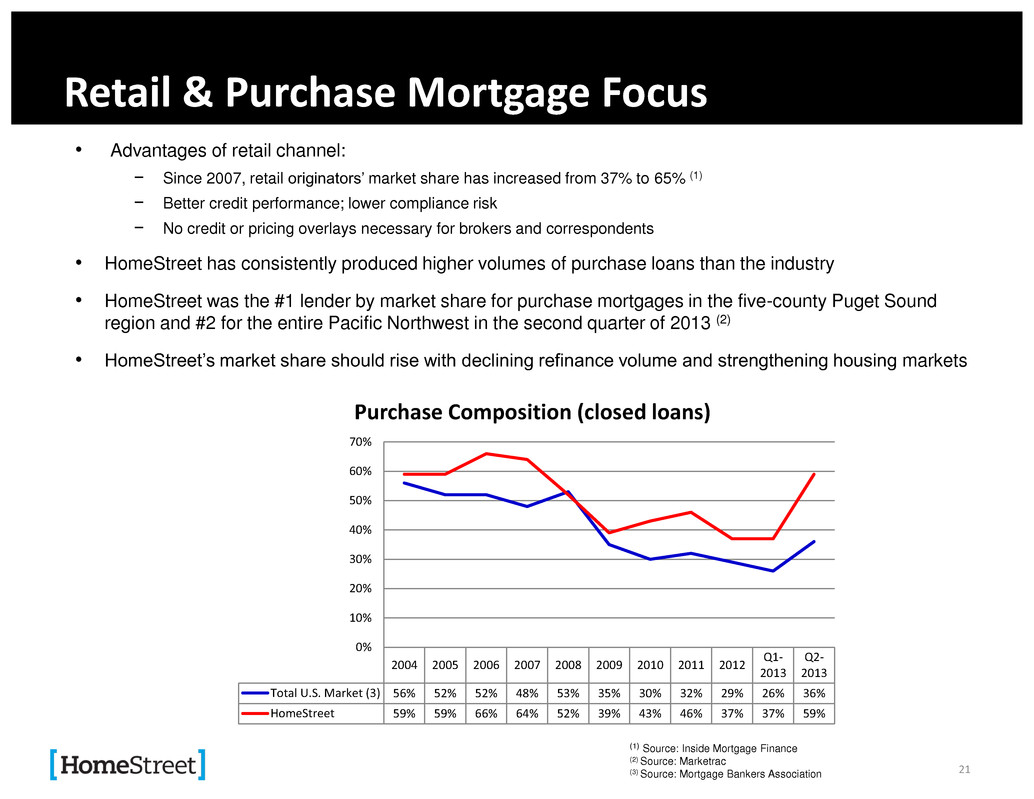
Retail & Purchase Mortgage Focus 21 • Advantages of retail channel: − Since 2007, retail originators’ market share has increased from 37% to 65% (1) − Better credit performance; lower compliance risk − No credit or pricing overlays necessary for brokers and correspondents • HomeStreet has consistently produced higher volumes of purchase loans than the industry • HomeStreet was the #1 lender by market share for purchase mortgages in the five-county Puget Sound region and #2 for the entire Pacific Northwest in the second quarter of 2013 (2) • HomeStreet’s market share should rise with declining refinance volume and strengthening housing markets (1) Source: Inside Mortgage Finance (2) Source: Marketrac (3) Source: Mortgage Bankers Association 2004 2005 2006 2007 2008 2009 2010 2011 2012 Q1- 2013 Q2- 2013 Total U.S. Market (3) 56% 52% 52% 48% 53% 35% 30% 32% 29% 26% 36% HomeStreet 59% 59% 66% 64% 52% 39% 43% 46% 37% 37% 59% 0% 10% 20% 30% 40% 50% 60% 70% Purchase Composition (closed loans)
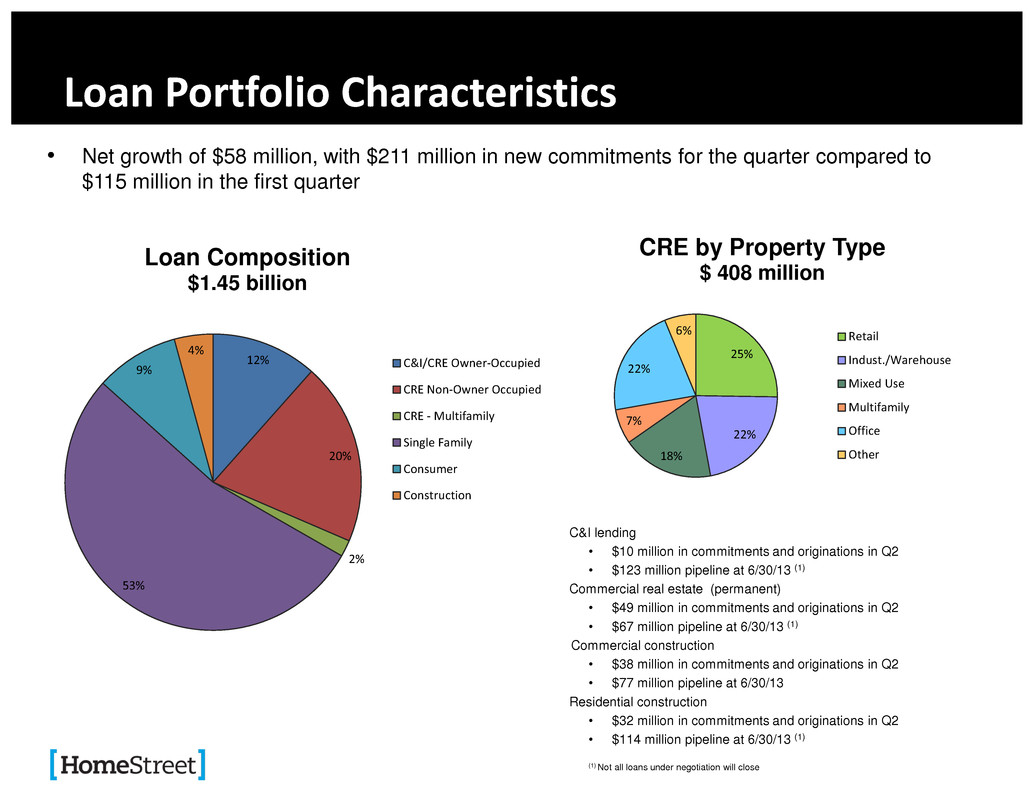
C&I lending • $10 million in commitments and originations in Q2 • $123 million pipeline at 6/30/13 (1) Commercial real estate (permanent) • $49 million in commitments and originations in Q2 • $67 million pipeline at 6/30/13 (1) Commercial construction • $38 million in commitments and originations in Q2 • $77 million pipeline at 6/30/13 Residential construction • $32 million in commitments and originations in Q2 • $114 million pipeline at 6/30/13 (1) (1) Not all loans under negotiation will close Loan Portfolio Characteristics • Net growth of $58 million, with $211 million in new commitments for the quarter compared to $115 million in the first quarter (1) Not all loans under negotiation will close 12% 20% 2% 53% 9% 4% Loan Composition $1.45 billion C&I/CRE Owner-Occupied CRE Non-Owner Occupied CRE - Multifamily Single Family Consumer Construction 25% 22% 18% 7% 22% 6% CRE by Property Type $ 408 million Retail Indust./Warehouse Mixed Use Multifamily Office Other

Ongoing Improvement in Credit Quality 23 • Nonperforming assets were 1.50% of total assets compared to 2.14% in Q1 2013 • OREO decreased by $9.7 million or 45% due to sale of several commercial properties • Classified assets were 2.69% of total assets compared to 3.59% of total assets in Q1 2013 • Delinquent loans totaled $88 million, including $53 million of loans insured or guaranteed by FHA or VA that were still accruing at quarter-end • Q2 loan loss provision of $400,000 with net charge-offs of $1 million • Peer group comprised of AF, WAFD, ISBC, BKU, SBCF, BANC, ESBF, UCFC, PGC, CZNC, PROV, FFNW, SMPL, TSH (1) Metric ($ in 000s) 12/31/2012 3/31/2013 6/30/2013 (1) Source: SNL (2) Total delinquencies/total loans (3) Total delinquencies/total loans (both net of Ginnie Mae EBO) HMST Peer Avg HMST Peer Avg HMST Peer Avg Classified Assets $86,270 $98,161 $90,076 $89,746 $74,721 $89,026 Nonperforming Assets $53,833 $122,843 $53,797 $129,874 $41,650 $122,351 Classified assets/total assets 3.28% 1.99% 3.59% 1.80% 2.69% 1.76% Nonperforming assets/total assets 2.05% 2.49% 2.14% 2.61% 1.50% 2.42% Delinquencies (2) 6.58% 3.41% 6.66% 3.27% 6.06% 2.88% Delinquencies adjusted (3) 2.93% -- 2.94% -- 2.52% -- ALL/total loans 2.06% 1.33% 2.05% 1.34% 1.92% 1.27% ALL/NPLs 92.20% 70.79% 88.40% 69.78% 93.11% 72.92%

Management Team 24 Executive Joined Company Years in Industry Relevant Experience Mark K. Mason Director, Vice Chairman, President and Chief Executive Officer September 2009 27 • Seasoned banking executive with demonstrated success implementing turnaround and growth strategies • Former Chairman and CEO of Fidelity Federal Bank of Los Angeles Cory D. Stewart Executive Vice President, Chief Accounting Officer March 2012 13 • Extensive experience in finance, accounting and enterprise risk management roles in the financial industry including at Washington Mutual • MBA, CPA, CFA charter holder Darrell van Amen Executive Vice President, Chief Investment Officer March 2003 24 • Manages bank’s MSR and pipeline risk, secondary marketing and investment portfolio • Formerly with Royal Bank of Canada and Old Kent Financial Jay C. Iseman Executive Vice President, Chief Credit Officer August 2009 22 • Significant experience in credit administration and special assets for Bank of America and Key Bank • Chairs Bank Loan Committee Godfrey B. Evans Executive Vice President, General Counsel and Chief Administrative Officer November 2009 32 • Significant experience in banking, regulation, M&A and corporate securities law • Previously General Counsel and CAO at Fidelity Federal Bank and corporate lawyer at Gibson, Dunn & Crutcher
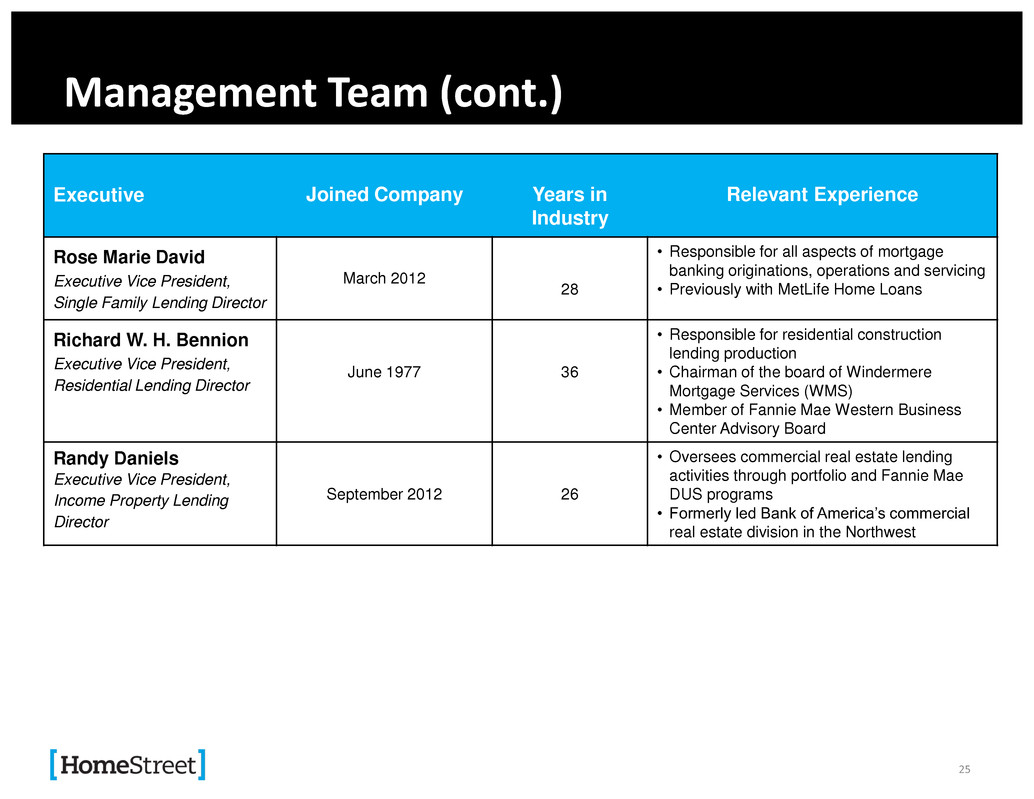
Management Team (cont.) 25 Executive Joined Company Years in Industry Relevant Experience Rose Marie David Executive Vice President, Single Family Lending Director March 2012 28 • Responsible for all aspects of mortgage banking originations, operations and servicing • Previously with MetLife Home Loans Richard W. H. Bennion Executive Vice President, Residential Lending Director June 1977 36 • Responsible for residential construction lending production • Chairman of the board of Windermere Mortgage Services (WMS) • Member of Fannie Mae Western Business Center Advisory Board Randy Daniels Executive Vice President, Income Property Lending Director September 2012 26 • Oversees commercial real estate lending activities through portfolio and Fannie Mae DUS programs • Formerly led Bank of America’s commercial real estate division in the Northwest

Basel III 26 Estimated Capital Ratios under Basel III – June 30, 2013 Under Current Rules Pro Forma Basel III Under Current Rules Pro Forma Basel III (fully implemented) Under Current Rules Pro Forma Basel III (fully implemented) Tier 1 Leverage 5.0% 5.0% (1) 11.9% 8.7% 12.6% 8.9% Tier 1 Risk-Based Capital 6.0% 8.5% (2) 17.9% 12.8% 14.9% 10.3% Total Risk-Based Capital 10.0% 10.5% (2) 19.1% 14.0% 16.2% 14.3% HomeStreet Bank HomeStreet, Inc. (1) Capital Conservation Buffer does not apply to Tier 1 Leverage Ratio under Basel III (2) Ratio includes 2.5% Capital Conservation Buffer required by Basel III for unrestricted payments of dividends, share buybacks and discretionary bonus payments Well-Capitalized Minimum
