Attached files
| file | filename |
|---|---|
| EX-5.1 - EX-5.1 - SunEdison Semiconductor Ltd | d593877dex51.htm |
| EX-23.1 - EX-23.1 - SunEdison Semiconductor Ltd | d593877dex231.htm |
Table of Contents
As filed with the Securities and Exchange Commission on September 9, 2013
Registration No. 333-
UNITED STATES SECURITIES AND EXCHANGE COMMISSION
Washington, D.C. 20549
FORM S-1
REGISTRATION STATEMENT
UNDER
THE SECURITIES ACT OF 1933
SUNEDISON SEMICONDUCTOR, INC.
(Exact name of registrant as specified in its charter)
| Delaware | 3674 | 46-3556980 | ||
| (State or other jurisdiction of incorporation or organization) |
(Primary Standard Industrial Classification Code Number) |
(I.R.S. Employer Identification No.) |
501 Pearl Drive (City of O’Fallon)
St. Peters, Missouri 63376
(636) 474-5000
(Address, including zip code and telephone number, including area code, of registrant’s principal executive offices)
Shaker Sadasivam
President and Chief Executive Officer
SunEdison Semiconductor, Inc.
501 Pearl Drive (City of O’Fallon)
St. Peters, Missouri 63376
(636) 474-5000
(Name, address, including zip code and telephone number, including area code, of agent for service)
Copies of all communications, including communications sent to agent for service, should be sent to:
| Dennis M. Myers Kirkland & Ellis LLP 300 North LaSalle Chicago, Illinois 60654 (312) 862-2000 |
Christopher L. Kaufman Tad J. Freese Latham & Watkins LLP 140 Scott Drive Menlo Park, California 94025 (650) 328-4600 |
Approximate date of commencement of proposed sale to the public: As soon as practicable after this Registration Statement becomes effective.
If any of the securities being registered on this Form are to be offered on a delayed or continuous basis pursuant to Rule 415 under the Securities Act, check the following box. ¨
If this Form is filed to register additional securities for an offering pursuant to Rule 462(b) under the Securities Act, please check the following box and list the Securities Act registration statement number of the earlier effective registration statement for the same offering. ¨
If this Form is a post-effective amendment filed pursuant to Rule 462(c) under the Securities Act, check the following box and list the Securities Act registration statement number of the earlier effective registration statement for the same offering. ¨
If this Form is a post-effective amendment filed pursuant to Rule 462(d) under the Securities Act, check the following box and list the Securities Act registration statement number of the earlier effective registration statement for the same offering. ¨
Indicate by check mark whether the registrant is a large accelerated filer, an accelerated filer, a non-accelerated filer, or a smaller reporting company. See the definitions of “large accelerated filer,” “accelerated filer” and “smaller reporting company” in Rule 12b-2 of the Exchange Act (Check one):
| Large accelerated filer ¨ | Accelerated filer ¨ | Non-accelerated filerx (Do not check if a smaller reporting company) |
Smaller reporting company ¨ |
CALCULATION OF REGISTRATION FEE
|
| ||||
| Title of Each Class of Securities to be Registered |
Proposed Maximum Aggregate Offering Price (1) (2) |
Amount of Registration Fee | ||
| Common Stock, $0.01 par value per share |
$250,000,000 | $34,100 | ||
|
| ||||
|
| ||||
(1) Estimated solely for the purpose of calculating the registration fee pursuant to Rule 457(o) under the Securities Act of 1933, as amended.
(2) Includes the offering price of any additional shares of common stock that the underwriters have the option to purchase.
The registrant hereby amends this Registration Statement on such date or dates as may be necessary to delay its effective date until the registrant shall file a further amendment which specifically states that this Registration Statement shall thereafter become effective in accordance with Section 8(a) of the Securities Act of 1933 or until this Registration Statement shall become effective on such date as the Commission, acting pursuant to said Section 8(a), may determine.
Table of Contents
The information in this prospectus is not complete and may be changed. We may not sell these securities until the registration statement filed with the Securities and Exchange Commission is effective. This prospectus is not an offer to sell these securities and it is not soliciting an offer to buy these securities in any state where the offer or sale is not
permitted.
PROSPECTUS
Subject to Completion
Preliminary Prospectus dated September 9, 2013
shares
SunEdison Semiconductor, Inc.
Common Stock
This is the initial public offering of shares of common stock of SunEdison Semiconductor, Inc. We are selling shares of our common stock.
Prior to this offering, there has been no public market for our common stock. The initial public offering price of our common stock is expected to be between $ and $ per share. We intend to apply to list our common stock on under the symbol “WFR.”
Investing in our common stock involves risks that are described in the “Risk Factors” section beginning on page 14 of this prospectus.
We are an “emerging growth company” as defined in Section 2(a)(19) of the Securities Act of 1933, as amended, or the Securities Act, and, as such, are allowed to provide in this prospectus more limited disclosures than an issuer that would not so qualify. In addition, for so long as we remain an emerging growth company, we will qualify for certain limited exceptions from investor protection laws such as the Sarbanes-Oxley Act of 2002. Please read “Risk Factors—Risks Related to this Offering and Our Common Stock—We are an ‘emerging growth company’ and may elect to comply with reduced public company reporting requirements, which could make our common stock less attractive to investors.”
| Per Share | Total | |||||||
| Public offering price |
$ | $ | ||||||
| Underwriting discounts |
$ | $ | ||||||
| Proceeds, before expenses, to us |
$ | $ | ||||||
The underwriters may also exercise their option to purchase up to additional shares from us at the initial public offering price, less the underwriting discount, for a period of 30 days after the date of this prospectus.
Neither the Securities and Exchange Commission, or SEC, nor any state securities commission has approved or disapproved of these securities or determined if this prospectus is truthful or complete. Any representation to the contrary is a criminal offense.
The shares will be ready for delivery on or about , 2013.
Joint Book-Running Managers
| Deutsche Bank Securities | Goldman, Sachs & Co. |
The date of this prospectus is , 2013.
Table of Contents
| Page | ||||
| 1 | ||||
| 14 | ||||
| 31 | ||||
| 31 | ||||
| 33 | ||||
| 34 | ||||
| 35 | ||||
| 37 | ||||
| 39 | ||||
| NOTES TO UNAUDITED PRO FORMA CONSOLIDATED FINANCIAL STATEMENTS |
44 | |||
| 46 | ||||
| MANAGEMENT’S DISCUSSION AND ANALYSIS OF FINANCIAL CONDITION AND RESULTS OF OPERATIONS |
49 | |||
| 75 | ||||
| 88 | ||||
| 92 | ||||
| SECURITY OWNERSHIP OF CERTAIN BENEFICIAL OWNERS AND MANAGEMENT |
98 | |||
| 99 | ||||
| 103 | ||||
| 104 | ||||
| 109 | ||||
| CERTAIN MATERIAL U.S. FEDERAL INCOME TAX CONSIDERATIONS FOR NON-U.S. HOLDERS |
111 | |||
| 115 | ||||
| 121 | ||||
| 121 | ||||
| 121 | ||||
| F-1 | ||||
We have not and the underwriters have not authorized anyone to provide you with any information other than that contained in this prospectus or in any free writing prospectus prepared by or on behalf of us or to which we have referred you. We are offering to sell, and seeking offers to buy, shares of our common stock only in jurisdictions where such offers and sales are permitted. The information in this prospectus or any free writing prospectus is accurate only as of its date, regardless of its time of delivery or the time of any sale of shares of our common stock. Our business, financial condition, results of operations and prospects may have changed since that date.
The name and mark, SunEdison, Inc., and other trademarks, trade names and service marks of SunEdison, Inc. appearing in this prospectus are the property of SunEdison, Inc. Prior to the completion of this offering, SunEdison Semiconductor, Inc. and other trademarks, trade names and service marks of SunEdison Semiconductor, Inc. appearing in this prospectus are the property of SunEdison, Inc., and after the completion of this offering, SunEdison Semiconductor, Inc. and other trademarks, trade names and service marks of SunEdison Semiconductor, Inc. appearing in this prospectus will be the property of SunEdison Semiconductor, Inc. This prospectus also contains additional trade names, trademarks and service marks belonging to SunEdison, Inc. and to other companies. We do not intend our use or display of other parties’ trademarks, trade names or service marks to imply, and such use or display should not be construed to imply, a relationship with, or endorsement or sponsorship of us by, these other parties.
i
Table of Contents
The following is a summary of material information discussed in this prospectus. This summary may not contain all the details concerning our business, our common stock or other information that may be important to you. You should carefully review this entire prospectus, including the “Risk Factors” section and our financial statements and the related notes included elsewhere in this prospectus, before making an investment decision. As used in this prospectus, unless the context otherwise indicates, the references to (i) “our business,” “we,” “our” or “us” or similar terms refer to the semiconductor materials business as operated as a business segment of SunEdison, Inc., or SunEdison, for periods prior to the Transactions (as described below in “—Structure and Formation of Our Company”) and to SunEdison Semiconductor, Inc., together with, where appropriate, its consolidated subsidiaries, for periods after the completion of the Transactions, and (ii) “SSI” refer to SunEdison Semiconductor, Inc. exclusive of its subsidiaries. Unless otherwise indicated or the context otherwise requires, the financial and operating data included in this prospectus reflect the combined business that will be owned by SunEdison Semiconductor, Inc. after the completion of the Transactions and is otherwise as of June 30, 2013.
Our Company
We are a global leader in the development, manufacture and sale of silicon wafers to the semiconductor industry. Wafers are used as the base substrate for nearly all semiconductor devices, which in turn provide the foundation for the entire electronics industry. Our business was established in 1959 and was known during most of our history as MEMC Electronic Materials, Inc., or MEMC. We have developed a broad product portfolio, an extensive global manufacturing footprint, process technology expertise and supply chain flexibility, while increasing our capital efficiency and maintaining a lean operating culture.
Throughout our over 50 years of operations, we have pioneered a number of semiconductor industry firsts, including the development of the dislocation-free Czochralski, or CZ, silicon crystal growth process and the chemical-mechanical planarization, or CMP, process, as well as the initial production and commercialization of 100mm and 200mm semiconductor wafers. More recently, we have been a leader in the development of advanced substrates such as epitaxial, or EPI, wafers and wafers for the silicon-on-insulator, or SOI, market, which enable advanced computing and communications applications.
We primarily sell our products to all of the major semiconductor manufacturers in the world, including integrated device manufacturers and pure-play semiconductor foundries, and to a lesser extent, leading companies that specialize in wafer customization. During 2012, our largest customers were Samsung, Taiwan Semiconductor Manufacturing Company, or TSMC, and STMicroelectronics. We operate facilities in major semiconductor manufacturing regions throughout the world, including Taiwan, Malaysia, South Korea, Italy, Japan and the United States. We have chosen to locate our manufacturing facilities in regions that offer both low operating costs and close proximity to our customers to facilitate collaboration on product development activities and shorten product delivery times.
The market for semiconductor wafers is large and growing. According to Gartner, Inc., or Gartner, the merchant semiconductor silicon wafer market in 2012 was approximately $9 billion worldwide and is expected to grow at a 5.1% compound annual growth rate, or CAGR, from 2012 to 2017, reaching approximately $12 billion by 2017. This growth in semiconductor wafer demand has been largely attributable to the proliferation of mobile devices such as smart phones and tablets. These devices require semiconductors that are energy efficient, low cost, high performance and highly integrated into a small footprint. Semiconductors offering those characteristics increasingly require EPI and SOI wafers. We believe that the combination of our process technology expertise in EPI and SOI wafer manufacturing with our capital efficiency provides us with significant opportunities as the markets for EPI and SOI wafers continue to grow.
1
Table of Contents
The semiconductor wafer industry has undergone significant consolidation over the past 20 years, from more than 20 suppliers in the 1990s to only five major suppliers today, including Shin-Etsu Handotai, SUMCO Corporation, Siltronic AG, LG Siltron and us, which suppliers accounted for approximately 90% of all semiconductor wafer sales in 2012, according to Gartner. This consolidation is due in large part to the significant increase in the capital investment and manufacturing capacity needed to compete effectively. We have expanded our market share by revenue from 8% in 2008 to 10% in 2012, according to Gartner. We believe this improvement is in large part the result of our emphasis on technology and product innovation and customer service, as well as consistently delivering high quality wafers that meet our customers evolving requirements. We believe we are well positioned to continue to expand our market share and capitalize on the increasing demand for more advanced wafer products. We generated net sales of $934.2 million and $1,198.3 million, net income (loss) attributable to SSI of $121.3 million and $(557.9) million and Adjusted EBITDA of $74.9 million and $170.2 million, in 2012 and 2011, respectively. For the six months ended June 30, 2013, we generated net sales of $476.4 million, net loss attributable to SSI of $23.7 million and Adjusted EBITDA of $53.4 million. See “Summary Historical and Pro Forma Financial Data” for the definition of Adjusted EBITDA, the reason for its inclusion and a reconciliation from net income (loss) attributable to SSI to Adjusted EBITDA.
Industry Overview
Semiconductor devices are at the core of modern electronics. According to Gartner, the total semiconductor market worldwide was $300 billion market in 2012. These devices include microprocessors, memory, analog, mixed-signal and radio frequency, or RF, integrated circuits, discrete, application specific integrated circuits, microelectromechanical systems, or MEMS, and image sensors. Recent semiconductor growth has been largely attributable to the proliferation of mobile devices, which has driven the need for low cost, high performance semiconductors that provide efficient power consumption and a reduced footprint. In order to meet these demands, technology innovation in the semiconductor industry has continued at a strong pace over the past decade, resulting in shrinking process geometries, larger wafer sizes, more stringent technical specifications and the introduction of advanced substrates and device structures. In addition to continued growth in the mobile device market, future semiconductor industry growth is expected to be further driven by new and emerging markets and applications, such as in the healthcare and automotive industries, which are increasingly incorporating advanced technologies in their services and products.
Semiconductor wafers are increasingly required to meet specific performance characteristics. For example, semiconductors used in applications such as mobile devices and cloud infrastructure are increasingly requiring EPI wafers, which enable lower power consumption due to their near perfect surface characteristics. According to Gartner, the epitaxial semiconductor silicon wafer market is expected to grow from $3.6 billion in 2012 to $4.9 billion in 2017, representing a 6.5% CAGR. Similarly, demand for SOI wafers is growing as a result of the ability of SOI wafers to improve switching speeds and enhance the performance of RF devices such as power amplifiers, switches and sensors. According to the SOI Industry Consortium, the total available market for SOI wafers is expected to double over the next five years, driven by the increased penetration in mobile system-on-chips and RF devices. As a semiconductor wafer manufacturer focused on advanced EPI and SOI product solutions, we believe we are well positioned to capitalize on the growth opportunities resulting from industry consolidation and the increasing demand for EPI and SOI wafers.
2
Table of Contents
Our Strengths
Our strengths as a manufacturer of semiconductor wafers include the following:
History of product innovation and process technology expertise. We have a more than 50 year history, under the MEMC brand, of product innovation, including achieving several major advancements in the semiconductor wafer industry, such as the development of the dislocation-free CZ silicon crystal growth process and the CMP process, as well as the initial production and commercialization of 100mm and 200mm semiconductor wafers. We have developed advanced substrates such as EPI wafers and, more recently, SOI wafers to maintain our history of product innovation. We have also developed significant technology expertise in wafer manufacturing processes, including diamond wire cutting, integrated software-enabled tooling and flexible equipment processes supporting the manufacture of semiconductor wafers with various diameters.
Broad product portfolio. We have developed a broad product portfolio. Our products include polished, EPI, SOI, perfect silicon and magic denuded zone, or MDZ, wafers ranging in diameter from 100mm to 300mm. Our process capabilities provide us with the ability to customize our products to address the specific performance characteristics required by our customers. For example, as one of only three primary SOI wafer suppliers, we are capable of satisfying all of our customers’ wafer requirements in microprocessors, memory, analog, mixed-signal and RF integrated circuits, discrete, application specific integrated circuits, MEMS and image sensors.
Extensive global footprint with close customer collaboration. We have an established global manufacturing network consisting of eight facilities located in Taiwan, Malaysia, South Korea, Italy, Japan and the United States. We have located our facilities in areas that offer a combination of low operating costs and highly educated work forces in close proximity to our customers. This “local” presence enables us to collaborate with our customers on product design and development activities and shorten product delivery and response times. Our diverse global footprint also enables us to mitigate risk in the event of natural disasters or other occurrences that can disrupt manufacturing.
Established relationships with blue chip customers. We work with all of the major semiconductor device manufacturers in the world, including integrated device manufacturers and pure-play semiconductor foundries. Our continued focus on developing strong customer relationships has resulted in several awards from our key customers. For example, we were the only company in 2012 to receive supplier excellence awards from each of Samsung, TSMC and Analog Devices based on our performance, quality, service and support. We collaborate with our customers on their research and development, or R&D, activities, allowing us to develop wafer products that meet their product design expectations rapidly and efficiently.
Company-wide focus on capital efficiency and maintaining a lean operating culture. We have implemented several initiatives since 2009 designed to rationalize our use of resources, optimize those resources for the most attractive market opportunities and manage our production capacity to meet demand efficiently. Our engineers’ understanding of both the science and operation of the tools within our factories enables us to streamline equipment controls, software interfaces and operational parameters to improve the productivity of our equipment. We have also designed our manufacturing processes to be flexible and scalable with low to moderate additional capital investment necessary to pursue new opportunities or increase capacity. We continue to focus on improving our equipment productivity through our Overall Equipment Effectiveness program, which has improved our safety, customer satisfaction and on-time delivery and reduced facility disruptions.
Experienced management team with extensive expertise. Our top eight senior managers average 25 years of relevant experience from multiple segments of the semiconductor industry, having joined us from leading technology companies including General Electric, Intel and Motorola. In addition, we have a large and technologically proficient professional staff with approximately 720 engineers, of whom over 125 focus solely on R&D and approximately 45 have Ph.Ds.
3
Table of Contents
Our Business Strategy
Our goal is to continue to be a market leader and increase our market share in the large and growing semiconductor wafer industry. Key elements of our strategy include:
Extending our product and process technology leadership. We are focused on developing leading edge technologies for the semiconductor wafer market. As our customers’ needs evolve with decreasing transistor sizes, increasing degrees of integration and ongoing pressures for cost reduction, the requirements and specifications for semiconductor wafers are also evolving. We are investing in new product and process technologies to be able to offer products with enhanced features, such as flatness, uniformity, resistivity and reduced defects. For example, we are making substantial investments to further our 200mm and 300mm SOI product offerings for below 20 nanometer process technologies, as well as next generation 300mm EPI wafers with advanced performance characteristics for wireless applications.
Increasing our customer penetration and market share. We intend to increase our customer penetration by enhancing our global sales, design and technical support organizations and leveraging our broad product portfolio. We are also focused on capitalizing on attractive new opportunities with current and new customers in emerging applications. For example, we are working closely with customers to design product solutions that enable continued transistor scaling and include 3-D transistors and Fully Depleted SOI planer transistors, as well as to address process issues related to the introduction of new materials in wafer fabrication and advanced lithography. In addition, we are developing wafer solutions that enable integration of multiple functions, such as logic, memory and analog, on the same chip.
Continuing to deliver high quality customer service. We intend to continue our increased focus on delivering high quality customer service and manufacturing flexibility by leveraging our “local” presence that results from our diverse geographic footprint. We are focused on enhancing our established quality assurance programs and dedicated services and support staff in order to continue responding quickly to changing demands and product cycles of our customers.
Maintaining focus on operational improvements. We intend to continue our focus on maintaining a lean operating environment and capital efficiency. We believe our Overall Equipment Effectiveness program and other operational improvements have enabled us to improve lead times across the supply chain, as well as our performance with respect to safety, customer satisfaction and on-time delivery and reduced facility disruptions. These improvements have freed up capacity, reduced costs and significantly improved equipment reliability. Our lean operating structure positions us to add production capacity as needed at low to moderate incremental capital expense by optimizing equipment utilization.
Capitalizing on the benefits of being an independent entity. We believe that being a separately traded public company will enable us to be a more focused business with the ability to target our investment and research initiatives solely on semiconductor wafers. We expect our independence will also allow us to align the interests and incentives of our employees exclusively with the success of our business and better position us for further consolidation in the industry.
4
Table of Contents
Structure and Formation of Our Company
Overview
Prior to the completion of this offering, SunEdison Semiconductor, Inc. is a wholly-owned subsidiary of SunEdison. Prior to or simultaneously with the completion of this offering, we and SunEdison will engage in a series of transactions, which are designed to transfer the ownership of the semiconductor materials business as currently operated by SunEdison to us, facilitate this offering and enable us to raise necessary capital to repay our existing indebtedness, including intercompany indebtedness owed to SunEdison. For ease of reference, we collectively refer to these transactions as summarized below throughout this prospectus as the Transactions:
| • | SSI was formed under Delaware law as a direct wholly owned subsidiary of SunEdison on August 28, 2013. |
| • | SunEdison will contribute all of the outstanding capital stock of its subsidiaries that own and operate its semiconductor materials business and all of the assets used in its semiconductor materials business and held by SunEdison to SSI in exchange for shares of its common stock and a cash payment of $ million. |
| • | Proceeds from the sale of shares of common stock of SSI in this offering together with $ million of borrowings under a new senior secured term loan from financial institutions, or, collectively, the Financing Transactions, will be used to fund the cash payment referenced in the preceding bullet point. |
| • | All outstanding intercompany balances and indebtedness between us and SunEdison will be settled. |
| • | We will use approximately $ million of the net proceeds of the Financing Transactions to repay existing third party indebtedness that we associate with the semiconductor materials business and retain approximately $ million as cash on our balance sheet. |
| • | We will enter into a new revolving credit facility with financial institutions that will provide for up to $ million of borrowings for working capital purposes. |
| • | We will enter into supply, transition services, intellectual property licensing, tax sharing and other commercial agreements with SunEdison and certain of its subsidiaries. See “Certain Relationships and Related Party Transactions.” |
Upon completion of the Transactions and this offering, purchasers of our common stock in this offering will own common stock representing % of our outstanding common stock (or % if the underwriters’ over-allotment option is exercised in full) and SunEdison will own common stock representing % of our outstanding common stock (or % if the underwriters’ over-allotment option is exercised in full).
5
Table of Contents
Sources and Uses of Funds
The following table illustrates the estimated sources and uses of the funds necessary to complete the Transactions, assuming they were completed as of June 30, 2013. Actual amounts may vary from estimated amounts.
| Sources of Funds |
Uses of Funds |
|||||||||
| (in millions) | ||||||||||
| New senior credit facility: (1) |
||||||||||
| Revolving credit facility |
$ | — | Cash payment to SunEdison |
$ | ||||||
| Term loan |
Repayment of subsidiary bank indebtedness |
|||||||||
| Common stock offered hereby (2) |
||||||||||
| Cash to balance sheet (3) |
||||||||||
| Estimated fees and expenses (4) |
||||||||||
|
|
|
|
|
|||||||
| Total sources |
$ | Total uses |
$ | |||||||
|
|
|
|
|
|||||||
| (1) | In connection with the Financing Transactions, we intend to enter into a new senior credit facility that will include a revolving credit facility for borrowings of up to $ million. We do not expect to have any outstanding borrowings under this revolving credit facility upon completion of this offering. We currently do not have commitments from any prospective lenders with respect to the new senior credit facility but expect to obtain such commitments over the next several months. See “Description of Certain Indebtedness—New Senior Credit Facility.” |
| (2) | Assumes an initial public offering price of $ per share of common stock, which is the midpoint of the price range listed on the cover page of the prospectus. |
| (3) | We may use such net proceeds for working capital and other general corporate purposes. See “Use of Proceeds.” |
| (4) | The estimated fees and expenses include underwriting discounts and commissions and our estimated legal, accounting and other expenses associated with the Transactions. |
Risk Factors
There are a number of risks that you should understand before making an investment decision regarding this offering. These risks are discussed more fully in the section entitled “Risk Factors” following this prospectus summary. These risks include, but are not limited to:
| • | our business depends on the semiconductor device industry, and when that industry experiences one of its cyclical downturns, our sales are likely to decrease and we could be forced to reduce our prices without being able to reduce costs, including fixed costs, all of which could materially adversely affect our business, financial condition and results of operations; |
| • | if we fail to meet changing customer demands or achieve market acceptance for new products, we may lose customers and our sales could suffer; |
| • | a significant reduction in, or loss of, purchases by any of our top customers could materially adversely affect our business, financial condition and results of operations; |
| • | semiconductor wafer prices have been volatile in recent years. If we are unable to reduce our manufacturing costs and operating expenses in response to declining prices, we may not be able to compete effectively; |
6
Table of Contents
| • | we face intense competition in the industry in which we operate, including from competitors that have a greater market share than we do, which could materially adversely affect our business, financial condition and results of operations; and |
| • | we are controlled by SunEdison, whose interests may conflict with yours, and this concentrated ownership of our common stock will prevent you and other stockholders from influencing significant decisions. |
Corporate Information
Our principal executive offices are located at 501 Pearl Drive (City of O’Fallon), St. Peters, Missouri 63376, and our telephone number at that address is (636) 474-5000.
7
Table of Contents
The Offering
| Common stock offered by us |
shares. | |||
| Common stock to be held by SunEdison immediately after this offering |
shares. | |||
| Common stock to be outstanding immediately after this offering |
shares. | |||
| Option to purchase additional shares |
We have agreed to allow the underwriters to purchase up to an additional shares of common stock from us, at the public offering price, less the underwriting discount, within 30 days of the date of this prospectus. | |||
| Use of proceeds |
We estimate that the net proceeds from this offering to us will be approximately $ million, assuming an initial public offering price of $ per share of common stock, which is the midpoint of the price range listed on the cover page of this prospectus, after deducting underwriting discounts and commissions and estimated offering expenses payable by us. We expect to use the net proceeds from this offering for the following purposes and in the following amounts:
• approximately $ million will be used to provide a portion of the consideration paid to SunEdison in connection with its contribution to SSI of the semiconductor materials business;
• approximately $ million will be used to repay existing third party indebtedness relating to the semiconductor materials business; and
• approximately $ million will be available for general corporate purposes. | |||
| Dividend policy |
We do not currently anticipate declaring or paying any cash dividends on our common stock for the foreseeable future. Any future determination relating to our dividend policy will be made at the discretion of our board of directors and will depend on then existing conditions, including our financial condition, results of operations, contractual restrictions (including in the agreements governing our credit facilities), capital requirements, business prospects and other factors our board of directors may deem relevant. See “Dividend Policy.” | |||
| Proposed listing symbol |
We intend to list our common stock on under the symbol “WFR.” | |||
8
Table of Contents
Unless otherwise indicated, all information in this prospectus relating to the number of shares of common stock to be outstanding immediately after this offering:
| • | assumes no exercise by the underwriters of their option to purchase up to additional shares of common stock from us; |
| • | excludes an aggregate of shares of our common stock reserved for issuance under the equity incentive plan we intend to adopt in connection with this offering; and |
| • | assumes an initial public offering price of $ per share of common stock, which is the midpoint of the price range listed on the cover of this prospectus. |
9
Table of Contents
SUMMARY HISTORICAL AND PRO FORMA FINANCIAL DATA
The following table shows summary historical and pro forma financial data at the dates and for the periods indicated. The summary historical statement of operations data and balance sheet data as of and for the years ended December 31, 2012 and 2011 have been derived from our audited combined financial statements included elsewhere in this prospectus. The summary historical statement of operations data and balance sheet data as of and for the six months ended June 30, 2013 and for the six months ended June 30, 2012 were derived from our unaudited combined financial statements included elsewhere in this prospectus, which include all adjustments, consisting of normal recurring adjustments, which management considers necessary for a fair presentation of the financial position and the results of operations for such periods. Results for the interim periods are not necessarily indicative of the results for the full year. The historical financial statements as of and for the years ended December 31, 2012 and 2011, as of and for the six months ended June 30, 2013 and for the six months ended June 30, 2012 are intended to represent the financial results of SunEdison’s semiconductor materials business that will be contributed to us as part of the Transactions for those periods.
The summary unaudited pro forma financial data have been derived by the application of pro forma adjustments to our historical combined financial statements included elsewhere in this prospectus. The summary unaudited pro forma statements of operations for the year ended December 31, 2012 and for the six months ended June 30, 2013 give effect to the Transactions (as described under “Prospectus Summary—Structure and Formation of Our Company”), including the completion of this offering and the application of the estimated net proceeds therefrom, as if they had occurred on January 1, 2012. The summary unaudited pro forma as adjusted balance sheet data as of June 30, 2013 give effect to the Transactions, including the completion of this offering and the application of the estimated net proceeds therefrom as if they had occurred on June 30, 2013. See “Unaudited Pro Forma Consolidated Financial Statements” for additional information.
Our historical combined financial statements include expenses of SunEdison that were allocated to us for certain functions, including general corporate expenses related to communications, corporate administration, finance, legal, information technology, human resources, compliance, employee benefits and incentives, operations, research and development and stock compensation. These expenses were allocated in our historical results of operations on the basis of direct usage, where identifiable, with the remainder primarily allocated on the basis of revenue or other related sales metrics, headcount or number of our manufacturing plants. We consider the expense allocation methodology and results to be reasonable for all periods presented. However, these allocations may not necessarily be indicative of the actual expenses we would have incurred as an independent publicly traded company during the periods prior to this offering or of the costs we will incur in the future. No significant restructuring or impairment charges were included in these allocations from SunEdison.
The combined financial statements included in this prospectus may not be indicative of our future performance and do not necessarily reflect what our financial position and results of operations would have been had we operated as a stand-alone public company during the periods presented, including changes that will occur in our operations and capital structure as a result of the Transactions, including this offering. The summary unaudited pro forma financial data are presented for informational purposes only. The pro forma adjustments are based upon available information and certain assumptions that we believe are reasonable. The summary unaudited pro forma financial information does not purport to represent what our results of operations or financial position would have been if we operated as a public company during the periods presented and may not be indicative of our future performance.
The information presented in the following table under the columns identified as “Pro Forma” and the caption “Other Financial Data” is not directly derived from the financial statements.
10
Table of Contents
The following tables should be read together with, and are qualified in their entirety by reference to, the historical combined financial statements and the accompanying notes appearing elsewhere in this prospectus. Among other things, the historical combined financial statements include more detailed information regarding the basis of presentation for the information in the following table. The tables should also be read together with “Unaudited Pro Forma Consolidated Financial Statements,” “Management’s Discussion and Analysis of Financial Condition and Results of Operations” and “Certain Relationships and Related Party Transactions.”
| Fiscal Year Ended December 31, | Six Months Ended June 30, | |||||||||||||||||||||||
| Pro Forma | Pro Forma | |||||||||||||||||||||||
| 2012 | 2012 | 2011 | 2013 | 2013 | 2012 | |||||||||||||||||||
| (unaudited) | (unaudited) | (unaudited) | (unaudited) | |||||||||||||||||||||
| (in millions) | ||||||||||||||||||||||||
| Statement of Operations Data: |
||||||||||||||||||||||||
| Net sales to non-affiliates |
$ | 927.4 | $ | $ | 1,051.3 | $ | 471.3 | $ | $ | 454.5 | ||||||||||||||
| Net sales to affiliates |
6.8 | 147.0 | 5.1 | 3.3 | ||||||||||||||||||||
| Cost of goods sold |
852.4 | 1,023.3 | 422.5 | 425.8 | ||||||||||||||||||||
|
|
|
|
|
|
|
|
|
|
|
|
|
|||||||||||||
| Gross profit |
81.8 | 175.0 | 53.9 | 32.0 | ||||||||||||||||||||
| Operating expenses: |
||||||||||||||||||||||||
| Marketing and administration |
100.7 | 129.9 | 48.4 | 52.2 | ||||||||||||||||||||
| Research and development |
33.4 | 38.2 | 18.7 | 16.1 | ||||||||||||||||||||
| Restructuring (reversals) charges |
(149.6 | ) | 284.5 | (5.5 | ) | — | ||||||||||||||||||
| Gain on receipt of property, plant and equipment |
(31.7 | ) | — | — | — | |||||||||||||||||||
| Long-lived asset impairment charges |
1.5 | 234.7 | — | — | ||||||||||||||||||||
|
|
|
|
|
|
|
|
|
|
|
|
|
|||||||||||||
| Operating income (loss) |
127.5 | (512.3 | ) | (7.7 | ) | (36.3 | ) | |||||||||||||||||
|
|
|
|
|
|
|
|
|
|
|
|
|
|||||||||||||
| Non-operating expenses (income): |
||||||||||||||||||||||||
| Interest expense |
1.0 | 5.9 | 0.3 | 0.5 | ||||||||||||||||||||
| Interest income |
(0.7 | ) | (1.0 | ) | (0.2 | ) | (0.4 | ) | ||||||||||||||||
| Interest (income) expense, net-affiliates |
(2.2 | ) | 1.8 | (0.8 | ) | (0.9 | ) | |||||||||||||||||
| Other, net |
3.1 | (0.8 | ) | (4.1 | ) | 1.4 | ||||||||||||||||||
|
|
|
|
|
|
|
|
|
|
|
|
|
|||||||||||||
| Total non-operating expenses (income) |
1.2 | 5.9 | (4.8 | ) | 0.6 | |||||||||||||||||||
|
|
|
|
|
|
|
|
|
|
|
|
|
|||||||||||||
| Income (loss) before income tax expense |
126.3 | (518.2 | ) | (2.9 | ) | (36.9 | ) | |||||||||||||||||
| Income tax expense |
3.6 | 37.4 | 18.5 | 1.8 | ||||||||||||||||||||
|
|
|
|
|
|
|
|
|
|
|
|
|
|||||||||||||
| Net income (loss) |
122.7 | (555.6 | ) | (21.4 | ) | (38.7 | ) | |||||||||||||||||
| Net (income) loss attributable to noncontrolling interests(1) |
(1.4 | ) | (2.3 | ) | (2.3 | ) | 0.2 | |||||||||||||||||
|
|
|
|
|
|
|
|
|
|
|
|
|
|||||||||||||
| Net income (loss) attributable to SSI |
$ | 121.3 | $ | $ | (557.9 | ) | $ | (23.7 | ) | $ | $ | (38.5 | ) | |||||||||||
|
|
|
|
|
|
|
|
|
|
|
|
|
|||||||||||||
| Basic (loss) income per share(2) |
N/A | $ | N/A | N/A | $ | N/A | ||||||||||||||||||
| Diluted (loss) income per share(2) |
N/A | $ | N/A | N/A | $ | N/A | ||||||||||||||||||
| Other Financial Data: |
||||||||||||||||||||||||
| Adjusted EBITDA(3) (unaudited) |
$ | 74.9 | $ | $ | 170.2 | $ | 53.4 | $ | $ | 27.3 | ||||||||||||||
| As of June 30, 2013 | ||||||||||||||||||||||||
| Actual | Pro Forma As Adjusted |
|||||||||||||||||||||||
| (unaudited) | (unaudited) | |||||||||||||||||||||||
| Balance Sheet Data: |
|
|||||||||||||||||||||||
| Cash and cash equivalents |
|
$ | 55.2 | $ | ||||||||||||||||||||
| Working capital(4) |
|
(29.9 | ) | |||||||||||||||||||||
| Property, plant and equipment, net |
|
736.3 | ||||||||||||||||||||||
| Total assets |
|
1,355.8 | ||||||||||||||||||||||
| Total liabilities |
|
579.4 | ||||||||||||||||||||||
| Total equity |
|
776.4 | ||||||||||||||||||||||
11
Table of Contents
| (1) | Represents the 20% interest held by our partner in our consolidated joint venture in South Korea known as MEMC Korea Company. |
| (2) | The weighted-average number of shares used to compute pro forma basic and diluted earnings per share is million, which represents the number of shares of our common stock outstanding immediately following the completion of the Transactions. |
| (3) | Adjusted EBITDA is a non-GAAP financial measure. This measurement should not be viewed as an alternative to GAAP measures of performance. The presentation of Adjusted EBITDA should not be construed as an inference that our future results will be unaffected by unusual or non-recurring items. |
We define Adjusted EBITDA as earnings before net interest expense, income tax expense, depreciation and amortization, restructuring (reversals) charges, gain on receipt of property, plant and equipment, long-lived asset impairment charges and stock compensation expense. All of the omitted items are either (i) non-cash items or (ii) items that we do not consider in assessing our on-going operating performance. Because it omits non-cash items, we feel that Adjusted EBITDA is less susceptible to variances in actual performance resulting from depreciation, amortization and other non-cash charges and more reflective of other factors that affect our operating performance. Because it omits the other items, we believe Adjusted EBITDA is also more reflective of our on-going operating performance. We believe Adjusted EBITDA is useful to investors in evaluating our operating performance because:
| • | securities analysts and other interested parties use such calculations as a measure of financial performance and debt service capabilities; and |
| • | it is used by our management for internal planning purposes, including aspects of our combined operating budget and capital expenditures. |
Adjusted EBITDA has limitations as an analytical tool, and you should not consider it in isolation or as a substitute for analysis of our results as reported under GAAP. Some of these limitations include:
| • | it does not reflect our cash expenditures, future requirements for capital expenditures or contractual commitments; |
| • | it does not reflect changes in, or cash requirements for, working capital; |
| • | it does not reflect significant interest expense or the cash requirements necessary to service interest or principal payments on our outstanding debt; |
| • | it does not reflect payments made or future requirements for income taxes; |
| • | it adjusts for restructuring (reversals) charges, gains on receipt of property, plant equipment, asset impairment charges and stock compensation expense factors that we do not consider indicative of future performance; |
| • | although it reflects adjustments for factors that we do not consider indicative of future performance, we may, in the future, incur expenses similar to the adjustments reflected in our calculation of Adjusted EBITDA in this prospectus; and |
| • | although depreciation and amortization are non-cash charges, the assets being depreciated and amortized will often have to be replaced in the future and Adjusted EBITDA does not reflect cash requirements for such replacements. |
12
Table of Contents
Investors are encouraged to evaluate each adjustment and the reasons we consider it appropriate for supplemental analysis. The following table presents a reconciliation from net income (loss) attributable to SSI to Adjusted EBITDA:
| Fiscal Year Ended December 31, | Six Months Ended June 30, | |||||||||||||||||||||||
| Pro Forma | Pro Forma | |||||||||||||||||||||||
| 2012 | 2012 | 2011 | 2013 | 2013 | 2012 | |||||||||||||||||||
| (unaudited) | (unaudited) | (unaudited) | (unaudited) | (unaudited) | (unaudited) | |||||||||||||||||||
| (in millions) | ||||||||||||||||||||||||
| Net income (loss) attributable to SSI |
$ | 121.3 | $ | $ | (557.9 | ) | $ | (23.7 | ) | $ | $ | (38.5 | ) | |||||||||||
| Add: |
||||||||||||||||||||||||
| Interest expense, net |
(1.9 | ) | 6.7 | (0.7 | ) | (0.8 | ) | |||||||||||||||||
| Income tax expense |
3.6 | 37.4 | 18.5 | 1.8 | ||||||||||||||||||||
| Depreciation and amortization |
118.7 | 144.3 | 58.3 | 59.0 | ||||||||||||||||||||
| Restructuring (reversals) charges |
(149.6 | ) | 284.5 | (5.5 | ) | — | ||||||||||||||||||
| Gain on receipt of property, plant and equipment |
(31.7 | ) | — | — | — | |||||||||||||||||||
| Long-lived asset impairment charges |
1.5 | 234.7 | — | — | ||||||||||||||||||||
| Stock compensation expense |
13.0 | 20.5 | 6.5 | 5.8 | ||||||||||||||||||||
|
|
|
|
|
|
|
|
|
|
|
|
|
|||||||||||||
| Adjusted EBITDA |
$ | 74.9 | $ | $ | 170.2 | $ | 53.4 | $ | $ | 27.3 | ||||||||||||||
|
|
|
|
|
|
|
|
|
|
|
|
|
|||||||||||||
| (4) | Working capital is defined as our current assets minus current liabilities. As of June 30, 2013, our current assets included accounts receivable due from SunEdison of $19.4 million and our current liabilities included accounts payable to SunEdison of $111.9 million. All of these intercompany balances will be settled in connection with the Transactions. Excluding these amounts, our working capital would have been $62.6 million as of June 30, 2013. |
13
Table of Contents
This offering and an investment in our common stock involve a high degree of risk. You should carefully consider the risks described below, together with the financial and other information contained in this prospectus, before you decide to purchase shares of our common stock. If any of the following risks actually occurs, our business, financial condition, results of operations and prospects could be materially and adversely affected. As a result, the trading price of our common stock could decline and you could lose all or part of your investment in our common stock.
Risks Related to Our Business
Our business depends on the semiconductor device industry, and when that industry experiences one of its cyclical downturns, our sales are likely to decrease and we could be forced to reduce our prices without being able to reduce costs, including fixed costs, all of which could materially adversely affect our business, financial condition and results of operations.
Our business depends in large part upon the market demand for our customers’ semiconductor devices that are utilized in electronics applications. The semiconductor device industry is subject to cyclical and volatile fluctuations in supply and demand and in the past has periodically experienced significant downturns. These downturns often occur in connection with declines in general economic conditions. For example, in the second half of 2011, demand for wafers for semiconductor applications began to slow and dropped by approximately 15% in the fourth quarter of 2011 as compared to the third quarter of 2011, according to SEMI Silicon Manufacturers Group. Similarly, although demand stabilized during the first half of 2012, it dropped again during the second half of 2012. If the current market softness continues or the semiconductor device industry continues to experience frequent downturns, we will face pressure to reduce our prices, and we may need to further rationalize capacity and attempt to reduce our fixed costs. If we are unable to reduce our costs sufficiently to offset reductions in prices and sales volumes, our business, financial condition and results of operations will be materially adversely affected.
If we fail to meet changing customer demands or achieve market acceptance for new products, we may lose customers and our sales could suffer.
The industry in which we operate changes rapidly. Changes in our customers’ requirements means that we must adapt to new and more demanding technologies, product specifications and sizes, as well as manufacturing processes. Our ability to remain competitive depends upon our ability to continue to differentiate our products based on size, flatness, reduced defects, crystal properties and electrical characteristics and develop technologically advanced products and processes. Although we expect to continue to make significant investments in R&D, we cannot assure you that we will be able to successfully introduce, market and cost-effectively manufacture new products, or that we will be able to develop new or enhanced products and processes that satisfy our customers’ needs. If we are unable to adapt to changing customer demands, or if new products that we develop do not achieve market acceptance, our business, financial condition and results of operations will be materially adversely affected.
A significant reduction in, or loss of, purchases by any of our top customers could materially adversely affect our business, financial condition and results of operations.
Three customers accounted for approximately 20%, 13% and 11%, respectively, of our net sales to non-affiliates in 2012 and our top 10 customers accounted for 68% of our net sales to non-affiliates in 2012. Sales to our customers are generally governed by purchase orders or, in certain cases, short-term agreements that include pricing terms and estimated quantity requirements. We do not generally have long-term agreements with our customers, nor are our customers obligated to purchase a minimum quantity of wafers from us. We are
14
Table of Contents
exposed to the risk of reduced sales if our customers reduce their demand for our products, including as a result of cyclical fluctuations or competitive factors. Our business, financial condition and results of operations could materially suffer if we experience a significant reduction in, or loss of, purchases by any of our top customers.
Semiconductor wafer average selling prices have been volatile in recent years. If we are unable to reduce our manufacturing costs and operating expenses in response to declining prices, we may not be able to compete effectively.
Semiconductor wafer average selling prices have been volatile in recent years. Our semiconductor wafer average selling prices increased by 5.3% in 2011 as compared to our average selling prices in 2010 primarily due to the effects of the earthquake and tsunami in Japan, while our average selling prices decreased by approximately 10.1% in 2012 as compared to prices in 2011. In addition, consolidation within the semiconductor industry has also increased the pricing power of our customers over time, resulting in downward pressure on wafer average selling prices. When average selling prices decline, our net sales and gross profit also decline unless we are able to reduce the cost to manufacture our products or sell more products. As a result, the success of our business depends, in part, on our continuous reduction of manufacturing costs and leveraging of operating expenses to maintain or improve profitability, particularly during times of declining prices. If we are not able to reduce our manufacturing costs and leverage our operating expenses sufficiently to offset any future price erosion, or if we are unable to offset price erosion by increasing our sales and expanding our market share, our business, financial condition and results of operations could be materially adversely affected.
We face intense competition in the industry in which we operate, including from competitors that have a greater market share than we do, which could materially adversely affect our business, financial condition and results of operations.
We face intense competition in the semiconductor wafer industry from established manufacturers throughout the world, including Shin-Etsu Handotai, SUMCO Corporation, Siltronic AG and LG Siltron. Some of our competitors have greater financial, technical, engineering and manufacturing resources than we do, enabling them to develop products that currently, and may in the future, compete favorably against our products in terms of design, quality and performance. Our larger competitors may also be able to produce wafers at a lower per unit cost due to economies of scale and have greater influence than we do on market prices. In addition, certain of our competitors may have a perceived advantage in the market with respect to the quality of their products. We expect that all of our competitors will continue to improve the design and performance of their products and introduce new products with competitive price and performance characteristics. Our failure to compete effectively would have a material adverse effect on our business, financial condition and results of operations.
Our manufacturing processes are highly complex and potentially vulnerable to impurities, disruptions or inefficient implementation of production changes that can significantly increase our costs and delay product shipments to our customers.
Our manufacturing processes are highly complex, require advanced and increasingly costly equipment and are continuously being modified or maintained in an effort to improve yields and product performance. Impurities or other difficulties in the manufacturing process can lower yields, interrupt production, result in losses of products in process and harm our reputation. In addition, as system complexity and production changes have increased, manufacturing tolerances have been reduced and requirements for precision have become even more demanding. We have from time to time experienced bottlenecks and production difficulties that have caused delivery delays and quality control problems. We cannot assure you that we will not experience bottlenecks or production or transition difficulties in the future. Such incidents, if they occur, could have a material adverse effect on our business, financial condition and results of operations.
15
Table of Contents
If we are not able to match our manufacturing capacity and output to demand for our products, our business, financial condition and results of operations could be materially adversely affected.
As a result of the cyclicality and volatility of the semiconductor industry, it is difficult to predict future developments in the markets we serve, making it difficult to estimate future requirements for manufacturing capacity. During periods of high demand for our products, we may experience a shortage of capacity and an increase in lead times for delivery of our products to our customers, or an inability to deliver the required number of products. When our manufacturing facilities are operating at high capacity, we may also experience disruptions, problems or inefficiencies in our manufacturing processes due to over utilization, potentially resulting in loss of sales and damage to relationships with customers. In addition, increases in our manufacturing capacity based on anticipated growth in demand for our products may exceed demand requirements, leading to overcapacity and excessive fixed costs. Lower than expected demand for our products may also lead to excessive inventory, which could result in write-offs of inventory and losses on products. In the past, overcapacity for certain products or technologies and cost optimization have led us to close or shutter manufacturing facilities and, as a result, to incur impairment and restructuring charges and other related closure costs. For example, we implemented a restructuring and cost reduction plan in 2011, which included shuttering our Merano, Italy polysilicon facility in December 2011, and incurred restructuring charges of $284.5 million and long-lived asset impairment charges of $234.7 million in 2011 primarily related thereto. Any of these outcomes could have a material adverse effect on our business, financial condition or results of operations.
Because our customers generally require that they qualify a facility before we can begin manufacturing products for them at that facility, we may not be able to quickly transfer production of specific products from one of our manufacturing facilities to another in the event of an interruption or lack of capacity at any of our facilities, which could result in lost sales and damage to customer relationships.
It typically takes three to six months for our customers to qualify one of our manufacturing facilities to produce a specific product, but it can take up to one year depending upon a customer’s requirements. While in many cases multiple sites are qualified for a particular product to allow flexibility, an interruption of operations or lack of available capacity at any of our manufacturing facilities could result in delays in or cancellations of shipments of products in the event only one facility is qualified to manufacture such products. A number of factors could cause interruptions or lack of capacity at a facility, including extreme weather conditions, such as hurricanes or earthquakes, equipment and power failures, shortages of raw materials or supplies or transportation logistic complications. We have had interruptions of our manufacturing operations for some of these reasons in the past and could have such interruptions again in the future. For example, production at our Japanese facility was disrupted as a result of the March 2011 earthquake and tsunami. If we experience an interruption or lack of capacity at any of our manufacturing facilities for any reason, it could result in lost sales and damage to customer relationships, which could materially and adversely affect our business, financial condition and results of operations.
Our business may be harmed if we fail to properly protect our intellectual property or infringe on the intellectual property rights of third parties.
We believe that the success of our business depends in part on our proprietary technology, information, processes and know-how and on our ability to operate without infringing on the proprietary rights of third parties. We seek to protect our intellectual property rights based on trade secrets and patents as part of our ongoing R&D and manufacturing activities. We cannot be certain, however, that we have adequately protected or will be able to adequately protect our technology, that our competitors will not be able to utilize our existing technology or develop similar technology independently, that the claims allowed with respect to any patents held by us will be broad enough to protect our technology or that foreign intellectual property laws will adequately protect our intellectual property rights.
16
Table of Contents
Any future litigation to enforce patents issued to us, to protect trade secrets or know-how possessed by us or to defend ourselves or to indemnify others against claimed infringement of the rights of others could have a material adverse effect on our business, financial condition and results of operations. From time to time, we receive notices from other companies that allege we may be infringing certain of their patents or other rights. If we are unable to resolve these matters satisfactorily, or to obtain licenses on acceptable terms, we may face litigation. We are presently involved in one case involving allegations of patent infringement by us. See “Business—Legal Proceedings.” Regardless of the validity or successful outcome of that intellectual property claim or any future claims, we may need to expend significant time and expense to protect our intellectual property rights or to defend against claims of infringement by third parties. If we lose any such litigation where we are alleged to infringe the rights of others, we may be required to pay substantial damages, seek licenses from others, or change or stop manufacturing or selling some of our products. Any of these outcomes could have a material adverse effect on our business, financial condition and results of operations.
From time to time, we may become involved in other litigation and regulatory proceedings, which could require significant attention from our management and result in significant expense to us and disruptions in our business.
In addition to litigation related to our intellectual property rights, we have in the past and may in the future be named as a defendant from time to time in other lawsuits and regulatory actions relating to our business, such as commercial contract claims, employment claims and tax examinations, some of which may claim significant damages or cause us reputational harm. Due to the inherent uncertainties of litigation and regulatory proceedings, we cannot accurately predict the ultimate outcome of any such proceeding. An unfavorable outcome could have a material adverse impact on our business, financial condition and results of operations or limit our ability to engage in certain of our business activities. In addition, regardless of the outcome of any litigation or regulatory proceeding, such proceedings are often expensive, time-consuming, disruptive to normal business operations and require significant attention from our management.
Because we manufacture and sell a substantial portion of our products outside of the United States, we are subject to the risks of doing business internationally, including periodic foreign economic downturns and political instability, which may adversely affect our sales and cost of doing business in those regions of the world.
Foreign economic downturns have affected our results of operations in the past and could affect our results of operations in the future. In addition, other factors relating to the operation of our business outside of the United States may have a material adverse effect on our business, financial condition and results of operations in the future, including:
| • | fluctuations in exchange rates; |
| • | the imposition of governmental controls or changes in government regulations, including tax regulations; |
| • | difficulties in enforcing our intellectual property rights; |
| • | export license requirements; |
| • | restrictions on the export of technology; |
| • | compliance with U.S. and international laws involving international operations, including the Foreign Corrupt Practices Act and export control laws; |
| • | difficulties in achieving headcount reductions due to unionized labor and works councils; |
| • | restrictions on transfers of funds and assets between jurisdictions; |
17
Table of Contents
| • | geo-political instability; and |
| • | trade restrictions, import/export duties and changes in tariffs. |
In the future we may seek to expand our presence in certain foreign markets or enter emerging markets. Evaluating or entering into an emerging market may require considerable management time, as well as start-up expenses for market development before any significant sales and earnings are generated. Operations in new foreign markets may achieve low margins or may be unprofitable, and expansion in existing markets may be affected by local political, economic and market conditions. As we continue to operate our business globally, our success will depend, in part, on our ability to anticipate and effectively manage these and the other risks noted above. The impact of any one or more of these factors could materially adversely affect our business, financial condition and results of operations.
In addition, we currently operate under tax holidays and/or favorable tax incentives and rates in Taiwan and Malaysia. These tax holidays and incentives require us to meet certain minimum employment and investment criteria or thresholds in these jurisdictions. We cannot assure you that we will be able to continue to meet these criteria or thresholds or realize any net tax benefits from these tax holidays or incentives. If any of our tax holidays or incentives are terminated, our business, financial condition and results of operations could be materially adversely effected.
We are subject to periodic fluctuations in foreign currency exchange rates which could cause operating results and reported financial results to vary significantly from period to period.
Net sales to non-affiliates generated from outside of the United States, which represented approximately 85% of our net sales to non-affiliates for the six months ended June 30, 2013 and approximately 84% and 83% of our net sales to non-affiliates for 2012 and 2011, respectively, expose us to currency exchange rate fluctuations. Our risk exposure from these sales is primarily related to the Japanese Yen, New Taiwan Dollar, Euro, Korean Won and Malaysian Ringgit. Because the majority of our sales are denominated in the U.S. dollar, if one or more competitors sells to our customers in a different currency than the U.S. dollar, we are subject to the risk that the competitors’ products will be relatively less expensive than our products due to exchange rate effects. In addition, a substantial portion of manufacturing and operating costs at our non-U.S. facilities are incurred in foreign currencies, principally the Japanese Yen, New Taiwan Dollar, Euro, Korean Won and Malaysian Ringgit. Unfavorable exchange rate fluctuations in any or all of these currencies may adversely affect the cost of our products and/or related operating expenditures.
Our results of operations are also impacted by currency exchange rate fluctuations to the extent that we are unable to match net sales received in foreign currencies with expenses incurred in the same currency. For example, where we have significantly more expenses than net sales generated in a foreign currency, our profit from operations in that location would be adversely affected in the event that the U.S. dollar depreciates against that foreign currency. To protect against reductions in value and volatility of future cash flows caused by changes in foreign currency exchange rates, we have established transaction-based hedging programs. Our hedging programs reduce, but do not always eliminate, the impact of foreign currency exchange rate movements. We recognized net currency income (losses) totaling approximately $4.4 million for the six months ended June 30, 2013 and approximately ($4.2) million and $0.2 million for 2012 and 2011, respectively. Foreign currency exchange risks inherent in doing business in foreign countries could have a material adverse effect on our business, financial condition and results of operations.
In addition, we present our combined financial statements in U.S. dollars. As a result, we must translate the assets, liabilities, net sales and expenses of a substantial portion of our foreign operations into U.S. dollars at applicable exchange rates. Consequently, increases or decreases in the value of the U.S. dollar may affect the value of these items with respect to our non-U.S. dollar businesses in our combined financial statements, even if
18
Table of Contents
their value has not changed in their local currency. These translations could significantly affect the comparability of our results between financial periods or result in significant changes to the carrying value of our assets, liabilities and stockholders’ equity.
Our ability to operate our business effectively could be impaired if we fail to attract and retain key personnel.
Our ability to operate our business and implement our strategies effectively depends, in part, on the efforts of our executive officers and other key employees. Our management team has significant industry experience and would be difficult to replace. These individuals possess sales, marketing, engineering, manufacturing, financial and administrative skills that are critical to the operation of our business. In addition, the market for engineers and other individuals with the required technical expertise to succeed in our business is highly competitive, and we may be unable to attract and retain qualified personnel to replace or succeed key employees should the need arise. The loss of the services of any of our key employees or the failure to attract or retain other qualified personnel could have a material adverse effect on our business, financial condition and results of operations.
We have in the past and may in the future implement initiatives designed to rationalize our use of resources, optimize those resources for the most attractive market opportunities and manage our production capacity to meet demand efficiently. We may fail to realize the full benefits of, and could incur significant costs relating to, any such initiatives, which could materially adversely affect our business, financial condition and results of operations.
We have implemented several initiatives since 2009 designed to rationalize our use of resources, optimize those resources for the most attractive market opportunities and manage our production capacity to meet demand efficiently. During the fourth quarter of 2011, SunEdison committed to a series of actions to reduce its global workforce, right size its production capacity and accelerate operating cost reductions. In connection with that plan, we reduced our workforce by approximately 11% and shuttered our Merano, Italy polysilicon facility. We also implemented cost and workforce reductions and a facility realignment in 2009. As a result of these actions, we incurred restructuring charges of $284.5 million and long-lived asset impairment charges of $234.7 million in 2011. In addition, in 2012, we completed the transfer of certain of our manufacturing operations at our St. Peters, Missouri facility to our facility in Ipoh, Malaysia. We cannot assure you that we will realize the cost savings and productivity improvements we expect as a result of these or any future restructuring and cost improvement initiatives. Future initiatives to transfer or consolidate manufacturing operations could also involve significant start-up or qualification costs for new or repurposed facilities. The failure to realize the full benefits of, or the incurrence of significant costs relating to, restructuring initiatives could materially adversely affect our business, financial condition and results of operations.
Our dependence on single suppliers for polysilicon and other raw materials, equipment and supplies could harm our production output and increase our costs, which could have a material adverse effect on our business, financial condition and results of operations.
Our ability to meet our customers’ demand for our products depends upon obtaining adequate supplies of quality raw materials on a timely basis. We obtain several raw materials, equipment and supplies from sole suppliers. In addition, we obtain our requirements for polysilicon primarily from SunEdison’s Pasadena, Texas facility. In connection with this offering, we will enter into a supply agreement with SunEdison for the continued supply to us of polysilicon, however, that agreement is subject to certain conditions and termination rights. See “Certain Relationships and Related Party Transactions—Supply Agreement.” If for any reason SunEdison is unable to meet our demand for polysilicon, we will be required to seek other suppliers, which could result in manufacturing delays, an increase in our costs relating to obtaining polysilicon or a decrease in our manufacturing throughput or yields. Such an occurrence could have a material adverse effect on our business, financial condition and results of operations.
19
Table of Contents
From time to time we have experienced limited supplies of certain other raw materials, equipment and supplies and may experience shortages in the future. A prolonged inability to manufacture or obtain raw materials, equipment or supplies, or increases in prices resulting from shortages of these materials, could have a material adverse effect on our business, financial condition and results of operations.
Payments required from us under leases and pursuant to minimum purchase obligations could have a material adverse effect on our business, financial condition and results of operations.
We have long-term annual lease obligations for certain facilities and minimum purchase requirements with certain suppliers of precursor raw materials, such as chemicals used in our production processes. In 2012, we made payments of approximately $62.4 million in the aggregate to fulfill minimum purchase and lease obligations. Our failure to satisfy required purchase and lease obligations, or our need to terminate any such contracts as a result of declining market demand or otherwise, could have a material adverse effect on our business, financial condition and results of operations.
Restrictive covenants under our credit facilities may limit our current and future operations, and if we fail to comply with those covenants, the lenders could cause outstanding amounts to become immediately due and payable, and we might not have sufficient funds and assets to pay such loans.
In connection with the Transactions, we expect to enter into a $ million senior secured term loan facility and a $ million revolving credit facility. These facilities contain certain restrictive covenants and conditions, including limitations on our ability to, among other things:
| • | incur additional indebtedness and guarantee indebtedness; |
| • | pay dividends on or make distributions in respect of capital stock or make certain other restricted payments or investments; |
| • | enter into certain agreements that restrict distributions from restricted subsidiaries; |
| • | sell or otherwise dispose of assets, including capital stock of restricted subsidiaries; |
| • | enter into transactions with affiliates; |
| • | create or incur liens; |
| • | merge, consolidate or sell substantially all of our assets; |
| • | make acquisitions or other investments; and |
| • | make certain payments on indebtedness. |
As a result of these covenants, we may be restricted in our ability to pursue new business opportunities or strategies or to respond quickly to changes in the semiconductor industry. A violation of any of these covenants would be deemed an event of default under our credit facilities. In such event, upon the election of the lenders, the loan commitments under our credit facilities would terminate and the loans and accrued interest then outstanding would be due and payable immediately. A default may also result in the acceleration of any other debt to which a cross-acceleration or cross-default provision applies. In the event our lenders accelerate the repayment of our borrowings, we cannot assure you that we and our subsidiaries would have sufficient funds to repay such indebtedness or be able to obtain replacement financing on a timely basis or at all. These events could have a material adverse effect on our business, financial condition and results of operations. We also may need to negotiate changes to the covenants in our credit agreements in the future if there are material changes in our business, operations or financial condition, but we cannot assure you that we will be able to do so on terms favorable to us or at all.
20
Table of Contents
We may not be able to generate sufficient cash to service all of our indebtedness and may be forced to take other actions to satisfy our obligations under our indebtedness, which may not be successful.
Our ability to make scheduled payments on or to refinance our indebtedness, including the credit facilities we expect to enter into in connection with the Transactions, depends on our financial condition and operating performance, which are subject to economic and competitive conditions and other factors beyond our control. We may be unable to maintain a level of cash flows from operating activities sufficient to permit us to fund our day-to-day operations or to pay the principal, premium, if any, and interest on our indebtedness. If our cash flows and capital resources are insufficient to fund our debt service obligations, we could face substantial liquidity problems and could be forced to reduce or delay investments and capital expenditures or to sell assets or operations, seek additional capital or restructure or refinance our indebtedness. If we cannot make scheduled payments on our debt, we will be in default and, as a result, the lenders under our credit facilities or other indebtedness could terminate their commitments to loan money, or foreclose against the assets securing such borrowings, and we could be forced into bankruptcy or liquidation, in each case, which would have a material adverse effect on our business, financial condition and results of operations.
We are subject to numerous environmental laws and regulations, which could require us to incur environmental liabilities, increase our manufacturing and related compliance costs or otherwise adversely affect our business.
We are subject to a variety of federal, state, local and foreign laws and regulations governing the protection of the environment. These environmental laws and regulations include those relating to the use, storage, handling, discharge, emission, disposal and reporting of toxic, volatile or otherwise hazardous materials used in our manufacturing processes. These materials may have been or could be released into the environment at properties currently or previously owned or operated by us, at other locations during the transport of the materials or at properties to which we send substances for treatment or disposal. If we were to violate or become liable under environmental laws and regulations or become non-compliant with permits required at some of our facilities, we could be held financially responsible and incur substantial costs, including cleanup costs, fines and civil or criminal sanctions, third-party property damage or personal injury claims.
Groundwater and/or soil contamination has been detected at our facilities in St. Peters, Missouri and Merano, Italy, and we previously had contamination at two other facilities which has now been remediated. We believe we are taking all necessary remedial steps at the two facilities where contamination still exists and continue to monitor the other two facilities. We do not expect the costs of the ongoing monitoring at these sites to be material. In addition, if we decide to close a facility in the future, we could be subject to additional costs related to cleanup and/or remediation at that site in connection with closing the facility. As of June 30, 2013, we believe we have established adequate liabilities relating to ongoing remediation activities and relating to cleanup and remediation measures that would need to be undertaken at our Merano, Italy polysilicon facility in the event we determined to permanently close that facility. Environmental issues relating to presently known or unknown matters could require additional investigation, assessment or expenditures. In addition, new laws and regulations or stricter enforcement of existing laws and regulations could give rise to additional compliance costs and liabilities.
Labor disruptions could materially and adversely affect our business, financial condition and results of operations.
As of June 30, 2013, we had approximately 4,280 employees, approximately 1,400 of whom were unionized at our manufacturing facilities in St. Peters, Missouri; Merano, Italy; Novara, Italy; Utsunomiya, Japan; and Chonan, South Korea. In various countries, local law also requires our participation in works councils. While we have not experienced any material work stoppages at any of our facilities due to labor union activities in recent years, any stoppage or slowdown at any of these facilities could cause material interruptions in manufacturing, and we cannot be certain that alternate qualified capacity would be available on a timely basis or
21
Table of Contents
at all. As a result, labor disruptions at any of our facilities could materially and adversely affect our business, financial condition and results of operations.
We may incur unexpected product performance claims that could materially and adversely affect our business, financial condition and results of operations.
Product performance claims against us relating to defective products could cause us to incur significant repair or replacement expense. In addition, quality issues can have various other ramifications, including delays in the recognition of net sales, loss of net sales, loss of future sales opportunities, increased costs associated with repairing or replacing products, and a negative impact on our reputation, all of which could materially and adversely affect our business, financial condition and results of operations.
Future acquisitions may present integration challenges, and if the goodwill, indefinite-lived intangible assets and other long-term assets recorded in connection with such acquisitions become impaired, we would be required to record impairment charges, which may be significant.
If we find appropriate opportunities in the future, we may acquire businesses, products or technologies that we believe are strategic. If we acquire a business, product or technology, the process of integration may produce unforeseen operating difficulties and expenditures, fail to result in expected synergies or other benefits and absorb significant attention of our management that would otherwise be available for the ongoing development of our business.
In the event of any future acquisitions, we may record a portion of the assets we acquire as goodwill, other indefinite-lived intangible assets or finite-lived intangible assets. We do not amortize goodwill and indefinite-lived intangible assets, but rather review them for impairment on an annual basis or whenever events or changes in circumstances indicate that their carrying value may not be recoverable. The recoverability of these assets is dependent on our ability to generate sufficient future earnings and cash flows. Changes in estimates, circumstances or conditions, resulting from both internal and external factors, could have a significant impact on our fair valuation determination, which could then result in a material impairment charge negatively affecting our results of operations.
Risks Related to Our Separation from and Our Relationship with SunEdison
We are controlled by SunEdison, whose interests may conflict with yours, and this concentrated ownership of our common stock will prevent you and other stockholders from influencing significant decisions.
Immediately following the completion of this offering, SunEdison will own shares, or %, of our outstanding common stock (or % if the underwriters exercise in full their option to purchase additional shares). Accordingly, SunEdison will continue to exercise significant influence over our business policies and affairs, including the composition of our board of directors and any action requiring the approval of our stockholders, including the adoption of amendments to our certificate of incorporation, the issuance of additional shares of equity securities, the payment of dividends and the approval of mergers or a sale of substantially all of our assets. The concentration of ownership may also make some transactions, including mergers or other changes in control, more difficult or impossible without the support of SunEdison. SunEdison’s interests may conflict with your interests as a stockholder. For additional information about our relationships with SunEdison, you should read the information in “Certain Relationships and Related Party Transactions.”
Conflicts of interest between SunEdison and us could be resolved in a manner unfavorable to us.
Various conflicts of interest between SunEdison and us could arise. Many of our officers own stock in SunEdison, which in some cases may currently be more than the amount of our common stock they own. In addition, upon the completion of this offering, of our directors will be an officer or director of SunEdison.
22
Table of Contents
Ownership interests of officers or directors of SunEdison in our common stock, or a person’s service as either an officer or director of both companies, could create or appear to create potential conflicts of interest when those officers or directors are faced with decisions that could have different implications for SunEdison and us. These decisions could, for example, relate to:
| • | corporate opportunities; |
| • | our financing and dividend policy; |
| • | compensation and benefit programs and other human resources policy decisions; |
| • | termination of, changes to or determinations under our agreements with SunEdison entered into in connection with the Transactions; and |
| • | determinations with respect to our tax returns. |
Potential conflicts of interest could also arise if we enter into any new commercial arrangements with SunEdison in the future. Our directors and officers who have interests in both SunEdison and us may also face conflicts of interest with regard to the allocation of their time between SunEdison and us.
We have no recent operating history as an independent company upon which you can evaluate our performance and, accordingly, our prospects must be considered in light of the risks that any newly independent company encounters.
Following the acquisition of SunEdison LLC in November 2009, we have operated as a business segment of SunEdison. Accordingly, we have no recent experience operating as an independent company and performing various corporate functions independent of SunEdison, including human resources, tax administration, legal, treasury administration, investor relations, business development, internal audit, insurance, information technology and telecommunications services, as well as the accounting for many items such as equity compensation, income taxes, derivatives and pensions. Our prospects must be considered in light of the risks, expenses and difficulties encountered by companies in the early stages of independent business operations, particularly companies such as ours in highly competitive markets.
Our historical combined financial statements may not be necessarily representative of the results we would have achieved as a stand-alone company and may not be a reliable indicator of our future results.
Our historical combined financial statements and unaudited pro forma consolidated financial data included elsewhere in this prospectus have been created from SunEdison’s financial statements using our historical results of operations and bases of assets and liabilities as a business segment of SunEdison. In connection with the preparation of the historical combined financial statements and unaudited pro forma consolidated financial data, we made certain estimates, assumptions and allocations based on current facts, historical experience and various other factors. While we believe that these estimates, assumptions and allocations are reasonable under the circumstances, they are subject to significant uncertainties. This is primarily the result of the following factors:
| • | our historical combined financial statements reflect expense allocations for certain support functions that are provided on a centralized basis within SunEdison, such as expenses for business technology, facilities, legal, finance, human resources, investor relations, business development, public affairs and procurement, as well as certain manufacturing and supply costs incurred by manufacturing sites that are shared with other SunEdison business units that may be higher or lower than the comparable expenses we would have actually incurred, or will incur in the future, as a stand-alone company; |
23
Table of Contents
| • | our cost of debt and our capital structure will be different from that reflected in our historical combined financial statements; |
| • | increases will occur in our cost structure as a result of being a stand-alone public company, including costs related to public company reporting, investor relations and compliance with the Sarbanes-Oxley Act of 2002, or the Sarbanes-Oxley Act; and |
| • | our effective income tax rate as reflected in our historical financial information also may not be indicative of our future effective income tax rate. |
Accordingly, the historical and pro forma financial information included elsewhere in this prospectus may not necessarily reflect the financial condition, results of operations or cash flows we would have achieved as a stand-alone company during the periods presented or that we will achieve in the future.
Our failure to achieve and maintain effective internal control over financial reporting in accordance with Section 404 of the Sarbanes-Oxley Act as a stand-alone company could have a material adverse effect on our business and stock price.
Prior to the acquisition of SunEdison LLC in 2009, we were required to maintain internal control over financial reporting in a manner that met the standards of publicly traded companies as required by Section 404(a) of the Sarbanes-Oxley Act. However, since that time, we have not operated as a stand-alone public company and have not had to independently comply with Section 404(a) of the Sarbanes-Oxley Act. We anticipate being required to meet these standards in the course of preparing our combined financial statements as of and for the year ended December 31, 2014, and our management will be required to report on the effectiveness of our internal control over financial reporting for such year. Additionally, once we are no longer an emerging growth company, as defined by the Jumpstart Our Business Startups Act, or the JOBS Act, our independent registered public accounting firm will be required pursuant to Section 404(b) of the Sarbanes-Oxley Act to attest to the effectiveness of our internal control over financial reporting on an annual basis. The rules governing the standards that must be met for our management to assess our internal control over financial reporting are complex and require significant documentation, testing and possible remediation.
Internal control over financial reporting is a process designed to provide reasonable assurance regarding the reliability of financial reporting and the preparation of financial statements in accordance with generally accepted accounting principles. We are currently in the process of reviewing, documenting and testing our internal control over financial reporting, but we are not currently in compliance with, and we cannot be certain when we will be able to implement the requirements of Section 404(a). We may encounter problems or delays in implementing any changes necessary to make a favorable assessment of our internal control over financial reporting. In addition, we may encounter problems or delays in completing the implementation of any requested improvements and receiving a favorable attestation in connection with the attestation to be provided by our independent registered public accounting firm after we cease to be an emerging growth company. If we cannot favorably assess the effectiveness of our internal control over financial reporting, or if our independent registered public accounting firm is unable to provide an unqualified attestation report on our internal controls after we cease to be an emerging growth company, investors could lose confidence in our financial information and the price of our common stock could decline.
Additionally, the existence of any material weakness or significant deficiency would require management to devote significant time and incur significant expense to remediate any such material weaknesses or significant deficiencies and management may not be able to remediate any such material weaknesses or significant deficiencies in a timely manner. The existence of any material weakness in our internal control over financial reporting could also result in errors in our financial statements that could require us to restate our
24
Table of Contents
financial statements, cause us to fail to meet our reporting obligations and cause stockholders to lose confidence in our reported financial information, all of which could materially and adversely affect our business and stock price.
We may not achieve some or all of the expected benefits of the Transactions.
We may not be able to achieve the full strategic and financial benefits expected to result from the Transactions, or such benefits may be delayed. These expected benefits include, but are not limited to, the following:
| • | improving strategic and operational flexibility and increasing management focus on our business; |
| • | allowing us to adopt the capital structure and investment policy best suited to our financial profile and business needs; and |
| • | improving the alignment of management and employee incentives with performance and growth objectives of our business. |
If we are unable to achieve the strategic and financial benefits expected to result from the Transactions, our business, financial condition and results of operations could be materially adversely affected.
Future sales or distributions of our shares by SunEdison could depress our common stock price.
After this offering, and subject to the lock-up period described below, SunEdison may sell all or a portion of the shares of our common stock that it owns or distribute those shares to its stockholders. Sales by SunEdison in the public market or distributions to its stockholders of substantial amounts of our common stock, or the filing by SunEdison of a registration statement relating to a substantial amount of our common stock, could depress the price of our common stock. SunEdison has informed us that, at some time in the future, but no earlier than the expiration of the lock-up period, it may sell all or a portion of its ownership interest in us. SunEdison is not subject to any contractual obligation to maintain its ownership position in our shares, except that it has agreed not to sell or otherwise dispose of any of our shares of common stock for a period ending 180 days after the date of the final prospectus without the prior written consent of Deutsche Bank Securities Inc. and Goldman, Sachs & Co., on behalf of the underwriters, subject to specified limited exceptions and extensions described in “Underwriting.” Consequently, SunEdison may decide not to maintain its ownership of our common stock once the lock-up period expires.
In addition, SunEdison will have the right, subject to some conditions, to require us to file registration statements covering its shares or to include its shares in other registration statements that we may file. See “Certain Relationships and Related Party Transactions—Registration Rights Agreement.” By exercising their registration rights or selling a large number of shares, SunEdison could cause the price of our common stock to decline.
If SunEdison sells a controlling interest in our company to a third party in a private transaction, you may not realize any change-of-control premium on shares of our common stock and we may become subject to the control of a presently unknown third party.
Following this offering, SunEdison will have the ability, should it choose to do so, to sell some or all of its shares of our common stock in a privately negotiated transaction, which, if sufficient in size, could result in a change of control of our company. The ability of SunEdison to privately sell its shares of our common stock, with no requirement for a concurrent offer to be made to acquire all of the shares of our common stock that will be publicly traded hereafter, could prevent you from realizing any change-of-control premium on your shares of our common stock that may otherwise accrue to SunEdison on its private sale of our common stock.
25
Table of Contents
Additionally, if SunEdison privately sells its significant equity interest in our company, we may become subject to the control of a presently unknown third party. Such third party may have conflicts of interest with those of other stockholders. In addition, if SunEdison sells a controlling interest in our company to a third party, our indebtedness may be subject to acceleration and our commercial agreements and relationships could be impacted, all of which may adversely affect our ability to run our business as described herein and may have a material adverse effect on our business, financial condition and results of operations.
SunEdison will provide a number of services to us pursuant to a transition services agreement. When such agreement terminates, we will be required to replace the services, and the economic terms of the new arrangements may be less favorable to us.
Under the terms of a transition services agreement that we will enter into with SunEdison in connection with the Transactions, SunEdison will provide us, for a fee, specified support services related to corporate functions such as risk management, communications, corporate administration, finance, accounting, audit, legal, information technology, human resources, compliance, employee benefits and stock compensation administration for an initial term of one to two years following the Transactions, unless earlier terminated or extended according to the terms of the agreement. When the transition services agreement terminates, we will be required to either enter into a new agreement with SunEdison or another services provider or assume the responsibility for these functions ourselves. At such time, the economic terms of the new arrangements may be less favorable than the arrangement with SunEdison under the transition services agreement, which may have a material adverse effect on our business, financial condition and results of operations.
For a summary of the material terms of the transition services agreement, see “Certain Relationships and Related Party Transactions—Transition Services Agreement.”
SunEdison’s rights as licensor under the intellectual property license agreements we will enter into in connection with the Transactions could limit our ability to develop and commercialize certain products if we fail to comply with our obligations under such agreements.
Under the intellectual property licensing agreements we will enter into in connection with the Transactions, SunEdison will license to us certain of its retained intellectual property rights applicable to manufacturing semiconductor wafers, including certain rights related to continuous Czochralski, or CCZ, diamond wire cutting and fluid bed reactor polysilicon, or FBR, excluding high pressure silane technology. If we fail to comply with our obligations under this license agreement and SunEdison exercises its right to terminate it, our ability to continue to research, develop and commercialize products incorporating that intellectual property will be limited. These termination rights may make it more difficult, time consuming or expensive for us to develop and commercialize certain new products, or may result in our products being later to market than those of our competitors.
For a summary of the material terms of the intellectual property license agreements, see “Certain Relationships and Related Party Transactions—Intellectual Property License Agreements.”
We are dependent on SunEdison to prosecute, maintain and enforce certain intellectual property.
Under the intellectual property license agreements, we expect that SunEdison will be responsible for filing, prosecuting and maintaining patents that SunEdison licenses to us. SunEdison also has the first right, and in some cases the sole right, to enforce such patents. In addition, with respect to the patents that we license to SunEdison, SunEdison will have the sole right to enforce the licensed patents if the enforcement relates to SunEdison’s solar energy business, subject to certain exceptions. If SunEdison fails to fulfill its obligations or chooses to not enforce the licensed patents under these agreements, we may not be able to prevent competitors from making, using and selling competitive products.
26
Table of Contents
Risks Related to this Offering and Ownership of Our Common Stock
An active trading market for our common stock may not develop, and you may not be able to sell your common stock at or above the initial public offering price.
Prior to the completion of this offering, there has been no public market for our common stock. An active trading market for shares of our common stock may never develop or be sustained following this offering. If an active trading market does not develop, you may have difficulty selling your shares of common stock at an attractive price, or at all. The price for our common stock in this offering will be determined by negotiations among SunEdison, us and representatives of the underwriters, and it may not be indicative of prices that will prevail in the open market following this offering. Consequently, you may not be able to sell your common stock at or above the initial public offering price or at any other price or at the time that you would like to sell. An inactive market may also impair our ability to raise capital by selling our common stock, and it may impair our ability to attract and motivate our employees through equity incentive awards.
The price of our common stock may fluctuate substantially.
You should consider an investment in our common stock to be risky, and you should invest in our common stock only if you can withstand a significant loss and wide fluctuations in the market value of your investment. Some factors that may cause the market price of our common stock to fluctuate, in addition to the other risks mentioned in this section of the prospectus, are:
| • | our announcements or our competitors’ announcements regarding new products or services, enhancements, significant contracts, acquisitions or strategic investments; |
| • | changes in earnings estimates or recommendations by securities analysts, if any, who cover our common stock; |
| • | failures to meet external expectations or management guidance; |
| • | fluctuations in our quarterly financial results or the quarterly financial results of companies perceived to be similar to us; |
| • | changes in our capital structure or dividend policy, future issuances of securities, sales of large blocks of common stock by our stockholders, including SunEdison, our incurrence of additional debt or our failure to comply with the agreements governing our credit facilities; |
| • | reputational issues; |
| • | changes in general economic and market conditions in or any of the regions in which we conduct our business; |
| • | changes in industry conditions or perceptions; |
| • | changes in applicable laws, rules or regulations; and |
| • | announcements or actions taken by SunEdison as our principal stockholder. |
In addition, if the market for stocks in our industry or industries related to our industry, or the stock market in general, experiences a loss of investor confidence, the trading price of our common stock could decline for reasons unrelated to our business, financial condition and results of operations. If any of the foregoing occurs, it could cause our stock price to fall and may expose us to lawsuits that, even if unsuccessful, could be costly to defend and a distraction to management.
27
Table of Contents
Future sales of our common stock, or the perception in the public markets that these sales may occur, may depress our stock price.
Sales of substantial amounts of our common stock in the public market after this offering, or the perception that these sales could occur, could adversely affect the price of our common stock and could impair our ability to raise capital through the sale of additional shares. Upon completion of this offering, we will have shares of common stock outstanding. The shares of common stock offered in this offering will be freely tradable without restriction under the Securities Act, except that any shares of our common stock that may be acquired by our directors, executive officers and other affiliates, as that term is defined in the Securities Act, may be sold only in compliance with the limitations described in “Shares Eligible for Future Sale.”
The remaining shares of common stock, representing % of our total outstanding shares of common stock following this offering, will be “restricted securities” within the meaning of Rule 144 and subject to certain restrictions on resale following the consummation of this offering. Restricted securities may be sold in the public market only if they are registered under the Securities Act or are sold pursuant to an exemption from registration such as Rule 144 or Rule 701, as described in “Shares Eligible for Future Sale.”
We, each of our executive officers and directors and SunEdison have agreed, subject to certain exceptions, with the underwriters not to dispose of or hedge any of the shares of common stock or securities convertible into or exchangeable for shares of common stock during the period from the date of this prospectus continuing through the date that is 180 days after the date of this prospectus (subject to extension in certain circumstances). Deutsche Bank Securities Inc. and Goldman, Sachs & Co. may, in their sole discretion, release any of these shares from these restrictions at any time without notice. See “Underwriting.”
After this offering, SunEdison will have the right to require us to register the sales of their shares under the Securities Act, under the terms of an agreement between us and SunEdison. See “Certain Relationships and Related Party Transactions—Registration Rights Agreement” for a more detailed description of these rights.
In the future, we may also issue our securities in connection with investments or acquisitions. The number of shares of our common stock issued in connection with an investment or acquisition could constitute a material portion of the then-outstanding shares of our common stock.
We are an “emerging growth company” and may elect to comply with reduced public company reporting requirements, which could make our common stock less attractive to investors.
We are an emerging growth company, as defined in the JOBS Act. For as long as we continue to be an emerging growth company, we may choose to take advantage of exemptions from various public company reporting requirements. These exemptions include, but are not limited to, (i) not being required to comply with the auditor attestation requirements of Section 404 of the Sarbanes-Oxley Act, (ii) reduced disclosure obligations regarding executive compensation in our periodic reports, proxy statements and registration statements, and (iii) exemptions from the requirements of holding a nonbinding advisory vote on executive compensation and stockholder approval of any golden parachute payments not previously approved. We could be an emerging growth company for up to five years after the first sale of our common equity securities pursuant to an effective registration statement under the Securities Act, which fifth anniversary will occur in 2018. However, if certain events occur prior to the end of such five-year period, including if we become a “large accelerated filer,” our annual gross revenues exceed $1.0 billion or we issue more than $1.0 billion of non-convertible debt in any three-year period, we would cease to be an emerging growth company prior to the end of such five-year period. We have taken advantage of certain of the reduced disclosure obligations in this prospectus regarding executive compensation and the number of years included in our historical financial statements and may elect to take advantage of other reduced burdens in future filings. As a result, the information that we provide to holders of our common stock may be different than you might receive from other public reporting companies in which
28
Table of Contents
you hold equity interests. We cannot predict if investors will find our common stock less attractive as a result of our reliance on these exemptions. If some investors find our common stock less attractive as a result of any choice we make to reduce disclosure, there may be a less active trading market for our common stock and the price for our common stock may be more volatile.
Under the JOBS Act, emerging growth companies can delay adopting new or revised accounting standards until such time as those standards apply to private companies. We have elected to avail ourselves of this extended transition period for complying with new or revised accounting standards and, therefore, we will not be subject to the same new or revised accounting standards as other public companies that are not emerging growth companies.
You will incur immediate dilution as a result of this offering.
If you purchase shares in this offering, you will pay more for your shares than the pro forma net tangible book value of your shares. As a result, you will incur immediate dilution of $ per share, representing the difference between the initial public offering price of $ per share and our pro forma net tangible book value per share as of June 30, 2013 after giving effect to the Transactions of $ . Accordingly, should we be liquidated at our book value, you would not receive the full amount of your investment.
We are a “controlled company” and, as a result, we are exempt from obligations to comply with certain corporate governance requirements.
Since SunEdison will own % of our outstanding common stock (or % if the underwriters exercise in full their option to purchase additional shares), we are a “controlled company” under the rules of . As a result, we are exempt from the obligation to comply with certain corporate governance requirements, including the requirements that a majority of our board of directors consists of “independent directors,” as defined under the rules of , and that we have nominating and compensation committees that are each composed entirely of independent directors. These exemptions do not modify the requirement for a fully independent audit committee, which is permitted to be phased-in as follows: (1) one independent committee member at the time of our initial public offering; (2) a majority of independent committee members within 90 days of our initial public offering; and (3) all independent committee members within one year of our initial public offering. Similarly, once we are no longer a “controlled company,” we must comply with the independent board committee requirements as they relate to the nominating and compensation committees, on the same phase-in schedule as set forth above, with the trigger date being the date we are no longer a “controlled company” as opposed to our initial public offering date. Additionally, we will have 12 months from the date we cease to be a “controlled company” to have a majority of independent directors on our board of directors. It is possible that the interests of SunEdison may in some circumstances conflict with our interests and the interests of holders of our common stock. See “Risks Related to Our Separation from and Our Relationship with SunEdison—We are controlled by SunEdison, whose interests may conflict with yours. The concentrated ownership of our common stock will prevent you and other stockholders from influencing significant decisions.”
We do not currently expect to pay any cash dividends for the foreseeable future.
We do not currently anticipate that we will pay any cash dividends on shares of our common stock for the foreseeable future. Any determination to pay dividends in the future will be at the discretion of our board of directors and will depend upon our financial condition, results of operations, contractual restrictions (including those under the our credit facilities and any potential indebtedness we may incur in the future), restrictions imposed by applicable law, tax considerations and other factors our board of directors deems relevant. There can be no assurance that we will pay a dividend in the future or continue to pay any dividend if we do commence paying dividends. Accordingly, if you purchase shares in this offering, realization of a gain on your investment will depend on the appreciation of the price of our common stock, which may never occur. Investors seeking cash dividends in the foreseeable future should not purchase our common stock.
29
Table of Contents
Provisions in our amended and restated certificate of incorporation, amended and restated bylaws and Delaware law may prevent or delay an acquisition of us, which could decrease the trading price of our common stock.
Our amended and restated certificate of incorporation, or our certificate of incorporation, and amended and restated bylaws, or our bylaws, contain provisions that are intended to deter coercive takeover practices and inadequate takeover bids and to encourage prospective acquirers to negotiate with our board of directors rather than to attempt a hostile takeover. These provisions include:
| • | rules regarding how our stockholders may present proposals or nominate directors for election at stockholder meetings; |
| • | a prohibition on stockholder action by written consent, requiring all stockholder actions be taken at a meeting of our stockholders, except that any action required or permitted to be taken by our stockholders may be effected by written consent until such time as SunEdison ceases to beneficially own 50% or more of our common stock; |
| • | the right of our board of directors to issue preferred stock without stockholder approval; |
| • | limitations on the right of stockholders to remove directors; and |
| • | the right of our board of directors to make, alter or repeal our bylaws. |
As a Delaware corporation, we will be subject to the restrictions under Section 203 of the Delaware General Corporate Law, which will prevent us from engaging in a business combination with an interested stockholder for a period of three years following the date the person became an interested stockholder, unless board or stockholder approval is obtained prior to the acquisition. SunEdison and its affiliates have been approved as an interested stockholder therefore are not subject to Section 203. These anti-takeover provisions and other provisions under Delaware law could discourage, delay or prevent a transaction involving a change in control of us, even if doing so would benefit our stockholders. These provisions could also discourage proxy contests and make it more difficult for you and other stockholders to elect directors of your choosing and to cause us to take other corporate actions you desire. For a further discussion of these and other such anti-takeover provisions, see “Description of Capital Stock—Anti-Takeover Effects of Provisions of Our Certificate of Incorporation and Bylaws, and of Delaware Law.”
The issuance of preferred stock could adversely affect holders of common stock.
Our board of directors is authorized to issue series of preferred stock without any action on the part of our holders of common stock. Our board of directors also has the power, without stockholder approval, to set the terms of any such series of preferred stock that may be issued, including voting rights, dividend rights, preferences over our common stock with respect to dividends or if we liquidate, dissolve or wind up our business and other terms. If we issue preferred stock in the future that has preference over our common stock with respect to the payment of dividends or upon our liquidation, dissolution or winding up, or if we issue preferred stock with voting rights that dilute the voting power of our common stock, the rights of holders of our common stock or the price of our common stock could be adversely affected.
30
Table of Contents
CAUTIONARY STATEMENT CONCERNING FORWARD–LOOKING STATEMENTS
This prospectus contains forward-looking statements within the meaning of the federal securities laws. All statements other than statements of historical fact included in this prospectus are forward-looking statements. These statements relate to analyses and other information, which are based on forecasts of future results and estimates of amounts not yet determinable. These statements also relate to our future prospects, developments and business strategies. These forward-looking statements are identified by the use of terms and phrases such as “anticipate,” “believe,” “could,” “estimate,” “expect,” “intend,” “may,” “plan,” “predict,” “project,” “will” and similar terms and phrases, including references to assumptions. However, these words are not the exclusive means of identifying such statements. These statements are contained in many sections of this prospectus, including those entitled “Prospectus Summary,” “Business” and “Management’s Discussion and Analysis of Financial Condition and Results of Operations.” Although we believe that our plans, intentions and expectations reflected in or suggested by such forward-looking statements are reasonable, we cannot assure you that we will achieve those plans, intentions or expectations. All forward-looking statements are subject to risks and uncertainties that may cause actual results to differ materially from those that we expected.
Important factors that could cause actual results to differ materially from our expectations, or cautionary statements, are disclosed under the sections entitled “Risk Factors” and “Management’s Discussion and Analysis of Financial Condition and Results of Operations” in this prospectus. All written and oral forward-looking statements attributable to us, or persons acting on our behalf, are expressly qualified in their entirety by the cautionary statements contained in this prospectus under the heading “Risk Factors,” as well as other cautionary statements that are made from time to time in our other SEC filings and public communications. You should evaluate all forward-looking statements made in this prospectus in the context of these risks and uncertainties.
We caution you that the important factors referenced above may not contain all of the factors that are important to you. In addition, we cannot assure you that we will realize the results or developments we expect or anticipate or, even if substantially realized, that they will result in the consequences or affect us or our operations in the way we expect. The forward-looking statements included in this prospectus are made only as of the date hereof. We undertake no obligation to publicly update or revise any forward-looking statement as a result of new information, future events or otherwise, except as otherwise required by law.
We obtained the market and industry data and other statistical information used throughout this prospectus from our own research, surveys or studies conducted by third parties, independent industry or general publications and other published independent sources. In particular, we have based much of our discussion concerning the industry and market in which we operate on independent data, research opinions and viewpoints published by Gartner. We have based certain statements with respect to the SOI market on information from the SOI Industry Consortium, an organization comprised of leading companies from the electronics industry. We have also based certain statements with respect to demand for semiconductors and semiconductor applications on information from SEMI Silicon Manufacturers Group, a trade association serving the manufacturing supply chains for the microelectronics and photovoltaic industries, as well as Semiconductor Industry Association, a trade association serving the U.S. semiconductor industry. Industry publications and surveys generally state that they have obtained information from sources believed to be reliable, but do not guarantee the accuracy and completeness of such information. While we believe that each of these sources is reliable, we have not independently verified such data, and we make no representations as to the accuracy of such information. Similarly, we believe our internal research is reliable, but it has not been verified by any independent sources.
31
Table of Contents
The following table indentifies those statements included in this prospectus that are based on data published by Gartner together with the specific source of such data:
| Statement |
Source | |
| “According to Gartner, Inc., or Gartner, the merchant semiconductor silicon wafer market in 2012 was approximately $9 billion worldwide and is expected to grow at a 5.1% compound annual growth rate, or CAGR, from 2012 to 2017, reaching approximately $12 billion by 2017.” | Gartner, Forecast: Semiconductor Silicon Wafers, Worldwide, 2Q13 Update, June 2013. | |
| “The semiconductor wafer industry has undergone significant consolidation over the past 20 years, from more than 20 suppliers in the 1990s to only five major suppliers today, including Shin-Etsu Handotai, SUMCO Phoenix Corporation, Siltronic AG, LG Siltron, and us, which suppliers accounted for approximately 90% of all semiconductor wafer sales in 2012, according to Gartner.” | Gartner, Market Share: Silicon Wafers, Worldwide, 2012, June 2013. | |
| “We have expanded our market share by revenue from 8% in 2008 to 10% in 2012, according to Gartner.” | Gartner, Market Share: Silicon Wafers, Worldwide, 2012, June 2013. | |
| “According to Gartner, the total semiconductor market worldwide was $300 billion in 2012.” | Gartner, Forecast Analysis: Automotive Electronics, Worldwide, 1Q13 Update, March 2013. | |
| “According to Gartner, the epitaxial semiconductor silicon wafer market is expected to grow from $3.6 billion worldwide in 2012 to $4.9 billion in 2017, representing a 6.5% CAGR.” | Gartner, Forecast: Semiconductor Silicon Wafers, Worldwide, 2Q13 Update, June 2013. | |
| “For example, according to Gartner, overall unit sales volumes for semiconductor silicon wafers worldwide declined in 2011 and 2012.” | Gartner, Forecast: Semiconductor Silicon Wafers, Worldwide, 2Q13 Update, June 2013. | |
| “For example, in 2011, merchant semiconductor silicon wafer average selling prices worldwide increased by 12.8% as compared to prices in 2010, while average prices decreased by approximately 8.8% in 2012 as compared to prices in 2011, according to Gartner. | Gartner, Forecast: Semiconductor Silicon Wafers, Worldwide, 2Q13 Update, June 2013. | |
The Gartner reports described above, or the Gartner Reports, represent data, research opinion or viewpoints published, as part of a syndicated subscription service, by Gartner, and are not representations of fact. Each Gartner Report speaks as of its original publication date (and not as of the date of this prospectus) and the opinions expressed in the Gartner Reports are subject to change without notice. At the request of Gartner, we have in certain circumstances used the term “epitaxial” instead of our defined term “EPI” in Gartner market data statements.
32
Table of Contents
We estimate that the net proceeds from this offering and sale by us of shares of common stock in this offering will be approximately $ million, assuming an initial public offering price of $ per share, which is the midpoint of the price range listed on the cover page of this prospectus, and after deducting underwriting discounts and commissions and estimated offering expenses payable by us.
We expect to use the net proceeds from this offering for the following purposes and in the following amounts:
| • | approximately $ million will be used to provide a portion of the consideration paid to SunEdison in connection with its contribution to SSI of the semiconductor materials business; |
| • | approximately $ million will be used to repay existing third party indebtedness relating to the semiconductor materials business; and |
| • | approximately $ million will be available for general corporate purposes. |
A $1.00 increase (decrease) in the assumed initial public offering price of $ per share would increase (decrease) our net proceeds from this offering by approximately $ million, assuming that the number of shares of common stock offered by us, as listed on the cover page of this prospectus, remains the same and after deducting underwriting discounts and commissions and estimated offering expenses payable by us.
The following table illustrates the estimated sources and uses of the funds necessary to complete the Transactions, assuming they were completed as of June 30, 2013. Actual amounts may vary from estimated amounts.
| Sources of Funds |
Uses of Funds |
|||||||||
| (in millions) | ||||||||||
| New senior credit facility: (1) |
||||||||||
| Revolving credit facility |
$ | — | Cash payment to SunEdison |
$ | ||||||
| Term loan |
Repayment of subsidiary bank indebtedness |
|||||||||
| Common stock offered hereby (2) |
Cash to balance sheet (3) |
|||||||||
| Estimated fees and expenses (4) |
||||||||||
|
|
|
|
|
|||||||
| Total sources |
$ | Total uses |
$ | |||||||
|
|
|
|
|
|||||||
| (1) | In connection with the Financing Transactions, we intend to enter into a new senior credit facility that will include a revolving credit facility for borrowings of up to $ million. We do not expect to have any outstanding borrowings under this revolving credit facility upon completion of this offering. We currently do not have commitments from any prospective lenders with respect to the new senior credit facility but expect to obtain such commitments over the next several months. See “Description of Certain Indebtedness—New Senior Credit Facility.” |
| (2) | Assumes an initial public offering price of $ per share of common stock, which is the midpoint of the price range listed on the cover page of this prospectus. |
| (3) | We may use such net proceeds for working capital and other general corporate purposes. |
| (4) | The estimated fees and expenses include underwriting discounts and commissions and our estimated legal, accounting and other expenses associated with the Transactions. |
33
Table of Contents
We currently anticipate that we will retain any future earnings for the operation and expansion of our business. Accordingly, we do not currently anticipate declaring or paying any cash dividends on our common stock for the foreseeable future. Any future determination relating to our dividend policy will be made at the discretion of our board of directors and will depend on then existing conditions, including our financial condition, results of operations, contractual restrictions (including in the agreements governing our credit facilities), capital requirements, business prospects and other factors our board of directors may deem relevant.
Because we are a holding company, our ability to pay cash dividends on our common stock may be limited by restrictions on our ability to obtain sufficient funds through dividends from subsidiaries. In particular, the agreements governing our senior credit facilities that we expect to enter into in connection with the Transactions contain restrictions on the ability of our subsidiaries to make cash dividends to us.
34
Table of Contents
The following table sets forth our cash and cash equivalents and consolidated capitalization as of June 30, 2013 on (i) a historical basis and (ii) a pro forma as adjusted basis to give effect to the Transactions, including our issuance and sale of shares of common stock in this offering at an assumed initial public offering price of $ per share, which is the midpoint of the price range listed on the cover page of this prospectus, after deducting underwriting discounts and commissions and estimated offering expenses payable by us.
You should read the following table in conjunction with the sections entitled “Use of Proceeds,” “Unaudited Pro Forma Consolidated Financial Statements,” “Selected Historical Combined Financial Data,” “Management’s Discussion and Analysis of Financial Condition and Results of Operations” and our historical combined financial statements and related notes included elsewhere in this prospectus.
| June 30, 2013 | ||||||||
| Actual | Pro Forma As Adjusted |
|||||||
| (in millions except share data) (unaudited) |
||||||||
| Cash and cash equivalents |
$ | 55.2 | $ | |||||
|
|
|
|
|
|||||
| Long-term debt (including current portion): |
||||||||
| New senior credit facility: (1) |
||||||||
| Revolving credit facility |
$ | — | $ | — | ||||
| Term loan |
— | |||||||
| Intercompany borrowings (2) |
76.0 | — | ||||||
| Bank indebtedness of Japanese subsidiary |
12.4 | — | ||||||
|
|
|
|
|
|||||
| Total long-term debt |
88.4 | |||||||
| Equity: |
||||||||
| Net SunEdison investment |
$ | 874.8 | $ | — | ||||
| Common stock, par value $0.01 per share, no shares authorized, issued and outstanding, actual; authorized and issued and outstanding, as adjusted |
— | |||||||
| Preferred stock, par value $0.01 per share, no shares authorized, issued and outstanding, actual; authorized and no shares issued and outstanding, as adjusted |
— | — | ||||||
| Additional paid-in-capital |
— | |||||||
| Retained earnings |
— | |||||||
| Accumulated other comprehensive loss |
(137.4 | ) | ||||||
| Noncontrolling interest (3) |
39.0 | |||||||
|
|
|
|
|
|||||
| Total equity |
776.4 | |||||||
|
|
|
|
|
|||||
| Total capitalization |
$ | 864.8 | $ | |||||
|
|
|
|
|
|||||
| (1) | In connection with the Financing Transactions, we intend to enter into a new senior credit facility that will provide for a revolving credit facility for borrowings of up to $ million. We do not expect to have any borrowings outstanding under the revolving credit facility upon completion of this offering. We currently do not have commitments from any prospective lenders with respect to the new senior credit facility but expect to obtain such commitments over the next several months. See “Description of Certain Indebtedness—New Senior Credit Facility.” |
35
Table of Contents
| (2) | As of June 30, 2013, we held notes receivable from certain of SunEdison’s subsidiaries in an aggregate amount of $181.6 million. All intercompany indebtedness will be settled in connection with the Transactions. |
| (3) | Represents the 20% interest held by the other participant in our consolidated joint venture in South Korea known as MEMC Korea Company. |
A $1.00 increase (decrease) in the assumed initial public offering price of $ per share, the midpoint of the price range listed on the cover of this prospectus, would increase (decrease) the adjusted amount for each of cash and cash equivalents, additional paid-in capital, total equity and total capitalization by approximately $ million, assuming that the number of shares offered by us, as listed on the cover of this prospectus, remains the same and after deducting the estimated underwriting discounts and commissions and estimated offering expenses payable by us.
36
Table of Contents
If you invest in our common stock, your interest will be diluted to the extent of the difference between the initial public offering price per share of common stock and the pro forma net tangible book value per share of our common stock after giving effect to the Transactions, as discussed in “Prospectus Summary—Structure and Formation of Our Company.” Net tangible book value per share represents:
| • | total assets less intangible assets; |
| • | reduced by our total liabilities; and |
| • | divided by the number of shares of common stock outstanding. |
Dilution per share represents the difference between the amount per share paid by purchasers of our common stock in this offering and the pro forma net tangible book value per share after giving effect to the Transactions. As of June 30, 2013, after giving effect to the Transactions, our pro forma net tangible book value was approximately $ million, or $ per share based on million shares of our common stock outstanding prior to this offering. This represents an immediate dilution of $ per share to investors purchasing shares of our common stock in this offering. The following table illustrates this dilution per share assuming an initial public offering price of $ per share, which is the midpoint of the price range listed on the cover page of this prospectus, after deducting underwriting discounts and commissions and estimated expenses payable by us:
| Assumed initial public offering price per share |
$ | |||||||
| Pro forma net tangible book value per share as of June 30, 2013 after giving effect to the Transactions |
$ | |||||||
| Increase per share attributable to new investors |
||||||||
|
|
|
|||||||
| Pro forma net tangible book value per share as of June 30, 2013 after giving effect to this offering |
||||||||
|
|
|
|||||||
| Dilution per share to new investors |
$ | |||||||
|
|
|
The following table summarizes, as of June 30, 2013, after giving effect to the Transactions, the number of shares of common stock we issued and sold, the total consideration we received and the average price per share paid to us by SunEdison, our sole stockholder prior to this offering, and by new investors purchasing shares of common stock in this offering. The table assumes an initial public offering price of $ per share, which is the midpoint of the price range listed on the cover page of this prospectus, after deducting underwriting discounts and commissions and estimated expenses payable by us.
| Shares Purchased | Total Consideration | Average Price Per Share |
||||||||||||||||
| Number | Percentage | Amount | Percentage | |||||||||||||||
| (in millions) | ||||||||||||||||||
| SunEdison |
% | $ | % | $ | ||||||||||||||
| New investors |
||||||||||||||||||
|
|
|
|
|
|
|
|
||||||||||||
| Total |
100% | $ | 100% | |||||||||||||||
|
|
|
|
|
|
|
|
||||||||||||
A $1.00 increase or decrease in the assumed initial public offering price of $ per share, the midpoint of the price range listed on the cover page of this prospectus, would increase or decrease net tangible book value by $ million, or $ per share, and would increase or decrease the dilution per share to purchasers in this offering by $ , based on the assumptions set forth above.
37
Table of Contents
Except as otherwise indicated, the discussion and tables above assume no exercise of the underwriters’ option to purchase additional shares. If the underwriters’ option to purchase additional shares is exercised in full, our existing stockholders would own approximately % and our new investors would own approximately % of the total number of shares of our common stock outstanding after this offering.
To the extent that any options or other equity incentive grants are issued in the future (including pursuant to the equity incentive plan we expect to adopt in connection with the completion of this offering) with an exercise price or purchase price below the initial public offering price, new investors will experience further dilution.
38
Table of Contents
UNAUDITED PRO FORMA CONSOLIDATED FINANCIAL STATEMENTS
The unaudited pro forma consolidated financial statements are presented to show how we might have looked if the Transactions described under “Prospectus Summary—Structure and Formation of Our Company,” including the estimated net proceeds from this offering as described under “Use of Proceeds,” had occurred on the dates and for the periods indicated below. We derived the following unaudited pro forma consolidated financial statements by applying pro forma adjustments to the historical combined financial statements of SunEdison’s semiconductor materials business included elsewhere in this prospectus. The historical financial statements as of and for the years ended December 31, 2012 and 2011, as of and for the six months ended June 30, 2013 and for the six months ended June 30, 2012 appearing elsewhere in this prospectus are intended to represent the financial results of SunEdison’s semiconductor materials business that will be contributed to us as part of the Transactions for those periods.
The unaudited pro forma consolidated statements of operations for 2012 and the six months ended June 30, 2013 have been derived from the financial data of SunEdison’s semiconductor materials business (as derived from the combined financial statements appearing elsewhere in this prospectus) and give pro forma effect to the Transactions, including the use of the estimated net proceeds from this offering, as if they had occurred on January 1, 2012. The unaudited pro forma consolidated balance sheet as of June 30, 2013 gives effect to the Transactions, including the use of the estimated net proceeds from this offering, as if they had occurred on June 30, 2013.
The unaudited pro forma consolidated financial statements reflect certain adjustments that are necessary to present fairly our unaudited pro forma consolidated results of operations and our unaudited pro forma consolidated balance sheet as of and for the periods indicated. The pro forma adjustments give effect to events that are (i) directly attributable to the Transactions, (ii) factually supportable and (iii) with respect to the statement of operations, expected to have a continuing impact on us, and are based on assumptions that management believes are reasonable given the best information currently available.
The unaudited pro forma consolidated financial information is presented for informational purposes only. The unaudited pro forma consolidated financial information does not purport to represent what our results of operations or financial condition would have been had the transactions to which the pro forma adjustments relate actually occurred on the dates indicated, and they do not purport to project our results of operations or financial condition for any future period or as of any future date.
Our historical combined financial statements include expenses of SunEdison that were allocated to us for certain functions, including general corporate expenses related to communications, corporate administration, finance, legal, information technology, human resources, compliance, employee benefits and incentives, operations, research and development and stock compensation. These expenses were allocated in our historical results of operations on the basis of direct usage, where identifiable, with the remainder primarily allocated on the basis of revenue or other related sales metrics, headcount or number of our manufacturing plants. We consider the expense allocation methodology and results to be reasonable for all periods presented. However, these allocations may not necessarily be indicative of the actual expenses we would have incurred as an independent publicly traded company during the periods prior to this offering or of the costs we will incur in the future. Following this offering, SunEdison will continue to provide us with some of the services related to these functions on a transitional basis pursuant to a transition services agreement, and we expect to incur other costs to replace the services and resources that will not be provided by SunEdison. We generally expect to use these services for approximately one to two years following the completion of this offering, depending on the type of service and the location at which such service is provided. However, we may agree with SunEdison to extend the service periods or may terminate such service periods by providing prior written notice. We have not made any adjustments in these unaudited pro forma consolidated financial statements to reflect any potential changes to these allocated expenses as a result of the Transactions as we believe any such changes are not factually supportable at this time.
39
Table of Contents
The unaudited pro forma consolidated statements of operations do not reflect certain non-recurring costs and expenses that we expect to incur in connection with the Transactions, including those related to the creation of a stand-alone infrastructure, facility separation costs, certain legal registration and patent assignment costs and professional fees. We expect these costs and expenses will range between approximately $ million to $ million and will be recorded by us in the period in which the Transactions are completed.
The unaudited pro forma consolidated balance sheet and statements of operations should be read in conjunction with the sections entitled “Prospectus Summary—Structure and Formation of Our Company,” “Use of Proceeds,” “Capitalization,” “Selected Historical Combined Financial Data,” “Management’s Discussion and Analysis of Financial Condition and Results of Operations” and our historical combined financial statements and related notes thereto included elsewhere in this prospectus.
40
Table of Contents
SunEdison Semiconductor, Inc.
(Semiconductor Materials Business of SunEdison)
Unaudited Pro Forma Consolidated Statement of Operations
For the Six Months Ended June 30, 2013
| Actual | Pro Forma Adjustments |
Pro Forma | ||||||||||
| (in millions) | ||||||||||||
| Statement of Operations Data: |
||||||||||||
| Net sales to non-affiliates |
$ | 471.3 | $ | $ | ||||||||
| Net sales to affiliates |
5.1 | |||||||||||
| Cost of goods sold |
422.5 | |||||||||||
|
|
|
|
|
|
|
|||||||
| Gross profit |
53.9 | |||||||||||
| Operating expenses: |
||||||||||||
| Marketing and administration |
48.4 | |||||||||||
| Research and development |
18.7 | |||||||||||
| Restructuring (reversals) charges |
(5.5 | ) | ||||||||||
| Gain on receipt of property, plant and equipment |
— | |||||||||||
| Long-lived asset impairment charges |
— | |||||||||||
|
|
|
|
|
|
|
|||||||
| Operating income (loss) |
(7.7 | ) | ||||||||||
|
|
|
|
|
|
|
|||||||
| Non-operating expenses (income): |
||||||||||||
| Interest expense |
0.3 | |||||||||||
| Interest income |
(0.2 | ) | ||||||||||
| Interest (income) expense, net-affiliates |
(0.8 | ) | ||||||||||
| Other, net |
(4.1 | ) | ||||||||||
|
|
|
|
|
|
|
|||||||
| Total non-operating expenses (income) |
(4.8 | ) | ||||||||||
|
|
|
|
|
|
|
|||||||
| Income (loss) before income tax expense |
(2.9 | ) | ||||||||||
| Income tax expense |
18.5 | |||||||||||
|
|
|
|
|
|
|
|||||||
| Net income (loss) |
(21.4 | ) | ||||||||||
| Net (income) loss attributable to noncontrolling interests |
(2.3 | ) | ||||||||||
|
|
|
|
|
|
|
|||||||
| Net (loss) income attributable to SSI |
$ | (23.7 | ) | $ | $ | |||||||
|
|
|
|
|
|
|
|||||||
| Basic (loss) income per share |
N/A | |||||||||||
| Diluted (loss) income per share |
N/A | |||||||||||
See Notes to Unaudited Pro Forma Consolidated Financial Statements
41
Table of Contents
SunEdison Semiconductor, Inc.
(Semiconductor Materials Business of SunEdison)
Unaudited Pro Forma Consolidated Statement of Operations
For the Year Ended December 31, 2012
| Actual | Pro Forma Adjustments |
Pro Forma | ||||||||||
| (in millions) | ||||||||||||
| Statement of Operations Data: |
||||||||||||
| Net sales to non-affiliates |
$ | 927.4 | $ | $ | ||||||||
| Net sales to affiliates |
6.8 | |||||||||||
| Cost of goods sold |
852.4 | |||||||||||
|
|
|
|
|
|
|
|||||||
| Gross profit |
81.8 | |||||||||||
| Operating expenses: |
||||||||||||
| Marketing and administration |
100.7 | |||||||||||
| Research and development |
33.4 | |||||||||||
| Restructuring (reversals) charges |
(149.6 | ) | ||||||||||
| Gain on receipt of property, plant and equipment |
(31.7 | ) | ||||||||||
| Long-lived asset impairment charges |
1.5 | |||||||||||
|
|
|
|
|
|
|
|||||||
| Operating income (loss) |
127.5 | |||||||||||
|
|
|
|
|
|
|
|||||||
| Non-operating expenses (income): |
||||||||||||
| Interest expense |
1.0 | |||||||||||
| Interest income |
(0.7 | ) | ||||||||||
| Interest (income) expense, net-affiliates |
(2.2 | ) | ||||||||||
| Other, net |
3.1 | |||||||||||
|
|
|
|
|
|
|
|||||||
| Total non-operating expenses (income) |
1.2 | |||||||||||
|
|
|
|
|
|
|
|||||||
| Income (loss) before income tax expense |
126.3 | |||||||||||
| Income tax expense |
3.6 | |||||||||||
|
|
|
|
|
|
|
|||||||
| Net income (loss) |
122.7 | |||||||||||
| Net (income) loss attributable to noncontrolling interests |
(1.4 | ) | ||||||||||
|
|
|
|
|
|
|
|||||||
| Net income (loss) attributable to SSI |
$ | 121.3 | $ | $ | ||||||||
|
|
|
|
|
|
|
|||||||
| Basic (loss) income per share |
N/A | |||||||||||
| Diluted (loss) income per share |
N/A | |||||||||||
See Notes to Unaudited Pro Forma Consolidated Financial Statements
42
Table of Contents
SunEdison Semiconductor, Inc.
(Semiconductor Materials Business of SunEdison)
Unaudited Pro Forma As Adjusted Consolidated Balance Sheet
As of June 30, 2013
| Actual | Pro Forma Adjustments |
Pro Forma As Adjusted |
||||||||||
| (in millions, except share data) | ||||||||||||
| Assets |
||||||||||||
| Current assets: |
$ | $ | $ | |||||||||
| Cash and cash equivalents |
55.2 | |||||||||||
| Accounts receivable, net |
117.9 | |||||||||||
| Accounts receivable, affiliate |
19.4 | |||||||||||
| Inventories |
127.4 | |||||||||||
| Deferred tax assets |
14.0 | |||||||||||
| Prepaid and other current assets |
21.6 | |||||||||||
|
|
|
|
|
|
|
|||||||
| Total current assets |
355.5 | |||||||||||
| Property, plant and equipment, net |
736.3 | |||||||||||
| Notes receivable, affiliate |
181.6 | |||||||||||
| Other assets |
82.4 | |||||||||||
|
|
|
|
|
|
|
|||||||
| Total assets |
$ | 1,355.8 | $ | $ | ||||||||
|
|
|
|
|
|
|
|||||||
| Liabilities and Equity |
||||||||||||
| Current liabilities: |
||||||||||||
| Current portion of long-term debt |
$ | 2.9 | $ | $ | ||||||||
| Accounts payable |
99.7 | |||||||||||
| Accounts payable, affiliate |
111.9 | |||||||||||
| Accrued liabilities |
52.6 | |||||||||||
| Accrued wages and salaries |
32.8 | |||||||||||
| Restructuring liabilities |
85.5 | |||||||||||
|
|
|
|
|
|
|
|||||||
| Total current liabilities |
385.4 | |||||||||||
| Long-term debt, less current portion |
9.5 | |||||||||||
| Long-term debt, affiliate |
76.0 | |||||||||||
| Pension and post-employment liabilities |
67.3 | |||||||||||
| Restructuring liabilities |
4.3 | |||||||||||
| Other liabilities |
36.9 | |||||||||||
|
|
|
|
|
|
|
|||||||
| Total liabilities |
579.4 | |||||||||||
|
|
|
|
|
|
|
|||||||
| Equity: |
||||||||||||
| Net SunEdison investment |
874.8 | |||||||||||
| Common stock, $0.01 par value, shares authorized, shares issued and outstanding on a pro forma basis |
— | |||||||||||
| Accumulated other comprehensive loss |
(137.4 | ) | ||||||||||
|
|
|
|
|
|
|
|||||||
| Total SSI equity |
737.4 | |||||||||||
| Noncontrolling interests |
39.0 | |||||||||||
|
|
|
|
|
|
|
|||||||
| Total equity |
776.4 | |||||||||||
|
|
|
|
|
|
|
|||||||
| Total liabilities and equity |
$ | 1,355.8 | $ | $ | ||||||||
|
|
|
|
|
|
|
|||||||
See Notes to Unaudited Pro Forma Consolidated Financial Statements
43
Table of Contents
SunEdison Semiconductor, Inc.
(Semiconductor Materials Business of SunEdison)
Notes to Unaudited Pro Forma Consolidated Financial Statements
| (1) | Reflects the elimination of interest expense, net associated with both third party and intercompany indebtedness of $ million and $ million for the six months ended June 30, 2013 and for the year ended December 31, 2012, respectively, related to our historical interest expense, net included in our historical combined statements of operations. All of this indebtedness will be repaid or settled in connection with the completion of the Transactions. |
| (2) | Reflects the addition of interest expense (which includes amortization of deferred issuance costs) of $ million and $ million for the six months ended June 30, 2013 and for the year ended December 31, 2012, respectively, related to borrowings in an aggregate amount of $ million under our new five-year term loan in connection with the Transactions at an assumed weighted-average effective interest rate of %, and the costs associated with our new $ million three-year revolving credit facility. The actual interest date on the term loan may vary from that assumed in the calculation of the pro forma amount and a 1⁄8% variance in the interest rate associated with the term loan would result in a $ and $ change in pro forma cash interest expense for the six months ended June 30, 2013 and for the year ended December 31, 2012, respectively. |
| (3) | As a result of our existing income tax loss carry-forwards in the United States, for which full valuation allowances have been provided, no deferred income taxes have been established, and no income tax has been provided related to the pro forma adjustments for the Transactions. |
| (4) | The weighted-average number of shares used to compute pro forma basic and diluted earnings per share is million, which will be the number of shares of our common stock outstanding immediately following the completion of the Transactions. |
| (5) | Reflects the elimination of third party and intercompany indebtedness, accrued interest receivable, accrued interest payable and unamortized deferred debt issuance costs that will be repaid or settled by us in connection with the completion of the Transactions. These assets and liabilities are included in the historical combined balance sheet. The adjustment follows: |
| (in millions) |
Debit/ (Credit) |
|||
| Other noncurrent assets |
$ | |||
| Other current liabilities |
||||
| Note receivable, affiliate |
||||
| Long-term debt |
||||
| Long-term debt, affiliate |
||||
| Net SunEdison investment |
||||
|
|
|
|||
| $ | ||||
|
|
|
|||
| (6) | Reflects borrowings of $ million aggregate amount under a new five-year term loan in connection with the Transactions at an assumed weighted-average stated interest rate of %, as well as the deferred costs associated with both the incurrence of the term loan and the establishment of a $ million three-year revolving credit facility. The adjustment follows: |
| (in millions) |
Debit/ (Credit) |
|||
| Cash and cash equivalents |
$ | |||
| Other noncurrent assets |
||||
| Long-term debt |
||||
| Net SunEdison investment |
||||
|
|
|
|||
| $ | ||||
|
|
|
|||
44
Table of Contents
| (7) | Reflects the transfer to us of SunEdison’s subsidiaries holding substantially all of the assets and liabilities of SunEdison’s Semiconductor Materials business in consideration for (i) all of the issued and outstanding shares of our common stock prior to this offering; and (ii) a cash payment of $ million. The adjustment follows: |
| (in millions) |
Debit/ (Credit) |
|||
| Cash and cash equivalents |
$ | |||
| Other noncurrent assets* |
||||
| SunEdison net investment |
||||
| Common stock** |
||||
| Additional paid-in capital |
||||
|
|
|
|||
| $ | ||||
|
|
|
|||
| * | The long-term debt net of deferred issuance costs of $ million. |
| ** | Represents million shares of common stock at a par value per share of $0.01. |
45
Table of Contents
SELECTED HISTORICAL COMBINED FINANCIAL DATA
The following table shows selected historical combined financial data at the dates and for the periods indicated. The selected historical combined statement of operations data and balance sheet data as of and for the years ended December 31, 2012 and 2011 have been derived from our audited combined financial statements included elsewhere in this prospectus. The selected historical combined statement of operations data and balance sheet data as of and for the six months ended June 30, 2013 and for the six months ended June 30, 2012 were derived from our unaudited combined financial statements included elsewhere in this prospectus, which include all adjustments, consisting of normal recurring adjustments, which management considers necessary for a fair presentation of the financial position and the results of operations for such periods. Results for the interim periods are not necessarily indicative of the results for the full year. The historical financial statements as of and for the years ended December 31, 2012 and 2011, as of and for the six months ended June 30, 2013 and for the six months ended June 30, 2012 are intended to represent the financial results of SunEdison’s semiconductor materials business that will be contributed to us as part of the Transactions for those periods.
Our historical combined financial statements include expenses of SunEdison that were allocated to us for certain functions, including general corporate expenses related to communications, corporate administration, finance, legal, information technology, human resources, compliance, employee benefits and incentives, operations, research and development and stock compensation. These expenses were allocated in our historical results of operations on the basis of direct usage, where identifiable, with the remainder primarily allocated on the basis of revenue or other related sales metrics, headcount or number of our manufacturing plants. We consider the expense allocation methodology and results to be reasonable for all periods presented. However, these allocations may not necessarily be indicative of the actual expenses we would have incurred as an independent publicly traded company during the periods prior to this offering or of the costs we will incur in the future. No significant restructuring or impairment charges were included in these allocations from SunEdison.
The combined financial statements included in this prospectus may not be indicative of our future performance and do not necessarily reflect what our financial position and results of operations would have been had we operated as a stand-alone public company during the periods presented, including changes that will occur in our operations and capital structure as a result of the Transactions, including this offering.
The following tables should be read together with, and are qualified in their entirety by reference to, the historical combined financial statements and the related notes appearing elsewhere in this prospectus. Among other things, the historical combined financial statements include more detailed information regarding the basis of presentation for the information in the following table. The tables should also be read together with “Management’s Discussion and Analysis of Financial Condition and Results of Operations” and “Certain Relationships and Related Party Transactions.”
The information presented in the following table under the caption “Other Financial Data” is not directly derived from the financial statements.
46
Table of Contents
| Fiscal Year Ended December 31, |
Six Months Ended June 30, |
|||||||||||||||
| 2012 | 2011 | 2013 | 2012 | |||||||||||||
| (unaudited) | (unaudited) | |||||||||||||||
| (in millions) | ||||||||||||||||
| Statement of Operations Data: |
||||||||||||||||
| Net sales to non-affiliates |
$ | 927.4 | $ | 1,051.3 | $ | 471.3 | $ | 454.5 | ||||||||
| Net sales to affiliates |
6.8 | 147.0 | 5.1 | 3.3 | ||||||||||||
| Cost of goods sold |
852.4 | 1,023.3 | 422.5 | 425.8 | ||||||||||||
|
|
|
|
|
|
|
|
|
|||||||||
| Gross profit |
81.8 | 175.0 | 53.9 | 32.0 | ||||||||||||
| Operating expenses: |
||||||||||||||||
| Marketing and administration |
100.7 | 129.9 | 48.4 | 52.2 | ||||||||||||
| Research and development |
33.4 | 38.2 | 18.7 | 16.1 | ||||||||||||
| Restructuring (reversals) charges |
(149.6 | ) | 284.5 | (5.5 | ) | — | ||||||||||
| Gain on receipt of property, plant and equipment |
(31.7 | ) | — | — | — | |||||||||||
| Long-lived asset impairment charges |
1.5 | 234.7 | — | — | ||||||||||||
|
|
|
|
|
|
|
|
|
|||||||||
| Operating income (loss) |
127.5 | (512.3 | ) | (7.7 | ) | (36.3 | ) | |||||||||
|
|
|
|
|
|
|
|
|
|||||||||
| Non-operating expenses (income): |
||||||||||||||||
| Interest expense |
1.0 | 5.9 | 0.3 | 0.5 | ||||||||||||
| Interest income |
(0.7 | ) | (1.0 | ) | (0.2 | ) | (0.4 | ) | ||||||||
| Interest (income) expense, net-affiliates |
(2.2 | ) | 1.8 | (0.8 | ) | (0.9 | ) | |||||||||
| Other, net |
3.1 | (0.8 | ) | (4.1 | ) | 1.4 | ||||||||||
|
|
|
|
|
|
|
|
|
|||||||||
| Total non-operating expenses (income) |
1.2 | 5.9 | (4.8 | ) | 0.6 | |||||||||||
|
|
|
|
|
|
|
|
|
|||||||||
| Income (loss) before income tax expense |
126.3 | (518.2 | ) | (2.9 | ) | (36.9 | ) | |||||||||
| Income tax expense |
3.6 | 37.4 | 18.5 | 1.8 | ||||||||||||
|
|
|
|
|
|
|
|
|
|||||||||
| Net income (loss) |
122.7 | (555.6 | ) | (21.4 | ) | (38.7 | ) | |||||||||
| Net (income) loss attributable to noncontrolling interests(1) |
(1.4 | ) | (2.3 | ) | (2.3 | ) | 0.2 | |||||||||
|
|
|
|
|
|
|
|
|
|||||||||
| Net income (loss) attributable to SSI |
$ | 121.3 | $ | (557.9 | ) | $ | (23.7 | ) | $ | (38.5 | ) | |||||
|
|
|
|
|
|
|
|
|
|||||||||
| Other Financial Data: |
||||||||||||||||
| Adjusted EBITDA(2) (unaudited) |
$ | 74.9 | $ | 170.2 | $ | 53.4 | $ | 27.3 | ||||||||
| As of December 31, | As of June 30, 2013 |
|||||||||||||||
| 2012 | 2011 | |||||||||||||||
| (unaudited) | ||||||||||||||||
| Balance Sheet Data: |
||||||||||||||||
| Cash and cash equivalents |
$ | 103.2 | $ | 50.3 | $ | 55.2 | ||||||||||
| Working capital (3) |
38.1 | (65.5 | ) | (29.9 | ) | |||||||||||
| Property, plant and equipment, net |
789.9 | 791.9 | 736.3 | |||||||||||||
| Total assets |
1,513.2 | 1,389.1 | 1,355.8 | |||||||||||||
| Total liabilities |
699.2 | 850.1 | 579.4 | |||||||||||||
| Total equity |
814.0 | 539.0 | 776.4 | |||||||||||||
| (1) | Represents the 20% interest held by the other participant in our consolidated joint venture in South Korea known as MEMC Korea Company. |
| (2) | Adjusted EBITDA is a non-GAAP financial measure. This measurement should not be viewed as an alternative to GAAP measures of performance. The presentation of Adjusted EBITDA should not be construed as an inference that our future results will be unaffected by unusual or non-recurring items. |
We define Adjusted EBITDA as earnings before net interest expense, income tax expense, depreciation and amortization, restructuring (reversals) charges, gain on receipt of property, plant and equipment, long-lived asset impairment charges and stock compensation expense. All of the omitted items are either (i) non-cash items or (ii) items that we do not consider in assessing our on-going operating performance. Because it omits non-cash items, we feel that Adjusted EBITDA is less susceptible to variances in actual performance resulting from depreciation, amortization and other non-cash charges and more reflective of other factors that affect our operating performance. Because it omits the other items,
47
Table of Contents
we believe Adjusted EBITDA is also more reflective of our on-going operating performance. We believe Adjusted EBITDA is useful to investors in evaluating our operating performance because:
| • | securities analysts and other interested parties use such calculations as a measure of financial performance and debt service capabilities; and |
| • | it is used by our management for internal planning purposes, including aspects of our combined operating budget and capital expenditures. |
Adjusted EBITDA has limitations as an analytical tool, and you should not consider it in isolation or as a substitute for analysis of our results as reported under GAAP. Some of these limitations include:
| • | it does not reflect our cash expenditures or future requirements for capital expenditures or contractual commitments; |
| • | it does not reflect changes in, or cash requirements for, working capital; |
| • | it does not reflect significant interest expense or the cash requirements necessary to service interest or principal payments on our outstanding debt; |
| • | it does not reflect payments made or future requirements for income taxes; |
| • | it adjusts for restructuring (reversals) charges, gains on receipt of property, plant equipment, asset impairments and stock compensation expense factors that we do not consider indicative of future performance; |
| • | although it reflects adjustments for factors that we do not consider indicative of future performance, we may, in the future, incur expenses similar to the adjustments reflected in our calculation of Adjusted EBITDA in this prospectus; and |
| • | although depreciation and amortization are non-cash charges, the assets being depreciated and amortized will often have to be replaced in the future and Adjusted EBITDA does not reflect cash requirements for such replacements. |
Investors are encouraged to evaluate each adjustment and the reasons we consider it appropriate for supplemental analysis. The following table presents a reconciliation from net income (loss) attributable to SSI to Adjusted EBITDA:
| Fiscal Year Ended December 31, |
Six Months Ended June 30, |
|||||||||||||||
| 2012 | 2011 | 2013 | 2012 | |||||||||||||
| (unaudited) | (unaudited) | (unaudited) | (unaudited) | |||||||||||||
| (in millions) | ||||||||||||||||
| Net income (loss) attributable to SSI |
$ | 121.3 | $ | (557.9 | ) | $ | (23.7 | ) | $ | (38.5 | ) | |||||
| Add: |
||||||||||||||||
| Interest expense, net |
(1.9 | ) | 6.7 | (0.7 | ) | (0.8 | ) | |||||||||
| Income tax expense |
3.6 | 37.4 | 18.5 | 1.8 | ||||||||||||
| Depreciation and amortization |
118.7 | 144.3 | 58.3 | 59.0 | ||||||||||||
| Restructuring (reversals) charges |
(149.6 | ) | 284.5 | (5.5 | ) | — | ||||||||||
| Gain on receipt of property, plant and equipment |
(31.7 | ) | — | — | — | |||||||||||
| Long-lived asset impairment charges |
1.5 | 234.7 | — | — | ||||||||||||
| Stock compensation expense |
13.0 | 20.5 | 6.5 | 5.8 | ||||||||||||
|
|
|
|
|
|
|
|
|
|||||||||
| Adjusted EBITDA |
$ | 74.9 | $ | 170.2 | $ | 53.4 | $ | 27.3 | ||||||||
|
|
|
|
|
|
|
|
|
|||||||||
| (3) | Working capital is defined as our current assets minus current liabilities. As of June 30, 2013, our current assets included accounts receivable due from SunEdison of $19.4 million and our current liabilities included accounts payable to SunEdison of $111.9 million. All of these intercompany balances will be settled in connection with the Transactions. Excluding these amounts, our working capital would have been $62.6 million as of June 30, 2013. |
48
Table of Contents
MANAGEMENT’S DISCUSSION AND ANALYSIS OF FINANCIAL CONDITION AND RESULTS OF OPERATIONS
The following discussion analyzes the historical financial condition and results of operations of the semiconductor materials business operated by SunEdison. The historical combined financial statements of the semiconductor materials business as of and for the years ended December 31, 2012 and 2011 and as of June 30, 2013 and for the six months ended June 30, 2013 and 2012 appearing elsewhere in this prospectus were prepared on a ‘‘carve-out’’ basis from SunEdison and are intended to represent the financial results during those periods of SunEdison’s semiconductor materials business that will be contributed to SunEdison Semiconductor, Inc. as part of the Transactions. However, these combined financial statements do not purport to reflect what the results of operations, comprehensive income (loss), financial position, equity or cash flows would have been had we operated as a standalone public company during the periods presented.
You should read the following discussion of the historical financial condition and results of operations of our business in conjunction with the historical combined financial statements and accompanying notes of our combined financial statements included elsewhere in this prospectus. This discussion includes forward-looking statements that are subject to risks and uncertainties that may result in actual results differing from statements we make. See ‘‘Cautionary Statement Concerning Forward-Looking Statements.’’ Factors that could cause actual results to differ include those risks and uncertainties that are discussed in ‘‘Risk Factors.’’
Executive Overview
We are a global leader in the development, manufacture and sale of silicon wafers to the semiconductor industry. Wafers are used as the base substrate for nearly all semiconductor devices, which in turn provide the foundation for the entire electronics industry. Our business was established in 1959 and was known during most of our history as MEMC. We have developed a broad product portfolio, an extensive global manufacturing footprint, process technology expertise and supply chain flexibility, while increasing our capital efficiency and maintaining a lean operating culture.
We primarily sell our products to all of the major semiconductor manufacturers in the world, including integrated device manufacturers and pure-play semiconductor foundries, and to a lesser extent, leading companies that specialize in wafer customization. During 2012, our largest customers were Samsung, TSMC and STMicroelectronics. We operate facilities in major semiconductor manufacturing regions throughout the world, including Taiwan, Malaysia, South Korea, Italy, Japan and the United States.
The semiconductor wafer industry has undergone significant consolidation over the past 20 years, from more than 20 suppliers in the 1990s to only 5 major suppliers today, including Shin-Etsu Handotai, SUMCO Corporation, Siltronic AG, LG Siltron and us, which suppliers accounted for approximately 90% of all semiconductor wafer sales in 2012, according to Gartner. This consolidation is due in large part to the significant increase in the capital investment and manufacturing capacity needed to compete effectively. We have expanded our market share by revenue from 8% in 2008 to 10% in 2012, according to Gartner. The table below sets forth our net sales, net income (loss) attributable to SSI and Adjusted EBITDA for the years ended December 31, 2012 and 2011 and for the six months ended June 30, 2013 and 2012:
| For the Year Ended December 31, | For the Six Months Ended June 30, | |||||||||||||||
| 2012 | 2011 | 2013 | 2012 | |||||||||||||
| (in millions) | ||||||||||||||||
| Net sales |
$ | 934.2 | $ | 1,198.3 | $ | 476.4 | $ | 457.8 | ||||||||
| Net income (loss) attributable to SSI |
$ | 121.3 | $ | (557.9) | $ | (23.7) | $ | (38.5) | ||||||||
| Adjusted EBITDA (1) (unaudited) |
$ | 74.9 | $ | 170.2 | $ | 53.4 | $ | 27.3 | ||||||||
| (1) | See “—How We Assess the Performance of Our Business—Adjusted EBITDA” for the definition of Adjusted EBITDA and a reconciliation from net income (loss) attributable to SSI to Adjusted EBITDA. |
49
Table of Contents
Factors Affecting Our Results of Operations
Semiconductor Market Cyclicality
Overall demand for semiconductors has generally increased over time. For example, according to the Semiconductor Industry Association, between 2007 and 2012, semiconductor unit sales and the overall semiconductor market revenue grew at CAGRs of 3.1% and 2.7%, respectively. Despite this long-term growth for semiconductors, short-term demand for semiconductor wafers is subject to considerable volatility and cyclicality due to changes in the supply and demand for semiconductor devices, which is impacted by general economic conditions, including consumer spending levels. For example, according to Gartner, overall unit sales volumes for semiconductor silicon wafers worldwide declined in 2011 and 2012. Our wafer unit sales volume experienced a similar decline in 2011, but remained flat in 2012 and increased 12.9% during the six months ended June 30, 2013 as compared to the same period in 2012.
Manufacturing Capacity Utilization
The semiconductor wafer industry is capital-intensive due to the investments in manufacturing capacity needed to compete effectively. Our semiconductor wafer manufacturing processes are highly complex, require advanced and increasingly costly equipment and need to be continuously modified or maintained in response to our customer requirements. As a result of these significant fixed costs, changes in our manufacturing plant utilization have a significant impact on our results of operations in any particular period. Fluctuations in demand for silicon devices often result in periods of over- or under- manufacturing capacity within the semiconductor wafer industry. We focus on maximizing our manufacturing capacity utilization throughout periods of fluctuating demand for semiconductor devices through close collaboration with our customers to understand their anticipated product requirements. In addition, our engineers’ understanding of both the science and operation of the tools within our factories enables us to streamline equipment controls, software interfaces and operational parameters, allowing us to utilize our manufacturing capacity more efficiently. We have also designed our manufacturing processes to be flexible and scalable with low to moderate additional capital investment necessary to pursue new opportunities or increase capacity, and we continuously review our global manufacturing footprint to manage our existing capacity in light of current industry conditions.
Semiconductor Wafer Pricing Fluctuations
Semiconductor wafer average selling prices have fluctuated in recent years based on changes in the supply and demand for semiconductor devices. For example, in 2011, semiconductor silicon wafer average selling prices worldwide increased by 12.8% as compared to prices in 2010, while average prices decreased by approximately 8.8% in 2012 as compared to prices in 2011, according to Gartner. The average selling price increase in 2011 was primarily due to the earthquake and tsunami in Japan. Semiconductor wafer price fluctuations can have a significant impact on our net sales and gross margins. In addition, consolidation within the semiconductor industry has also increased the purchasing power of our customers over time, resulting in downward pressure on wafer average selling prices. In response to the recent price declines, we have focused on reducing our manufacturing costs, improving our product mix and expanding our market share in an effort to minimize the adverse impact on our sales and gross profit.
Introduction of New Products and Product Mix
Recent growth in semiconductor demand has been largely attributable to the proliferation of mobile devices, such as smart phones and tablets. Semiconductors used in applications such as mobile devices and cloud infrastructure are increasingly requiring EPI wafers, which enable lower power consumption due to their near perfect surface characteristics. According to Gartner, the epitaxial semiconductor silicon wafer market is expected to grow from $3.6 billion in 2012 to $4.9 billion in 2017, representing a 6.5% CAGR. Similarly, demand for SOI wafers is growing as a result of the ability of SOI wafers to improve switching speeds and
50
Table of Contents
enhance the performance of RF devices such as power amplifiers, switches and sensors. According to the SOI Industry Consortium, the total available market for SOI wafers is expected to double over the next five years, driven by the increased penetration in mobile system-on-chips and RF devices. We have been a leader in the development of these advanced substrates and believe we are well-positioned to capitalize on the growth opportunities resulting from the increasing demand for EPI and SOI wafers. In 2012, EPI and SOI wafer sales represented approximately one-third of our net sales to non-affiliates. We typically realize greater gross profits on our more highly engineered wafers, such as our EPI and SOI wafers, and the mix of products sold by us in any given period will impact our overall gross margins.
Restructuring and Cost-Improvement Initiatives
We have implemented several initiatives since 2009 designed to rationalize our use of resources, optimize those resources for the most attractive market opportunities and manage our production capacity to efficiently meet demand. During the fourth quarter of 2011, SunEdison committed to a series of actions to reduce its global workforce, right size its production capacity and accelerate operating cost reductions across each of its business segments in 2012 and beyond, or the 2011 Global Plan. In connection with the 2011 Global Plan, we reduced our workforce by approximately 11% and shuttered our Merano, Italy polysilicon facility. Primarily as a result of these actions, we incurred restructuring charges of $284.5 million and long-lived asset impairment charges of $234.7 million in 2011. We have achieved significant annualized cost savings and productivity improvements as a result of these restructuring and other cost improvement initiatives. We implemented similar cost and significant workforce reductions and a facility realignment in 2009. For more information regarding these restructuring and impairment activities, see Note 3 to our combined financial statements included elsewhere in this prospectus.
As part of our efforts to implement the 2011 Global Plan, we executed two settlement agreements with Evonik Industries AG, or Evonik, in September 2012 to settle disputes arising from our early termination of two take-or-pay supply agreements related to our Merano, Italy polysilicon facility. Pursuant to the settlement, we forfeited a deposit of $10.2 million and agreed to pay Evonik a total of 70.0 million Euro, of which 25.0 million Euro was paid in 2012, 10.0 million Euro was paid in the first quarter of 2013 and 20.0 million Euro was paid in the second quarter of 2013. The remaining 15.0 million Euro will be paid in the third quarter of 2013. As a result of this restructuring-related settlement, a favorable adjustment to our 2011 Global Plan liabilities was made during the third quarter of 2012 resulting in $65.8 million of income within restructuring charges since we settled the take-or-pay obligations for less than what we previously estimated and accrued. Additionally, in December 2012, as part of the settlement with Evonik, we obtained title to a chlorosilanes plant, which resulted in the recognition of a $31.7 million gain in the fourth quarter of 2012.
As a result of shuttering our Merano, Italy polysilicon facility, we executed a letter of agreement pertaining to a polysilicon supply agreement on December 14, 2012 with a subsidiary of SunEdison. This letter agreement required the subsidiary of SunEdison to reimburse us 57.9 million Euro related to damages paid to suppliers and lost profits. As a result of this letter of agreement, we recorded approximately $75.7 million of income within restructuring charges in 2012.
A majority of our polysilicon assets at our Merano, Italy polysilicon facility were previously written down to their estimated salvage value. We established the carrying value of the chlorosilanes assets obtained from Evonik at our Merano, Italy polysilicon facility based upon management’s estimate of the probability as to whether this facility would be re-opened or permanently closed. If we change our probability estimate of re-opening the facility or determine to permanently close the facility, which could occur as early as the fourth quarter of 2013, we would likely be required to record a significant non-cash impairment charge to write-down these assets to their new net realizable salvage value. We periodically assess the impairment of long-lived assets/asset groups when conditions indicate a possible loss. As part of the 2011 Global Plan, we believe we have adequately accrued all estimated cash expenses we expect in the future with respect to this facility in the event we decide to permanently close the facility. However, actual results could differ from our estimates.
51
Table of Contents
Foreign Currency Exchange Rates
As a result of our international operations, we generate a portion of our net sales and incur a portion of our expenses in currencies other than the U.S. dollar, including the Japanese Yen, New Taiwan Dollar, Euro, Korean Won and Malaysian Ringgit. Our results of operations are impacted by currency exchange rate fluctuations to the extent that we are unable to match net sales received in foreign currencies with expenses incurred in the same currency. For example, where we have significantly more expenses than net sales generated in a foreign currency, our profit from operations in that location would be adversely affected in the event that the U.S. dollar depreciates against that foreign currency. To protect against reductions in value and volatility of future cash flows caused by changes in foreign exchange rates, we have established transaction-based hedging programs. Our hedging programs reduce, but do not always eliminate, the impact of foreign currency exchange rate movements. We record the effects from changes in foreign currency exchange rates in our combined statement of operations in other, net.
In addition, since we present our combined financial statements in U.S. dollars, we must translate the assets, liabilities, net sales and expenses of a substantial portion of our foreign operations into U.S. dollars at applicable exchange rates. Consequently, increases or decreases in the value of the U.S. dollar may affect the value of these items with respect to our non-U.S. dollar businesses in our combined financial statements, even if their value has not changed in their local currency. For example, a stronger U.S. dollar will reduce the relative value of reported results of non-U.S. dollar operations and, conversely, a weaker U.S. dollar will increase the relative value of the non-U.S. dollar operations. These translations could significantly affect the comparability of our results between financial periods or result in significant changes to the carrying value of our assets, liabilities and equity.
Comparability of Historical Results and Our Relationship with SunEdison
We currently operate as a business segment of SunEdison. Our combined financial statements included in this prospectus have been derived from the consolidated financial statements and accounting records of SunEdison and include allocations for direct costs and indirect costs attributable to the operations of the semiconductor materials business of SunEdison. These combined financial statements do not purport to reflect what the results of operations, comprehensive income (loss), financial position, equity or cash flows would have been had we operated as a standalone public company during the periods presented. For a detailed description of the basis of presentation and an understanding of the limitations of the predictive value of the historical combined financial statements, see Notes 1 and 2 to our combined financial statements included elsewhere in this prospectus.
Our historical combined financial statements may also not be reflective of what our results of operations, comprehensive income (loss), financial position, equity or cash flows might be in the future as a standalone public company as a result of the following matters.
For the impact of certain of these anticipated differences, see “Unaudited Pro Forma Consolidated Financial Statements.” For additional information regarding the agreements that we will enter into with SunEdison to provide a framework for our ongoing relationship, see “Certain Relationships and Related Party Transactions.”
Centralized Support Functions
Our historical combined financial statements include expense allocations for certain support functions that were provided on a centralized basis within SunEdison, such as general corporate expenses related to communications, corporate administration, finance, legal, information technology, human resources, compliance, employee benefits and incentives, operations, research and development and stock compensation. These allocated costs are not necessarily indicative of the costs that we may incur in the future as a standalone public company. Following this offering, SunEdison will continue to provide us with some of the services related to
52
Table of Contents
these functions on a transitional basis pursuant to a transition services agreement, and we expect to incur other costs to replace the services and resources that will not be provided by SunEdison. We generally expect to use these services for approximately one to two years following the completion of this offering, depending on the type of service and the location at which such service is provided. However, we may agree with SunEdison to extend the service periods or may terminate such service periods by providing prior written notice. For additional information on the Transition Services Agreement, see “Certain Relationships and Related Party Transactions—Transition Services Agreement.”
During the period that SunEdison will provide services for us pursuant to the Transition Services Agreement, we expect to incur higher costs for certain services than the allocated costs included in our historical combined financial statements because we will incur additional expenses to build up our organization to perform such functions internally in addition to the amounts we will pay SunEdison for such services. After the termination of the Transition Services Agreement, we expect certain costs incurred to be lower than the allocated costs included in our historical combined financial statements because we believe we will be able to perform such functions at a lower cost than the allocated amounts.
Compensation and Benefit Plan Matters
During the periods presented, most of our employees were eligible to participate in various SunEdison benefit programs. Our historical combined financial statements include an allocation of the costs of such employee benefit plans. These costs were allocated based on our employee population for each of the periods presented. The allocated costs included in our historical combined financial statements could differ from amounts that would have been incurred by us if we operated on a stand-alone basis and are not necessarily indicative of costs to be incurred in the future. Since substantially all of SunEdison’s pension and other post-employment benefit plans relate solely to our employees, our combined balance sheets include net benefit obligations related to those plans and those benefit plans in certain foreign locations that are our direct obligations.
We expect to institute competitive compensation policies and programs as a standalone public company, the expense for which may differ from the compensation expense allocated by SunEdison in our combined financial statements. For a detailed description of our current compensation policies as a business segment of SunEdison and anticipated compensation policies following this offering, see “Executive Compensation.”
Public Company Expenses
As a result of this offering, we will become subject to the reporting requirements of the Exchange Act and the Sarbanes-Oxley Act. We will be required to establish procedures and practices as a standalone public company in order to comply with our obligations under those laws and the related rules and regulations. As a result, we will incur additional costs, including internal audit, investor relations, stock administration and regulatory compliance costs. These additional costs may differ from the costs that were historically allocated to us from SunEdison.
Polysilicon Costs
We have historically obtained our requirements for polysilicon primarily from SunEdison’s facility in Pasadena, Texas, as well as from other external polysilicon suppliers. We have reflected the price of polysilicon obtained from SunEdison in our historical cost of goods sold at prices which have historically trended above prevailing market prices. In connection with the Transactions, we will enter into an agreement with SunEdison pursuant to which we expect to continue to obtain polysilicon consistent with historical levels. Although the terms of such agreement are still being finalized, we expect that the pricing will be fixed for a period of time based on projected market prices and thereafter will be based on prevailing market prices, subject to certain limits on annual pricing changes. As a result, it is likely that our costs to obtain polysilicon will differ from the costs that were historically allocated to us from SunEdison. For additional information on the supply agreement, see “Certain Relationships and Related Party Transactions—Supply Agreement.”
53
Table of Contents
Income Taxes
The operations of our business have been included in the consolidated U.S. federal income tax return and certain foreign income tax returns of SunEdison. The income tax provisions and related deferred tax assets and liabilities that have been reflected in our historical combined financial statements have been computed as if we were a separate taxpayer using the “separate return” method. These amounts are not necessarily indicative of what our income tax provisions and related deferred tax assets and liabilities will be in the future following the completion of this offering. We intend to enter into a tax matters agreement with SunEdison immediately prior to the completion of this offering that will govern the parties’ respective rights, responsibilities and obligations with respect to tax liabilities and benefits, tax attributes, the preparation and filing of tax returns, the control of audits and other tax proceedings and other matters regarding taxes. For additional information on the tax matters agreement, see “Certain Relationships and Related Party Transactions—Tax Matters Agreement.”
Indebtedness
Our historical balance sheets include intercompany loans to and from SunEdison and long-term notes owed to a bank by our Japanese subsidiary. Our long-term intercompany borrowings with SunEdison and long-term notes were $76.0 million and $12.4 million as of June 30, 2013, respectively. We also have $181.6 million of various note receivables due from SunEdison as of June 30, 2013. Our total indebtedness will be settled in connection with the Transactions. In connection with the Financing Transactions, we expect to incur a significant amount of additional indebtedness under a $ million term loan. As a result, our interest expense after completion of the Transactions will increase significantly from those amounts reflected in our historical combined financial statements.
Key Components of our Combined Statement of Operations
Net Sales
We generate sales to non-affiliates primarily through the manufacture and sale of semiconductor wafers. Depending on market conditions, we also sell intermediate products, such as polysilicon, trichlorosilane, or TCS, gas, ingots and scrap wafers to semiconductor device and equipment makers, which sales have not been material to our results of operations following the shuttering of our Merano, Italy polysilicon facility in December 2011. In 2012, Samsung, TSMC and STMicroelectronics accounted for approximately 20%, 13% and 11%, respectively, of our net sales to non-affiliates.
Sales to our customers are generally governed by purchase orders or, in certain cases, agreements with terms of one year or less that include pricing terms and estimated quantity requirements. Our customer agreements generally do not require that a customer purchase a minimum quantity of wafers. We also sell silicon wafers to certain customers under consignment arrangements. These consignment arrangements generally require us to maintain a certain quantity of wafers in inventory at the customer’s facility or at a storage facility designated by the customer.
Sales to affiliates mainly represent polysilicon sales made to subsidiaries of SunEdison, which are subsequently sold to external parties. We sold these products on a cost plus basis for polysilicon mainly produced at our Merano, Italy polysilicon facility. Following the shuttering of our Merano, Italy polysilicon facility, our sales to affiliates are insignificant.
We recognize revenue for semiconductor wafer and other product sales when title transfers, the risks and rewards of ownership have been transferred to the customer, the fee is fixed or determinable and collection of the related receivable is reasonably assured, which is generally at the time of shipment for non-consignment orders. In the case of consignment orders, title passes when the customer pulls the product from the assigned storage facility or if the customer does not pull the product within a contractually stated period of time (generally 60–90 days) at the end of that period, or when the customer otherwise agrees to take title to the product.
54
Table of Contents
Costs and Expenses
Cost of Goods Sold
Our cost of goods sold consists principally of the following:
| • | Production Materials Costs. The cost of production materials relates to our cost of acquiring raw materials, components and semi-finished goods. While we purchase globally much of the raw materials used in production, these costs can be impacted by local market conditions. |
| • | Employee Costs. Employee costs include the salary costs and benefit charges, including stock-based compensation expense, for employees involved in manufacturing our products. We rely heavily on temporary employees in certain geographies, which gives us improved flexibility to meet shifts in demand. |
| • | Other. Our remaining cost of goods sold consists of production engineering activities, customer-related customization costs, depreciation of fixed assets, freight costs, operating lease expenses, outsourcing or subcontracting costs relating to services used by us on an occasional basis during periods of excess demand and other general manufacturing expenses, such as expenses for energy consumption. |
Marketing and Administration
Our marketing and administration expense consists of all expenditures incurred in connection with the sales and marketing of our products, as well as non-manufacturing related administrative overhead costs, including:
| • | Salary and Benefit Costs. These costs relate to salaries and benefits, including stock-based compensation expense, for sales personnel and administrative staff. Expenses relating to our sales personnel generally increase or decrease principally with changes in sales volume due to the need to increase or decrease sales personnel to meet changes in demand. Aggregate expenses relating to our administrative staff are generally less influenced by changes in sales volumes. We have reduced our administrative headcount over the past few years in connection with our restructuring activities. |
| • | Maintenance. Maintenance expenses relate to the use and maintenance of administrative offices. |
| • | Other Administrative Expenses. These costs include expenses relating to logistics and information systems, legal, compliance, audit and accounting expenses. |
| • | Other. Our remaining marketing and administration expenses consist of other selling and general advertising expenses, such as expenses incurred in connection with travel and communications. |
Changes in marketing and administration expenses as a percent of net sales have historically been impacted by a number of factors, including:
| • | Volume Changes. Higher volumes enable us to spread the fixed portion of our marketing and administration expense over more net sales. |
| • | Product Mix. Some products require more customer support and sales efforts than others so a change in product mix may affect marketing and administrative expenses. |
55
Table of Contents
| • | Customer Base. Changes in our customer base may affect the required level of sales and marketing support as new customers require more attention. |
| • | New Products. New product launches in existing and new markets typically involve more intense sales and marketing activity before they are integrated into customer applications. |
Research and Development
Research and development, or R&D, expense consists primarily of costs related to direct product development and application engineering. The development expense is typically associated with engineering labor, technology costs, capital expenditures and re-tooling costs for the development and advancement in the design of new products or processes to align our technology innovation efforts with our customers’ requirements for new and evolving applications. The level of R&D expense is related to the number of products in development, the stage of development process, the complexity of the underlying technology and the potential scale of the product upon successful commercialization. All R&D costs are expensed as incurred.
Restructuring (Reversals) Charges
Restructuring (reversals) charges consist primarily of (i) employee termination costs, including severance, outplacement and other one-time separation benefits, (ii) estimated liabilities and subsequent adjustments related to contract settlement, cancellation or termination payments and penalties and (iii) facility closure and curtailment and other exit costs. See “—Factors Affecting Our Results of Operations—Restructuring and Cost Improvement Initiatives.”
Long-Lived Asset Impairment Charges
When indicators of impairment exist, we perform reviews to determine whether the carrying value of an asset is impaired, based on comparisons to undiscounted expected future cash flows. If this comparison indicates that there is impairment, the impaired asset is written down to its estimated fair value, which is typically calculated using: (i) quoted market prices, including appraisals or (ii) discounted expected future cash flows utilizing an appropriate discount rate. Impairment is based on the excess of the carrying amount over the fair value of those assets. During 2011, due to the significance of the market downturn, we performed an asset impairment analysis of the polysilicon production assets at our Merano, Italy polysilicon facility. As a result of that analysis, we reduced the net carrying value of the Merano assets to its net realizable salvage value and incurred a charge of $221.4 million.
Non-Operating Expense (Income)
Non-operating expense (income) represents interest expense, interest income and other expenses, such as the effects from changes in foreign currency exchange rates and settlements of derivative foreign currency forward contracts. Interest expense has consisted primarily of interest expense on intercompany loans from SunEdison and other financing obligations. Interest expense also includes interest expense on liabilities arising from uncertain tax positions. Interest income represents interest earned on cash, cash equivalents and short-term money market investments and intercompany loans to SunEdison.
Income Taxes
The operations of our business have been included in the consolidated U.S. federal income tax return and certain foreign income tax returns of SunEdison. The income tax provisions and related deferred tax assets and liabilities that have been reflected in our historical combined financial statements have been estimated as if we were a separate taxpayer. We are subject to taxation in all geographies in which we operate, and as a standalone entity, will file tax returns in each jurisdiction in which we operate.
56
Table of Contents
Deferred income taxes arise because of a different tax basis of assets or liabilities between financial statement accounting and tax accounting, which are known as temporary differences. We record the tax effect of these temporary differences as deferred tax assets (generally items that can be used as a tax deduction or credit in future periods) and deferred tax liabilities (generally items for which we receive a tax deduction, but have not yet been recorded in the combined statement of operations). We regularly review our deferred tax assets for reliability, taking into consideration all available evidence, both positive and negative, including historical pre-tax and taxable income (losses), projected future pre-tax and taxable income (losses) and the expected timing of the reversals of existing temporary differences. In arriving at these judgments, the weight given to the potential effect of all positive and negative evidence is commensurate with the extent to which it can be objectively verified.
How We Assess the Performance of Our Business
In assessing the performance of our business, we consider a variety of performance and financial measures. Our principal performance measures include net sales and Adjusted EBITDA.
Net Sales
We evaluate net sales because it helps us measure the impact of general economic and industry trends and conditions, changes in our production volumes and product pricing, the effectiveness of our sales and marketing and R&D activities, the impact of new product introductions and technological innovations and the effect of competition over a given period. Our net sales from products include total sales less estimates of returns for product quality reasons and for price allowances. Our overall net sales are generally impacted by the following factors, among others:
| • | fluctuations in overall economic activity within the geographic markets in which we operate; |
| • | changes in production capacity within the semiconductor wafer industry; |
| • | changes in wafer average selling prices; |
| • | the number of semiconductors used within existing applications and the development of new applications requiring semiconductors; |
| • | the “mix” of products sold, including the proportion of new or upgraded products and their pricing relative to existing products; |
| • | changes in product sales prices (including quantity discounts, rebates and cash discounts for prompt payment); |
| • | changes in the level of competition faced by our products, including the launch of new products by competitors; |
| • | our ability to successfully develop and launch new products and applications; and |
| • | fluctuations in exchange rates. |
Adjusted EBITDA
We believe that Adjusted EBITDA is a useful performance measure and we use it to facilitate a comparison of our operating performance on a consistent basis from period-to-period and to provide for a more complete understanding of factors and trends affecting our business. We also use Adjusted EBITDA as one of the
57
Table of Contents
primary methods for planning and forecasting overall expected performance and for evaluating on a quarterly and annual basis actual results against such expectations, and is likely to be used as a performance evaluation metric in determining achievement of certain compensation programs and plans for employees, including our senior executives.
We define Adjusted EBITDA as earnings before net interest expense, income tax expense, depreciation and amortization, restructuring (reversals) charges, gain on receipt of property, plant and equipment, long-lived asset impairment charges and stock compensation expense. All of the omitted items are either (i) non-cash items or (ii) items that we do not consider reflective of our on-going operating performance. Because it omits non-cash items, we feel that Adjusted EBITDA is less susceptible to variances in actual performance resulting from depreciation, amortization and other non-cash charges and more reflective of our on-going operating performance.
The table below presents a reconciliation of net income (loss) attributable to SSI to Adjusted EBITDA for the years ended December 31, 2012 and 2011 and for the six months ended June 30, 2013 and 2012:
| For the Year Ended December 31, | For the Six Months Ended June 30, | |||||||||||||||
| 2012 | 2011 | 2013 | 2012 | |||||||||||||
| (unaudited) | (unaudited) | (unaudited) | (unaudited) | |||||||||||||
| (in millions) | ||||||||||||||||
| Net income (loss) attributable to SSI |
$ | 121.3 | $ | (557.9) | $ | (23.7) | $ | (38.5) | ||||||||
| Add: |
||||||||||||||||
| Interest expense, net |
(1.9) | 6.7 | (0.7) | (0.8) | ||||||||||||
| Income tax expense |
3.6 | 37.4 | 18.5 | 1.8 | ||||||||||||
| Depreciation and amortization |
118.7 | 144.3 | 58.3 | 59.0 | ||||||||||||
| Restructuring (reversals) charges |
(149.6) | 284.5 | (5.5) | — | ||||||||||||
| Gain on receipt of property, plant and equipment |
(31.7) | — | — | — | ||||||||||||
| Long-lived asset impairment charges |
1.5 | 234.7 | — | — | ||||||||||||
| Stock compensation expense |
13.0 | 20.5 | 6.5 | 5.8 | ||||||||||||
|
|
|
|
|
|
|
|
|
|||||||||
| Adjusted EBITDA |
$ | 74.9 | $ | 170.2 | $ | 53.4 | $ | 27.3 | ||||||||
|
|
|
|
|
|
|
|
|
|||||||||
Adjusted EBITDA is a non-GAAP financial measure. This measure should not be viewed as an alternative to GAAP measures of performance. The presentation of Adjusted EBITDA should not be construed as an inference that our future results will be unaffected by unusual or non-recurring items. Adjusted EBITDA has limitations as an analytical tool, and you should not consider it in isolation or as a substitute for analysis of our results as reported under GAAP. For a discussion of these limitations, see Note 3 in “Summary Historical and Pro Forma Financial Data.”
Results of Operations
Six Months Ended June 30, 2013, Compared with the Six Months Ended June 30, 2012
Net Sales
| For the Six Months Ended June 30, | Change | |||||||||||||
| 2013 | 2012 | Dollars | Percent | |||||||||||
| (dollars in millions) |
||||||||||||||
| Net sales to non-affiliates |
$ | 471.3 | $ | 454.5 | $ | 16.8 | 3.7% | |||||||
| Net sales to affiliates |
5.1 | 3.3 | 1.8 | 54.5% | ||||||||||
|
|
|
|
|
|
|
|||||||||
| Net sales |
$ | 476.4 | $ | 457.8 | $ | 18.6 | 4.1% | |||||||
|
|
|
|
|
|
|
|||||||||
58
Table of Contents
Net sales increased for the six months ended June 30, 2013 compared to the same period in the prior year primarily due to volume increases of $58.8 million, offset in large part by average selling price decreases of $35.0 million, as well as an aggregate amount of $7.0 million due to a decrease in net sales of intermediate byproducts of polysilicon and scrap wafers and a less favorable product mix due to a higher percentage of polished wafer sales. Unit volume increased across all wafer diameters as a result of increased sales to certain existing customers and improved market demand. Average selling price decreases occurred primarily with 300mm semiconductor wafers due to a competitive market environment, overcapacity and weakening of the Japanese Yen. As a result of the weakness of the Japanese Yen, overall industry prices decreased because wafers manufactured by Japanese suppliers became less expensive in markets outside of Japan. The average selling prices of our wafers for the six months ended June 30, 2013 were approximately 7.5% lower than the average selling prices for the same period in 2012.
Gross Profit
| For the Six Months Ended June 30, | Change | |||||||||||||
| 2013 | 2012 | Dollars | Percent | |||||||||||
| (dollars in millions) |
||||||||||||||
| Cost of goods sold |
$ | 422.5 | $ | 425.8 | $ | (3.3) | (0.8)% | |||||||
| Gross profit |
$ | 53.9 | $ | 32.0 | $ | 21.9 | 68.4% | |||||||
| Gross margin |
11.3% | 7.0% | ||||||||||||
Gross margin increased for the six months ended June 30, 2013 compared to the prior year period primarily due to reduced unit costs on higher sales volume, improved operational efficiencies and continued focus on manufacturing cost reductions, offset partially by lower average selling prices for our wafers.
Marketing and Administration
| For the Six Months Ended June 30, | Change | |||||||||||
| 2013 | 2012 | Dollars | Percent | |||||||||
| (dollars in millions) |
||||||||||||
| Marketing and administration |
$ | 48.4 | $ | 52.2 | $ (3.8) | (7.3)% | ||||||
| As a percentage of net sales |
10.2% | 11.4% | ||||||||||
Marketing and administration expenses decreased for the six months ended June 30, 2013 compared to the prior year period primarily due to lower spending on salary, benefits and other administrative costs as part of our restructuring efforts in connection with the 2011 Global Plan. These decreases occurred despite the fact that we recorded $4.0 million of insurance recoveries related to the earthquake and tsunami in Japan for the six months ended June 30, 2012 which reduced marketing and administration expense for the period. We had no similar insurance recoveries during the six months ended June 30, 2013.
Research and Development
| For the Six Months Ended June 30, | Change | |||||||||||
| 2013 | 2012 | Dollars | Percent | |||||||||
| (dollars in millions) |
||||||||||||
| Research and development |
$ | 18.7 | $ | 16.1 | $ 2.6 | 16.1% | ||||||
| As a percentage of net sales |
3.9% | 3.5% | ||||||||||
R&D expenses increased for the six months ended June 30, 2013 compared to the prior year period primarily due to spending to enhance our capabilities in advanced substrates and to broaden our product offerings. This increase in R&D spending primarily related to hiring additional engineers and purchasing test equipment to support advancing crystal capabilities in support of customer requirements, especially on larger diameter products.
59
Table of Contents
Restructuring (Reversals) Charges
| For the Six Months Ended June 30, | Change | |||||||
| 2013 | 2012 | Dollars | Percent | |||||
| (dollars in millions) |
||||||||
| Restructuring reversals |
$ (5.5) | $ — | $ (5.5) | n/m | ||||
Restructuring reversals increased for the six months ended June 30, 2013 compared to the prior year period primarily as a result of a reversal of liabilities related to the costs associated with the shuttering of our Merano, Italy polysilicon facility. The reversal was due to the reduction of certain take-or-pay obligations from the amount we previously estimated and accrued.
Non-Operating Expense (Income)
| For the Six Months Ended June 30, | Change | |||||||||||||
| 2013 | 2012 | Dollars | Percent | |||||||||||
| (dollars in millions) |
||||||||||||||
| Interest expense |
$ | 0.3 | $ | 0.5 | $ | (0.2) | (40.0)% | |||||||
| Interest income |
(0.2) | (0.4) | 0.2 | (50.0)% | ||||||||||
| Interest, net-affiliates |
(0.8) | (0.9) | 0.1 | (11.1)% | ||||||||||
| Other, net |
(4.1) | 1.4 | (5.5) | n/m | ||||||||||
|
|
|
|
|
|
|
|||||||||
| Total non-operating expense (income) |
$ | (4.8) | $ | 0.6 | $ | (5.4) | n/m | |||||||
|
|
|
|
|
|
|
|||||||||
Non-operating expense (income) decreased for the six months ended June 30, 2013 compared to the prior year period primarily due to the effects of changes in foreign currency exchange rates and related gains and losses on settlements of derivative foreign currency forward contracts which is recorded in other, net.
Income Taxes
| For the Six Months Ended June 30, | Change | |||||||||||||
| 2013 | 2012 | Dollars | Percent | |||||||||||
| (dollars in millions) |
||||||||||||||
| Income tax expense |
$ | 18.5 | $ | 1.8 | $ | 16.7 | 927.8% | |||||||
| Income tax rate as a percentage of loss before income taxes |
637.9% | 4.9% | ||||||||||||
Income tax expense increased for the six months ended June 30, 2013 compared to the same period in the prior year primarily due to taxable income in certain higher rate jurisdictions as a result of changes in the mix of worldwide operational earnings despite overall operating losses.
Year Ended December 31, 2012, Compared with Year Ended December 31, 2011
Net Sales
| For the Year Ended December 31, | Change | |||||||||||||
| 2012 | 2011 | Dollars | Percent | |||||||||||
| (dollars in millions) |
||||||||||||||
| Net sales to non-affiliates |
$ | 927.4 | $ | 1,051.3 | $ | (123.9) | (11.8)% | |||||||
| Net sales to affiliates |
6.8 | 147.0 | (140.2) | (95.4)% | ||||||||||
|
|
|
|
|
|
|
|||||||||
| Net sales |
$ | 934.2 | $ | 1,198.3 | $ | (264.1) | (22.0)% | |||||||
|
|
|
|
|
|
|
|||||||||
60
Table of Contents
Net sales to non-affiliates decreased for the year ended December 31, 2012 compared to the prior year period primarily due to semiconductor wafer price decreases totaling $101.3 million caused by softness in the semiconductor industry in 2012, as well as an aggregate amount of $22.6 million due to a decrease in net sales of intermediate byproducts of polysilicon and scrap wafers and, to a lesser extent, a less favorable product mix. Price decreases occurred across all wafer diameters. Our 2012 unit volumes were flat as compared to 2011, as unit volume increases for 300mm diameter wafers were offset by lower demand for 200mm and smaller diameter wafer. The average selling prices of our wafers for the year ended December 31, 2012 were approximately 10.0% lower than the average selling prices for the prior year.
Net sales to affiliates decreased for the year ended December 31, 2012 compared to the prior year primarily due to the shuttering of our Merano, Italy polysilicon facility during the fourth quarter of 2011.
Gross Profit
| For the Year Ended December 31, | Change | |||||||||||||
| 2012 | 2011 | Dollars | Percent | |||||||||||
| (dollars in millions) |
||||||||||||||
| Cost of goods sold |
$ | 852.4 | $ | 1,023.3 | $ | (170.9) | (16.7)% | |||||||
| Gross profit |
$ | 81.8 | $ | 175.0 | $ | (93.2) | (53.3)% | |||||||
| Gross margin |
8.8% | 14.6% | ||||||||||||
Gross margin decreased for the year ended December 31, 2012 compared to the prior year primarily due to declines in average selling prices of our wafers and sales of intermediate byproducts of polysilicon and scrap wafers, partially offset by lower overhead costs as a result of our restructuring efforts under the 2011 Global Plan.
Marketing and Administration
| For the Year Ended December 31, | Change | |||||||||||||
| 2012 | 2011 | Dollars | Percent | |||||||||||
| (dollars in millions) |
||||||||||||||
| Marketing and administration |
$ | 100.7 | $ | 129.9 | $ | (29.2) | (22.5)% | |||||||
| As a percentage of net sales |
10.8% | 10.8% | ||||||||||||
Marketing and administration expenses decreased for the year ended December 31, 2012 compared to the prior year primarily as a result of lower spending on salary, benefits and other administrative costs as a result of our restructuring efforts under the 2011 Global Plan, as well as the absence of $11.3 million of incremental costs related to repair and maintenance as a consequence of the earthquake and tsunami in Japan and $4.7 million of charges associated with an unfavorable litigation outcome which we incurred in 2011. For the years ended December 31, 2012 and 2011, we recorded $4.0 million and $4.0 million, respectively, of insurance recoveries related to the earthquake and tsunami charges referenced above.
Research and Development
| For the Year Ended December 31, | Change | |||||||||||||||
| 2012 | 2011 | Dollars | Percent | |||||||||||||
| (dollars in millions) |
||||||||||||||||
| Research and development |
$ 33.4 | $ 38.2 | $ (4.8) | (12.6)% | ||||||||||||
| As a percentage of net sales |
3.6% | 3.2% | ||||||||||||||
61
Table of Contents
R&D expenses decreased in dollars for the year ended December 31, 2012 compared to the prior year primarily due to our restructuring efforts under the 2011 Global Plan, including the reduction in R&D overhead allocation as a result of a reduced manufacturing footprint at our St. Peters, Missouri facility. R&D expenses increased as a percentage of net sales due to the decrease in net sales.
Restructuring (Reversals) Charges
| For the Year Ended December 31, | Change | |||||||||||||||
| 2012 | 2011 | Dollars | Percent | |||||||||||||
| (dollars in millions) |
||||||||||||||||
| Restructuring (reversals) charges |
$ (149.6) | $ 284.5 | $ (434.1) | (152.6)% | ||||||||||||
We recorded restructuring reversals for the year ended December 31, 2012 as a result of our settlement agreement with Evonik, which resulted in $65.8 million of income within restructuring charges. In addition, we recorded approximately $75.7 million of income within restructuring charges due to the favorable settlement of a polysilicon supply agreement with a subsidiary of SunEdison. We also had $8.1 million of other net favorable revisions to our estimated restructuring liabilities based on actual results differing from our previous estimates.
We recorded $284.5 million of restructuring charges in 2011 in connection with the 2011 Global Plan which consisted of $182.9 million of contract settlements, $54.5 million of severance and other one-time benefits for terminated employees, cancellation or termination payments and penalties, as well as $44.4 million of other one-time charges as a result of our committed actions. We also recorded $2.7 million of additional restructuring charges relating to other restructuring activities.
Gain on Receipt of Property, Plant and Equipment
| For the Year Ended December 31, | Change | |||||||||||||||
| 2012 | 2011 | Dollars | Percent | |||||||||||||
| (dollars in millions) |
||||||||||||||||
| Gain on receipt of property, plant and equipment |
$ (31.7) | $ — | $ (31.7) | n/m | ||||||||||||
We recognized $31.7 million of gain on receipt of property, plant and equipment for the year ended December 31, 2012 as a result of the chlorosilanes plant we received in connection with our settlement with Evonik. No similar amounts were recorded for the year ended December 31, 2011.
Long-lived Asset Impairment Charges
| For the Year Ended December 31, | Change | |||||||||||||
| 2012 | 2011 | Dollars | Percent | |||||||||||
| (dollars in millions) |
||||||||||||||
| Long-lived asset impairment charges |
$ 1.5 | $ 234.7 | $ (233.2) | (99.4)% | ||||||||||
We recorded asset impairment charges of $1.5 million for the year ended December 31, 2012, primarily related to elements of our enterprise software that we no longer use. We reduced the net carrying value of our Merano, Italy polysilicon facility to its net realizable salvage value for the year ended December 31, 2011 due to the significant market downturn and our decision to shutter its operations which accounted for the majority of the long-lived asset impairments charges in 2011.
62
Table of Contents
Non-operating Expense (Income)
| For the Year Ended December 31, | Change | |||||||||||||
| 2012 | 2011 | Dollars | Percent | |||||||||||
| (dollars in millions) | ||||||||||||||
| Interest expense |
$ | 1.0 | $ | 5.9 | $ | (4.9) | (83.1)% | |||||||
| Interest income |
(0.7) | (1.0) | 0.3 | (30.0)% | ||||||||||
| Interest (income) expense, net - affiliates |
(2.2) | 1.8 | (4.0) | n/m | ||||||||||
| Other, net |
3.1 | (0.8) | 3.9 | n/m | ||||||||||
|
|
|
|
|
|
|
|||||||||
| Total non-operating expense |
$ | 1.2 | $ | 5.9 | $ | (4.7) | (79.7)% | |||||||
|
|
|
|
|
|
|
|||||||||
Total non-operating expense decreased for the year ended December 31, 2012 compared to the prior year primarily due to lower interest expense as a result of the cancellation of a capitalized lease arrangement during the fourth quarter of 2011 as part of the 2011 Global Plan. For the year ended December 31, 2011, we incurred $5.4 million of capitalized lease interest expense pertaining to this lease arrangement. In addition, the interest expense to affiliates was reduced in 2012 as a result of changes in intercompany loans to and from SunEdison. This decrease in non-operating expense was offset in part by the effects of changes in foreign currency exchange rates and related gains and losses on settlements of derivative foreign currency forward contracts as reflected in other, net.
Income Taxes
| For the Year Ended December 31, | Change | |||||||||||||
| 2012 | 2011 | Dollars | Percent | |||||||||||
| (dollars in millions) | ||||||||||||||
| Income tax expense |
$ | 3.6 | $ | 37.4 | $ | (33.8) | (90.4)% | |||||||
| Income tax rate as a percentage of income (loss) before income taxes |
2.9% | (7.2)% | ||||||||||||
Income tax expense decreased for the year ended December 31, 2012 compared to the prior year primarily due to a net decrease to the reserve for uncertain tax positions of $4.2 million, which offset the tax effects of changes in the mix of worldwide operational earnings. Although we recognized restructuring and impairment charges of $519.2 million for the year ended December 31, 2011, we were not able to record the tax benefit because the majority of the deferred tax assets related to those losses cannot be utilized for the foreseeable future.
Certain of our Asian subsidiaries have been granted a concessionary tax rate of 0% on all qualifying income for a period of up to five to ten years based on investments in certain plant and equipment and other development and expansion activities, resulting in a tax benefit for 2012 and 2011 of approximately $4.6 million and $6.6 million, respectively. Under the awards, the income tax rate for qualifying income will be taxed at an incentive tax rate lower than the corporate tax rate. We are in compliance with the qualifying condition of the tax incentives. The last of these incentives will expire between 2013 and 2022.
Liquidity and Capital Resources
During all of the periods presented, our operations and other liquidity requirements were funded on a collective basis with those of SunEdison’s solar energy business. We participated in SunEdison’s centralized cash management system, and generally all of our excess cash was transferred to SunEdison on a daily basis. We funded our cash disbursements for operations and/or investing activities with advances from SunEdison.
In connection with the Transactions, we intend to enter into a new senior credit facility with a syndicate of banks providing for (i) a 3-year $ million senior secured revolving credit facility and (ii) a 7-year $ million senior secured term loan. The new senior credit facility will contain customary financial and other covenants, including a maximum total leverage ratio and a minimum interest coverage ratio. Proceeds from
63
Table of Contents
borrowings under the term loan will be used to fund a portion of the payment we will make to SunEdison in connection with the Transactions. We do not expect to have any borrowings outstanding under the revolving credit facility upon completion of this offering. We currently do not have commitments from any prospective lenders with respect to the new senior credit facility but expect to obtain such commitments over the next several months. See “Description of Certain Indebtedness—New Senior Credit Facility.”
We expect our primary sources of liquidity in the future will be cash generated from operations, available borrowings under our new senior credit facility and other future financing arrangements, if necessary. Our principal uses of liquidity will be to fund our working capital and capital expenditures and service our outstanding indebtedness. We believe our liquidity will be sufficient to fund our operations for at least the next twelve months. Our ability to continue to fund these items may be affected by general economic, competitive and other factors, many of which are outside of our control. If our future cash flows from operations and other capital resources are insufficient to fund our liquidity needs, we may be forced to reduce or delay our capital expenditures, sell assets, obtain additional debt or equity capital or refinance all or a portion of our debt.
The cash and cash equivalents presented in this section are historical amounts recorded by SunEdison subsidiaries dedicated to the semiconductor materials business. Cash and cash equivalents as of June 30, 2013 totaled $55.2 million, compared to $103.2 million as of December 31, 2012. The cash and cash equivalents for both periods were all held by our foreign subsidiaries and a portion may be subject to repatriation tax effects. We believe that any repatriation tax effects would have minimal impacts on future cash flows.
For a discussion of our cash and cash equivalents on a pro forma basis as of June 30, 2013 giving effect to the Transactions, see “Unaudited Pro Forma Consolidated Financial Statements.”
As of December 31, 2012, we had approximately $19.2 million of committed capital expenditures. Capital expenditures in 2012 and committed capital expenditures for 2013 primarily relate to increasing our manufacturing capacity and expanding capability for our next generation projects.
The table below sets forth our summary cash flow information for the six months ended June 30, 2013 and 2012 and for the years ended December 31, 2012 and 2011.
| For the Six Months Ended June 30, |
For the Year Ended December 31, |
|||||||||||||||
| 2013 | 2012 | 2012 | 2011 | |||||||||||||
| (in millions) | ||||||||||||||||
| Net cash provided by (used in): |
||||||||||||||||
| Operating activities |
$ | 19.8 | $ | (20.4 | ) | $ | 46.1 | $ | 171.8 | |||||||
| Investing activities |
$ | (83.5 | ) | $ | (92.1 | ) | $ | (145.5 | ) | $ | (297.1 | ) | ||||
| Financing activities |
$ | 19.9 | $ | 130.4 | $ | 153.1 | $ | (53.3 | ) | |||||||
Net Cash Provided by (Used in) Operating Activities
Net cash provided by operating activities for the six months ended June 30, 2013 was attributable in part to our net loss of $21.4 million adjusted for non-cash items, including $58.3 million of depreciation and amortization and $6.5 million of stock compensation expense. Uses of cash included a $35.8 million decrease in restructuring liabilities driven primarily by cash payments to settle supply contract obligations and a $18.1 million increase in affiliate accounts receivable driven by timing of intercompany collections from SunEdison determined by intercompany operational needs. We generated cash from a $40.0 million increase in affiliate accounts payable attributable to timing of intercompany payments to SunEdison determined by our operational needs and a $8.5 million decrease in accounts receivable driven by the timing of collections of customer receivables.
64
Table of Contents
Net cash used in operating activities for the six months ended June 30, 2012 was attributable in part to our net loss of $38.7 million adjusted for non-cash items, including $59.0 million of depreciation and amortization, an $8.8 million benefit for deferred income taxes and $5.8 million of stock compensation expense. Uses of cash included a $27.9 million decrease in accounts payable and accrued liabilities related to timing of payments to suppliers determined by intercompany operational needs and a $15.2 million decrease in restructuring liabilities related to cash payments associated with the 2011 Global Plan. We generated cash from a $19.0 million increase in affiliate accounts payable driven by timing of the intercompany payments to SunEdison determined by our operational needs.
Net cash provided by operating activities for the year ended December 31, 2012 was attributable in part to our net income of $122.7 million adjusted for non-cash items, including $118.7 million of depreciation and amortization and a $31.7 million gain on receipt of property, plant and equipment. Uses of cash included a $146.5 million decrease in restructuring liabilities driven by payments to settle supply contract obligations and a decrease of $71.6 million for affiliate accounts receivable driven by the timing of intercompany collections from SunEdison determined by intercompany operational needs. We generated cash from a $41.3 million increase in accounts payable payments to SunEdison determined by our operational needs and a $34.0 million decrease in inventory primarily attributable to improved inventory management.
Net cash provided by operating activities for the year ended December 31, 2011 was attributable in part to our net loss of $555.6 million adjusted for non-cash items, including $248.8 million of long-lived asset impairment charges, $144.3 million of depreciation and amortization, $20.5 million of stock compensation expense and a $15.1 million provision for deferred income taxes. Uses of cash included a $42.9 million increase in inventory primarily as a result of reduced demand. We generated cash from a $280.5 million increase in restructuring liabilities related to the 2011 Global Plan and a $58.2 million decrease in accounts receivable related to timing of collections of customer receivables.
Net Cash Used in Investing Activities
Notes redeemable from SunEdison are reflected as investing activities in the combined cash flow statements.
Net cash used in investing activities for the six months ended June 30, 2013 consisted of $62.1 million of capital expenditures to further the advancement of our next generation products and a $21.4 million increase in affiliate notes receivable. Net cash used in investing activities for the six months ended June 30, 2012 primarily consisted of $45.8 million of capital expenditures to further the advancement of our next generation products and a $45.0 million increase in affiliate notes receivable.
Net cash used in investing activities for the year ended December 31, 2012 primarily consisted of $95.2 million in capital expenditures to further the advancement of our next generation products and a $46.7 million increase in affiliate notes receivable. Net cash used in investing activities for the year ended December 31, 2011 consisted of $187.1 million in capital expenditures and a $110.0 million increase in affiliate notes receivable. The increased capital expenditures for the year ended December 31, 2011 was primarily related to expansion activities undertaken at our Merano, Italy polysilicon facility.
Net Cash Provided by (Used in) Financing Activities
Borrowings from SunEdison are reflected as financing activities in the combined cash flow statements.
Net cash provided by financing activities for the six months ended June 30, 2013 primarily consisted of $21.3 million net parent investment proceeds from SunEdison. Net cash provided by financing activities for the six months ended June 30, 2012 primarily consisted of $132.2 million net parent investment proceeds from SunEdison.
Net cash provided by financing activities for the year ended December 31, 2012 primarily consisted of $154.6 million net parent investment proceeds from SunEdison. Net cash used in financing activities for the year ended December 31, 2011 primarily consisted of $50.6 million net parent investment contributions to SunEdison.
65
Table of Contents
Debt Obligations
We had an aggregate of $12.4 million, $16.0 million and $21.5 million of indebtedness outstanding as of June 30, 2013 and December 31, 2012 and 2011, respectively, which indebtedness was owed to a bank by our Japanese subsidiary. The indebtedness is guaranteed by SunEdison and is secured by the property, plant and equipment of our Japanese subsidiary. The guarantees require SunEdison to satisfy the loan obligations in the event that the Japanese subsidiary fails to pay such debt in accordance with its stated terms. The cost of borrowing is a fixed 2.2% interest rate and the notes mature in 2017. There are no debt covenants related to this loan. We will repay all of this indebtedness and terminate these loans in connection with the Transactions.
Indebtedness – Affiliates
We have various note receivables from certain SunEdison subsidiaries. As of June 30, 2013, December 31, 2012 and December 31, 2011, we had $181.6 million, $158.5 million and $111.5 million, respectively, of note receivables due from affiliates. Interest is calculated based on fixed rates ranging from 2% to 3%. The notes have maturities of one year or less but are usually renewed and are therefore considered long-term. We also have long-term intercompany borrowings with SunEdison of $76.0 million, $129.4 million and $127.3 million as of June 30, 2013, December 31, 2012 and December 31, 2011, respectively. The weighted-average costs of borrowing were 0.5%, 0.5% and 1.4% as of June 30, 2013, December 31, 2012 and December 31, 2011, respectively. Interest is determined based on the Euribor one year rate. The payments on long-term affiliate debt are due in 2049. There are no guarantees or debt covenants related to these intercompany borrowings. All intercompany indebtedness will be settled in connection with the Transactions.
Collateralized Debt Obligations
Certain of our assets are pledged as collateral under SunEdison’s revolving credit facility and second lien term loan credit agreement. The indebtedness related to these SunEdison debt obligations has not been allocated to us but our pledged assets may be seized or sold in the event SunEdison defaults on these debt obligations to satisfy the guaranteed obligations. However, we do not believe it is likely SunEdison will default on these debt obligations. Upon consummation of the Transactions, these assets will no longer be pledged as collateral under SunEdison’s credit facility or term loan.
Contractual Obligations and Commitments
Except as otherwise noted, our contractual obligations as of December 31, 2012 were as follows:
| Payments Due by Period | ||||||||||||||||||||
| Contractual obligations: |
Total | Less than 1 Year |
1-3 Years |
3-5 Years |
5 Years or More |
|||||||||||||||
| (in millions) | ||||||||||||||||||||
| Long-term debt (1) |
$ | 16.0 | $ | 3.4 | $ | 6.8 | $ | 5.8 | $ | — | ||||||||||
| Debt-affiliates, net (2) |
||||||||||||||||||||
| Operating leases |
22.3 | 5.8 | 9.6 | 5.1 | 1.8 | |||||||||||||||
| Purchase obligations (3) |
121.5 | 106.5 | 8.9 | 5.9 | 0.2 | |||||||||||||||
| Employee related liabilities (4) |
94.8 | — | — | — | — | |||||||||||||||
| Other long-term liabilities—uncertain tax positions (5) |
1.8 | 1.8 | — | — | — | |||||||||||||||
| Customer deposits (6) |
10.9 | 10.9 | — | — | — | |||||||||||||||
|
|
|
|
|
|
|
|
|
|
|
|||||||||||
| Total contractual obligations |
$ | 267.3 | $ | 128.4 | $ | 25.3 | $ | 16.8 | $ | 2.0 | ||||||||||
|
|
|
|
|
|
|
|
|
|
|
|||||||||||
| (1) | Amounts exclude accrued interest. In connection with the Transactions, we expect to incur a senior secured term loan in an aggregate principal amount of $ million. See “Capitalization” and “Unaudited Pro Forma Consolidated Financial Statements.” |
66
Table of Contents
| (2) | As of December 31, 2012, our notes receivable, affiliate was greater than our long-term debt, affiliate. As a result, we were in a net receivable position. See Note 13 to our combined financial statements included elsewhere in this prospectus. |
| (3) | Represents obligations for agreements to purchase goods or services that are enforceable and legally binding on us, including minimum quantities at fixed prices to be purchased, committed capital expenditures, and outstanding purchases for goods or services as of December 31, 2012. In addition to the above purchase obligations, in connection with the 2011 Global Plan, we no longer take supplies or materials for a number of purchase agreements. We have notified our vendors of our intent not to procure these materials and we have accrued $69.5 million related to these contracts, which includes the remaining payable for the Evonik settlement. Pursuant to the Evonik settlement, we forfeited a deposit of $10.2 million and agreed to pay Evonik a total of 70.0 million Euro, of which 25.0 million Euro was paid in 2012, 10.0 million Euro was paid in the first quarter of 2013 and 20.0 million Euro was paid in the second quarter of 2013. The remaining 15.0 million Euro will be paid in the third quarter of 2013. These agreements either do not have stated fixed quantities and prices, have termination provisions, or require the vendor to mitigate losses by selling the materials to other parties. The actual amounts ultimately settled with these vendors could vary significantly, which could have a material adverse impact on our future earnings and cash flows. |
| (4) | Employee related liabilities include pension, health and welfare benefits and other post-employment benefits. Other than pensions, the employee related liabilities are paid as incurred and accordingly, specific future years’ payments are not reasonably estimable. Funding projections beyond the next 12 months as of December 31, 2012 are not practical to estimate due to the rules affecting tax-deductible contributions and the impact from the plan asset performance, interest rates and potential U.S. and international legislation. |
| (5) | As of December 31, 2012, $1.8 million of unrecognized tax benefits were included as a component of other long-term liabilities. Due to the inherent uncertainty of the underlying tax positions, we are unable to reasonably estimate in which future periods these unrecognized tax benefits will be settled. |
| (6) | Customer deposits consist of amounts provided in connection with long-term supply agreements which must be returned to the customers according to the terms of the agreements. |
The contractual commitments shown above, except for our debt obligations, employee related liabilities, uncertain tax positions and customer deposits, are not recorded on our combined balance sheet.
We have agreed to indemnify some of our customers against claims of infringement of the intellectual property rights of others in our sales contracts with these customers. The terms of most of these indemnification obligations generally do not provide for a limitation of our liability. We have not had any claims related to these indemnification obligations as of June 30, 2013.
Our pension expense and pension liability are actuarially determined. See “—Critical Accounting Policies and Estimates.” Effective January 2, 2002, SunEdison amended its defined benefit plan to discontinue future benefit accruals for certain participants. In addition, effective January 2, 2002, no new participants were added to that plan. Effective January 1, 2012, SunEdison amended the defined benefit pension plan to freeze the accumulation of new benefits for all participants. This change did not have a material impact on our historical combined financial statements.
Critical Accounting Policies and Estimates
The preparation of financial statements in conformity with accounting principles generally accepted in the United States requires us to make estimates and assumptions in certain circumstances that affect amounts reported in our combined financial statements and related footnotes. In preparing these combined financial statements, we have made our best estimates of certain amounts included in the combined financial statements. Application of accounting policies and estimates, however, involves the exercise of judgment and use of assumptions as to future uncertainties and, as a result, actual results could differ from these estimates. In arriving at our critical accounting estimates, factors we consider include how accurate the estimate or assumptions have
67
Table of Contents
been in the past, how much the estimate or assumptions have changed and how reasonably likely such change may have a material impact. Our significant accounting policies are more fully described in Note 2 of Notes to Combined Financial Statements herein.
Revenue Recognition
We recognize revenue for wafer and other product sales when title transfers, the risks and rewards of ownership have been transferred to the customer, the fee is fixed or determinable and collection of the related receivable is reasonably assured, which is generally at the time of shipment for non-consignment orders. In the case of consignment orders, title passes when the customer pulls the product from the assigned storage facility or storage area or, if the customer does not pull the product within a contractually stated period of time (generally 60–90 days) at the end of that period, or when the customer otherwise agrees to take title to the product. Our wafers are generally made to customer specifications, and we conduct rigorous quality control and testing procedures to ensure that the finished wafers meet the customer’s specifications before the product is shipped. We consider international shipping term definitions in our determination of when title passes. We also defer revenue when pricing is not fixed or determinable or other revenue recognition criteria are not met.
Expense Allocations
Our combined financial statements include expenses of SunEdison that were allocated to us for certain functions, including general corporate expenses related to communications, corporate administration, finance, legal, information technology, human resources, compliance, employee benefits and incentives, operations, research and development and stock compensation. These expenses were allocated in our historical results of operations on the basis of direct usage, where identifiable, with the remainder primarily allocated on the basis of revenue or other related sales metrics, headcount or number of our manufacturing plants. We consider the expense allocation methodology and results to be reasonable for all periods presented. However, these allocations may not necessarily be indicative of the actual expenses we would have incurred as an independent publicly traded company during the periods prior to this offering or of the costs we will incur in the future. No significant restructuring or impairment charges were included in these allocations from SunEdison.
Inventories
Inventories consist of raw materials, labor and manufacturing overhead and are valued at the lower of cost or market. Fixed overheads are allocated to the costs of conversion based on the normal capacity of our production facilities. Unallocated overheads during periods of abnormally low production levels are recognized as cost of goods sold in the period in which they are incurred. Raw materials and supplies are generally stated at weighted-average cost and goods in process and finished goods inventories are stated at standard cost as adjusted for variances, which approximate weighted-average actual cost. The valuation of inventory requires us to estimate excess and slow moving inventory. The determination of the value of excess and slow moving inventory is based upon assumptions of future demand and market conditions. If actual market conditions are less favorable than those projected by management, additional inventory write-downs may be required.
Property, Plant and Equipment
We record property, plant and equipment at cost and depreciate it evenly over the assets’ estimated useful lives as follows:
| Years | ||||
| Software |
3-10 | |||
| Buildings and improvements |
2-50 | |||
| Machinery and equipment |
1-30 | |||
68
Table of Contents
Expenditures for repairs and maintenance are charged to expense as incurred. Additions and betterments are capitalized. The cost and related accumulated depreciation on property, plant and equipment sold or otherwise disposed of are removed from the asset accounts and any gain or loss is reported in current-year operations. Leasehold improvements are depreciated over the shorter of the estimated useful life of the asset or the remaining lease term, including renewal periods considered reasonably assured of execution.
Depreciation expense for the years ended December 31, 2012 and 2011 was $118.7 million and $144.3 million, respectively. Depreciation expense was lower in 2012 compared to 2011 primarily due to the fixed asset impairments we incurred in 2011 related to the shuttering of our Merano, Italy polysilicon facility.
Impairment of Property, Plant and Equipment
We periodically assess the impairment of long-lived assets/asset groups when conditions indicate a possible loss. Reviews are performed to determine whether the carrying value of an asset is impaired, based on comparisons to undiscounted expected future cash flows. If this comparison indicates that there is impairment, the impaired asset is written down to its estimated fair value, which is typically calculated using: (i) quoted market prices, including appraisals or (ii) discounted expected future cash flows utilizing an appropriate discount rate. Impairment is based on the excess of the carrying amount over the fair value of those assets.
Income Taxes
SunEdison files consolidated income tax returns that include us. For purposes of these combined financial statements, our taxes are computed and reported using a “separate return” method, or as though we filed a separate return for jurisdictions in which its operations are included in consolidated returns filed by SunEdison. We also record income taxes for foreign jurisdictions in which any of our consolidated subsidiaries files separate returns. Income taxes as presented herein allocate current and deferred income taxes of SunEdison to us in a manner that is systematic, rational and consistent with the asset and liability method in accordance with FASB Accounting Standards Codification 740 (“ASC 740”), Accounting for Income Taxes. The sum of the amounts allocated to the carve-out tax provisions may not equal the historical consolidated provision. Under the separate return method, deferred tax assets and liabilities are recognized for the future tax consequences attributable to differences between the financial statement carrying amounts of existing assets and liabilities and their respective tax bases and operating loss carry forwards. Deferred tax assets and liabilities are measured using enacted tax rates expected to apply to taxable income in the years in which those temporary differences are expected to be recovered or settled. The effect on deferred tax assets and liabilities of a change in tax rate is recognized in operations in the period that includes the enactment date. Valuation allowances are established when management determines that it is more likely than not that some portion, or all of the deferred tax asset, will not be realized. The financial effect of changes in tax laws or rates is accounted for in the period of enactment.
Deferred income taxes arise primarily because of differences in the bases of assets or liabilities between financial statement accounting and tax accounting which are known as temporary differences. We record the tax effect of these temporary differences as deferred tax assets (generally items that can be used as a tax deduction or credit in future periods) and deferred tax liabilities (generally items for which we receive a tax deduction, but have not yet been recorded in the combined statement of operations). We regularly review our deferred tax assets for realizability, taking into consideration all available evidence, both positive and negative, including historical pre-tax and taxable income (losses), projected future pre-tax and taxable income (losses) and the expected timing of the reversals of existing temporary differences. In arriving at these judgments, the weight given to the potential effect of all positive and negative evidence is commensurate with the extent to which it can be objectively verified.
We believe our tax positions are in compliance with applicable tax laws and regulations. Tax benefits are recognized only for tax positions that are more likely than not to be sustained upon examination by tax authorities. The amount recognized is measured as the largest amount of benefit that is greater than 50 percent
69
Table of Contents
likely to be realized upon ultimate settlement. Unrecognized tax benefits are tax benefits claimed in our tax returns that do not meet these recognition and measurement standards. Uncertain tax benefits, including accrued interest and penalties, are included as a component of other long-term liabilities because we do not anticipate that settlement of the liabilities will require payment of cash within the next 12 months. The accrual of interest begins in the first reporting period that interest would begin to accrue under the applicable tax law. Penalties, when applicable, are accrued in the financial reporting period in which the uncertain tax position is taken on a tax return. We recognize interest and penalties related to uncertain tax positions in income tax expense, which is consistent with our historical policy. We believe that our income tax accrued liabilities, including related interest, are adequate in relation to the potential for additional tax assessments. There is a risk, however, that the amounts ultimately paid upon resolution of audits could be materially different from the amounts previously included in our income tax expense and, therefore, could have a material impact on our tax provision, net (loss) income and cash flows. We review our accrued liabilities quarterly, and we may adjust such liabilities due to proposed assessments by tax authorities, changes in facts and circumstances, issuance of new regulations or new case law, negotiations between tax authorities of different countries concerning our transfer prices between our subsidiaries, the resolution of entire audits, or the expiration of statutes of limitations. Adjustments are most likely to occur in the year during which major audits are closed.
Management reviewed its policy for repatriation of all our subsidiaries in view of the restructuring announcement made in December 2011 and determined that the undistributed earnings of all our foreign subsidiaries were not expected to be remitted to the U.S. parent corporation in the foreseeable future. During the first six months of 2013, we determined the undistributed earnings of one of our foreign wholly owned subsidiaries would be remitted to the United States in the foreseeable future. The undistributed earnings of all other foreign subsidiaries are not expected to be remitted to the U.S. parent corporation in the foreseeable future. We plan foreign remittance amounts based on projected cash flow needs as well as the working capital and long-term investment requirements of our foreign subsidiaries and our domestic operations.
We have made our best estimates of certain income tax amounts included in the combined financial statements. Application of our accounting policies and estimates, however, involves the exercise of judgment and use of assumptions as to future uncertainties and, as a result, actual results could differ from these estimates. In arriving at our estimates, factors we consider include how accurate the estimate or assumptions have been in the past, how much the estimate or assumptions have changed and how reasonably likely such change may have a material impact.
Employee-Related Liabilities
We have a long-term net liability for our consolidated defined benefit pension and other post-employment benefit plans. Our obligations are funded in accordance with provisions of federal law. We recognize the overfunded or underfunded status of a defined benefit postretirement plan as an asset or liability in our statement of financial position and recognize changes in that funded status in the year in which the changes occur through comprehensive income.
Our pension and other post-employment liabilities are determined using various actuarial assumptions, including the discount rate, rate of salary increase, and expected return on assets, to estimate our costs and obligations. If the assumptions do not materialize as expected, expenditures and costs that we incur could differ from our current estimates. We determine the expected return on plan assets based on the pension plans’ actual asset mix as of the beginning of the year. While the assumed expected rate of return on the U.S. Pension plan assets was 8.5% in both 2012 and 2011, the actual return experienced in the pension plan assets in the comparable periods in 2012 and 2011 was 12.8% and (1.3)%, respectively. We consult with the plans’ actuaries to determine a discount rate assumption that reflects the characteristics of these plans, including expected cash outflows from the plans, and utilize an analytical tool that incorporates the concept of a hypothetical yield curve, developed from corporate bond (AA quality) yield information. Assuming a 100 basis point increase in these
70
Table of Contents
assumptions, our 2012 pension expense would have been approximately $1.2 million lower. Assuming a 100 basis point decrease in these assumptions, our 2012 pension expense would have been approximately $1.2 million higher.
Effective January 1, 2012, the amortization period for the unamortized loss was changed to the average future life expectancy of the active plan participants, which was derived from an actuarial mortality table. This change was triggered by the small number of active plan participants relative to the total plan participants. Prior to 2012, the amortization period was derived based on the average remaining service period of the active participants expected to receive benefits. This change has reduced the amortization expense related to the unrealized loss.
Stock-Based Compensation
Our combined financial statements include certain expenses of SunEdison that were allocated to us for stock compensation. Stock-based compensation expense for all share-based payment awards is based on the estimated grant-date fair value. These compensation costs are recognized net of an estimated forfeiture rate and recognize the compensation costs for only those shares expected to vest on a straight-line basis over the requisite service period of the award, which is generally the option vesting term. Stock-based compensation expense is recognized for all grants on a straight-line basis over the requisite service period of the entire award for ratable awards. Compensation expense for awards with market or performance conditions reflects the estimated probability that the market and/or performance conditions will be met and is recognized ratably over the service period(s) of the award. Future forfeiture rates are estimated taking into consideration the historical experience during the preceding four fiscal years. For market condition awards, the grant date fair value was calculated for these awards using a probabilistic approach under a Monte-Carlo simulation taking into consideration volatility, interest rates and expected term.
Determining the appropriate fair value model and calculating the fair value of share-based payment awards require the making of subjective assumptions, including the expected life of the share-based payment awards and stock price volatility. The assumptions used in calculating the fair value of share-based payment awards represent management’s best estimates, but these estimates involve inherent uncertainties and the application of management judgment. As a result, if factors change and we use different assumptions, our stock-based compensation expense could be materially different in the future. In addition, we are required to estimate the expected forfeiture rate and recognize expense only for those shares expected to vest. If our actual forfeiture rate is materially different from our estimate, the stock-based compensation expense could be significantly different from what we have recorded in the current period.
Contingencies
We are involved in conditions, situations or circumstances in the ordinary course of business with possible gain or loss contingencies that will ultimately be resolved when one or more future events occur or fail to occur. We continually evaluate uncertainties associated with loss contingencies and record a charge equal to at least the minimum estimated liability for a loss contingency when both of the following conditions are met: (i) information available prior to issuance of the financial statements indicates that it is probable that an asset had been impaired or a liability had been incurred at the date of the financial statements and (ii) the loss or range of loss can be reasonably estimated. Legal costs are expensed when incurred. Gain contingencies are not recorded until realized or realizable.
Fair Value Measurements
Fair value accounting guidance establishes a hierarchy for inputs used in measuring fair value that maximizes the use of observable inputs and minimizes the use of unobservable inputs by requiring that the most observable inputs be used when available. Observable inputs are inputs that market participants would use in pricing the asset or liability, and are based on market data obtained from sources independent of us.
71
Table of Contents
Unobservable inputs reflect assumptions market participants would use in pricing the asset or liability based on the best information available in the circumstances. The hierarchy is broken down into three levels based on the reliability of inputs as follows:
| • | Level 1—Valuations based on quoted prices in active markets for identical assets or liabilities that we have the ability to access. Valuation adjustments and block discounts are not applied to Level 1 instruments. Because valuations are based on quoted prices that are readily and regularly available in an active market, valuation of these instruments does not entail a significant degree of judgment. |
| • | Level 2—Valuations based on quoted prices in markets that are not active or for which all significant inputs are observable, either directly or indirectly. Valuations for Level 2 are prepared on an individual instrument basis using data obtained from recent transactions for identical securities in inactive markets or pricing data from similar instruments in active and inactive markets. |
| • | Level 3—Valuations based on inputs that are unobservable and significant to the overall fair value measurement. |
We maintain various financial instruments recorded at cost in the December 31, 2012 and 2011 balance sheets that are not required to be recorded at fair value. For these instruments, we used the following methods and assumptions to estimate the fair value:
| • | Cash equivalents, restricted cash, accounts receivable and payable, customer deposits, income taxes receivable and payable, short-term borrowings, and accrued liabilities—cost approximates fair value because of the short maturity period; and |
| • | Long-term debt—fair value is based on the amount of future cash flows associated with each debt instrument discounted at our current estimated borrowing rate for similar debt instruments of comparable terms. |
Derivative Financial Instruments and Hedging Activities
We have not designated any derivatives as hedge accounting. All derivative instruments are recorded on the combined balance sheets at fair value. Derivatives not designated as hedge accounting and used to hedge foreign- currency-denominated balance sheet items are reported directly in earnings along with offsetting transaction gains and losses on the items being hedged.
To mitigate financial market risks of fluctuations in foreign currency exchange rates, we utilize currency forward contracts. We do not use derivative financial instruments for speculative or trading purposes. We generally hedge transactional currency risks with currency forward contracts. Gains and losses on these foreign currency exposures are generally offset by corresponding losses and gains on the related hedging instruments, reducing the net exposure to SSI. A substantial portion of our revenue and capital spending is transacted in the U.S. dollar. However, we do enter into transactions in other currencies, primarily the Euro, the Japanese Yen and certain other Asian currencies. To protect against reductions in value and volatility of future cash flows caused by changes in foreign exchange rates, we have established transaction-based hedging programs. Our hedging programs reduce, but do not always eliminate, the impact of foreign currency exchange rate movements. At any point in time, we may have outstanding contracts with several major financial institutions for these hedging transactions. Our maximum credit risk loss with these institutions is limited to any gain on our outstanding contracts. As of June 30, 2013, December 31, 2012 and 2011, these currency forward contracts had net notional amounts of $173.9 million, $169.3 million and $96.4 million, respectively, and are accounted for as economic hedges.
72
Table of Contents
Accounting Standards Updates
In February 2013, the Financial Accounting Standards Board (“FASB”) issued Accounting Standards Update 2013-02 (“ASU 2013-02”), Reporting of Amounts Reclassified Out of Accumulated Other Comprehensive Income (AOCI), to provide guidance about AOCI disclosure requirements. ASU 2013-02 does not change the current requirements for reporting net income or other comprehensive income in financial statements; however, it does require an entity to provide information about the amounts reclassified out of AOCI by component. In addition, an entity is required to present, either on the face of the statement where net income is presented or in the notes, significant amounts reclassified out of AOCI by the respective line items of net income only if the amount reclassified is required under U.S. GAAP to be reclassified to net income in its entirety in the same reporting period. This standard was adopted on January 1, 2013.
In June 2011, the FASB issued Accounting Standards Update 2011-05 (“ASU 2011-05”), Comprehensive Income (Topic 220): Presentation of Comprehensive Income. ASU 2011-05 allows an entity to present components of net income and other comprehensive income in one continuous statement, referred to as the statement of comprehensive income, or in two separate but consecutive statements. ASU 2011-05 eliminates the option to present the components of other comprehensive income as part of the statement of changes in equity. While the new guidance changes the presentation of comprehensive income, there are no changes to the components that are recognized in net income or other comprehensive income under current accounting guidance. This standard was retrospectively adopted on January 1, 2012.
Market Risk
Our market risk is mainly related to financial and capital markets risk.
The overall objective of our financial risk management program is to reduce the potential negative earnings effects from changes in foreign exchange and interest rates arising in our business activities. We manage these financial exposures through operational means and by using various financial instruments. These practices may change as economic conditions change.
To mitigate financial market risks of foreign currency exchange rates, we utilize currency forward contracts. For additional information, see “—Critical Accounting Policies and Estimates.”
Following the completion of the Transactions, our long-term debt portfolio will consist of variable rate debt instruments. In connection with the Transactions, we intend to enter into a new senior credit facility with a syndicate of banks providing for (i) a 3-year $ million senior secured revolving credit facility and (ii) a 7-year $ million senior secured term loan. We do not expect to have any borrowings outstanding under the revolving credit facility upon completion of this offering.
Borrowings under the new senior credit facility will bear interest at market rates based on market conditions at the time of the execution of the new senior credit facility and negotiations with our prospective lenders. For variable rate debt, interest rate changes generally do not affect the fair market value of such debt, but do impact future earnings and cash flows, assuming other factors are held constant. Our pro forma interest expense for the year ended December 31, 2012 after giving effect to the Transactions, including the borrowings associated with the term loan, would have been $ million. Holding other variables constant (such as foreign exchange rates and debt levels), a one percent point change in interest rates would have increased our pro forma interest expense for that period by approximately $ million.
We are also subject to interest rate risk related to our cash equivalents and pension plan assets. In addition to interest rate risk on our cash equivalents and pension plan assets, we are subject to issuer credit risk because the value of our assets may change based on liquidity issues or adverse economic conditions affecting
73
Table of Contents
the creditworthiness of the issuers or group of issuers of the assets we may own. Our pension plan assets are invested primarily in marketable securities including equity securities, bonds and interest bearing deposits. For additional information, see “—Liquidity and Capital Resources” and “—Critical Accounting Policies and Estimates.” Due to the diversity of and numerous securities in our portfolio, estimating a hypothetical change in value of our portfolio based on estimated changes in interest rates and issuer risk is not practical.
74
Table of Contents
Our Company
We are a global leader in the development, manufacture and sale of silicon wafers to the semiconductor industry. Wafers are used as the base substrate for nearly all semiconductor devices, which in turn provide the foundation for the entire electronics industry. Our business was established in 1959 and was known during most of our history as MEMC. We have developed a broad product portfolio, an extensive global manufacturing footprint, process technology expertise and supply chain flexibility, while increasing our capital efficiency and maintaining a lean operating culture.
Throughout our over 50 years of operations, we have pioneered a number of semiconductor industry firsts, including the development of the dislocation-free CZ silicon crystal growth process and the CMP process, as well as the initial production and commercialization of 100mm and 200mm semiconductor wafers. More recently, we have been a leader in the development of advanced substrates such as EPI wafers and wafers for the SOI market, which enable advanced computing and communications applications.
We primarily sell our products to all of the major semiconductor manufacturers in the world, including integrated device manufacturers and pure-play semiconductor foundries, and to a lesser extent, leading companies that specialize in wafer customization. During 2012, our largest customers were Samsung, TSMC and STMicroelectronics. We operate facilities in major semiconductor manufacturing regions throughout the world, including Taiwan, Malaysia, South Korea, Italy, Japan and the United States. We have chosen to locate our manufacturing facilities in regions that offer both low operating costs and close proximity to our customers to facilitate collaboration on product development activities and shorten product delivery times.
The market for semiconductor wafers is large and growing. According to Gartner, the merchant semiconductor silicon wafer market in 2012 was approximately $9 billion worldwide and is expected to grow at a 5.1% CAGR from 2012 to 2017, reaching approximately $12 billion by 2017. This growth in semiconductor wafer demand has been largely attributable to the proliferation of mobile devices such as smart phones and tablets. These devices require semiconductors that are energy efficient, low cost, high performance and highly integrated into a small footprint. Semiconductors offering those characteristics increasingly require EPI and SOI wafers. We believe that the combination of our process technology expertise in EPI and SOI wafer manufacturing with our capital efficiency provides us with significant opportunities as the markets for EPI and SOI wafers continue to grow.
The semiconductor wafer industry has undergone significant consolidation over the past 20 years, from more than 20 suppliers in the 1990s to only five major suppliers today, including Shin-Etsu Handotai, SUMCO Corporation, Siltronic AG, LG Siltron and us, which suppliers accounted for approximately 90% of all semiconductor wafer sales in 2012, according to Gartner. This consolidation is due in large part to the significant increase in the capital investment and manufacturing capacity needed to compete effectively. We have expanded our market share by revenue from 8% in 2008 to 10% in 2012, according to Gartner. We believe this improvement is in large part the result of our emphasis on technology and product innovation and customer service, as well as consistently delivering high quality wafers that meet our customers evolving requirements. We believe we are well positioned to continue to expand our market share and capitalize on the increasing demand for more advanced wafer products. We generated net sales of $934.2 million and $1,198.3 million, net income (loss) attributable to SSI of $121.3 million and $(557.9) million and Adjusted EBITDA of $74.9 million and $170.2 million, in 2012 and 2011, respectively. For the six months ended June 30, 2013, we generated net sales of $476.4 million, net loss attributable to SSI of $23.7 million and Adjusted EBITDA of $53.4 million. See “Summary Historical and Pro Forma Financial Data” for the definition of Adjusted EBITDA, the reason for its inclusion and a reconciliation from net income (loss) attributable to SSI to Adjusted EBITDA.
75
Table of Contents
Industry Overview
Semiconductor devices are at the core of modern electronics. According to Gartner, the total semiconductor market worldwide was $300 billion market in 2012. These devices include microprocessors, memory, analog, mixed-signal and RF integrated circuits, discrete, application specific integrated circuits, MEMS and image sensors. Recent semiconductor growth has been largely attributable to the proliferation of mobile devices, which has driven the need for low cost, high performance semiconductors that provide efficient power consumption and a reduced footprint. In order to meet these demands, technology innovation in the semiconductor industry has continued at a strong pace over the past decade, resulting in shrinking process geometries, larger wafer sizes, more stringent technical specifications and the introduction of advanced substrates and device structures. In addition to continued growth in the mobile device market, future semiconductor industry growth is expected to be further driven by new and emerging markets and applications, such as in the healthcare and automotive industries, which are increasingly incorporating advanced technologies in their services and products.
Semiconductor wafers are increasingly required to meet specific performance characteristics. For example, semiconductors used in applications such as mobile devices and cloud infrastructure are increasingly requiring EPI wafers, which enable lower power consumption due to their near perfect surface characteristics. According to Gartner, the epitaxial semiconductor silicon wafer market is expected to grow from $3.6 billion in 2012 to $4.9 billion in 2017, representing a 6.5% CAGR. Similarly, demand for SOI wafers is growing as a result of the ability of SOI wafers to improve switching speeds and enhance the performance of RF devices such as power amplifiers, switches and sensors. According to the SOI Industry Consortium, the total available market for SOI wafers is expected to double over the next five years, driven by the increased penetration in mobile system-on-chips and RF devices. As a semiconductor wafer manufacturer focused on advanced EPI and SOI product solutions, we believe we are well positioned to capitalize on the growth opportunities resulting from industry consolidation and the increasing demand for EPI and SOI wafers.
Our Strengths
Our strengths as a manufacturer of semiconductor wafers include the following:
History of product innovation and process technology expertise. We have a more than 50 year history, under the MEMC brand, of product innovation, including achieving several major advancements in the semiconductor wafer industry, such as the development of the dislocation-free CZ silicon crystal growth process and the CMP process, as well as the initial production and commercialization of 100mm and 200mm semiconductor wafers. We have developed advanced substrates such as EPI wafers and, more recently, SOI wafers to maintain our history of product innovation. We have also developed significant technology expertise in wafer manufacturing processes, including diamond wire cutting, integrated software-enabled tooling and flexible equipment processes supporting the manufacture of semiconductor wafers with various diameters. We believe that our product innovation capabilities and process technology expertise enable us to produce high quality wafers both rapidly and cost effectively.
Broad product portfolio. We have developed a broad product portfolio. Our products include polished, EPI, SOI, perfect silicon and MDZ wafers ranging in diameter from 100mm to 300mm. Our process capabilities provide us with the ability to customize our products to address the specific performance characteristics required by our customers. For example, as one of only three primary SOI wafer suppliers, we are capable of satisfying all of our customers’ wafer requirements in microprocessors, memory, analog, mixed-signal and RF integrated circuits, discrete, application specific integrated circuits, MEMS and image sensors.
Extensive global footprint with close customer collaboration. We have an established global manufacturing network consisting of eight facilities located in Taiwan, Malaysia, South Korea, Italy, Japan and the United States. We have located our facilities in areas that offer a combination of low operating costs and
76
Table of Contents
highly educated work forces in close proximity to our customers. This “local” presence enables us to collaborate with our customers on product design and development activities and shorten product delivery and response times. Our diverse global footprint also enables us to mitigate risk in the event of natural disasters or other occurrences that can disrupt manufacturing. For example, although production at our Japanese facility was disrupted as a result of the March 2011 earthquake and tsunami, we were one of the few semiconductor wafer suppliers able to deliver products in a timely manner by shifting our production to other qualified facilities.
Established relationships with blue chip customers. We work with all of the major semiconductor device manufacturers in the world, including integrated device manufacturers and pure-play semiconductor foundries. Our largest customers in 2012 included Samsung, TSMC and STMicroelectronics. Our continued focus on developing strong customer relationships has resulted in several awards from our key customers. For example, we were the only company in 2012 to receive supplier excellence awards from each of Samsung, TSMC and Analog Devices based on our performance, quality, service and support. We collaborate with our customers on their research and development activities, allowing us to develop wafer products that meet their product design expectations rapidly and efficiently. We believe this collaboration provides us greater visibility into our customers’ product pipelines and enables us to strategically position our business for next generation market opportunities.
Company-wide focus on capital efficiency and maintaining a lean operating culture. We have implemented several initiatives since 2009 designed to rationalize our use of resources, optimize those resources for the most attractive market opportunities and manage our production capacity to meet demand efficiently. Our engineers’ understanding of both the science and operation of the tools within our factories enables us to streamline equipment controls, software interfaces and operational parameters to improve the productivity of our equipment. In 2012, our engineers applied these techniques to improve the output of our EPI production equipment by more than 20%, resulting in reduced capital expenditures and increased productivity. We have also designed our manufacturing processes to be flexible and scalable with low to moderate additional capital investment necessary to pursue new opportunities or increase capacity. For example, we expanded our 300mm wafer capacity at our Cheonan, South Korea facility in 2012 by 22% with relatively small additional capital expenditures. We continue to focus on improving our equipment productivity through our Overall Equipment Effectiveness program, which has improved our safety, customer satisfaction and on-time delivery and reduced facility disruptions.
Experienced management team with extensive expertise. Our top eight senior managers average 25 years of relevant experience from multiple segments of the semiconductor industry, having joined us from leading technology companies including General Electric, Intel and Motorola. In addition, we have a large and technologically proficient professional staff with approximately 720 engineers, of whom over 125 focus solely on R&D and approximately 45 have Ph.Ds. We believe our first-class leadership team has a broad set of experiences and expertise and is well equipped to execute on our strategy and capitalize on emerging opportunities.
Our Business Strategy
Our goal is to continue to be a market leader and increase our market share in the large and growing semiconductor wafer industry. Key elements of our strategy include:
Extending our product and process technology leadership. We are focused on developing leading edge technologies for the semiconductor wafer market. As our customers’ needs evolve with decreasing transistor sizes, increasing degrees of integration and ongoing pressures for cost reduction, the requirements and specifications for semiconductor wafers are also evolving. We are investing in new product and process technologies to be able to offer products with enhanced features, such as flatness, uniformity, resistivity and
77
Table of Contents
reduced defects. For example, we are making substantial investments to further our 200mm and 300mm SOI product offerings for below 20 nanometer process technologies, as well as next generation 300mm EPI wafers with advanced performance characteristics for wireless applications.
Increasing our customer penetration and market share. We intend to increase our customer penetration by enhancing our global sales, design and technical support organizations and leveraging our broad product portfolio. We are also focused on capitalizing on attractive new opportunities with current and new customers in emerging applications. For example, we are working closely with customers to design product solutions that enable continued transistor scaling and include 3-D transistors and Fully Depleted SOI planer transistors, as well as to address process issues related to the introduction of new materials in wafer fabrication and advanced lithography. In addition, we are developing wafer solutions that enable integration of multiple functions, such as logic, memory and analog, on the same chip. We believe we are well-positioned to capture new opportunities with existing customers and further diversify our customer base as a result of our technology leadership, broad product portfolio and global manufacturing footprint.
Continuing to deliver high quality customer service. We intend to continue our increased focus on delivering high quality customer service and manufacturing flexibility by leveraging our “local” presence that results from our diverse geographic footprint. We are focused on enhancing our established quality assurance programs and dedicated services and support staff in order to continue responding quickly to changing demands and product cycles of our customers. As a testament to our product quality and customer service, we have received awards from several of our key customers, including Samsung, TSMC and Analog Devices.
Maintaining focus on operational improvements. We intend to continue our focus on maintaining a lean operating environment and capital efficiency. We believe our Overall Equipment Effectiveness program and other operational improvements have enabled us to improve lead times across the supply chain, as well as our performance with respect to safety, customer satisfaction and on-time delivery and reduced facility disruptions. These improvements have freed up capacity, reduced costs and significantly improved equipment reliability. Our lean operating structure positions us to add production capacity as needed at low to moderate incremental capital expense by optimizing equipment utilization.
Capitalizing on the benefits of being an independent entity. We believe that being a separately traded public company will enable us to be a more focused business with the ability to target our investment and research initiatives solely on semiconductor wafers. We expect our independence will also allow us to align the interests and incentives of our employees exclusively with the success of our business and better position us for further consolidation in the industry.
78
Table of Contents
History
Our business was originally established in 1959 under the name Monsanto Electric Material Company and for most our history we have been known as MEMC and traded on the New York Stock Exchange. Prior to this offering, we conducted our operations as a business segment of MEMC, which was renamed SunEdison, Inc. in May 2013. Throughout our over 50 years of experience, we have been a leader in technological innovation, including achieving a number of semiconductor industry firsts. The table below summarizes some of our key technological achievements:
| Year |
Achievement | |
| 1962 |
Developed dislocation-free CZ silicon crystal growth process | |
| 1965 |
Developed chemical-mechanical polishing process for semiconductor wafers | |
| 1975 |
Achieved first commercial production of 100mm wafers | |
| 1982 |
Developed the use of EPI wafers in complementary metal–oxide–semiconductor, or CMOS, applications | |
| 1984 |
Commercialized 200mm wafers | |
| 1991 |
Developed 300mm wafers | |
| 1998 |
Developed agglomerated defect free ‘Perfect Silicon’ | |
| 2000 |
Introduced defect-free engineered products ‘MDZ’™ & ‘Optia’™ | |
| 2009 |
Commenced high volume manufacturing of SOI wafers; introduced 450mm mechanical wafers for use in equipment calibration | |
| 2011 |
Qualified wafers for production in 28 nanometer node | |
| 2013 |
Deployed diamond wire cutting technology | |
We have made a number of strategic investments throughout our history to expand our product portfolio, global footprint and customer base. For example, in early 2004, we acquired from our joint venture partners the remaining 55% interest that we did not already own of Taisil Electronic Materials Corporation, a fully integrated Taiwanese manufacturer of polished and EPI wafers for the Asia Pacific region. In 1990, we established a joint venture known as MEMC Korea Company with Samsung in Korea to produce 200mm and 300mm wafers. We also constructed a large-scale 200mm wafer manufacturing facility in Ipoh, Malaysia to consolidate production closer to our customer base and began shipping products from that facility in the third quarter of 2010.
Products and Applications
Our wafers are used as the base substrate for the manufacture of various types of semiconductor devices, including microprocessors, memory, analog, mixed-signal and RF integrated circuits, discrete, application specific integrated circuits, MEMS and image sensors. These semiconductor devices are used in computers, smart phones, tablets and other mobile electronic devices, automobiles and other consumer and industrial products. We offer wafers with a wide variety of features and in varying sizes, flatness characteristics, crystal properties and electrical properties to satisfy numerous product specifications required by our customers. Our wafers range in size from 100mm to 300mm. We also manufacture a limited number of 450mm mechanical wafers, which are used by semiconductor equipment manufacturers for the development of next generation process equipment. We will continue to monitor the development of the 450mm wafer market and, if circumstances warrant, we will adjust our development and production capabilities.
79
Table of Contents
The chart below summarizes our products, the diameters in which we offer each product and the principal applications for each product.
| Wafer Diameter (millimeters) | ||||||||||
| Products |
150 and Less | 200 | 300 | 450 | Principal Applications | |||||
| Polished Wafers: |
||||||||||
| Low Resistivity |
ü | ü | ü | Power devices | ||||||
| High Resistivity |
ü | ü | RF devices, Power devices | |||||||
| Standard (Prime/Test) |
ü | ü | ü | ü | Memory, Logic, Analog | |||||
| Low COP Prime |
ü | ü | ü | Logic, Analog | ||||||
| Annealed |
ü | ü | Logic, Analog | |||||||
| Perfect Silicon |
ü | ü | Memory | |||||||
| MDZ |
ü | ü | ü | Logic, Analog | ||||||
| OPTIA Perfect Silicon +MDZ |
ü | ü | Memory, Logic, Analog | |||||||
| EPI Wafers: |
||||||||||
| Standard CMOS/AEGISTM |
ü | ü | ü | Logic, Image sensors | ||||||
| Power Discrete |
ü | ü | Power devices | |||||||
| Custom |
ü | ü | ü | Various applications | ||||||
| SOI Wafers: |
||||||||||
| Power |
ü | Power devices, MEMS | ||||||||
| Perfect |
ü | RF devices | ||||||||
Depending on market conditions, we also sell intermediate products such as polysilicon, TCS gas, ingots and scrap wafers to semiconductor device and equipment makers, which sales have not been material to our results of operations following the shuttering of our Merano, Italy polysilicon facility in December 2011.
Polished Wafers
Our polished wafers are used in a wide range of applications, including memory, analog, RF devices, digital signal processors, or DSPs, and power devices. Our polished wafer is a polished, highly refined, pure wafer with an ultra-flat and ultra-clean surface. We manufacture the vast majority of our polished wafers with a sophisticated chemical-mechanical polishing process that removes defects and leaves an extremely smooth surface. Wafer flatness and cleanliness requirements, along with crystal perfection, have become increasingly important as semiconductor devices become more complex and transistors decrease in size.
Our OPTIA™ wafer is a 100% defect-free crystalline structure based on our technologies and processes, including MDZ®. Our MDZ® product feature can increase our customers’ yields by drawing impurities away from the surface of the wafer during device processing in a manner that is efficient and reliable, with results that are reproducible. We believe the OPTIA™ wafer is one of the most technologically advanced polished wafers available today. Our annealed wafer is a polished wafer with near surface crystalline defects dissolved during a high-temperature thermal treatment.
We also supply test/monitor wafers to our customers for their use in testing semiconductor fabrication lines and processes. Although test/monitor wafers are substantially the same as polished wafers with respect to cleanliness, and in some cases flatness, other specifications are generally less rigorous.
EPI Wafers
EPI wafers increase the reliability and decrease the power consumption of semiconductor devices and therefore are increasingly used in mobile device and cloud infrastructure applications. Our EPI wafers consist of a thin silicon layer grown on the polished surface of the wafer. Typically, the epitaxial layer has different
80
Table of Contents
electrical properties from the underlying wafer. This provides our customers with better isolation between circuit elements than a polished wafer and the ability to tailor the wafer to the specific demands of the device. This improved isolation allows for increased reliability of the finished semiconductor device and greater efficiencies during the semiconductor manufacturing process, which ultimately allows for more complex semiconductor devices.
We designed our AEGIS™ product for certain specialized applications requiring high resistivity EPI wafers. The AEGIS™ wafer includes a thin epitaxial layer grown on a standard starting wafer, which eliminates harmful defects on the surface of the wafer, thereby allowing device manufacturers to increase yields and improve process reliability.
SOI Wafers
SOI wafers improve switching speeds and enhance the performance of RF devices such as power amplifiers, switches and sensors. Our SOI wafers have three layers: a thin surface layer of silicon where the transistors are formed; an underlying layer of insulating material; and a support or “handle” bulk semiconductor wafer. Transistors built within the top silicon layer typically switch signals faster, run at lower voltages and are much less vulnerable to signal noise from background cosmic ray particles. Each transistor is isolated from its neighbor by a complete layer of silicon dioxide.
Customers
We primarily sell our products to all of the major semiconductor manufacturers in the world, including integrated device manufacturers and pure-play semiconductor foundries, and to a lesser extent, leading companies that specialize in wafer customization. Our top 10 customers by net sales for 2012, set forth in alphabetical order, were: IBM, Infineon Technologies, Intel Corporation, Micron Technology, Powerchip Technology, Samsung, STMicroelectronics, TSMC, Toshiba and United Monolithic Semiconductors. We have had relationships with all of our top 10 customers for more than 10 years and with nine of our top 10 customers for more than 20 years. In 2012, Samsung, TSMC and STMicroelectronics accounted for approximately 20%, 13% and 11%, respectively, of our net sales to non-affiliates. No other customer accounted for more than 10% of our net sales to non-affiliates during 2012.
Our customers are located primarily in the major semiconductor manufacturing regions throughout the world. The following table presents a summary of the percentage of our net sales to non-affiliates by country, based on the location of the customer, for the years ended December 31, 2012 and 2011 and the six months ended June 30, 2013:
| Percentage of Net Sales to Non-affiliates | ||||||||||||
| For the Years Ended December 31, | For the Six Months ended June 30, 2013 |
|||||||||||
| Country |
||||||||||||
| 2012 | 2011 | |||||||||||
| Taiwan |
24 | % | 25 | % | 26 | % | ||||||
| Korea |
21 | 20 | 24 | |||||||||
| United States |
16 | 17 | 15 | |||||||||
| Singapore |
6 | 7 | 7 | |||||||||
| Japan |
6 | 6 | 3 | |||||||||
| Italy |
5 | 5 | 4 | |||||||||
| Germany |
5 | 4 | 6 | |||||||||
| China |
5 | 4 | 5 | |||||||||
| France |
4 | 4 | 4 | |||||||||
| Other foreign countries |
8 | 8 | 6 | |||||||||
|
|
|
|
|
|
|
|||||||
| Total |
100 | % | 100 | % | 100 | % | ||||||
|
|
|
|
|
|
|
|||||||
81
Table of Contents
Sales and Marketing
We market our semiconductor wafers primarily through a direct sales force. We have customer service and support centers strategically located across the globe, including in China, France, Germany, Italy, Japan, Malaysia, Singapore, South Korea, Taiwan and the United States. A key element of our sales and marketing strategy is establishing and maintaining close relationships with our customers, which we accomplish through multi-functional teams of technical, sales and marketing and manufacturing personnel, including 34 dedicated field engineers. Our multi-functional teams work closely with our customers to optimize our products for our customers’ current and future production processes, requirements and specifications. We closely monitor changing customer needs and target our research and development and manufacturing to produce wafers adapted to each customer’s specific needs.
Sales to our customers are generally governed by purchase orders or, in certain cases, agreements with terms of one year or less that include pricing terms and estimated quantity requirements. Our customer agreements generally do not require that a customer purchase a minimum quantity of wafers.
We sell semiconductor wafers to certain customers under consignment arrangements. These consignment arrangements generally require us to maintain a certain quantity of wafers in inventory at the customer’s facility or at a storage facility designated by the customer. Under these arrangements, we ship the wafers to the storage facility, but do not charge the customer or recognize sales for those wafers until title passes to the customer. As of June 30, 2013, we had approximately $26.7 million of inventory held on consignment, compared with approximately $27.7 million and $28.5 million of inventory held on consignment as of December 31, 2012 and December 31, 2011, respectively.
Research and Development
The semiconductor wafer market is characterized by continuous technological development and product innovation. Our R&D organization consists of over 125 engineers, of whom approximately 45 have PhDs. Our R&D model combines engineering innovation with specific commercialization strategies and seeks to align our technology innovation efforts with our customers’ requirements for new and evolving applications. We accomplish this through a deep understanding of our customers’ current and future technology requirements and targeting our R&D efforts at developing products to meet those technology requirements. In particular, we have a Field Applications Engineering team that collaborates with our account managers and serves as the key technical interface between us and our customers. Members of this team are assigned to key customers worldwide and lead the introduction and qualification of new products, collaborate with our customers in the development of new technical solutions and support the resolution of any product-related issues.
We devote a significant portion of our R&D resources to enhancing our position in the crystal technology area. In conjunction with these efforts, we are developing wafer technologies to meet advanced flatness and particle specifications of our customers. We are also continuing to focus on the development of advanced substrates such as EPI and SOI wafers and cost reduction activities.
In addition to our focus on advancements in wafer material properties, we continue to invest in R&D associated with larger wafer sizes. We produced our first 300mm wafer in 1991 and are continuing to enhance our 300mm technology program. We produced our first 450mm wafer in 2009, but to date have only produced minimal quantities of mechanical wafers at this size due to limited market demand for 450mm wafers. We also continue to focus on process design advancements to drive cost reductions and productivity improvements.
Prior to or simultaneously with the completion of this offering, we expect to enter into joint development arrangements with SunEdison pursuant to which we and SunEdison will collaborate on future R&D activities with respect to the intellectual property to be licensed between us, as well as projects related thereto. For additional information on these arrangements, see “Certain Relationships and Related Party Transactions–Intellectual Property Licensing Agreements.”
82
Table of Contents
Manufacturing
To meet our customers’ needs worldwide, we have established a global manufacturing network consisting of eight facilities located in Taiwan, Malaysia, South Korea, Italy, Japan and the United States. We have located our manufacturing facilities in regions that offer both low operating costs and highly educated work forces in close proximity to our customers. This “local” presence enables us to facilitate collaboration with our customers on product development activities and shorten product delivery and response times.
We have installed consistent tools and processes across our manufacturing facilities in order to facilitate the transfer of manufacturing between sites. While customers generally require that they “qualify” each facility at which we manufacture wafers for them, a process that typically takes three to six months but which can take up to one year for certain products, in many cases multiple sites are qualified for a particular product to allow manufacturing flexibility. In addition, multiple qualifications permit us to quickly shift production between facilities in the event of a natural disaster or other occurrence affecting one of our facilities, enabling uninterrupted delivery of products to our customers. For example, production at our Japanese facility was disrupted as a result of the March 2011 earthquake and tsunami, but we were able to shift production of our 200mm wafers quickly to other facilities that had been, or were already in the process of being, qualified, enabling us to continue delivering those wafers to customers in a timely manner.
Our wafer manufacturing process begins with high purity polysilicon. The polysilicon is melted in a quartz crucible along with minute amounts of electrically active elements such as arsenic, boron, phosphorous or antimony. We then lower a silicon seed crystal into the melt and slowly extract it from the melt. The resultant body of silicon is called an ingot. The temperature of the melt, speed of extraction and rotation of the crucible govern the size of the ingot, while the concentration of the electrically active element in the melt governs the electrical properties of the wafers to be made from the ingot. This is a complex, proprietary process requiring many control features on the crystal-growing equipment.
After the crystal ingot is grown, we grind the ingots to the specified size and slice them into thin wafers. Next, we prepare the wafers for surface polishing with a multi-step process using precision wafer planarization machines, edge contour machines and chemical etchers. Final polishing and cleaning processes give the wafers the clean and ultraflat mirror polished surfaces required for the fabrication of semiconductor devices. We further process some of our products into EPI wafers by utilizing a chemical vapor deposition process to deposit a single crystal silicon layer on the polished surface. Additional wafer customization can be made through our SOI process, which creates an oxide isolated silicon layer on a base substrate.
The graphic below illustrates key steps in the manufacturing process for our semiconductor wafers:
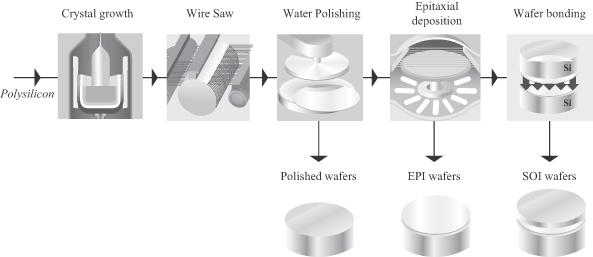
83
Table of Contents
Raw Materials
The principal raw material used in our manufacturing process is polysilicon. We have historically obtained our requirements for polysilicon primarily from SunEdison’s facility in Pasadena, Texas, as well as from other external polysilicon suppliers. In connection with the Transactions, we will enter into a supply agreement with SunEdison for polysilicon, and we expect SunEdison will be our primary supplier of polysilicon. See “Certain Relationships and Related Party Transactions—Supply Agreement” for a summary of the material terms of this agreement. If for any reason SunEdison is unable to meet our demand for polysilicon, we expect to be able to obtain our polysilicon requirements from alternative suppliers. However, we may experience manufacturing delays, an increase in our costs relating to obtaining polysilicon or a decrease in our manufacturing throughput and yields if we are required to seek alternative suppliers.
Competition
The market for semiconductor wafers is highly competitive. We compete globally and face competition from established manufacturers. Our major worldwide competitors are Shin-Etsu Handotai, SUMCO Corporation, Siltronic AG and LG Siltron. The key competitive factors in the semiconductor wafer market are product quality, consistency, price, technical innovation, customer service and product availability. We emphasize our technology and product innovation, customer service and consistently delivering high quality wafers that meet our customers evolving requirements. Some of our competitors are larger than us, which may enable them to produce wafers at a lower per unit cost due to economies of scale and have greater influence than us on market prices. We also believe certain of our competitors may experience competitive advantages in their home markets, where customers are willing to pay a premium for wafers from a domestic manufacturer.
Proprietary Information and Intellectual Property
We believe that the success of our business depends in part on our proprietary technology, information and processes. We protect our intellectual property rights based on patents and trade secrets. As of June 30, 2013, we had 262 U.S. patents and 492 foreign patents. In addition, as of June 30, 2013, we had 115 pending U.S. patent applications and approximately 261 pending foreign patent applications.
The table below sets forth the approximate number of our current U.S. and foreign patents that are scheduled to expire in the referenced periods:
| Number of Patents Scheduled to Expire | ||||
| During the Years Ended December 31, |
U.S. | Foreign | ||
| 2013-2017 |
64 | 59 | ||
| 2018-2022 |
124 | 313 | ||
| 2023-2027 |
38 | 94 | ||
| 2028 and thereafter |
36 | 26 | ||
|
|
| |||
| Total |
262 | 492 | ||
|
|
| |||
While we consider our patents to be valuable assets, we do not believe that our overall operations are dependent upon any single patent or group of related patents.
We will enter into intellectual property licensing agreements with SunEdison in connection with the Transactions. See “Certain Relationships and Related Party Transactions—Intellectual Property Licensing Agreements” for a summary of the material terms of these agreements.
84
Table of Contents
We have agreed to indemnify some of our customers against claims of infringement of the intellectual property rights of others in our sales contracts with these customers. Historically, we have not paid any claims under these indemnification obligations, and we do not have any pending indemnification claims against us.
Environmental Matters
Our operations and facilities are subject to U.S. and foreign laws and regulations governing the protection of the environment and our employees, including those governing air emissions, water discharges, the management and disposal of hazardous substances and wastes, and the cleanup of contaminated sites. We could incur substantial costs, including cleanup costs, fines or civil or criminal sanctions, or third-party property damage or personal injury claims, in the event of violations or liabilities under these laws and regulations, or non-compliance with the environmental permits required at our facilities. Potentially significant expenditures could be required in order to comply with environmental laws that may be adopted or imposed in the future. In addition, we could be liable for violation of environmental laws or regulations or clean up costs at former facilities. We are not aware of any threatened or pending material environmental investigations, lawsuits or claims involving us, our operations or our current or former facilities.
Groundwater and/or soil contamination has been detected at our facilities in St. Peters, Missouri and Merano, Italy, and we previously had contamination at two other facilities which has now been remediated. We believe we are taking all necessary remedial steps at the two facilities where contamination still exists and continue to monitor the other two facilities. We do not expect the costs of the ongoing monitoring at those sites to be material. In addition, if we decide to close any of our facilities in the future, we could be subject to additional costs related to cleanup and/or remediation at that site in connection with closing the facility. As of June 30, 2013, we believe we have established adequate liabilities relating to ongoing remediation activities and relating to cleanup and remediation measures that would need to be undertaken at our Merano, Italy polysilicon facility in the event we determined to permanently close that facility. As of June 30, 2013, compliance with foreign, federal, state and local provisions which have been enacted or adopted regulating the discharge of materials into the environment, or otherwise relating to the protection of the environment, has not had a material effect on our business, financial condition or results of operations, and we do not currently expect any known conditions to have a material impact on our business in the future.
Properties
Our principal executive offices are located at 501 Pearl Drive (City of O’Fallon), St. Peters, Missouri 63376, and our telephone number at that address is (636) 474-5000. Our principal manufacturing and administrative facilities, including our executive offices, comprised approximately 3,153,400 square feet as of June 30, 2013. All of our facilities are owned, other than our Kuala Lumpur, Malaysia facility, which is leased. This lease expires in April 2015 and is extendable for one two-year period thereafter. We also own all of the real estate underlying our owned facilities, other than the real estate on which our Hsinchu, Taiwan facility is located, which is subject to a land lease. This lease expires in 2014 and is extendable at our option for not less than a 20-year renewal period thereafter.
85
Table of Contents
The table below sets forth the location and approximate square footage of each of our facilities.
| Location |
Approximate Square Footage |
|||
| St. Peters, MO, USA |
592,000 | |||
| Hsinchu, Taiwan |
649,000 | |||
| Chonan, South Korea |
462,400 | |||
| Ipoh, Malaysia |
431,300 | |||
| Utsunomiya, Japan |
306,000 | |||
| Merano, Italy (1) |
327,000 | |||
| Novara, Italy |
330,700 | |||
| Kuala Lumpur, Malaysia |
55,000 | |||
| (1) | The square footage with respect to the Merano, Italy polysilicon facility includes square footage related to our polysilicon operations, which were shuttered as of December 31, 2011. |
In an effort to reduce manufacturing costs and shift manufacturing to locations closer to our customers, in 2009 we committed to terminate certain of our manufacturing operations at our facility located in St. Peters, Missouri. We ceased all manufacturing at our St. Peters facility in 2012 except for 150mm crystal growing and advance SOI manufacturing, which we currently expect to continue to be produced at this facility. Our corporate headquarters and R&D activities are also expected to continue at our St. Peters facility. We have transferred manufacturing operations to our facility in Ipoh, Malaysia.
We also own a facility in Sherman, Texas, which was closed as of December 31, 2011. We are currently evaluating various options with respect to this facility, including a possible sale.
We believe that our existing facilities and equipment are well maintained, in good operating condition and are adequate to meet our current requirements.
Employees
As of June 30, 2013, we had approximately 4,280 employees, approximately 1,400 of whom were unionized at our manufacturing facilities in St. Peters, Missouri; Merano, Italy; Novara, Italy; Utsunomiya, Japan; and Chonan, South Korea. In various countries, local law also requires our participation in works councils. We have not experienced any material work stoppages at any of our facilities due to labor union activities in recent years. We believe our relations with our employees are good.
Legal Proceedings
We are involved in various legal proceedings, claims, investigations and other legal matters which arise in the ordinary course of business. Set forth below is a summary of a currently pending material legal proceeding. Although it is not possible to predict the outcome of this or other matters, we believe that the ultimate outcome of our pending legal proceedings, including the matter discussed below, individually and in the aggregate, will not have a material adverse effect on our business, financial condition or results of operations.
In May 2008, S.O.I.TEC Silicon on Insulator Technologies S.A., or Soitec, and Commissariat A L’Energie Atomique, or CEA, filed a complaint against us in the U.S. District Court for the District of Delaware (Civil Action No. 08-292) which, as amended, alleges infringement by us of four U.S. patents related to SOI technology and requested damages and an injunction. We filed a counterclaim against Soitec for infringement of one of our U.S. patents.
86
Table of Contents
In October 2010, the court ruled that all of our current products and processes do not infringe any valid claim of the four asserted Soitec patents. After the court’s ruling, the only remaining claim that Soitec continued to assert was a single patent claim directed against R&D efforts conducted by us prior to 2006, none of which are relevant to our current business. We continued to assert our counterclaim for infringement of our patent. A jury trial was held in October and November 2010 and the jury found that certain of Soitec’s wafers infringed the patent asserted by us at trial. The jury also found that one of the Soitec patent claims was valid. The case is now on appeal; however, the appeal has been stayed pending en banc review of a jurisdictional question unrelated to the merits of the appeal. No further developments will occur during the stay. The damages phase of the trial will occur, if at all, after the appeal. For further discussion, see Note 11 to the combined financial statements included elsewhere in this prospectus.
87
Table of Contents
The following table sets forth information regarding our directors, director nominees and executive officers upon completion of this offering. Currently all of our directors are either employed by SunEdison or us, and therefore, none are considered independent under the applicable standards of the and the SEC. Prior to the completion of this offering, we expect to identify at least one director nominee that will be independent under these standards. It is expected that our director nominees will become directors upon the consummation of this offering. In addition, within 90 days of our listing on the , we intend to appoint an additional director who will be independent under these standards and, within one year of our initial public offering, we intend to appoint a third director who will be independent under these standards.
| Name |
Age | Position/Title | ||||
| Shaker Sadasivam |
53 | President, Chief Executive Officer and Director | ||||
| William (Bill) Dunnigan |
55 | |||||
| Bryan Hoadley |
48 | |||||
| Doug Wilson |
48 | |||||
| Brian Wuebbels |
41 | Director | ||||
Ages shown above are as of August 31, 2013. The following is a brief description of the business experience of each of the persons listed above.
Dr. Shaker Sadasivam has served as our President and Chief Executive Officer and a director since August 2013 and as SunEdison’s Executive Vice President and President-Semiconductor Materials since October 2009 and Senior Vice President, Research and Development from July 2002 to September 2009. Prior to that time, Dr. Sadasivam served in various positions for SunEdison, including as President of MEMC Japan Ltd., SunEdison’s Japanese subsidiary, from April 2002 to June 2002, as Director, Worldwide Operations Technology from July 2000 to March 2002, as Director, Technology for MEMC Korea Company, SunEdison’s South Korean subsidiary, from July 1999 to June 2000, and in positions in the manufacturing technology group from September 1997 to June 1999. Mr. Sadasivam’s extensive experience working in our business, including as the President of our business under SunEdison, allows him to advise our board of directors on management’s perspective with respect to a full range of issues affecting our Company.
William (Bill) Dunnigan has served as our since and served as SunEdison’s Vice President & General Manager since July 2013. Mr. Dunnigan joined SunEdison in December 2010 as Vice President Supply Chain, Semiconductor Materials, a position he held until June 2013. Previously, Mr. Dunnigan served as Senior Vice President, Wafer Fabrication of Cypress Semiconductor from June 2006 to March 2009. Mr. Dunnigan started his career at Motorola/Freescale Semiconductor, where he worked for 26 years in a variety of roles until August 2005, including process engineering, manufacturing and operations management, Corporate Vice President, Wafer Manufacturing and Vice President and General Manager of the Computing Platform Division.
Bryan Hoadley has served as our since and served as SunEdison’s Worldwide Vice President, Sales & Marketing for the Semiconductor Products business unit since August 2013. Mr. Hoadley has more than 25 years of experience in the microelectronics industry. Prior to joining SunEdison, Mr. Hoadley served as President of Movea Inc. and as its Executive Vice President of Worldwide Sales and Marketing from October 2007 to July 2013. Previously, Bryan spent 15 years in the automated semiconductor test industry, most recently as Worldwide Vice President of Field Operations for Credence Systems Corp. from March 2006 to April 2007 and as Vice President and General Manager of European Field Operations in Grenoble, France for Credence Systems Corp. from April 2002 to March 2006. Mr. Hoadley held various sales management roles with Credence Systems Corp. from August 1994 to March 2002 and began his career as an account manager with Micro Component Technology from 1992 to 1994. Mr. Hoadley started his career as a systems engineer at Lockheed Martin Missiles and Space, where he served in various roles from 1990 to 1992.
88
Table of Contents
Doug Wilson has served as our since and served as SunEdison’s Vice President and General Manager since August 2012. Prior to that time, Mr. Wilson served as SunEdison’s Vice President of Global Operations from August 2011 to July 2012, and as SunEdison’s Senior Director of the Product Management/Marketing group from June 2009 to July 2011. Previously, Mr. Wilson held various leadership positions in Quality Engineering, Operations, Scheduling, Capacity Planning, Capital Expansion, Business Unit Management, Site Management, Product Management and Product Marketing since joining SunEdison in 1996. Prior to his arrival at SunEdison, Doug served as an A-6 and FA-18 pilot in the U.S. Navy. In addition to his operational aviation role, he also held a variety of positions in the U.S. Navy in aircraft maintenance, aircrew training and weapons systems management, ultimately serving as a Navy Flight Test Director for advanced weapons systems.
Brian Wuebbels has been one of our directors since September 2013. Mr. Wuebbels serves as the Executive Vice President and Chief Financial Officer of SunEdison, a position he has held since May 2012. Prior to that time, Mr. Wuebbels served as SunEdison’s Vice President and General Manager—Balance of System Products from January 2012 to April 2012, Vice President and General Manager, Solar Wafer Manufacturing from February 2010 to December 2011, Vice President of Financial Planning and Analysis from January 2009 to January 2010 and Vice President Operations Finance from August 2007 to December 2009. Prior to joining SunEdison, Wuebbels served as Vice President and Chief Financial Officer of Honeywell’s Sensing and Controls Business from August 2005 to July 2007 and Vice President of Financial Planning and Analysis for Honeywell’s Transportation Systems Strategic Business Group from March 2003 to July 2005. Mr. Wuebbels previously spent 10 years at General Electric in various senior finance and operations roles around the world. Mr. Wuebbels extensive experience working in our business, including as the Executive Vice President and Chief Financial Officer of SunEdison, allows him to advise our board of directors on a wide range of management and financial issues pertinent to SSI.
Controlled Company
For purposes of rules, we expect to be a “controlled company” after completion of this offering. Controlled companies under those rules are companies of which more than 50% of the voting power for the election of directors is held by an individual, a group or another company. SunEdison will continue to control more than 50% of our common stock upon completion of this offering and will continue to have the right to designate a majority of the members of our board of directors for nomination for election and the voting power to elect such directors following this offering. Accordingly, we expect to be eligible to, and we intend to, take advantage of certain exemptions from corporate governance requirements provided in rules. Specifically, as a controlled company, we will not be required to have (i) a majority of independent directors, (ii) a Nominating and Corporate Governance Committee composed entirely of independent directors, (iii) a Compensation Committee composed entirely of independent directors or (iv) an annual performance evaluation of the Nominating and Corporate Governance and Compensation Committees. Therefore, following this offering, we may not have a majority of independent directors, our Nominating and Corporate Governance and Compensation Committees may not consist entirely of independent directors and such committees may not be subject to annual performance evaluations. Accordingly, you will not have the same protections afforded to stockholders of companies that are subject to all of the applicable corporate governance requirements. In the event that we cease to be a controlled company, we will be required to comply with those requirements after specified transition periods.
The controlled company exemption does not modify the independence requirements for the Audit Committee, and we intend to comply with the requirements of the Sarbanes-Oxley Act and rules, which require that our Audit Committee be composed of at least three members, one of whom will be independent upon the listing of our common stock on , a majority of whom will be independent within 90 days of the date of this prospectus, and each of whom will be independent within one year of our initial public offering.
89
Table of Contents
Composition of our Board of Directors
Upon the completion of this offering, our board will consist of directors. The authorized number of directors may be changed from time to time by resolution of our board of directors. Vacancies on our board of directors can be filled by resolution of our board of directors. Subject to any rights applicable to any then outstanding preferred stock, any additional directorships resulting from an increase in the number of directors may only be filled by the directors then in office unless otherwise required by law or by a resolution passed by our board of directors. The term of office for each director will be until his or her successor is elected at our annual stockholder meeting or his or her death, resignation or removal, whichever is earliest to occur.
Committees of our Board of Directors
Upon the completion of this offering, the standing committees of our board of directors will be an Audit Committee, a Compensation Committee and a Nominating and Corporate Governance Committee. Each of the committees will report to our board of directors as they deem appropriate and as our board of directors may request. The expected composition, duties and responsibilities of these committees are set forth below.
Audit Committee
The Audit Committee will be responsible for, among other matters: (1) oversight and review of our financial statements and financial reporting processes; (2) our systems of internal accounting and financial controls and disclosure controls; (3) the qualifications and independence of our independent auditors; (4) the performance of our internal audit function and independent auditors; and (5) compliance with legal and regulatory requirements and codes of conduct and ethics programs established by management and our board of directors.
Immediately following this offering, the Audit Committee will consist of , and . We believe that will qualify as an independent director according to the rules and regulations of the SEC and with respect to audit committee membership. We expect to add a second independent director within 90 days after our initial public offering, at which time is expected to leave the Audit Committee. We expect to have a fully independent Audit Committee within one year of our initial public offering in order to comply with the applicable rules and regulations of .
We also believe that qualifies as an “audit committee financial expert,” as such term is defined in Item 401(h) of Regulation S-K. Our board of directors will adopt a written charter for the Audit Committee in connection with this offering, which will be available on our corporate website at upon the completion of this offering. The information on our website is not part of this prospectus.
Compensation Committee
The Compensation Committee will be responsible for, among other matters: (1) reviewing and approving all compensation, including incentive compensation and corporate and individual goals and objectives relevant to our chief executive officer and evaluating our chief executive officer’s performance in light of those goals and objectives; (2) reviewing and approving the base salaries, incentive compensation and equity-based compensation of our other executive officers; (3) approving all significant compensation or incentive plans for executives, including material changes to all such plans; and (4) having the sole authority to retain or obtain the advice of any compensation consultant, independent legal counsel or other adviser after taking into account certain factors which address the independence of that consultant, counsel or adviser.
Immediately following this offering, the Compensation Committee will consist of , and . Our board of directors will adopt a written charter for the Compensation Committee in connection with this offering, which will be available on our corporate website at upon the completion of this offering. The information on our website is not part of this prospectus.
90
Table of Contents
Nominating and Corporate Governance Committee
The Nominating and Corporate Governance Committee will be responsible for, among other matters: (1) assisting our board of directors by identifying individuals qualified to become members of our board; (2) recommending to our board the director nominees for the next annual stockholders’ meeting or in connection with filling vacancies on our board; (3) recommending to our board our Corporate Governance Guidelines; and (4) leading our board in its annual review of the board’s performance.
Immediately following this offering, the Nominating and Corporate Governance Committee will consist of , and . Our board of directors will adopt a written charter for the Nominating and Corporate Governance Committee in connection with this offering, which will be available on our corporate website at upon the completion of this offering. The information on our website is not part of this prospectus.
Compensation Committee Interlocks and Insider Participation
No officer or employee has served as a member of our Compensation Committee. None of our executive officers serve as a member of the board of directors or compensation committee of any entity that has one or more executive officers serving on our board of directors or Compensation Committee.
Risk Oversight
Our board of directors will oversee the risk management activities designed and implemented by our management. Our board of directors will execute its oversight responsibility for risk management both directly and through its committees. The full board of directors will also consider specific risk topics, including risks associated with our strategic plan, business operations and capital structure. In addition, our board of directors will receive detailed regular reports from members of our senior management and other personnel that include assessments and potential mitigation of the risks and exposures involved with their respective areas of responsibility.
Our board of directors will delegate to the Audit Committee oversight of our risk management process. Our other board committees will also consider and address risk as they perform their respective committee responsibilities. All committees will report to the full board of directors as appropriate, including when a matter rises to the level of a material or enterprise level risk.
Family Relationships
There are no family relationships between any of our executive officers and directors or director nominees.
Code of Business Ethics and Conduct
We expect our board of directors to adopt a code of business ethics and conduct in connection with the completion of this offering. The code of business ethics and conduct will apply to all of our employees, officers and directors. The full text of our code of business ethics and conduct will be posted on our website. If we make any substantive amendments to this code or grant any waiver from a provision to our chief executive officer, principal financial officer or principal accounting officer, we will disclose the nature of such amendment or waiver on our website or in a report on Form 8-K. The information contained on our website is not part of this prospectus.
91
Table of Contents
The following section provides compensation information pursuant to the scaled disclosure rules applicable to “emerging growth companies” under the rules of the SEC and may contain statements regarding future individual and company performance targets and goals. These targets and goals are disclosed in the limited context of our executive compensation program and should not be understood to be statements of management’s expectations or estimates of results or other guidance. We specifically caution investors not to apply these statements to other contexts.
Overview
Our “Named Executive Officers” for 2012, which consist of our principal executive officer and the two other most highly compensated executive officers, are:
| • | Shaker Sadasivam, our President and Chief Executive Officer; |
| • | William Dunnigan, our ; and |
| • | John Kauffmann, our . |
We currently operate as a business segment of SunEdison and will continue to do so until the consummation of the Transactions. As a result, SunEdison has determined the 2012 compensation of our employees, including our Named Executive Officers, and will continue to do so until the completion of this offering. Unless otherwise stated, the compensation tables and other information set forth below reflect amounts paid or payable or awards granted to our Named Executive Officers by SunEdison under SunEdison’s compensation plans and programs. Following the completion of this offering, our Named Executive Officers will receive compensation and benefits under our compensation programs and plans, except that certain benefits will continue to be provided to our employees, including our Named Executive Officers, by SunEdison until pursuant to a transition services agreement. See “Certain Relationships and Related Party Transactions—Transition Services Agreement.”
Because our Named Executive Officers (other than Dr. Sadasivam) were not executive officers of SunEdison, their cash compensation was initially determined by SunEdison’s senior management in accordance with the philosophy adopted by the compensation committee of SunEdison’s board of directors, but was not specifically determined or reviewed by the compensation committee of SunEdison’s board of directors. As a SunEdison executive officer, Dr. Sadasivam’s compensation was reviewed and determined by SunEdison’s compensation committee, with the advice of that committee’s independent consultant.
Summary Compensation Table
The following table presents summary information regarding the total compensation paid to, earned by, and awarded to each of our Named Executive Officers.
| Name and principal position |
Year | Salary ($)(1) |
Stock awards ($)(2) |
Option awards ($)(2) |
Non-equity incentive plan compensation ($)(3) |
All other compensation ($) |
Total ($) |
|||||||||||||||||||||
| Shaker Sadasivam |
2012 | $ | 418,200 | $ | - | $ | 972,537 | $ | 287,700 | $ | 33,888 | (4) | $ | 1,712,325 | ||||||||||||||
| President and Chief |
2011 | $ | 409,231 | $ | - | $ | 950,061 | $ | 91,500 | $ | 30,558 | (5) | $ | 1,481,350 | ||||||||||||||
| Executive Officer |
2010 | $ | 400,000 | $ | 639,600 | $ | - | $ | 244,200 | $ | 27,156 | (6) | $ | 1,310,956 | ||||||||||||||
| William Dunnigan |
2012 | $ | 285,600 | $ | 19,406 | $ | 137,144 | $ | 102,588 | $ | 14,758 | (7) | $ | 559,496 | ||||||||||||||
| John Kauffmann |
2012 | $ | 300,000 | $ | 17,250 | $ | 113,008 | $ | 101,497 | $ | 25,778 | (8) | $ | 557,533 | ||||||||||||||
92
Table of Contents
| (1) | Amounts shown include cash compensation earned and received as well as cash compensation earned but deferred at the election of the executive officer under SunEdison’s MEMC Retirement Savings Plan. |
| (2) | All option awards reflected in the table are non-qualified stock options granted under SunEdison’s equity plans, which options are exercisable for shares of common stock of SunEdison. The dollar amounts shown for stock awards represent the aggregate grant date fair value with respect to fiscal 2012 in accordance with FASB ASC Topic 718, excluding the effect of forfeitures related to service-based conditions. The dollar amounts shown for option awards represent the aggregate grant date fair value with respect to fiscal 2012 and is based upon the highest probable outcome of the performance-based conditions in accordance with FASB ASC Topic 718, excluding the effect of forfeitures related to service-based conditions. These amounts do not reflect whether our Named Executive Officers have actually realized or will realize a financial benefit from the awards. For a discussion of valuation assumptions, see Note 7 to the combined financial statements included elsewhere in this prospectus. In addition, in 2012, Messrs. Dunnigan and Kauffmann participated in a stock option exchange program pursuant to which they exchanged all of their options that had been granted in 2010 and 2011 for new options. The dollar amounts shown for option awards granted to Messrs. Dunnigan and Kauffmann include the incremental fair value of such options granted in exchange for previously awarded options computed as of the modification date in accordance with FASB ASC Topic 718. |
| (3) | These amounts were awarded for 2012 performance under SunEdison’s short term incentive plan. See “2012 Annual Incentive Plan” below for a description of SunEdison’s short term incentive plan. |
| (4) | Amount shown represents $13,296 in contributions by SunEdison to its MEMC Retirement Savings Plan and $20,592 of accrued paid time off payout. |
| (5) | Amount shown represents $15,181 in contributions by SunEdison to its MEMC Retirement Savings Plan and $15,377 of accrued paid time off payout. |
| (6) | Amount shown represents $14,382 in contributions by SunEdison to its MEMC Retirement Savings Plan and $12,774 of accrued paid time off payout. |
| (7) | Amount shown represents contributions by SunEdison to its MEMC Retirement Savings Plan. |
| (8) | Amount shown represents $15,388 in contributions by SunEdison to its MEMC Retirement Savings Plan and $10,390 of accrued paid time off payout. |
Annual Base Salary
The current base salaries for our Named Executive Officers are:
| Named Executive Officer |
Base Salary | |||
| Shaker Sadasivam |
$ | 437,100 | ||
| William Dunnigan |
$ | 299,936 | ||
| John Kauffmann |
$ | 308,000 | ||
We are currently reviewing the base salaries of our executive officers, including our Named Executive Officers. As a result, the base salaries set forth above may change in connection with the Transactions. If a determination is made to change any of the base salaries, we will include the relevant disclosures in subsequent amendments to this prospectus.
2012 Annual Incentive Plan
SunEdison’s 2012 annual incentive plan had two main components: a company milestone component and a personal goal component. The 2012 plan had “threshold,” “target” and “maximum” payouts, based on a combination of the company performance metrics and personal goal metrics. The “threshold” level of performance for a particular performance goal represented the lowest level of performance for which any bonus would be earned on that performance goal. The “maximum” level of performance represented the level for which the maximum bonus would be earned for that particular goal, and the “target” represented the target level of performance. The actual bonus attributable to each performance goal was calculated based on the actual performance compared to these “threshold,” “target” and “maximum” performance levels. The “threshold,” “target” and “maximum” levels for each of our Named Executive Officers was (with target, threshold, and maximum represented as a percent of base salary):
93
Table of Contents
| Named Executive Officer |
Threshold | Target | Maximum | Actual Annual Incentive Award as a Percentage of Target Award |
||||||||||||
| Shaker Sadasivam |
38% | 75% | 150% | 90% | ||||||||||||
| William Dunnigan |
20% | 40% | 80% | 90% | ||||||||||||
| John Kauffmann |
20% | 40% | 80% | 85% | ||||||||||||
The performance goals were weighted based on their relative importance to achieving SunEdison’s overall goals. For 2012, the company milestone component (performance goals) of the plan was based upon achievement of threshold levels of a combination of total cash flow (60%), operating income (20%) and liquidity (20%). The company-based and personal performance metrics account for varying levels of the total potential award under the 2012 annual incentive plan. For Dr. Sadasivam, the company-based metrics accounted for 80% and the personal performance metrics accounted for 20% of his total potential award. For each of Messrs. Dunnigan and Kauffmann, the company-based metrics accounted for 60% and the personal performance metrics accounted for 40% of his total potential award.
SunEdison’s compensation committee determined that 83% of the company goals were reached. The calculation of the company performance portion for the annual incentive plan is summarized in the table below:
| 2012 Annual Incentive Measure |
2012 Performance vs. Measure |
Weighted Performance Rating | ||
| Total Cash Flow (60% Weight) |
Between Threshold and Target | 43% | ||
| Operating Income, not adjusted (20% Weight) |
Missed Threshold | 0% | ||
| Liquidity (20% Weight) |
Above Maximum | 40% | ||
| 83% Corporate Rating |
In 2012, SunEdison’s compensation committee also incorporated a minimum operating income metric that the Company must meet in order for any bonuses to be awarded under the bonus plan. The minimum operating income metric was based on SunEdison’s operating income for 2012 as adjusted for certain items and was established at $100 million, meaning that if SunEdison failed to obtain this minimum, no bonus payments would be made. In 2012, SunEdison achieved as adjusted operating income in excess of the minimum. Accordingly, the SunEdison’s compensation committee determined that bonuses would be awarded in accordance with the relative achievement of the company goals and personal ratings. The 83% rating for corporate performance was utilized in addition to the personal ratings achieved by each of the Named Executive Officers to calculate the 2012 annual incentive awards. The actual payout for each Named Executive Officer is set forth above in the Summary Compensation Table in the “Non-equity incentive plan compensation” column.
Long-Term Incentive (Equity Awards)
In 2012, all of our Named Executive Officers received a long-term incentive grant in the form of stock options under SunEdison’s equity plans. All Named Executive Officers also received a grant of performance vested options under SunEdison’s equity plans, which grants were made in two tranches in July and September 2012. Such grants were performance based options that will vest, if at all, in 33% increments if SunEdison’s stock achieves target market prices of $7, $10 and $15, respectively. The respective stock price needs to be maintained for 30 consecutive calendar days, and if so, the associated grant increment will vest one year from such occurrence. In addition, in connection with a stock option exchange program, Messrs. Dunnigan and Kauffmann exchanged all of their options that had been granted in 2010 and 2011 for new options. SunEdison implemented the stock option exchange program to revive the retention and motivational value of stock option awards held with employees. The exchange options will vest, if at all, in increments of 33.33% over three years, in the case of Mr. Dunnigan’s options, and in increments of 50% on the first and second anniversaries of the grant date, in the case of Mr. Kauffmann’s options. All of the options are exercisable for common stock of SunEdison.
94
Table of Contents
Health and Retirement Benefits
In 2012, our Named Executive Officers participated in the same broad-based benefit programs offered to other U.S. employees of SunEdison, including healthcare and dental plans, long-term disability insurance, a 401(k) program with a match that is capped by the qualified limit established annually by the Internal Revenue Service and life insurance plans.
Outstanding Equity Awards at Fiscal Year End
The following table summarizes, for each of our Named Executive Officers, the number of shares of SunEdison restricted stock and the number of shares of common stock of SunEdison underlying outstanding stock options held as of December 31, 2012.
| Option Awards | Stock Awards | |||||||||||||||||||||||||||||||
| Name |
Number of Securities Underlying Unexercised Options (#) Exercisable |
Number of Securities Underlying Unexercised Options (#) Unexercisable |
Equity Incentive Plan Awards: Number of Securities Underlying Unexercised Unearned Options (#) |
Option Exercise Price ($) |
Option Expiration Date (1) |
Grant Date of Stock Award |
Number of Shares or Units of Stock That Have Not Vested (#) |
Market Value of Shares or Units of Stock That Have Not Vested ($)(2) |
||||||||||||||||||||||||
| Shaker Sadasivam |
3,025 | — | — | 8.09 | 7/26/2014 | 1/23/2008 | 2,500(3) | 8,025 | ||||||||||||||||||||||||
| 6,250 | — | — | 9.43 | 10/27/2014 | 4/20/2010 | 40,000(4) | 136,425 | |||||||||||||||||||||||||
| 6,250 | — | — | 11.63 | 2/16/2015 | — | — | ||||||||||||||||||||||||||
| 20,000 | — | — | 17.65 | 7/26/2015 | — | — | ||||||||||||||||||||||||||
| 9,150 | — | — | 25.66 | 1/25/2016 | — | — | ||||||||||||||||||||||||||
| 9,300 | — | — | 29.73 | 7/25/2016 | — | — | ||||||||||||||||||||||||||
| 15,000 | — | — | 45.70 | 1/24/2017 | — | — | ||||||||||||||||||||||||||
| 20,000 | — | — | 58.31 | 7/24/2017 | — | — | ||||||||||||||||||||||||||
| 20,000 | — | — | 69.84 | 1/23/2018 | — | — | ||||||||||||||||||||||||||
| 93,750 | 31,250(5) | — | 13.43 | 1/20/2019 | — | — | ||||||||||||||||||||||||||
| 75,000 | 25,000(5) | — | 15.71 | 10/15/2019 | — | — | ||||||||||||||||||||||||||
| 15,330 | 137,970(6) | — | 11.63 | 4/27/2021 | — | — | ||||||||||||||||||||||||||
| — | 250,000(5) | — | 3.45 | 4/25/2022 | — | — | ||||||||||||||||||||||||||
| — | — | 200,000(7) | 1.76 | 7/24/2022 | — | — | ||||||||||||||||||||||||||
| — | — | 246,000(7) | 3.27 | 9/18/2022 | — | — | ||||||||||||||||||||||||||
| William Dunnigan |
— | 36,400(8) | — | 2.77 | 8/20/2019 | 4/27/2011 | 2,000(4) | 6,420 | ||||||||||||||||||||||||
| — | 11,250(5) | — | 3.45 | 4/25/2022 | 4/25/2012 | 5,625(9) | 18,056 | |||||||||||||||||||||||||
| — | — | 60,000(7) | 1.76 | 7/24/2022 | — | — | ||||||||||||||||||||||||||
| — | — | 49,000(7) | 3.27 | 9/18/2022 | — | — | ||||||||||||||||||||||||||
| John Kauffmann |
7,500 | — | — | 10.85 | 1/26/2014 | 1/23/2008 | 2,500(3) | 8,025 | ||||||||||||||||||||||||
| 1,550 | — | — | 8.09 | 7/26/2014 | 4/20/2010 | 20,000(4) | 64,200 | |||||||||||||||||||||||||
| 37,500 | — | — | 9.43 | 10/27/2014 | 4/27/2011 | 1,000(4) | 3,210 | |||||||||||||||||||||||||
| 5,000 | — | — | 11.63 | 2/16/2015 | 4/25/2012 | 5,000(9) | 16,050 | |||||||||||||||||||||||||
| 10,000 | — | — | 17.65 | 7/26/2015 | — | — | ||||||||||||||||||||||||||
| 93,750 | 31,250(5) | — | 13.43 | 1/20/2019 | — | — | ||||||||||||||||||||||||||
| — | 8,332(10) | — | 2.77 | 8/20/2019 | — | — | ||||||||||||||||||||||||||
| 800 | 7,200(6) | — | 11.63 | 4/27/2021 | — | — | ||||||||||||||||||||||||||
| — | 10,000(5) | — | 3.45 | 4/25/2022 | — | — | ||||||||||||||||||||||||||
| — | — | 34,000(7) | 1.76 | 7/24/2022 | — | — | ||||||||||||||||||||||||||
| — | — | 42,000(7) | 3.27 | 9/18/2022 | — | — | ||||||||||||||||||||||||||
| (1) | Except as otherwise indicated, the grant date of all stock option awards is ten years prior to the expiration date. |
| (2) | Based on SunEdison’s closing stock price on December 31, 2012 of $3.21. |
| (3) | The RSUs vest in increments of 50% on the third and the fifth anniversaries of the grant date. |
95
Table of Contents
| (4) | The RSUs vest in increments of 50% on the third and the fourth anniversaries of the grant date. |
| (5) | The stock options vest in increments of 25% over four years commencing on the first anniversary of the grant date. |
| (6) | The stock options vest in increments of 10%, 20%, 30% and 40% over four years commencing on the first anniversary of the grant date. |
| (7) | The stock option grants made on July 24, 2012 and September 18, 2012 are performance based grants that will vest, if at all, in 33% increments if SunEdison’s stock achieves certain target market prices. The option expires on the tenth anniversary of the grant date, provided that if the target market prices are not achieved by the fifth anniversary of the grant date, the option will be cancelled. |
| (8) | The stock options were issued in exchange for stock options previously granted in 2010 and 2011 and vest in increments of 33.33% over three years. The grant date of the stock options was seven years prior to the expiration date. |
| (9) | The RSUs vest in increments of 25% over four years commencing on the first anniversary of the grant date. |
| (10) | The stock options were issued in exchange for stock options previously granted in 2010 and 2011 and vest in increments of 50% on the first and second anniversaries of the grant date. The grant date of the stock options was seven years prior to the expiration date. |
Pension Plan
Each of Dr. Sadasivam and Mr. Kauffmann is a participant in SunEdison’s defined pension plan, which was amended in January 2002 to freeze the accrued benefit for him and other employees who did not meet certain age and service criteria. As of December 31, 2012, Dr. Sadasivam had 8.3 years of credited service under the plan and the present value of his accumulated benefits was $110,058. As of December 31, 2012, Mr. Kauffmann had 21.9 years of credited service under the plan and the present value of his accumulated benefits was $283,146.
Employment and Post-Termination Arrangements
All of our Named Executive Officers are employees at will. None of our Named Executive Officers currently has an employment agreement with SunEdison or us. Prior to the completion of this offering, we expect to enter into employment agreements with certain of our Named Executive Officers.
Under SunEdison’s equity plans, an employee (including our Named Executive Officers) must be terminated without cause or by the employee for good reason within two years following a change in control of SunEdison in order to receive accelerated vesting of stock options and restricted stock units. Under SunEdison’s equity plans, “good reason” is generally considered a material diminution in an employee’s duties and responsibilities, a decrease in an employee’s base salary or benefits or a relocation of an employee’s work location of more than 50 miles.
Under SunEdison’s severance policy, each of our Named Executive Officers would receive either 6 months’, in the case of Messrs. Dunnigan and Kauffman, or 12 months’, in the case of Mr. Sadasivam, salary continuation and continuation of healthcare benefits if such executives were terminated (other than for cause). The salary continuation is paid bi-weekly in accordance with SunEdison’s regular payroll practices for such periods. Receipt of these payments is conditioned on the employee agreeing to execute a standard general release and waiver and to abide by his or her employee confidentiality and non-compete agreement, which provides for a two-year non-compete and two- (or sometimes three-) year non-solicitation (of SunEdison employees and customers) agreement. SunEdison has not typically accelerated the vesting of the equity awards held by its employees, including its named executive officers, in the event of termination of employment. Prior to the completion of this offering, we expect to adopt a new severance policy, the terms of which may differ from SunEdison’s severance policy.
96
Table of Contents
Our Anticipated Executive Compensation Program Following this Offering
Following this offering, our Compensation Committee, which will be appointed by our board of directors, will determine the appropriate compensation plans and programs for our executives. Our Compensation Committee will review and evaluate our executive compensation plans and programs to ensure they are aligned with our compensation philosophy. In addition, our Compensation Committee is expected to retain its own compensation consultant to advise the Compensation Committee in its compensation planning decisions.
We are currently developing the compensation policies, plans and programs for our executives officers, including our Named Executive Officers, that we will implement in connection with the Transactions. We expect such plans will include an equity incentive plan that will permit the grant of stock-based awards to our officers, directors and employees. We will include the relevant disclosures in subsequent amendments to this prospectus.
Risk Assessment and Compensation Practices
SunEdison’s management assessed and discussed with SunEdison’s board of directors the compensation policies and practices for its employees as they relate to its overall risk management, including in relation to our business. Based upon this assessment, we believe that any risks arising from such policies and practices are not reasonably likely to have a material adverse effect on us.
Director Compensation
We are currently developing a compensation program for members of our board of directors other than those who are employed by SunEdison or us. We will include the relevant disclosures in subsequent amendments to this prospectus.
97
Table of Contents
SECURITY OWNERSHIP OF CERTAIN BENEFICIAL OWNERS AND MANAGEMENT
The following table sets forth certain information regarding beneficial ownership of our common stock as of , 2013, after giving effect to the Transactions, and as adjusted to reflect the sale of the shares of common stock in this offering, for
| • | each beneficial owner of more than 5% of our common stock; |
| • | each Named Executive Officer; |
| • | each of our directors and director nominees; and |
| • | all of our executive officers and directors as a group. |
Each stockholder’s percentage ownership before this offering is based on shares of our common stock outstanding as of , 2013, after giving effect to the Transactions. Each stockholder’s percentage ownership after this offering is based on shares of our common stock outstanding immediately after the completion of this offering, or shares of our common stock outstanding assume the underwriters exercise in full their option to purchase additional shares. We have granted the underwriters an option to purchase up to additional shares of our common stock to cover over-allotments, if any, and the table below assumes no exercise of that option.
Beneficial ownership for the purposes of the following table is determined in accordance with the rules and regulations of the SEC. These rules generally provide that a person is the beneficial owner of securities if such person has or shares the power to vote or direct the voting thereof, or to dispose or direct the disposition thereof or has the right to acquire such powers within 60 days. Common stock subject to options that are currently exercisable or exercisable within 60 days of , 2013 are deemed to be outstanding and beneficially owned by the person holding the options. These shares, however, are not deemed outstanding for the purposes of computing the percentage ownership of any other person. Except as disclosed in the footnotes to this table and subject to applicable community property laws, we believe that each stockholder identified in the table possesses sole voting and investment power over all shares of common stock shown as beneficially owned by the stockholder.
Unless otherwise noted below, the address of each beneficial owner listed in the table is c/o SunEdison Semiconductor, Inc., 501 Pearl Drive (City of O’Fallon), St. Peters, Missouri 63376.
|
|
Percentage of Shares Beneficially Owned | |||||||||||||
| Name |
Shares Beneficially |
Prior to Offering |
After Offering (No Exercise of Underwriters’ Option) |
After Offering (Full Exercise of Underwriters’ Option) |
||||||||||
| 5% Beneficial Owner: |
||||||||||||||
| SunEdison |
100.0% | % | % | |||||||||||
| Directors, Proposed Directors and Named Executive Officers: | ||||||||||||||
| Shaker Sadasivam |
- | - | ||||||||||||
| William Dunnigan |
- | - | ||||||||||||
| John Kauffman |
- | - | ||||||||||||
| Brian Wuebbels |
- | - | ||||||||||||
| Directors and executive officers as a group ( persons) | - | - | ||||||||||||
98
Table of Contents
CERTAIN RELATIONSHIPS AND RELATED PARTY TRANSACTIONS
Prior to the consummation of this offering, our board of directors will adopt a written policy, which we refer to as the “related person transaction approval policy,” for the review of any transaction, arrangement or relationship in which we are a participant, if the amount involved exceeds $120,000 and one of our executive officers, directors, director nominees or beneficial holders of more than 5% of our total equity (or their immediate family members), each of whom we refer to as a “related person,” has a direct or indirect material interest. This policy was not in effect when we entered into the transactions described below. Each of the agreements between us and SunEdison and its subsidiaries that have been entered into prior to the completion of this offering, and any transactions contemplated thereby, will be deemed to be approved and not subject to the terms of such policy.
If a related person proposes to enter into such a transaction, arrangement or relationship, which we refer to as a “related person transaction,” the related person must report the proposed related person transaction to the chair of our Audit Committee for so long as the controlled company exception applies and our Nominating and Corporate Governance Committee thereafter. The policy calls for the proposed related person transaction to be reviewed and, if deemed appropriate, approved by the committee. In approving or rejecting such proposed transactions, the committee will be required to consider relevant facts and circumstances. The committee will approve only those transactions that, in light of known circumstances, are deemed to be in our best interests. In the event that any member of the committee is not a disinterested person with respect to the related person transaction under review, that member will be excluded from the review and approval or rejection of such related person transaction; provided, however, that such committee member may be counted in determining the presence of a quorum at the meeting of the committee at which such transaction is considered. If we become aware of an existing related person transaction which has not been approved under the policy, the matter will be referred to the committee. The committee will evaluate all options available, including ratification, revision or termination of such transaction. In the event that management determines that it is impractical or undesirable to wait until a meeting of the committee to consummate a related person transaction, the chair of the committee may approve such transaction in accordance with the related person transaction approval policy. Any such approval must be reported to the committee at its next regularly scheduled meeting. A copy of our related person transaction approval policy will be available on our website upon completion of this offering.
Relationship with SunEdison
Prior to or simultaneously with the completion of this offering, we and SunEdison will enter into certain agreements that will effect the separation of our business from SunEdison and provide a framework for our ongoing relationship with SunEdison. The following is a summary of certain material terms of the agreements that we intend to enter into with SunEdison prior to the completion of this offering. Certain material terms of these agreements have not yet been determined. All of the terms of these agreements will be determined prior to the completion of this offering, and the agreements will be entered into between us and SunEdison prior to or simultaneously with the completion of this offering.
The agreements summarized below will be filed as exhibits to the registration statement of which this prospectus is a part, and the summaries of these agreements set forth the terms of the agreements that we believe are material. These summaries are qualified in their entirety by reference to the full text of such agreements.
Separation Agreement
We intend to enter into a separation agreement with SunEdison prior to or simultaneously with the completion of this offering. This separation agreement will govern certain pre-offering transactions between SunEdison and us, as well as aspects of the relationship between SunEdison and us following this offering and the Transactions which are not otherwise governed by the other agreements set forth below.
99
Table of Contents
Supply Agreement
Prior to or simultaneously with the completion of this offering, we will enter into an agreement pursuant to which SunEdison will supply us with polysilicon. We expect that under the agreement, SunEdison will commit to supply us with a minimum annual quantity of polysilicon based upon requirements projections provided by us prior to the beginning of each year. We expect that the agreement will not obligate us to purchase a minimum quantity of our polysilicon requirements from SunEdison. We expect the polysilicon pricing will be fixed through 2018, and thereafter will be mutually agreed upon between us and SunEdison based on market prices, subject to certain limits on annual pricing changes. We expect the supply agreement will have an initial term of five-years and will automatically renew for additional terms of years unless terminated by us with one year prior notice or by SunEdison with two years’ prior notice.
Intellectual Property Licensing Agreements
Under the intellectual property agreements we will enter into in connection with the Transactions, SunEdison will license to us certain of its retained intellectual property rights applicable to manufacturing semiconductor wafers, including certain rights related to CCZ, diamond wire cutting and FBR, excluding high pressure silane technology. The cross license of existing patents granted between us and SunEdison will be limited to semiconductor and solar applications, respectively. This cross license, excluding CCZ, diamond wire cutting and FBR, will be perpetual. For a period of five years following the completion of this offering, SunEdison will license newly developed CCZ and diamond wire cutting intellectual property to us, provided that the license will be limited by both use in semiconductor applications and geography. The FBR and CCZ license will terminate in the event that we undergo a change in control. We expect the license agreements will also include provisions pursuant to which we and SunEdison will collaborate on future R&D activities with respect to the licensed intellectual property and projects related thereto.
In connection with the license agreements, we also expect to enter into patent pooling arrangements with SunEdison pursuant to which each party will agree not to sue the other party for infringement of any patent which is part of a “patent pool.” We expect the patent pool will include substantially all of our and SunEdison’s issued patents as of the completion of this offering. We expect the patent pool will be updated annually for new patents issued to either party that fall within applicable fields.
In addition, SunEdison will grant to us a transitional license to use certain of SunEdison’s trademarks for a period of time following the completion of this offering.
Transition Services Agreement
Historically, SunEdison has provided us significant corporate and shared services and resources related to corporate functions such as risk management, communications, corporate administration, finance, accounting, audit, legal, information technology, human resources, compliance, employee benefits and stock compensation administration, or the SunEdison Services. We will enter into a transition services agreement with SunEdison pursuant to which SunEdison will provide the SunEdison Services to us for an initial term of one to two years following the Transactions, unless earlier terminated or extended according to the terms of the transition services agreement. We will pay SunEdison mutually agreed-upon fees for the SunEdison Services, which will be based on SunEdison’s cost of providing the SunEdison Services. We estimate that the aggregate annual fees we will pay initially will be approximately $ per year.
In addition, we will agree in the transition services agreement to provide SunEdison with limited reverse transitional services with respect to the continued use of certain information technology or other assets or resources that SunEdison will convey to us in connection with the Transactions. SunEdison will pay us mutually agreed-upon fees for such services or resources, which will be based on our cost of providing those services or resources. We may from time to time prior to or following this offering agree to provide SunEdison with
100
Table of Contents
additional reverse transitional services with respect to continued use of assets or resources conveyed to us. To the extent such services are provided, SunEdison would pay us a mutually agreed-upon fee for these services, which fee would be based on our costs of providing the services to SunEdison.
Tax Matters Agreement
We intend to enter into a tax matters agreement with SunEdison immediately prior to the completion of this offering that will govern the parties’ respective rights, responsibilities and obligations with respect to tax liabilities and benefits, tax attributes, the preparation and filing of tax returns, the control of audits and other tax proceedings and other matters regarding taxes. In general, under the agreement:
| • | We will be responsible for any U.S. federal, state, local, or foreign income taxes and any U.S. state or local non-income taxes (and any related interest, penalties, or audit adjustments) imposed on us and our subsidiaries. |
| • | SunEdison will be responsible for any U.S. federal, state, local, or foreign income taxes and any U.S. state or local non-income taxes (and any related interest, penalties, or audit adjustments) imposed on SunEdison and its subsidiaries (excluding us and our subsidiaries). |
| • | We will be responsible for preparing and filing any tax returns that include only us and our subsidiaries. |
| • | SunEdison will be responsible for preparing and filing any tax returns that include only SunEdison and its subsidiaries (excluding us and our subsidiaries). |
| • | We will have exclusive authority to control tax contests with respect to tax returns that include only us and our subsidiaries. |
| • | SunEdison generally will have exclusive authority to control tax contests that include only SunEdison and its subsidiaries (excluding us and our subsidiaries). SunEdison will be responsible for certain specified foreign taxes directly resulting from certain aspects of the Transactions. |
Neither party’s obligations under the agreement will be limited in amount or subject to any cap. The agreement will also assign responsibilities for administrative matters, such as the filing of returns, payment of taxes due, retention of records and conduct of audits, examinations or similar proceedings. In addition, the agreement provides for cooperation and information sharing with respect to tax matters.
Registration Rights Agreement
We intend to enter into a registration rights agreement with SunEdison prior to or concurrently with the completion of this offering, pursuant to which we will agree that, upon the request of SunEdison, we will use our reasonable best efforts to effect the registration under applicable federal and state securities laws of any shares of our common stock held by SunEdison following this offering. We expect the registration rights agreement will include the following material terms.
Demand Registration
SunEdison will be able to request registration under the Securities Act of all or any portion of our shares covered by the agreement and we will be obligated, subject to limited exceptions, to register such shares as requested by SunEdison. SunEdison will be able to request that we complete demand registrations and underwritten offerings in a twelve month period, subject to limitations on minimum offering size. SunEdison will be able to designate the terms of each offering effected pursuant to a demand registration, which may take any form, including a shelf registration.
101
Table of Contents
Piggy-back Registration
If we at any time intend to file on our behalf or on behalf of any of our other security holders a registration statement in connection with a public offering of any of our securities on a form and in a manner that would permit the registration for offer and sale of our common stock held by SunEdison, SunEdison will have the right to include its shares of our common stock in that offering.
Registration Expenses
We will generally be responsible for all registration expenses in connection with the performance of our obligations under the registration rights provisions in the registration rights agreement. SunEdison is responsible for its own internal fees and expenses, any applicable underwriting discounts or commissions and any stock transfer taxes.
Indemnification
Generally, the agreement will contain indemnification and contribution provisions by us for the benefit of SunEdison and, in limited situations, by SunEdison for the benefit of us with respect to the information provided by SunEdison included in any registration statement, prospectus or related document.
Transfer
If SunEdison transfers shares covered by the agreement, it will be able to transfer the benefits of the registration rights agreement to transferees of 5% of the shares of our common stock outstanding immediately following the completion of this offering, provided that each transferee agrees to be bound by the terms of the registration rights agreement.
Term
The registration rights will remain in effect with respect to any shares covered by the agreement until:
| • | such shares have been sold pursuant to an effective registration statement under the Securities Act; |
| • | such shares have been sold to the public pursuant to Rule 144 under the Securities Act; |
| • | such shares may be sold to the public pursuant to Rule 144 under the Securities Act without being subject to the volume restrictions in such rule; or |
| • | such shares have been sold in a transaction in which the transferee is not entitled to the benefits of the registration rights agreement. |
102
Table of Contents
DESCRIPTION OF CERTAIN INDEBTEDNESS
New Senior Credit Facility
In connection with the Transactions, we intend to enter into a new senior credit facility with a syndicate of banks providing for (i) a 3-year $ million senior secured revolving credit facility and (ii) a 7-year $ million senior secured term loan. Proceeds from borrowings under the term loan will be used to fund a portion of the payment we will make to SunEdison in connection with the Transactions. We do not expect to have any borrowings outstanding under the revolving credit facility upon completion of this offering. We currently do not have commitments from any prospective lenders with respect to the new senior credit facility but expect to obtain such commitments over the next several months. To date, we have only had preliminary discussions with prospective lenders regarding the specific terms of the new senior credit facility and, as a result, the final, definitive terms may differ from those described below and any such differences may be significant. We intend to update and supplement the summary set forth below in amendments to the registration statement of which this prospectus is a part as such terms are finalized.
Borrowings under the new senior credit facility will bear interest at market rates based on market conditions at the time of the execution of the new senior credit facility and negotiations with our prospective lenders. Our obligations under the new senior credit facility are expected to be guaranteed by all of SSI’s direct and indirect, existing and future, domestic subsidiaries and secured on a first priority basis by substantively all of our domestic assets. The new senior credit facility will contain customary financial maintenance covenants, including a maximum total leverage ratio and a minimum interest coverage ratio, as well as a number of customary affirmative and negative covenants that, among other things, will limit or restrict the ability of us and our subsidiaries to, in each case, subject to certain exceptions:
| • | incur additional indebtedness and guarantee indebtedness; |
| • | pay dividends on or make distributions in respect of capital stock or make certain other restricted payments or investments; |
| • | enter into certain agreements that restrict distributions from restricted subsidiaries; |
| • | sell or otherwise dispose of assets, including capital stock of restricted subsidiaries; |
| • | enter into transactions with affiliates; |
| • | create or incur liens; |
| • | merge, consolidate or sell substantially all of our assets; |
| • | make acquisitions or other investments; and |
| • | make certain payments on indebtedness. |
The new senior credit facility will also contain customary events of default, including, among others, nonpayment of principal, interest, fees or other amounts subject to a grace period; material inaccuracy of a representation or warranty when made; violation of a covenant, subject to grace periods after notice; cross-default to material indebtedness; certain bankruptcy events; and a change of control. Our ability to borrow under the revolving credit facility will be dependent on, among other things, our compliance with the financial ratios described above. Failure to comply with these ratios or the other provisions of the senior credit facility, subject to certain grace periods, could, absent a waiver or an amendment from the lenders under such agreement, restrict the availability of the revolving credit facility and permit the acceleration of all outstanding borrowings under such senior credit facility.
103
Table of Contents
In connection with this offering, we will amend and restate our certificate of incorporation and bylaws. Copies of the forms of our amended and restated certificate of incorporation and bylaws are filed as exhibits to the registration statement of which this prospectus forms a part. The provisions of our certificate of incorporation and bylaws and relevant sections of the Delaware General Corporation Law, or the DGCL, are summarized below. The following summary is qualified in its entirety by the provisions of our amended and restated certificate of incorporation and bylaws and is subject to the applicable provisions of the DGCL.
General
Upon completion of this offering, our authorized capital stock will consist of shares of common stock, par value $0.01 per share, and shares of preferred stock, par value $0.01 per share. Upon the completion of this offering, we will have shares of common stock outstanding and no shares of preferred stock outstanding.
Common Stock
Voting Rights
Except as provided by the DGCL or our certificate of incorporation, holders of our common stock have the sole right and power to vote on all matters on which a vote of our shareholders is to be taken. On all matters submitted to a vote of stockholders, each holder of our common stock is entitled to one vote per share. Our bylaws will provide that the presence, in person or by proxy, of holders of shares representing a majority of the outstanding shares of capital stock entitled to vote at a stockholders’ meeting shall constitute a quorum. When a quorum is present, the affirmative vote of a majority of the votes cast is required to take action, unless otherwise specified by the DGCL or our certificate of incorporation, except for the election of directors, which is determined by a plurality vote.
No common stockholder will be entitled to exercise any right of cumulative voting.
Dividends
Subject to any preferential rights of holders of any outstanding shares of preferred stock, holders of our common stock will be entitled to receive dividends and other distributions in cash, stock or property as may be declared by our board of directors from time to time out of our assets or funds legally available for dividends or other distributions. Because we are a holding company, our ability to pay dividends on our common stock limited by restrictions on the ability of our subsidiaries to pay dividends or make distributions to us, including restrictions under the terms of the agreements governing our indebtedness. See “Description of Certain Indebtedness” and “Dividend Policy.”
Other Rights
In the event of any reorganization with us and one or more corporations or a merger or share exchange of us with another corporation in which shares of our common stock are converted into or exchangeable for shares of stock, other securities or property, including cash, all holders of our common stock will be entitled to receive with respect to each share held the same kind and amount of shares of stock and other securities and property, including cash.
Upon liquidation, dissolution or winding up of our business, after payment in full of the amounts required to be paid to holders of any outstanding shares of preferred stock, if any, all holders of common stock are entitled to receive the same amount per share with respect to any distribution of assets to holders of shares of common stock.
104
Table of Contents
Preferred Stock
Our board of directors will have the authority, without any further vote or action by the stockholders, to issue preferred stock in one or more series and to fix the preferences, limitations and rights of the shares of each series, including dividend rights, conversion rights, voting rights, terms of redemption, liquidation preference, sinking fund terms and the number of shares constituting any series or the designation of any series to the fullest extent permitted by the DGCL. The issuance of preferred stock could have the effect of decreasing the trading price of our common stock, restricting dividends on our common stock, diluting the voting power of our common stock, impairing the liquidation rights of our common stock, or delaying or preventing a change in control of our company. At present, we have no plans to issue preferred stock.
Anti-Takeover Effects of Provisions of Our Certificate of Incorporation and Bylaws, and of Delaware Law
The rights of our stockholders and related matters are governed by the DGCL, our certificate of incorporation and bylaws, certain provisions of which may discourage or make more difficult a takeover attempt that a stockholder might consider in his or her best interest by means of a tender offer or proxy contest or removal of our incumbent officers or directors. These provisions, which are summarized below, may also adversely affect prevailing market prices for our common stock. However, we believe that the benefits of increased protection give us the potential ability to negotiate with the proponent of an unsolicited proposal to acquire or restructure us and outweigh the disadvantage of discouraging those proposals because negotiation of the proposals could result in an improvement of their terms.
Undesignated Preferred Stock
The ability to authorize undesignated preferred stock will make it possible for our board of directors to issue preferred stock with super voting, special approval, dividend or other rights or preferences on a discriminatory basis that could impede the success of any attempt to acquire us. These and other provisions may have the effect of deferring, delaying or discouraging hostile takeovers, or changes in control or management of our company.
Stockholder Action by Written Consent
Our certificate of incorporation permits stockholders to take action by written consent in lieu of an annual or special meeting until the first date on which SunEdison ceases to beneficially own a majority of the total voting power of the outstanding shares of all classes of capital stock entitled to vote (on matters other than the election of directors) if such consent or consents, in writing, setting forth the action so taken, is signed by the holders of outstanding capital stock having not less than the minimum number of votes that would be necessary to authorize or take such action at a meeting at which all shares entitled to vote thereon were present and voted. Thereafter, stockholders will only be able to take action at an annual or special meeting called in accordance with our bylaws.
Special Meeting of Stockholders and Advance Notice Requirements for Stockholder Proposals
Our certificate of incorporation and bylaws provide that, except as otherwise required by law, special meetings of the stockholders can only be called by the chairman of the board of directors or a majority of the board of directors through a special resolution.
In addition, our bylaws require advance notice procedures for stockholder proposals to be brought before an annual meeting of stockholders, including the nomination of directors. Stockholders at an annual meeting may only consider the proposals specified in the notice of meeting or brought before the meeting by or at the direction of the board of directors, or by a stockholder of record on the record date for the meeting, who is entitled to vote at the meeting and who has delivered a timely written notice, in proper form to our secretary, of the stockholder’s intention to bring such business before the meeting.
105
Table of Contents
These provisions could have the effect of delaying until the next stockholder meeting any stockholder actions, even if they are favored by the holders of a majority of our outstanding voting securities.
Supermajority Voting
From and after the first date on which SunEdison ceases to beneficially own a majority of the total voting power of the outstanding shares of all classes of our capital stock entitled to vote (on matters other than the election of directors), the vote of the holders of not less than 66 2/3% of the votes entitled to be cast is required to amend our bylaws and the provisions relating to conflicts of interest and our classified board in our certificate of incorporation. The foregoing provisions may discourage attempts by others to acquire control of us without negotiation with our board of directors. This enhances our board of directors’ ability to attempt to promote the interests of all of our stockholders. However, to the extent that these provisions make us a less attractive takeover candidate, they may not always be in our best interests or in the best interests of our stockholders.
Business Combinations with Interested Stockholders
As a Delaware corporation, we will be subject to the restrictions under Section 203 of the DGCL regarding corporate takeovers. In general, Section 203 prohibits a publicly-held Delaware corporation from engaging, under certain circumstances, in a business combination with an interested stockholder for a period of three years following the date the person became an interested stockholder, unless:
| • | prior to the date of the transaction, the board of directors of the corporation approved either the business combination or the transaction which resulted in the stockholder becoming an interested stockholder; |
| • | upon completion of the transaction that resulted in the stockholder becoming an interested stockholder, the interested stockholder owned at least 85% of the voting stock of the corporation outstanding at the time such transaction commenced, excluding, for purposes of determining the number of shares outstanding, (1) shares owned by persons who are directors and also officers of the corporation and (2) shares owned by employee stock plans in which employee participants do not have the right to determine confidentially whether shares held subject to the plan will be tendered in a tender or exchange offer; or |
| • | on or subsequent to the date of the transaction, the business combination is approved by the board of directors of the corporation and authorized at an annual or special meeting of stockholders, and not by written consent, by the affirmative vote of at least 66 2/3% of the outstanding voting stock which is not wholly-owned by the interested stockholder. |
In this context, a business combination includes a merger, asset or stock sale or other transaction resulting in a financial benefit to the interested stockholder. An interested stockholder is a person who, together with affiliates and associates, owns or, within three years prior to the determination of interested stockholder status owned, 15% or more of a corporation’s outstanding voting stock.
A Delaware corporation may “opt out” of Section 203 with an express provision in its original certificate of incorporation or an express provision in its certificate of incorporation or bylaws resulting from amendments approved by holders of at least a majority of the corporation’s outstanding voting shares. We will not elect to “opt out” of Section 203. However, SunEdison and its affiliates have been approved as an interested stockholder and therefore are not subject to Section 203. For so long as SunEdison owns a majority of the voting shares entitled to be cast in elections of directors, and therefore has the ability to designate a majority of our board of directors, directors designated by SunEdison to serve on our board of directors would have the ability to pre-approve other parties, including potential transferees of SunEdison’s shares of our company, so that Section 203 would not apply to such other parties.
106
Table of Contents
Corporate Opportunity
Our certificate of incorporation provides that we renounce any interest or expectancy in, or in being offered an opportunity to participate in, any business opportunity that may from time to time be presented to SunEdison or any of its officers, directors, agents, stockholders, members, partners, affiliates and subsidiaries (other than us and our subsidiaries) and that may be a business opportunity for SunEdison, even if the opportunity is one that we might reasonably have pursued or had the ability or desire to pursue if granted the opportunity to do so. No such person will be liable to us for breach of any fiduciary or other duty, as a director or officer or otherwise, by reason of the fact that such person, acting in good faith, pursues or acquires any such business opportunity, directs any such business opportunity to another person or fails to present any such business opportunity, or information regarding any such business opportunity, to us unless, in the case of any such person who is our director or officer, any such business opportunity is expressly offered to such director or officer solely in his or her capacity as our director or officer. Neither SunEdison nor any of its representatives has any duty to refrain from engaging directly or indirectly in the same or similar business activities or lines of business as us or any of our subsidiaries.
Limitation of Liability of Directors
Our certificate of incorporation provides that none of our directors will be liable to us or our stockholders for monetary damages for any breach of fiduciary duty as a director, except to the extent otherwise required by the DGCL. The effect of this provision is to eliminate our rights, and our stockholders’ rights, to recover monetary damages against a director for breach of a fiduciary duty of care as a director. This provision does not limit or eliminate our right, or the right of any stockholder, to seek non-monetary relief, such as an injunction or rescission in the event of a breach of a director’s duty of care. In addition, our certificate of incorporation provides that if the DGCL is amended to authorize the further elimination or limitation of the liability of a director, then the liability of the directors will be eliminated or limited to the fullest extent permitted by the DGCL, as so amended. These provisions will not alter the liability of directors under federal or state securities laws. Our certificate of incorporation also includes provisions for the indemnification of our directors and officers to the fullest extent authorized or permitted by law. Further, we intend to enter into indemnification agreements with our directors and executive officers which would require us, among other things, to indemnify them against certain liabilities which may arise by reason of their status or service as a director or officer and to advance to them expenses, subject to reimbursement to us if it is determined that they are not entitled to indemnification. We also intend to maintain director and officer liability insurance, if available on reasonable terms.
Exclusive Jurisdiction of Certain Actions
Our certificate of incorporation requires, to the fullest extent permitted by law, that derivative actions brought in the name of our company, actions against directors, officers and employees for breach of fiduciary duty and other similar actions may be brought only in the Court of Chancery in the State of Delaware. Although we believe this provision benefits us by providing increased consistency in the application of Delaware law in the types of lawsuits to which it applies, the provision may have the effect of discouraging lawsuits against our directors and officers. The enforceability of similar exclusive jurisdiction provisions in other companies’ certificates of incorporation has been challenged in legal proceedings, and it is possible that, in connection with any action, a court could find the exclusive jurisdiction provision contained in our certificate of incorporation to be inapplicable or unenforceable in such action.
Transfer Agent and Registrar
The transfer agent and registrar for our common stock is . Its address is .
107
Table of Contents
Listing
Our common stock has been approved for listing on under the symbol “WFR.”
108
Table of Contents
SHARES ELIGIBLE FOR FUTURE SALE
Prior to this offering, there has been no public market for our common stock. Future sales of substantial amounts of our common stock in the public market, or the perception that such sales may occur, could adversely affect the prevailing market price of our common stock. No prediction can be made as to the effect, if any, future sales of shares, or the availability of shares for future sales, will have on the market price of our common stock prevailing from time to time. We also cannot predict with certainty whether or when SunEdison will sell its remaining shares of our common stock. The sale of substantial amounts of our common stock in the public market, or the perception that such sales could occur, could harm the prevailing market price of our common stock.
Upon completion of this offering, we will have shares of common stock outstanding. As a result of the lock-up agreements, other contractual restrictions on resale and the provisions of Rule 144, described below, our common stock will be available for sale in the public market as follows: (i) shares of common stock to be sold in this offering will be freely tradable without restriction or further registration under the Securities Act (other than restrictions pursuant to lock-up agreements entered into by participants in the directed share program) and (ii) shares of common stock will be available for sale at various times after 180 days after the date of this prospectus (subject, in some cases, to volume limitations).
Sale of Restricted Shares
All of the shares of common stock sold in this offering will be freely tradable without restriction or further registration under the Securities Act, except that any shares purchased by or owned by our “affiliates,” as that term is defined in Rule 144 under the Securities Act, may generally only be sold publicly in compliance with the limitations of Rule 144 described below. As defined in Rule 144, an affiliate of an issuer is a person that directly or indirectly, through one or more intermediaries, controls, or is controlled by or is under common control with, such issuer. Immediately following the completion of this offering, SunEdison will own shares , or %, of our common stock. Shares held by SunEdison will be “restricted securities” as that term is used in Rule 144. Subject to contractual restrictions, including the lock-up agreement described below, SunEdison will be entitled to sell these shares in the public market only if the sale of such shares is registered with the SEC or if the sale of such shares qualifies for an exemption from registration under Rule 144 or any other applicable exemption under the Securities Act. At such time as these restricted shares become unrestricted and available for sale, the sale of these restricted shares, whether pursuant to Rule 144 or otherwise, may have a negative effect on the price of our common stock.
Rule 144
In general, under Rule 144 of the Securities Act as currently in effect, once we have been subject to public company reporting requirements for at least 90 days, a person who is not deemed to have been one of our affiliates for purposes of the Securities Act at any time during 90 days preceding a sale and who has beneficially owned the shares proposed to be sold for at least six months, including the holding period of any prior owner other than our affiliates, is entitled to sell such shares without complying with the manner of sale, volume limitation or notice provisions of Rule 144, subject to compliance with the public information requirements of Rule 144. If such a person has beneficially owned the shares proposed to be sold for at least one year, including the holding period of any prior owner other than our affiliates, then such person is entitled to sell such shares without complying with any of the requirements of Rule 144.
109
Table of Contents
In general, under Rule 144 as currently in effect, our affiliates or persons selling shares on behalf of our affiliates are entitled to sell within any three-month period beginning 90 days after the date of this prospectus, a number of shares that does not exceed the greater of:
| • | 1% of the number of shares of common stock then outstanding; or |
| • | the average weekly trading volume of the common stock during the four calendar weeks preceding the filing of a notice on Form 144 with respect to such sale. |
Rule 144 also provides that a person who is not deemed to have been an affiliate of ours at any time during the three months preceding a sale and who has for at least six months beneficially owned shares of our common stock that are restricted securities, will be entitled to freely sell such shares of our common stock subject only to the availability of current public information regarding us. A person who is not deemed to have been an affiliate of ours at any time during the three months preceding a sale and who has beneficially owned for at least one year shares of our common stock that are restricted securities, will be entitled to freely sell such shares of our common stock under Rule 144 without regard to the current public information requirements of Rule 144.
Registration Rights
As described above in “Certain Relationships and Related Party Transactions—Registration Rights Agreement,” following the completion of this offering, subject to the 180-day lock-up period described below, SunEdison will be entitled, subject to certain exceptions, to certain rights with respect to the registration under the Securities Act of the shares of common stock held by them. By exercising their registration rights and causing a large number of shares to be registered and sold in the public market, SunEdison could cause the price of our common stock to fall. In addition, any demand to include such shares in our registration statements could have a material adverse effect on our ability to raise needed capital. We have not granted any other holders of our securities any registration rights other than pursuant to the Registration Rights Agreement.
Stock Plans
We intend to file a registration statement on Form S-8 to register the issuance of an aggregate of shares of our common stock reserved for issuance under the equity incentive plan we intend to adopt in connection with this offering. Such registration statement will become effective upon filing with the SEC. Shares registered under such registration statement will be available for sale in the open market following the effective date, unless such shares are subject to vesting restrictions with us, Rule 144 restrictions applicable to our affiliates or the lock-up restrictions described below.
Lock-Up Agreements
We and each of our directors and officers and SunEdison have agreed that, without the prior written consent of Deutsche Bank Securities Inc. and Goldman, Sachs & Co. on behalf of the underwriters, we and they will not (subject to certain exceptions), during the period ending 180 days after the date of this prospectus:
| • | offer, pledge, sell, contract to sell, sell any option or contract to purchase, purchase any option or contract to sell, grant any option, right or warrant to purchase, lend, or otherwise transfer or dispose of, directly or indirectly, any shares of common stock or any other securities convertible into or exercisable or exchangeable for common stock; or |
| • | enter into any swap or other arrangement that transfers to another, in whole or in part, any of the economic consequences of ownership of the common stock; |
whether any transaction described above is to be settled by delivery of shares of our common stock or such other securities, in cash or otherwise. For additional information, see “Underwriting.”
110
Table of Contents
CERTAIN MATERIAL U.S. FEDERAL INCOME TAX CONSIDERATIONS FOR NON-U.S. HOLDERS
Overview
The following is a general summary of certain U.S. federal income and estate tax consequences to non-U.S. holders, as defined below, of the purchase, ownership and disposition of shares of our common stock. This summary deals only with shares of common stock purchased in this offering that are held as capital assets (generally, property held for investment) by a non-U.S. holder.
For purposes of this discussion, a “non-U.S. holder” means a beneficial owner of shares of our common stock that is, for U.S. federal income tax purposes, an individual, corporation, estate or trust, but is not any of the following:
| • | an individual who is a citizen or resident of the United States; |
| • | a corporation (or other entity treated as a corporation for U.S. federal income tax purposes) created or organized under the laws of the United States, any state thereof or the District of Columbia; |
| • | an estate the income of which is subject to U.S. federal income taxation regardless of its source; or |
| • | a trust if it (1) is subject to the primary supervision of a court within the United States and one or more U.S. persons have the authority to control all substantial decisions of the trust or (2) has a valid election in effect under applicable U.S. Treasury regulations to be treated as a U.S. person for U.S. federal income tax purposes. |
If any entity or arrangement treated as a partnership for U.S. federal income tax purposes holds shares of our common stock, the tax treatment of a partner in such partnership generally will depend upon the status of the partner and the activities of the partner and the partnership. If you are a partnership or a partner of a partnership considering an investment in shares of our common stock, you should consult your own tax advisors.
This summary is based upon the U.S. Internal Revenue Code of 1986, as amended, or the Code, applicable U.S. Treasury regulations, rulings and other administrative pronouncements and judicial decisions, all as of the date hereof. Those authorities are subject to different interpretations and may be changed, perhaps retroactively, so as to result in U.S. federal income tax consequences different from those summarized below. We cannot assure you that a change in law will not alter significantly the tax considerations described in this summary.
This summary does not address all aspects of U.S. federal income and estate taxation. This summary does not deal with the alternative minimum tax or U.S. federal taxes other than U.S. federal income and estate taxes (such as gift taxes or the Medicare tax on certain investment income) or with foreign, state or local tax or tax treaty considerations that may be relevant to non-U.S. holders. In addition, this summary does not describe the U.S. federal income tax consequences applicable to you if you are subject to special treatment under U.S. federal income tax laws (including if you are a U.S. expatriate, an entity subject to United States anti-inversion rules, a financial institution, an insurance company, a tax-exempt entity, a trader, broker or dealer in securities or currencies, a trader that elects to mark–to–market your securities, a “controlled foreign corporation,” a “passive foreign investment company,” an entity treated as a partnership or other pass-through entity for U.S. federal income tax purposes (or an investor in such a pass-through entity), a person who acquired shares of our common stock as compensation or otherwise in connection with the performance of services, or a person who has acquired shares of our common stock as part of a straddle, hedge, conversion transaction or other integrated investment).
111
Table of Contents
We have not sought and do not expect to seek any rulings from the U.S. Internal Revenue Service, or the IRS, regarding the matters discussed below. There can be no assurance that the IRS will not take positions concerning the tax consequences of the purchase, ownership or disposition of shares of our common stock that differ from those discussed below.
This summary is for general information only and is not intended to constitute a complete description of all U.S. federal income and estate tax consequences for non-U.S. holders relating to the purchase, ownership and disposition of shares of our common stock. If you are considering the purchase of shares of our common stock, you should consult your own tax advisors concerning the particular U.S. federal income and estate tax consequences to you of the purchase, ownership and disposition of shares of our common stock, as well as the consequences to you arising under other U.S. federal tax laws and the laws of any other applicable taxing jurisdiction and any applicable tax treaty in light of your particular circumstances.
Distributions
As described in the section entitled “Dividend Policy,” we do not currently anticipate declaring or paying cash dividends to holders of our common stock in the foreseeable future. However, subject to the discussion below on backup withholding and FATCA withholding, in general, if we do make distributions of cash or other property in respect of shares of our common stock, such distributions will constitute dividends for U.S. federal income tax purposes to the extent paid from our current or accumulated earnings and profits, as determined under U.S. federal income tax principles. To the extent any such distributions exceed both our current and our accumulated earnings and profits, they will first be treated as a return of capital reducing your tax basis in our common stock, but not below zero, and then will be treated as gain from the sale of stock as described below under “Gain on Disposition of Shares of Common Stock.”
Subject to the discussion below on effectively connected income, dividends paid to a non-U.S. holder generally will be subject to a U.S. federal withholding tax at a 30% rate, or such lower rate as may be specified by an applicable income tax treaty. U.S. federal withholding tax may be imposed on the gross amount of a distribution, due to the difficulty of determining whether we have sufficient earnings and profits to cause the distribution to be a dividend for U.S. federal income tax purposes.
However, dividends paid to a non-U.S. holder that are effectively connected with the conduct of a trade or business within the United States by the non-U.S. holder generally will not be subject to such withholding tax, provided certain certification and disclosure requirements are satisfied (including the provision of a properly completed IRS Form W-8 ECI or other applicable form). Instead, unless an applicable income tax treaty provides otherwise, such dividends will generally be subject to U.S. federal income tax on a net income basis in the same manner as if the non-U.S. holder were a U.S. person as defined under the Code. A corporate non-U.S. holder may be subject to an additional “branch profits tax” at a rate of 30% on its earnings and profits (subject to adjustments) that are effectively connected with its conduct of a U.S. trade or business (unless an applicable income tax treaty provides otherwise).
A non-U.S. holder of shares of our common stock who wishes to claim the benefit of an applicable treaty rate for dividends will be required (a) to complete IRS Form W-8BEN (or other applicable form) and certify under penalty of perjury that such holder is not a United States person as defined under the Code and is eligible for treaty benefits or (b) if shares of our common stock are held through certain foreign intermediaries, satisfy the relevant certification requirements of applicable U.S. Treasury regulations.
112
Table of Contents
Gain on Disposition of Shares of Common Stock
Subject to the discussion below on backup withholding and FATCA withholding, any gain realized by a non-U.S. holder on the sale, exchange or other disposition of shares of our common stock generally will not be subject to U.S. federal income tax unless:
| • | the gain is effectively connected with a trade or business of the non-U.S. holder in the United States (and, if required by an applicable income tax treaty, is attributable to a U.S. permanent establishment); |
| • | the non-U.S. holder is an individual who is present in the United States for 183 days or more in the taxable year of that disposition, and certain other conditions are met; or |
| • | we are or have been a U.S. real property holding corporation, or USRPHC, for U.S. federal income tax purposes at any time during the shorter of the five-year period ending on the date of the disposition or the period that the non-U.S. holder held shares of our common stock, or the applicable period. |
In the case of a non-U.S. holder described in the first bullet point above, any gain generally will be subject to U.S. federal income tax on a net income basis in the same manner as if the non-U.S. holder were a United States person as defined under the Code (unless an applicable income tax treaty provides otherwise), and a non-U.S. holder that is a foreign corporation may also be subject to the branch profits tax at a rate of 30% on its effectively connected earnings and profits (subject to adjustments), unless an applicable income tax treaty provides otherwise. Except as otherwise provided by an applicable income tax treaty, an individual non-U.S. holder described in the second bullet point above will be subject to a flat 30% tax on any gain derived from the disposition, which may be offset by certain U.S. source capital losses of the non-U.S. holder (even though the individual is not considered a resident of the United States), provided the non-U.S. holder has timely filed U.S. federal income tax returns with respect to such losses.
In order to be a USRPHC, the fair market value of our U.S. real property interests would need to equal or exceed 50% of the sum of the fair market value of (1) our worldwide real property interests and (2) other assets used or held for use in a trade or business. We believe we are not currently a USRPHC and we do not currently anticipate becoming a USRPHC in the future. However, even if we are or become a USRPHC, so long as our common stock is “regularly traded,” as defined by applicable U.S. Treasury regulations, on an established securities market, a non-U.S. holder will be subject to U.S. federal income tax on any gain arising from the sale or other taxable disposition of our common stock only if such non-U.S. holder actually or constructively owned more than 5% of our outstanding common stock at any time during the applicable period. If we are or become a USRPHC and you actually or constructively owned more than 5% of our common stock at any time during the specified testing period, you will be subject to tax on the net gain derived from the sale under regular graduated U.S. federal income tax rates. You should consult your own tax advisor about the consequences that could result if we are, or become, a USRPHC.
Information Reporting and Backup Withholding
The amount of dividends paid to each non-U.S. holder, and the tax withheld with respect to such dividends will be reported annually to the IRS and to each such holder. Copies of the information returns reporting such dividends and any withholding may also be made available to the tax authorities in the country in which the non-U.S. holder resides or is established under the provisions of an applicable income tax treaty or agreement.
A non-U.S. holder generally will be subject to backup withholding (currently at a rate of 28%) with respect to dividends paid to such holder unless such holder certifies under penalty of perjury that it is not a
113
Table of Contents
United States person (as defined under the Code), and the payor does not have actual knowledge or reason to know that such holder is a United States person as defined under the Code, or such holder otherwise establishes an exemption.
Information reporting and, depending on the circumstances, backup withholding will apply to the proceeds of a sale or other disposition by a non-U.S. holder of shares of our common stock within the United States or conducted through certain U.S.-related financial intermediaries unless such non-U.S. holder certifies under penalty of perjury that it is not a United States person (as defined under the Code), and the payor does not have actual knowledge or reason to know that the non-U.S. holder is a United States person, or such non-U.S. holder otherwise establishes an exemption.
Backup withholding is not an additional tax. Any amounts withheld under the backup withholding rules may be allowed as a refund or a credit against a non-U.S. holder’s U.S. federal income tax liability provided the required information is timely furnished to the IRS.
Legislation Affecting Taxation of Common Stock Held by or through Foreign Entities
Legislation enacted in 2010, known as the Foreign Account Tax Compliance Act, or FATCA, generally imposes a withholding tax of 30% on dividends paid our common stock and on the gross proceeds of a sale or other disposition of our common stock, if the payments are made to certain foreign entities, unless certain diligence, reporting, withholding and certification obligations and requirements are met. Recently finalized U.S. Treasury regulations delay the implementation of withholding under FATCA with respect to dividends until after June 30, 2014, and with respect to payments of gross proceeds of a sale or other disposition until after December 31, 2016.
The withholding under FATCA described above generally applies to payments of dividends or gross proceeds made to (i) a “foreign financial institution” (as a beneficial owner or an intermediary), unless such institution enters into an agreement with the U.S. government to collect and provide to the U.S. tax authorities substantial information regarding U.S. account holders of such institution (which would include certain equity and debt holders of such institution, as well as certain account holders that are foreign entities with U.S. owners) and (ii) a foreign entity acting as a beneficial owner or an intermediary that is not a “foreign financial institution,” unless such entity makes a certification identifying its substantial U.S. owners (as defined for this purpose) or makes a certification that such foreign entity does not have any substantial U.S. owners. Foreign financial institutions located in jurisdictions that have an intergovernmental agreement with the United States governing FATCA may be subject to different rules. Under certain circumstances, a non-U.S. holder of our common stock might be eligible for refunds or credits of such withholding taxes, and a non-U.S. holder might be required to file a U.S. federal income tax return to claim such refunds or credits.
Non-U.S. holders should consult their own tax advisors regarding the implications of this legislation on their investment in our common stock.
U.S. Federal Estate Tax
Shares of our common stock that are owned (or deemed to be owned) at the time of death by a non-U.S. holder who is an individual will be includable in such non-U.S. holder’s gross estate for U.S. federal estate tax purposes, unless an applicable estate tax treaty provides otherwise, and therefore may be subject to U.S. federal estate tax.
THE SUMMARY OF CERTAIN U.S. FEDERAL INCOME AND ESTATE TAX CONSIDERATIONS ABOVE IS INCLUDED FOR GENERAL INFORMATION PURPOSES ONLY. POTENTIAL PURCHASERS OF OUR COMMON STOCK ARE URGED TO CONSULT THEIR OWN TAX ADVISORS TO DETERMINE THE U.S. FEDERAL, STATE, LOCAL AND NON-U.S. INCOME, ESTATE AND OTHER TAX AND TAX TREATY CONSIDERATIONS OF PURCHASING, OWNING AND DISPOSING OF OUR COMMON STOCK.
114
Table of Contents
Subject to the terms and conditions of the underwriting agreement, the underwriters named below, through their representatives Deutsche Bank Securities Inc. and Goldman, Sachs & Co., have severally agreed to purchase from us the following respective number of shares of common stock at a public offering price less the underwriting discounts and commissions listed on the cover page of this prospectus:
| Underwriters |
Number of Shares | |
| Deutsche Bank Securities Inc. |
||
| Goldman, Sachs & Co. |
||
|
| ||
| Total |
||
|
|
The underwriting agreement provides that the obligations of the several underwriters to purchase the shares of common stock offered hereby are subject to certain conditions precedent and that the underwriters will purchase all of the shares of common stock offered by this prospectus, other than those covered by the over-allotment option described below, if any of these shares are purchased.
We have been advised by the representatives of the underwriters that the underwriters propose to offer the shares of common stock to the public at the public offering price listed on the cover of this prospectus and to dealers at a price that represents a concession not in excess of $ per share under the public offering price. After the initial public offering, representatives of the underwriters may change the offering price and other selling terms.
We have granted to the underwriters an option, exercisable not later than 30 days after the date of this prospectus, to purchase up to additional shares of common stock at the public offering price less the underwriting discounts and commissions listed on the cover page of this prospectus. The underwriters may exercise this option only to cover over-allotments made in connection with the sale of the common stock offered by this prospectus. To the extent that the underwriters exercise this option, each of the underwriters will become obligated, subject to conditions, to purchase approximately the same percentage of these additional shares of common stock as the number of shares of common stock to be purchased by it in the above table bears to the total number of shares of common stock offered by this prospectus. We will be obligated, pursuant to the option, to sell these additional shares of common stock to the underwriters to the extent the option is exercised. If any additional shares of common stock are purchased, the underwriters will offer the additional shares on the same terms as those on which the shares are being offered.
The underwriting discounts and commissions per share are equal to the public offering price per share of common stock less the amount paid by the underwriters to us per share of common stock. The underwriting discounts and commissions are % of the initial public offering price. The offering of the shares by the underwriters is subject to receipt and acceptance and subject to the underwriters’ right to reject any order in whole or in part. We have agreed to pay the underwriters the following discounts and commissions, assuming either no exercise or full exercise by the underwriters of the underwriters’ over-allotment option:
| Total Fees | ||||||||||||
| Fee per share |
Without Exercise of Over-Allotment Option |
With Full Exercise of Over-Allotment Option |
||||||||||
| Discounts and commissions paid by us |
$ | $ | $ | |||||||||
In addition, we estimate the total expenses of this offering payable by us, excluding underwriting discounts and commissions, will be approximately $ .
115
Table of Contents
We have agreed to indemnify the several underwriters against some specified types of liabilities, including liabilities under the Securities Act, and to contribute to payments the underwriters may be required to make in respect of any of these liabilities.
Each of our officers, directors, and SunEdison as our sole stockholder prior to this offering, have, subject to certain limited exceptions, agreed not to offer, sell, contract to sell or otherwise dispose of, or enter into any transaction that is designed to, or could be expected to, result in the disposition of any shares of our common stock or other securities convertible into or exchangeable or exercisable for shares of our common stock or derivatives of our common stock owned by these persons prior to this offering or common stock issuable upon exercise of options held by these persons for a period of 180 days after the effective date of the registration statement of which this prospectus is a part without the prior written consent of Deutsche Bank Securities Inc. and Goldman, Sachs & Co. This consent may be given at any time without public notice except in limited circumstances. We have entered into a similar agreement with the representatives of the underwriters. There are no agreements between the representatives and any of our stockholders or affiliates releasing them from these lock-up agreements prior to the expiration of the 180-day period.
The representatives of the underwriters have advised us that the underwriters do not intend to confirm sales to any account over which they exercise discretionary authority.
In connection with this offering, the underwriters may purchase and sell shares of our common stock in the open market. These transactions may include short sales, purchases to cover positions created by short sales and stabilizing transactions.
Short sales involve the sale by the underwriters of a greater number of shares than they are required to purchase in this offering. Covered short sales are sales made in an amount not greater than the underwriters’ option to purchase additional shares of common stock from us in this offering. The underwriters may close out any covered short position by either exercising their option to purchase additional shares or purchasing shares in the open market. In determining the source of shares to close out the covered short position, the underwriters will consider, among other things, the price of shares available for purchase in the open market as compared to the price at which they may purchase shares through the over-allotment option.
Naked short sales are any sales in excess of the over-allotment option. The underwriters must close out any naked short position by purchasing shares in the open market. A naked short position is more likely to be created if the underwriters are concerned that there may be downward pressure on the price of the shares in the open market prior to the completion of this offering.
Stabilizing transactions consist of various bids for or purchases of our common stock made by the underwriters in the open market prior to the completion of this offering.
Purchases to cover a short position and stabilizing transactions may have the effect of preventing or slowing a decline in the market price of our common stock. Additionally, these purchases may stabilize, maintain or otherwise affect the market price of our common stock. As a result, the price of our common stock may be higher than the price that might otherwise exist in the open market. These transactions may be effected on the , in the over-the-counter market or otherwise.
A prospectus in electronic format is being made available on Internet web sites maintained by one or more of the lead underwriters of this offering and may be made available on web sites maintained by other underwriters. Other than the prospectus in electronic format, the information on any underwriter’s web site and any information contained in any other web site maintained by an underwriter is not part of the prospectus or the registration statement of which the prospectus forms a part.
116
Table of Contents
Some of the underwriters or their affiliates have provided investment banking services to SunEdison in the past and may do so in the future. They receive customary fees and commissions for these services.
The underwriters and their respective affiliates are full service financial institutions engaged in various activities, which may include sales and trading, commercial and investment banking, advisory, investment management, investment research, principal investment, hedging, market making, brokerage and other financial and non-financial activities and services. Certain of the underwriters and their respective affiliates have provided, and may in the future provide, a variety of these services to us and to persons and entities having relationships with us, for which they received or will receive customary fees and expenses.
In the ordinary course of their various business activities, the underwriters and their respective affiliates, officers, directors and employees may purchase, sell or hold a broad array of investments and actively trade securities, derivatives, loans, commodities, currencies, credit default swaps and other financial instruments for their own account and for the accounts of their customers, and such investment and trading activities may involve or relate to assets, securities and/or instruments of the issuer (directly, as collateral securing other obligations or otherwise) and/or persons and entities having relationships with us. The underwriters and their respective affiliates may also communicate independent investment recommendations, market color or trading ideas and/or publish or express independent research views in respect of such assets, securities or instruments and may at any time hold, or recommend to clients that they should acquire, long and/or short positions in such assets, securities and instruments.
Pricing of this Offering
Prior to this offering, there had been no public market for our common stock. Consequently, the initial public offering price of our common stock was determined by negotiation among us and the representatives of the underwriters. Among the primary factors that were considered in determining the public offering price are:
| • | prevailing market conditions; |
| • | our results of operations in recent periods; |
| • | the present stage of our development; |
| • | the market capitalizations and stages of development of other companies that we and the representatives of the underwriters believe to be comparable to our business; and |
| • | estimates of our business potential |
Notice to Investors in the European Economic Area
In relation to each Member State of the European Economic Area which has implemented the Prospectus Directive (each, a Relevant Member State) an offer to the public of any shares which are the subject of this offering contemplated by this prospectus may not be made in that Relevant Member State other than the offers contemplated in the prospectus once the prospectus has been approved by the competent authority in such Member State and published and passported in accordance with the Prospectus Directive as implemented in the Relevant Member State except that an offer to the public in that Relevant Member State of any shares may be made at any time under the following exemptions under the Prospectus Directive, if they have been implemented in that Relevant Member State:
| • | to legal entities which are authorized or regulated to operate in the financial markets or, if not so authorized or regulated, whose corporate purpose is solely to invest in securities; |
117
Table of Contents
| • | to any legal entity which has two or more of (1) an average of at least 250 employees during the last financial year; (2) a total balance sheet of more than €43,000,000 and (3) an annual net turnover of more than €50,000,000, as shown in its last annual or consolidated accounts; |
| • | by the underwriters to fewer than 100 natural or legal persons (other than qualified investors as defined in the Prospectus Directive) subject to obtaining the prior consent of the underwriters for any such offer; or |
| • | in any other circumstances falling within Article 3(2) of the Prospectus Directive, |
provided that no such offer of shares shall result in a requirement for the publication by the Issuer or any underwriter of a prospectus pursuant to Article 3 of the Prospectus Directive.
For the purposes of this provision, the expression an “offer to the public” in relation to any shares in any Relevant Member State means the communication in any form and by any means of sufficient information on the terms of the offer and any shares to be offered so as to enable an investor to decide to purchase any shares, as the same may be varied in that member state by any measure implementing the Prospectus Directive in that member state and the expression “Prospectus Directive” means Directive 2003/71/EC and includes any relevant implementing measure in each Relevant Member State.
Notice to Investors in the United Kingdom
Each underwriter has represented and agreed that (a) it has only communicated and will only communicate or cause to be communicated an invitation or inducement to engage in investment activity (within the meaning of Section 21 of the Financial Services and Markets Act 2000, or the FSMA, received by it in connection with the issue or sale of the shares (i) to investment professionals falling within Article 19(5) of the Financial Services and Markets Act 2000 (Financial Promotion) Order 2005, or the Order, or (ii) to high net worth entities, and other persons to whom it may lawfully be communicated, falling within Article 49(2)(a) and (d) of the Order, with all such persons together being referred to as relevant persons, and (b) it has complied and will comply with all applicable provisions of the FSMA with respect to anything done by it in relation to the shares of our common stock in, from or otherwise involving the United Kingdom. This prospectus and its contents are confidential and should not be distributed, published or reproduced (in whole or in part) or disclosed by recipients to any other persons in the United Kingdom. Any person in the United Kingdom that is not a relevant person should not act or rely on this document or any of its contents.
Notice to Prospective Investors in Hong Kong
The shares may not be offered or sold in Hong Kong by means of any document other than (i) in circumstances which do not constitute an offer to the public within the meaning of the Companies Ordinance (Cap. 32, Laws of Hong Kong), or (ii) to “professional investors” within the meaning of the Securities and Futures Ordinance (Cap. 571, Laws of Hong Kong) and any rules made thereunder, or (iii) in other circumstances which do not result in the document being a “prospectus” within the meaning of the Companies Ordinance (Cap. 32, Laws of Hong Kong) and no advertisement, invitation or document relating to the shares may be issued or may be in the possession of any person for the purpose of issue (in each case whether in Hong Kong or elsewhere), which is directed at, or the contents of which are likely to be accessed or read by, the public in Hong Kong (except if permitted to do so under the laws of Hong Kong) other than with respect to shares which are or are intended to be disposed of only to persons outside Hong Kong or only to “professional investors” within the meaning of the Securities and Futures Ordinance (Cap. 571, Laws of Hong Kong) and any rules made thereunder.
118
Table of Contents
Notice to Prospective Investors in Singapore
This prospectus has not been registered as a prospectus with the Monetary Authority of Singapore. Accordingly, this prospectus and any other document or material in connection with the offer or sale, or invitation for subscription or purchase, of the shares may not be circulated or distributed, nor may the shares be offered or sold, or be made the subject of an invitation for subscription or purchase, whether directly or indirectly, to persons in Singapore other than (i) to an institutional investor under Section 274 of the Securities and Futures Act, Chapter 289 of Singapore, or the SFA, (ii) to a relevant person pursuant to Section 275(1), or any person pursuant to Section 275(1A), and in accordance with the conditions specified in Section 275 of the SFA or (iii) otherwise pursuant to, and in accordance with the conditions of, any other applicable provision of the SFA, in each case subject to compliance with conditions set forth in the SFA.
Where the shares are subscribed or purchased under Section 275 of the SFA by a relevant person which is:
| • | a corporation (which is not an accredited investor (as defined in Section 4A of the SFA)) the sole business of which is to hold investments and the entire share capital of which is owned by one or more individuals, each of whom is an accredited investor; or |
| • | a trust (where the trustee is not an accredited investor) whose sole purpose is to hold investments and each beneficiary of the trust is an individual who is an accredited investor. |
Shares, debentures and units of shares and debentures of that corporation or the beneficiaries’ rights and interest (howsoever described) in that trust shall not be transferred within six months after that corporation or that trust has acquired the shares pursuant to an offer made under Section 275 of the SFA except:
| • | to an institutional investor (for corporations, under Section 274 of the SFA) or to a relevant person defined in Section 275(2) of the SFA, or to any person pursuant to an offer that is made on terms that such shares, debentures and units of shares and debentures of that corporation or such rights and interest in that trust are acquired at a consideration of not less than S$200,000 (or its equivalent in a foreign currency) for each transaction, whether such amount is to be paid for in cash or by exchange of securities or other assets, and further for corporations, in accordance with the conditions specified in Section 275 of the SFA; |
| • | where no consideration is or will be given for the transfer; or |
| • | where the transfer is by operation of law. |
Notice to Prospective Investors in Switzerland
The prospectus does not constitute an issue prospectus pursuant to Article 652a or Article 1156 of the Swiss Code of Obligations, and the shares will not be listed on the SIX Swiss Exchange. Therefore, the prospectus may not comply with the disclosure standards of the Swiss Code of Obligations and/or the listing rules (including any prospectus schemes) of the SIX Swiss Exchange. Accordingly, the shares may not be offered to the public in or from Switzerland, but only to a selected and limited circle of investors, which do not subscribe to the shares with a view to distribution.
Notice to Prospective Investors in Qatar
The shares described in this prospectus have not been, and will not be, offered, sold or delivered, at any time, directly or indirectly in the State of Qatar in a manner that would constitute a public offering. This prospectus has not been, and will not be, registered with or approved by the Qatar Financial Markets Authority or
119
Table of Contents
Qatar Central Bank and may not be publicly distributed. This prospectus is intended for the original recipient only and must not be provided to any other person. It is not for general circulation in the State of Qatar and may not be reproduced or used for any other purpose.
Notice to Prospective Investors in Saudi Arabia
No offering, whether directly or indirectly, will be made to an investor in the Kingdom of Saudi Arabia unless such offering is in accordance with the applicable laws of the Kingdom of Saudi Arabia and the rules and regulations of the Capital Market Authority, including the Capital Market Law of the Kingdom of Saudi Arabia. The shares will not be marketed or sold in the Kingdom of Saudi Arabia by us or the underwriters.
This prospectus may not be distributed in the Kingdom of Saudi Arabia except to such persons as are permitted under the Office of Securities Regulation issued by the Capital Market Authority. The Saudi Arabian Capital Market Authority does not make any representation as to the accuracy or completeness of this prospectus and expressly disclaims any liability whatsoever for any loss arising from, or incurred in reliance upon, any part of this prospectus. Prospective purchasers of the shares offered hereby should conduct their own due diligence on the accuracy of the information relating to the shares. If you do not understand the contents of this prospectus, you should consult an authorized financial advisor.
Notice to Prospective Investors in the United Arab Emirates
This offering has not been approved or licensed by the Central Bank of the United Arab Emirates (UAE), Securities and Commodities Authority of the UAE and/or any other relevant licensing authority in the UAE including any licensing authority incorporated under the laws and regulations of any of the free zones established and operating in the territory of the UAE, in particular the Dubai Financial Services Authority (DFSA), a regulatory authority of the Dubai International Financial Centre (DIFC). This offering does not constitute a public offer of securities in the UAE, DIFC and/or any other free zone in accordance with the Commercial Companies Law, Federal Law No 8 of 1984 (as amended), DFSA Offered Securities Rules and NASDAQ Dubai Listing Rules, accordingly, or otherwise. The shares may not be offered to the public in the UAE and/or any of the free zones.
The shares may be offered and issued only to a limited number of investors in the UAE or any of its free zones who qualify as sophisticated investors under the relevant laws and regulations of the UAE or the free zone concerned.
120
Table of Contents
The validity of the common stock offered hereby has been passed upon for us by Kirkland & Ellis LLP (a partnership that includes professional corporations), Chicago, Illinois. The underwriters have been represented by Latham & Watkins LLP, Menlo Park, California.
The combined financial statements of SunEdison Semiconductor, Inc. as of December 31, 2012 and 2011, and for each of the years in the two-year period ended December 31, 2012, have been included in the registration statement in reliance upon the report of KPMG LLP, independent registered public accounting firm, appearing elsewhere herein, and upon the authority of said firm as experts in accounting and auditing.
WHERE YOU CAN FIND MORE INFORMATION
We have filed a Registration Statement on Form S-1 with the SEC with respect to our common stock being distributed as contemplated by this prospectus. This prospectus is a part of and does not contain all of the information set forth in the Registration Statement and the exhibits and schedules to the Registration Statement. For further information with respect to us and our common stock, please refer to the Registration Statement, including its exhibits and schedules. Statements made in this prospectus relating to any contract or other document are not necessarily complete and you should refer to the exhibits attached to the Registration Statement for copies of the actual contract or document. You may read and copy all materials that we file with the SEC, including the Registration Statement and its exhibits and schedules, at the SEC’s public reference room, located at 100 F Street, N.E., Washington, D.C. 20549, as well as on the website maintained by the SEC at www.sec.gov. Please call the SEC at 1-800-SEC-0330 for more information on the public reference room. Information contained on any website referenced in this prospectus does not and will not constitute a part of this prospectus or the Registration Statement on Form S-1 of which this prospectus is a part.
In addition, we will file periodic reports and other information with the SEC. You may request a copy of any of our filings with the SEC at no cost, by writing or telephoning us at the following address:
SunEdison Semiconductor, Inc.
501 Pearl Drive (City of O’Fallon)
St. Peters, Missouri 63376
You should rely only on the information contained in this prospectus or to which we have referred you. We have not authorized any person to provide you with different information or to make any representation not contained in this prospectus.
121
Table of Contents
| Page | ||||
| Audited Combined Financial Statements and Unaudited Interim Combined Financial Statements of SunEdison Semiconductor, Inc. (Semiconductor Materials Business of SunEdison, Inc.) |
||||
| F-2 | ||||
| F-3 | ||||
| F-4 | ||||
| Combined balance sheets as of December 31, 2012 and 2011 and as of June 30, 2013 (unaudited) |
F-5 | |||
| F-6 | ||||
| F-7 | ||||
| F-8 | ||||
F-1
Table of Contents
Report of Independent Registered Public Accounting Firm
To SunEdison Semiconductor, Inc.:
We have audited the accompanying combined balance sheets of SunEdison Semiconductor, Inc. (the Company) as of December 31, 2012 and 2011, and the related statements of operations, comprehensive income (loss), equity, and cash flows for each of the years in the two-year period ended December 31, 2012. These combined financial statements are the responsibility of the Company’s management. Our responsibility is to express an opinion on these combined financial statements based on our audits.
We conducted our audits in accordance with the standards of the Public Company Accounting Oversight Board (United States). Those standards require that we plan and perform the audit to obtain reasonable assurance about whether the financial statements are free of material misstatement. An audit includes examining, on a test basis, evidence supporting the amounts and disclosures in the financial statements. An audit also includes assessing the accounting principles used and significant estimates made by management, as well as evaluating the overall financial statement presentation. We believe that our audits provide a reasonable basis for our opinion.
In our opinion, the combined financial statements referred to above present fairly, in all material respects, the financial position of the Company as of December 31, 2012 and 2011, and the results of its operations and its cash flows for each of the years in the two-year period ended December 31, 2012, in conformity with U.S. generally accepted accounting principles.
/s/ KPMG LLP
St. Louis, Missouri
September 8, 2013
F-2
Table of Contents
Combined Statements of Operations
| For the Year Ended December 31, | For the Six Months Ended June 30, | |||||||||||||||
| 2012 | 2011 | 2013 | 2012 | |||||||||||||
| (unaudited) | ||||||||||||||||
| In millions | ||||||||||||||||
| Net sales to non-affiliates | $ | 927.4 | $ | 1,051.3 | $ | 471.3 | $ | 454.5 | ||||||||
| Net sales to affiliates | 6.8 | 147.0 | 5.1 | 3.3 | ||||||||||||
| Cost of goods sold | 852.4 | 1,023.3 | 422.5 | 425.8 | ||||||||||||
|
|
|
|
|
|
|
|
|
|||||||||
| Gross profit |
81.8 | 175.0 | 53.9 | 32.0 | ||||||||||||
| Operating expenses: | ||||||||||||||||
| Marketing and administration |
100.7 | 129.9 | 48.4 | 52.2 | ||||||||||||
| Research and development |
33.4 | 38.2 | 18.7 | 16.1 | ||||||||||||
| Restructuring (reversals) charges (see Note 3) |
(149.6) | 284.5 | (5.5) | — | ||||||||||||
| Gain on receipt of property, plant and equipment (see Note 3) |
(31.7) | — | — | — | ||||||||||||
| Long-lived asset impairment charges (see Note 3) |
1.5 | 234.7 | — | — | ||||||||||||
|
|
|
|
|
|
|
|
|
|||||||||
| Operating income (loss) | 127.5 | (512.3) | (7.7) | (36.3) | ||||||||||||
|
|
|
|
|
|
|
|
|
|||||||||
| Non-operating expenses (income): | ||||||||||||||||
| Interest expense |
1.0 | 5.9 | 0.3 | 0.5 | ||||||||||||
| Interest income |
(0.7) | (1.0) | (0.2) | (0.4) | ||||||||||||
| Interest (income) expense, net - affiliates |
(2.2) | 1.8 | (0.8) | (0.9) | ||||||||||||
| Other, net |
3.1 | (0.8) | (4.1) | 1.4 | ||||||||||||
|
|
|
|
|
|
|
|
|
|||||||||
| Total non-operating expenses (income) | 1.2 | 5.9 | (4.8) | 0.6 | ||||||||||||
|
|
|
|
|
|
|
|
|
|||||||||
| Income (loss) before income tax expense |
126.3 | (518.2) | (2.9) | (36.9) | ||||||||||||
| Income tax expense | 3.6 | 37.4 | 18.5 | 1.8 | ||||||||||||
|
|
|
|
|
|
|
|
|
|||||||||
| Net income (loss) | 122.7 | (555.6) | (21.4) | (38.7) | ||||||||||||
| Net (income) loss attributable to noncontrolling interests | (1.4) | (2.3) | (2.3) | 0.2 | ||||||||||||
|
|
|
|
|
|
|
|
|
|||||||||
| Net income (loss) attributable to SunEdison Semiconductor, Inc. | $ | 121.3 | $ | (557.9) | $ | (23.7) | $ | (38.5) | ||||||||
|
|
|
|
|
|
|
|
|
|||||||||
See accompanying notes to combined financial statements.
F-3
Table of Contents
Combined Statements of Comprehensive Income (Loss)
| For the Year Ended December 31, | For the Six Months Ended June 30, | |||||||||||||||
| 2012 | 2011 | 2013 | 2012 | |||||||||||||
| (unaudited) | ||||||||||||||||
| In millions | ||||||||||||||||
| Net income (loss) | $ | 122.7 | $ | (555.6) | $ | (21.4) | $ | (38.7) | ||||||||
| Other comprehensive (loss) income: | ||||||||||||||||
| Net translation adjustment |
(15.3) | 2.1 | (44.4) | (7.8) | ||||||||||||
| Actuarial loss and prior service costs |
(1.4) | (26.8) | — | (9.1) | ||||||||||||
|
|
|
|
|
|
|
|
|
|||||||||
| Other comprehensive loss | (16.7) | (24.7) | (44.4) | (16.9) | ||||||||||||
|
|
|
|
|
|
|
|
|
|||||||||
| Total comprehensive income (loss) | 106.0 | (580.3) | (65.8) | (55.6) | ||||||||||||
| Net (income) loss attributable to noncontrolling interests |
(1.4) | (2.3) | (2.3) | 0.2 | ||||||||||||
| Net translation adjustment attributable to noncontrolling interests |
(2.2) | 0.5 | 2.2 | — | ||||||||||||
|
|
|
|
|
|
|
|
|
|||||||||
| Comprehensive income (loss) attributable to SunEdison Semiconductor, Inc. | $ | 102.4 | $ | (582.1) | $ | (65.9) | $ | (55.4) | ||||||||
|
|
|
|
|
|
|
|
|
|||||||||
See accompanying notes to combined financial statements.
F-4
Table of Contents
| As of December 31, | As of June 30, | |||||||||||
| 2012 | 2011 | 2013 | ||||||||||
| (unaudited) | ||||||||||||
| In millions | ||||||||||||
| Assets |
||||||||||||
| Current assets: | ||||||||||||
| Cash and cash equivalents |
$ | 103.2 | $ | 50.3 | $ | 55.2 | ||||||
| Accounts receivable, net |
129.5 | 125.9 | 117.9 | |||||||||
| Accounts receivable, affiliate |
89.1 | 20.4 | 19.4 | |||||||||
| Inventories |
130.5 | 165.8 | 127.4 | |||||||||
| Deferred tax asset |
14.0 | 12.1 | 14.0 | |||||||||
| Prepaid and other current assets |
23.6 | 42.7 | 21.6 | |||||||||
|
|
|
|
|
|
|
|||||||
| Total current assets |
489.9 | 417.2 | 355.5 | |||||||||
| Property, plant and equipment, net | 789.9 | 791.9 | 736.3 | |||||||||
| Notes receivable, affiliate | 158.5 | 111.5 | 181.6 | |||||||||
| Other assets | 74.9 | 68.5 | 82.4 | |||||||||
|
|
|
|
|
|
|
|||||||
| Total assets |
$ | 1,513.2 | $ | 1,389.1 | $ | 1,355.8 | ||||||
|
|
|
|
|
|
|
|||||||
| Liabilities and Equity |
||||||||||||
| Current liabilities: | ||||||||||||
| Current portion of long-term debt |
$ | 3.4 | $ | 3.7 | $ | 2.9 | ||||||
| Accounts payable |
121.8 | 146.4 | 99.7 | |||||||||
| Accounts payable, affiliate |
102.0 | 59.7 | 111.9 | |||||||||
| Accrued liabilities |
57.8 | 63.3 | 52.6 | |||||||||
| Accrued wages and salaries |
32.9 | 31.7 | 32.8 | |||||||||
| Restructuring liabilities |
133.9 | 177.9 | 85.5 | |||||||||
|
|
|
|
|
|
|
|||||||
| Total current liabilities |
451.8 | 482.7 | 385.4 | |||||||||
| Long-term debt, less current portion | 12.6 | 17.8 | 9.5 | |||||||||
| Long-term debt, affiliate | 129.4 | 127.3 | 76.0 | |||||||||
| Pension and post-employment liabilities | 71.2 | 69.4 | 67.3 | |||||||||
| Restructuring liabilities | 6.3 | 118.5 | 4.3 | |||||||||
| Other liabilities | 27.9 | 34.4 | 36.9 | |||||||||
|
|
|
|
|
|
|
|||||||
| Total liabilities |
699.2 | 850.1 | 579.4 | |||||||||
|
|
|
|
|
|
|
|||||||
| Equity: | ||||||||||||
| Net Parent investment |
870.3 | 580.0 | 874.8 | |||||||||
| Accumulated other comprehensive loss |
(95.2) | (76.3) | (137.4) | |||||||||
|
|
|
|
|
|
|
|||||||
| Total SunEdison Semiconductor Inc. equity |
775.1 | 503.7 | 737.4 | |||||||||
| Noncontrolling interests | 38.9 | 35.3 | 39.0 | |||||||||
|
|
|
|
|
|
|
|||||||
| Total equity |
814.0 | 539.0 | 776.4 | |||||||||
|
|
|
|
|
|
|
|||||||
| Total liabilities and equity |
$ | 1,513.2 | $ | 1,389.1 | $ | 1,355.8 | ||||||
|
|
|
|
|
|
|
|||||||
See accompanying notes to combined financial statements.
F-5
Table of Contents
Combined Statements of Cash Flows
| For the Year Ended December 31, | For the Six Months Ended June 30, | |||||||||||||||
| 2012 | 2011 | 2013 | 2012 | |||||||||||||
| (unaudited) | ||||||||||||||||
| In millions | ||||||||||||||||
| Cash flows from operating activities: |
||||||||||||||||
| Net income (loss) |
$ | 122.7 | $ | (555.6) | $ | (21.4) | $ | (38.7) | ||||||||
| Adjustments to reconcile net income (loss) to net cash provided by (used in) operating activities: |
||||||||||||||||
| Depreciation and amortization |
118.7 | 144.3 | 58.3 | 59.0 | ||||||||||||
| Long-lived asset impairment charges |
— | 248.8 | — | — | ||||||||||||
| Gain on receipt of property, plant and equipment |
(31.7) | — | — | — | ||||||||||||
| Stock-based compensation |
13.0 | 20.5 | 6.5 | 5.8 | ||||||||||||
| (Benefit) provision for deferred taxes |
(14.2) | 15.1 | 1.8 | (8.8) | ||||||||||||
| Other |
(6.4) | (11.0) | (10.2) | (1.3) | ||||||||||||
| Changes in operating assets and liabilities: |
||||||||||||||||
| Accounts receivable |
(3.6) | 58.2 | 8.5 | (5.1) | ||||||||||||
| Inventories |
34.0 | (42.9) | (1.3) | 7.1 | ||||||||||||
| Amounts due from affiliates |
(71.6) | — | (18.1) | (8.5) | ||||||||||||
| Amounts due to affiliates |
41.3 | 8.2 | 40.0 | 19.0 | ||||||||||||
| Prepaid and other current assets |
20.1 | 3.7 | 1.1 | 14.4 | ||||||||||||
| Accounts payable and accrued liabilities |
(28.9) | (12.4) | (3.6) | (27.9) | ||||||||||||
| Pension and post-employment liabilities |
1.8 | 10.6 | (2.4) | 5.5 | ||||||||||||
| Restructuring liabilities |
(146.5) | 280.5 | (35.8) | (15.2) | ||||||||||||
| Working capital and other |
(2.6) | 3.8 | (3.6) | (25.7) | ||||||||||||
|
|
|
|
|
|
|
|
|
|||||||||
| Net cash provided by (used in) operating activities |
46.1 | 171.8 | 19.8 | (20.4) | ||||||||||||
|
|
|
|
|
|
|
|
|
|||||||||
| Cash flows from investing activities: |
||||||||||||||||
| Capital expenditures |
(95.2) | (187.1) | (62.1) | (45.8) | ||||||||||||
| Notes receivable from affiliates |
(46.7) | (110.0) | (21.4) | (45.0) | ||||||||||||
| Other |
(3.6) | — | — | (1.3) | ||||||||||||
|
|
|
|
|
|
|
|
|
|||||||||
| Net cash used in investing activities |
(145.5) | (297.1) | (83.5) | (92.1) | ||||||||||||
|
|
|
|
|
|
|
|
|
|||||||||
| Cash flows from financing activities: |
||||||||||||||||
| Principal payments on long-term debt |
(3.6) | (3.7) | (1.4) | (1.8) | ||||||||||||
| Net Parent investment |
154.6 | (50.6) | 21.3 | 132.2 | ||||||||||||
| Borrowings from affiliates |
2.1 | 1.6 | — | — | ||||||||||||
| Payments to noncontrolling interests |
— | (0.6) | — | — | ||||||||||||
|
|
|
|
|
|
|
|
|
|||||||||
| Net cash provided by (used in) financing activities |
153.1 | (53.3) | 19.9 | 130.4 | ||||||||||||
|
|
|
|
|
|
|
|
|
|||||||||
| Effect of exchange rate changes on cash and cash equivalents | (0.8) | 3.0 | (4.2) | 0.1 | ||||||||||||
|
|
|
|
|
|
|
|
|
|||||||||
| Net increase (decrease) in cash and cash equivalents |
52.9 | (175.6) | (48.0) | 18.0 | ||||||||||||
| Cash and cash equivalents at beginning of period | 50.3 | 225.9 | 103.2 | 50.3 | ||||||||||||
|
|
|
|
|
|
|
|
|
|||||||||
| Cash and cash equivalents at end of period | $ | 103.2 | $ | 50.3 | $ | 55.2 | $ | 68.3 | ||||||||
|
|
|
|
|
|
|
|
|
|||||||||
| Supplemental disclosures of cash flow information: | ||||||||||||||||
| Interest paid, net of amount capitalized |
$ | 2.8 | $ | 3.6 | $ | 0.7 | $ | 0.4 | ||||||||
| Income taxes paid, net |
$ | 24.6 | $ | 11.3 | $ | 17.1 | $ | 11.8 | ||||||||
| Supplemental schedule of non-cash investing and financing activities: | ||||||||||||||||
| Accounts payable incurred (relieved) for acquisition of fixed assets |
$ | 3.4 | $ | (14.3) | $ | (17.7) | $ | 1.0 | ||||||||
See accompanying notes to combined financial statements.
F-6
Table of Contents
| Net Parent Investment |
Accumulated Other Comprehensive Loss |
Total SunEdison Semiconductor, Inc. Equity |
Noncontrolling Interests |
Total Equity |
||||||||||||||||
| In millions |
|
|
|
|
|
|||||||||||||||
| Balance December 31, 2010 |
$ | 1,167.6 | $ | (52.1) | $ | 1,115.5 | $ | 34.1 | $ | 1,149.6 | ||||||||||
|
|
|
|
|
|
|
|
|
|
|
|||||||||||
| Net (loss) income |
(557.9) | — | (557.9) | 2.3 | (555.6) | |||||||||||||||
| Other comprehensive loss |
— | (24.2) | (24.2) | (0.5) | (24.7) | |||||||||||||||
| Net transfers to SunEdison |
(29.7) | — | (29.7) | — | (29.7) | |||||||||||||||
| Net distributions to noncontrolling interests |
— | — | — | (0.6) | (0.6) | |||||||||||||||
|
|
|
|
|
|
|
|
|
|
|
|||||||||||
| Balance at December 31, 2011 |
$ | 580.0 | $ | (76.3) | $ | 503.7 | $ | 35.3 | $ | 539.0 | ||||||||||
|
|
|
|
|
|
|
|
|
|
|
|||||||||||
| Net income |
121.3 | — | 121.3 | 1.4 | 122.7 | |||||||||||||||
| Other comprehensive (loss) income |
— | (18.9) | (18.9) | 2.2 | (16.7) | |||||||||||||||
| Net transfers from SunEdison |
169.0 | — | 169.0 | — | 169.0 | |||||||||||||||
|
|
|
|
|
|
|
|
|
|
|
|||||||||||
| Balance at December 31, 2012 |
$ | 870.3 | $ | (95.2) | $ | 775.1 | $ | 38.9 | $ | 814.0 | ||||||||||
|
|
|
|
|
|
|
|
|
|
|
|||||||||||
| Net (loss) income (unaudited) |
(23.7) | — | (23.7) | 2.3 | (21.4) | |||||||||||||||
| Other comprehensive loss (unaudited) |
— | (42.2) | (42.2) | (2.2) | (44.4) | |||||||||||||||
| Net transfers from SunEdison (unaudited) |
28.2 | — | 28.2 | — | 28.2 | |||||||||||||||
|
|
|
|
|
|
|
|
|
|
|
|||||||||||
| Balance at June 30, 2013 (unaudited) |
$ | 874.8 | $ | (137.4) | $ | 737.4 | $ | 39.0 | $ | 776.4 | ||||||||||
|
|
|
|
|
|
|
|
|
|
|
|||||||||||
See accompanying notes to combined financial statements.
F-7
Table of Contents
Notes to the Audited December 31, 2012 and 2011 Combined Financial Statements
and the Unaudited June 30, 2013 and 2012 Interim Combined Financial Statements
1. NATURE OF OPERATIONS
SunEdison Semiconductor, Inc. (“the Company”, “SunEdison Semiconductor”, “we”, “us” and “our”) is a global leader in the development, manufacture and sale of silicon wafers to the semiconductor industry. Silicon wafers are used as the base substrate for nearly all semiconductor devices, which in turn provide the foundation for the entire electronics industry. Our business was established in 1959 and was recently known during most of our history as MEMC Electronic Materials, Inc., or MEMC. We believe we have developed a broad product portfolio, an extensive global footprint, process technology expertise and supply chain flexibility, while increasing our capital efficiency and maintaining a lean operating culture.
The Company consists of the combined operations of certain entities currently owned by SunEdison, Inc. (“SunEdison” or “Parent”) (formerly known as MEMC), as discussed in the basis of presentation below. On August 22, 2013, SunEdison announced an initial public offering (the “Offering”) of its semiconductor business to create SunEdison Semiconductor, Inc. as an independent company. SunEdison plans to sell a minority ownership interest in the semiconductor business to the public. In connection with this Offering, SunEdison will undertake a series of transactions to separate our net assets and entities.
Basis of Presentation
We currently operate as a business segment of SunEdison. The combined financial statements have been derived from the consolidated financial statements and accounting records of SunEdison and include allocations for direct costs and indirect costs attributable to the operations of the semiconductor materials business of SunEdison. The unaudited interim combined financial statements include all adjustments (consisting of normal, recurring items) necessary to present fairly our financial position and results of operations and cash flows for the interim periods. SunEdison Semiconductor has presented the audited combined financial statements as of and for the years ended December 31, 2012 and 2011 and the unaudited interim combined financial statements as of June 30, 2013 and for the six months ended June 30, 2013 and 2012. These combined financial statements and related notes to the combined financial statements, including prior year financial information, are presented on a consistent basis for all periods presented. Operating results for the six months ending June 30, 2013 are not necessarily indicative of the results that may be expected for the year ending December 31, 2013.
SunEdison maintains a number of stock-based compensation and benefit programs at a corporate level. Our employees participate in those programs and as such, we were allocated expenses associated with those programs. Our combined balance sheets do not include any Parent outstanding equity related to the stock-based compensation programs. Since substantially all of the Parent pension and other post-employment benefit plans relate solely to us, our combined balance sheets include net benefit plan obligations related to those plans and those benefit plans in certain foreign locations that are our direct obligation. See Note 7 and 9 for further description of these stock-based compensation and benefit programs.
We generate a portion of our net sales from sales to SunEdison subsidiaries. These sales are reflected in a separate line item in our combined statements of operations, net sales to affiliates. Normal operating activities with affiliates are reflected as amounts due from affiliates and amounts due to affiliates within operating activities in the combined cash flow statements. Cash transferred to and from SunEdison has been recorded as notes receivable, affiliate and long-term debt, affiliate on the combined balance sheets and notes receivable from affiliates and borrowings from affiliates in the combined cash flow statements. The combined balance sheets do not separately present certain of the Parent’s assets or liabilities where management deemed it inappropriate due to the underlying nature of those assets and liabilities. The Parent performs financing, cash management, treasury and other services for us on a centralized basis. These amounts have been accounted for through the net Parent investment account because it is not practicable to specifically identify the portion of cash related to those
F-8
Table of Contents
activities (see below). All changes in the net Parent investment account in the combined balance sheets have been considered cash receipts and payments for purposes of the combined cash flow statements and are reflected in financing activities. See Note 13 for further description of related party transactions.
Earnings per share data has not been presented in the combined financial statements because we do not operate as a separate legal entity with our own capital structure.
Our combined financial statements include expenses of SunEdison that were allocated to us for certain functions, including general corporate expenses related to communications, corporate administration, finance, legal, information technology, human resources, compliance, employee benefits and incentives, operations, research and development and stock compensation. These expenses were allocated in our historical results of operations on the basis of direct usage, where identifiable, with the remainder primarily allocated on the basis of revenue or other related sales metrics, headcount or number of our manufacturing plants. We consider the expense allocation methodology and results to be reasonable for all periods presented. However, these allocations may not necessarily be indicative of the actual expenses we would have incurred as an independent publicly traded company during the periods prior to this Offering or of the costs we will incur in the future.
2. SUMMARY OF SIGNIFICANT ACCOUNTING POLICIES
Use of Estimates
In preparing our combined financial statements, we use estimates and assumptions that may affect reported amounts and disclosures. Estimates are used when accounting for depreciation, amortization, leases, inventory valuation, accrued liabilities including restructuring, warranties, employee benefits, derivatives, stock-based compensation, income taxes and asset recoverability, including allowances, among others. These estimates and assumptions are based on current facts, historical experience and various other factors that we believe to be reasonable under the circumstances, the results of which form the basis for making judgments about the carrying values of assets and liabilities and the recording of revenue, costs and expenses that are not readily apparent from other sources. To the extent there are material differences between the estimates and actual results, our future results of operations would be affected.
Principles of Combination
We record noncontrolling interests for non-wholly owned subsidiaries included in our combined financial statements. As of December 31, 2012, December 31, 2011 and June 30, 2013, our total noncontrolling interest on the combined balance sheet was $38.9 million, $35.3 million and $39.0 million, respectively. All significant intercompany balances and transactions have been eliminated.
Cash and Cash Equivalents
Cash and cash equivalents consist of all cash balances, highly liquid commercial paper, time deposits and money market funds with original maturity periods of three months or less when purchased.
Allowance for Doubtful Accounts
We establish an allowance for doubtful accounts to adjust our receivables to amounts considered to be ultimately collectible. Our allowance is based on a variety of factors, including the length of time receivables are past due, significant one-time events, the financial health of our customers and historical experience. The balance of our allowance for doubtful accounts were $3.8 million, $4.2 million and $4.4 million as of December 31, 2012, December 31, 2011 and June 30, 2013, respectively.
F-9
Table of Contents
| The activity in the allowance for doubtful accounts is summarized as follows: |
December 31, 2012 | December 31, 2011 | ||||||
| Balance, beginning of year |
$ | 4.2 | $ | 6.1 | ||||
| (Benefit) provision |
(0.4) | 0.9 | ||||||
| Write-offs, credits and adjustments |
— | (2.8) | ||||||
|
|
|
|
|
|||||
| Balance, end of the period |
$ | 3.8 | $ | 4.2 | ||||
|
|
|
|
|
|||||
Inventories
Inventories consist of raw materials, labor and manufacturing overhead and are valued at the lower of cost or market. Fixed overheads are allocated to the costs of conversion based on the normal capacity of our production facilities. Unallocated overheads during periods of abnormally low production levels are recognized as cost of goods sold in the period in which they are incurred. Raw materials and supplies are generally stated at weighted-average cost and goods in process and finished goods inventories are stated at standard cost as adjusted for variances, which approximate weighted-average actual cost. The valuation of inventory requires us to estimate excess and slow moving inventory. The determination of the value of excess and slow moving inventory is based upon assumptions of future demand and market conditions. If actual market conditions are less favorable than those projected by management, additional inventory write-downs may be required.
Property, Plant and Equipment
We record property, plant and equipment at cost and depreciate it evenly over the assets’ estimated useful lives as follows:
| Years | ||||
| Software |
3-10 | |||
| Buildings and improvements |
2-50 | |||
| Machinery and equipment |
1-30 | |||
Expenditures for repairs and maintenance are charged to expense as incurred. Additions and betterments are capitalized. The cost and related accumulated depreciation on property, plant and equipment sold or otherwise disposed of are removed from the capital accounts and any gain or loss is reported in current-year operations. Leasehold improvements are depreciated over the shorter of the estimated useful life of the asset or the remaining lease term, including renewal periods considered reasonably assured of execution.
Depreciation expense for the years ended December 31, 2012 and 2011 was $118.7 million and $144.3 million, respectively.
Impairment of Property, Plant and Equipment
We periodically assess the impairment of long-lived assets/asset groups when conditions indicate a possible loss. Reviews are performed to determine whether the carrying value of an asset is impaired, based on comparisons to undiscounted expected future cash flows. If this comparison indicates that there is impairment, the impaired asset is written down to its estimated fair value, which is typically calculated using: (i) quoted market prices, including appraisals or (ii) discounted expected future cash flows utilizing an appropriate discount rate. Impairment is based on the excess of the carrying amount over the fair value of those assets. We recorded asset impairment charges in 2012 and 2011. See Notes 3 and 5 for additional discussion on the impairment charges on long-lived assets.
F-10
Table of Contents
Operating Leases
We enter into lease agreements for a variety of business purposes, including office and manufacturing space, office and manufacturing equipment and computer equipment. A portion of these are noncancellable operating leases. See Note 11 for our operating lease obligations .
Revenue Recognition
Revenue is recognized for wafer and other product sales when title transfers, the risks and rewards of ownership have been transferred to the customer, the fee is fixed or determinable and collection of the related receivable is reasonably assured, which is generally at the time of shipment for non-consignment orders. In the case of consignment orders, title passes when the customer pulls the product from the assigned storage facility or, if the customer does not pull the product within a contractually stated period of time (generally 60–90 days), at the end of that period, or when the customer otherwise agrees to take title to the product. Our wafers are generally made to customer specifications, and we conduct rigorous quality control and testing procedures to ensure that the finished wafers meet the customer’s specifications before the product is shipped. We consider international shipping term definitions in our determination of when title passes. We also defer revenue when pricing is not fixed or determinable or other revenue recognition criteria are not met.
Derivative Financial Instruments and Hedging Activities
To mitigate financial market risks of fluctuations in foreign currency exchange rates, we utilize currency forward contracts. We do not use derivative financial instruments for speculative or trading purposes. All derivative instruments are recorded on the combined balance sheet at fair value. We have not designated any derivatives as hedge accounting. Derivatives not designated as hedge accounting and used to hedge foreign-currency-denominated balance sheet items are reported directly in earnings along with offsetting transaction gains and losses on the items being hedged. See Note 10.
Translation of Foreign Currencies
We determine the functional currency of each subsidiary based on a number of factors, including the predominant currency for the subsidiary’s sales and expenditures and the subsidiary’s borrowings. When a subsidiary’s local currency is considered its functional currency, we translate its financial statements to U.S. dollars as follows:
| • | Assets and liabilities using exchange rates in effect at the balance sheet date; and |
| • | Statement of operations accounts at average exchange rates for the period. |
Adjustments from the translation process are presented in accumulated other comprehensive (loss) income in equity.
Income Taxes
SunEdison files consolidated income tax returns that include us. For purposes of these combined financial statements, our taxes are computed and reported using a “separate return” method, or as though we filed a separate return for jurisdictions in which its operations are included in consolidated returns filed by SunEdison. We also record income taxes for jurisdictions in which any of our consolidated subsidiaries files separate returns. Income taxes as presented herein allocate current and deferred income taxes of SunEdison to us in a manner that is systematic, rational and consistent with the asset and liability method in accordance with FASB Accounting Standards Codification 740 (“ASC 740”), Accounting for Income Taxes. The sum of the amounts allocated to the carve-out tax provisions may not equal the historical consolidated provision. Under the separate return method, deferred tax assets and liabilities are recognized for the future tax consequences attributable to differences between the financial statement carrying amounts of existing assets and liabilities and their respective tax bases and operating loss carry forwards.
F-11
Table of Contents
Deferred tax assets and liabilities are measured using enacted tax rates expected to apply to taxable income in the years in which those temporary differences are expected to be recovered or settled. The effect on deferred tax assets and liabilities of a change in tax rate is recognized in operations in the period that includes the enactment date. Valuation allowances are established when management determines that it is more likely than not that some portion, or all of the deferred tax asset, will not be realized. The financial effect of changes in tax laws or rates is accounted for in the period of enactment.
Deferred income taxes arise primarily because of differences in the bases of assets or liabilities between financial statement accounting and tax accounting which are known as temporary differences. We record the tax effect of these temporary differences as deferred tax assets (generally items that can be used as a tax deduction or credit in future periods) and deferred tax liabilities (generally items for which we receive a tax deduction, but have not yet been recorded in the combined statement of operations). We regularly review our deferred tax assets for realizability, taking into consideration all available evidence, both positive and negative, including historical pre-tax and taxable income (losses), projected future pre-tax and taxable income (losses) and the expected timing of the reversals of existing temporary differences. In arriving at these judgments, the weight given to the potential effect of all positive and negative evidence is commensurate with the extent to which it can be objectively verified.
We believe our tax positions are in compliance with applicable tax laws and regulations. Tax benefits are recognized only for tax positions that are more likely than not to be sustained upon examination by tax authorities. The amount recognized is measured as the largest amount of benefit that is greater than 50 percent likely to be realized upon ultimate settlement. Unrecognized tax benefits are tax benefits claimed in our tax returns that do not meet these recognition and measurement standards. Uncertain tax benefits, including accrued interest and penalties, are included as a component of other long-term liabilities because we do not anticipate that settlement of the liabilities will require payment of cash within the next 12 months. The accrual of interest begins in the first reporting period that interest would begin to accrue under the applicable tax law. Penalties, when applicable, are accrued in the financial reporting period in which the uncertain tax position is taken on a tax return. We recognize interest and penalties related to uncertain tax positions in income tax expense, which is consistent with our historical policy. We believe that our income tax accrued liabilities, including related interest, are adequate in relation to the potential for additional tax assessments. There is a risk, however, that the amounts ultimately paid upon resolution of audits could be materially different from the amounts previously included in our income tax expense and, therefore, could have a material impact on our tax provision, net (loss) income and cash flows. We review our accrued liabilities quarterly, and we may adjust such liabilities due to proposed assessments by tax authorities, changes in facts and circumstances, issuance of new regulations or new case law, negotiations between tax authorities of different countries concerning our transfer prices between our subsidiaries, the resolution of entire audits, or the expiration of statutes of limitations. Adjustments are most likely to occur in the year during which major audits are closed.
Management reviewed its policy for repatriation of all our subsidiaries in view of the restructuring announcement made in December 2011 and determined that the undistributed earnings of all our foreign subsidiaries were not expected to be remitted to the U.S. parent corporation in the foreseeable future. During the first six months of 2013, we determined the undistributed earnings of one of our foreign wholly owned subsidiaries would be remitted to the United States in the foreseeable future. The undistributed earnings of all other foreign subsidiaries are not expected to be remitted to the U.S. parent corporation in the foreseeable future. We plan foreign remittance amounts based on projected cash flow needs as well as the working capital and long-term investment requirements of our foreign subsidiaries and our domestic operations.
We have made our best estimates of certain income tax amounts included in the combined financial statements. Application of our accounting policies and estimates, however, involves the exercise of judgment and use of assumptions as to future uncertainties and, as a result, actual results could differ from these estimates. In arriving at our estimates, factors we consider include how accurate the estimate or assumptions have been in the past, how much the estimate or assumptions have changed and how reasonably likely such change may have a material impact.
F-12
Table of Contents
Stock-Based Compensation
Our combined financial statements include certain expenses of SunEdison that were allocated to us for stock compensation. Stock-based compensation expense for all share-based payment awards is based on the estimated grant-date fair value. These compensation costs are recognized net of an estimated forfeiture rate for only those shares expected to vest on a straight-line basis over the requisite service period of the award, which is generally the option vesting term. For ratable awards, compensation costs are recognized for all grants on a straight-line basis over the requisite service period of the entire award. Forfeiture rates are estimated taking into consideration of the historical experience during the preceding four fiscal years.
The assumptions used are routinely examined in estimating the fair value of employee options granted. As part of this assessment, it was determined that the historical stock price volatility and historical pattern of option exercises are appropriate indicators of expected volatility and expected term. The interest rate is determined based on the implied yield currently available on U.S. Treasury zero-coupon issues with a remaining term equal to the expected term of the award. The Black-Scholes option-pricing model is used to estimate the fair value of ratable and cliff vesting options. For market condition awards, the grant date fair value was calculated for these awards using a probabilistic approach under a Monte Carlo simulation taking into consideration volatility, interest rates and expected term.
Contingencies
We are involved in conditions, situations or circumstances in the ordinary course of business with possible gain or loss contingencies that will ultimately be resolved when one or more future events occur or fail to occur. We continually evaluate uncertainties associated with loss contingencies and record a charge equal to at least the minimum estimated liability for a loss contingency when both of the following conditions are met: (i) information available prior to issuance of the financial statements indicates that it is probable that an asset had been impaired or a liability had been incurred at the date of the financial statements; and (ii) the loss or range of loss can be reasonably estimated. Legal costs are expensed when incurred. Gain contingencies are not recorded until realized or realizable.
Shipping and Handling
Costs to ship products to customers are included in marketing and administration expense in the combined statement of operations. Amounts billed to customers, if any, to cover shipping and handling are included in net sales. Cost to ship products to customers were $23.4 million and $21.8 million for the years ended December 31, 2012 and 2011, respectively.
Fair Value Measurements
Fair value accounting guidance establishes a hierarchy for inputs used in measuring fair value that maximizes the use of observable inputs and minimizes the use of unobservable inputs by requiring that the most observable inputs be used when available. Observable inputs are inputs that market participants would use in pricing the asset or liability, and are based on market data obtained from sources independent of us. Unobservable inputs reflect assumptions market participants would use in pricing the asset or liability based on the best information available in the circumstances. The hierarchy is broken down into three levels based on the reliability of inputs as follows:
| • | Level 1—Valuations based on quoted prices in active markets for identical assets or liabilities that we have the ability to access. Valuation adjustments and block discounts are not applied to Level 1 instruments. Because valuations are based on quoted prices that are readily and regularly available in an active market, valuation of these instruments does not entail a significant degree of judgment. |
F-13
Table of Contents
| • | Level 2—Valuations based on quoted prices in markets that are not active or for which all significant inputs are observable, either directly or indirectly. Valuations for Level 2 are prepared on an individual instrument basis using data obtained from recent transactions for identical securities in inactive markets or pricing data from similar instruments in active and inactive markets. |
| • | Level 3—Valuations based on inputs that are unobservable and significant to the overall fair value measurement. |
We maintain various financial instruments recorded at cost in the December 31, 2012, December 31, 2011 and June 30, 2013 balance sheets that are not required to be recorded at fair value. For these instruments, we used the following methods and assumptions to estimate the fair value:
| • | Cash equivalents, restricted cash, accounts receivable and payable, customer deposits, income taxes receivable and payable, short-term borrowings, and accrued liabilities—cost approximates fair value because of the short maturity period; and |
| • | Long-term debt—fair value is based on the amount of future cash flows associated with each debt instrument discounted at our current estimated borrowing rate for similar debt instruments of comparable terms. |
There were no transfers into or out of Level 1, Level 2 or Level 3 financial instruments during the periods ended December 31, 2012, December 31, 2011 and June 30, 2013. See Note 6 for debt fair value disclosure, see Note 9 for pension and other post-employment benefit plan asset fair value disclosures and see Note 10 for derivative fair value disclosures.
Accounting Standards Updates
In February 2013, the Financial Accounting Standards Board (“FASB”) issued Accounting Standards Update 2013-02 (“ASU2013-02”), Reporting of Amounts Reclassified Out of Accumulated Other Comprehensive Income (AOCI), to provide guidance about AOCI disclosure requirements. ASU 2013-02 does not change the current requirements for reporting net income or other comprehensive income in financial statements; however, it does require an entity to provide information about the amounts reclassified out of AOCI by component. In addition, an entity is required to present, either on the face of the statement where net income is presented or in the notes, significant amounts reclassified out of AOCI by the respective line items of net income only if the amount reclassified is required under U.S. GAAP to be reclassified to net income in its entirety in the same reporting period. This standard was adopted on January 1, 2013.
In June 2011, the FASB issued Accounting Standards Update 2011-05 (“ASU 2011-05”), Comprehensive Income (Topic 220): Presentation of Comprehensive Income. ASU 2011-05 allows an entity to present components of net income and other comprehensive income in one continuous statement, referred to as the statement of comprehensive income, or in two separate but consecutive statements. ASU 2011-05 eliminates the option to present the components of other comprehensive income as part of the statement of changes in equity. While the new guidance changes the presentation of comprehensive income, there are no changes to the components that are recognized in net income or other comprehensive income under current accounting guidance. This standard was retrospectively adopted on January 1, 2012.
3. RESTRUCTURING, IMPAIRMENT AND OTHER CHARGES
2011 Global Plan
During the second half of 2011, the semiconductor industry experienced a downturn. In December 2011, in order to better align our business to current and expected market conditions in the semiconductor market, as well as to improve our overall cost competitiveness and cash flows, we committed to a series of actions to reduce our
F-14
Table of Contents
global workforce, right size production capacity and accelerate operating cost reductions in 2012 and beyond (the “2011 Global Plan”). These actions included:
| • | Reducing total workforce by approximately 500 persons worldwide, representing approximately 11% of our employees; |
| • | Shuttering our Merano, Italy polysilicon facility as of December 31, 2011; |
As a result of adverse market conditions and asset recoverability tests, we incurred charges associated with restructuring, impairment of long-lived assets and write-downs of inventory. The following is a summary of the charges recorded during the fourth quarter of December 31, 2011:
| In millions | |||||||
| Type of Charge | Amount | Statement of Operations Classification | |||||
|
|
|
| |||||
| Restructuring |
$ | 281.9 | Restructuring | ||||
| Long-lived asset impairment (see Note 5) |
$ | 234.7 | Long-lived asset impairment | ||||
| Inventory adjustments and other (see Note 4) |
$ | 22.4 | Cost of goods sold | ||||
In the fourth quarter of 2011, restructuring charges consisted of $54.5 million of severance and other one-time benefits for employees terminated under the 2011 Global Plan, $182.9 million of estimated liabilities accrued as a result of us canceling or not being able to fulfill the entire purchase obligation for certain supplier contracts and $44.5 million of other related charges. Total cash payments made under the 2011 Global Plan during the year ended December 31, 2011 were $3.4 million. See the following tables below for cash payments made during the year ended December 31, 2012 and the six months ended June 30, 2013, respectively. For additional discussion on the charges associated with the impairment of long-lived assets and write-downs of inventory, see the respective footnotes noted in the above table.
In addition, during June 2011, we committed to actions to reduce overall manufacturing costs across our global sites, as well as to realign certain general and administrative expenses due to industry and customer specific developments. These actions included relocation of certain operations and reductions in headcount. During the year ended December 31, 2011, we recorded restructuring charges of $5.1 million for severance and other related employee benefits associated with these actions. Cash payments of $4.9 million were made during 2011 that were also related to these actions.
Details of the 2012 expenses, cash payments and expected costs incurred related to the 2011 Global Plan are set out in the following table:
| As of December 31, 2012 | ||||||||||||||||||||||||||||
| In millions | Accrued January 1, 2012 |
Year-to-date Restructuring Charges (Reversals) |
Cash Payments |
Currency | Accrued December 31, 2012 |
Cumulative Costs Incurred |
Total Costs Expected to be Incurred |
|||||||||||||||||||||
| 2011 Global Plan |
||||||||||||||||||||||||||||
| Severance and employee benefits |
$ | 54.5 | $ | (6.4) | $ | (17.4) | $ | 0.3 | $ | 31.0 | $ | 48.1 | $ | 48.1 | ||||||||||||||
| Contract termination |
178.3 | (76.4) | (33.2) | 0.8 | 69.5 | 106.5 | 106.5 | |||||||||||||||||||||
| Other |
48.1 | (5.1) | (6.7) | 0.7 | 37.0 | 39.4 | 39.4 | |||||||||||||||||||||
|
|
|
|
|
|
|
|
|
|
|
|
|
|
|
|||||||||||||||
| Total |
$ | 280.9 | $ | (87.9) | $ | (57.3) | $ | 1.8 | $ | 137.5 | $ | 194.0 | $ | 194.0 | ||||||||||||||
|
|
|
|
|
|
|
|
|
|
|
|
|
|
|
|||||||||||||||
F-15
Table of Contents
On September 4, 2012, we executed two settlement agreements with Evonik Industries AG and Evonik Degussa SpA (“Evonik”), one of our suppliers, to settle disputes arising from our early termination of two take-or-pay supply agreements. One of the original supply agreements also included a provision for the construction and operation of a chlorosilanes plant located on our existing Merano, Italy polysilicon facility for our benefit. Pursuant to the settlement reached, we forfeited a deposit of $10.2 million and agreed to pay Evonik a total of 70.0 million Euro, of which 25.0 million Euro was paid in 2012, 10.0 million Euro was paid in the first quarter of 2013, and 20.0 million Euro was paid in the second quarter of 2013. The remaining 15.0 million Euro will be paid in the third quarter of 2013. As a result of this restructuring related settlement, a favorable adjustment to our 2011 Global Plan liabilities was made in the third quarter of 2012 resulting in $65.8 million of income within restructuring charges on the combined statement of operations. Additionally, on December 30, 2012 as part of the settlement with Evonik, we obtained title to the related chlorosilanes plant, which resulted of a $31.7 million gain on the combined statement of operations in the fourth quarter of 2012. The fair value of the chlorosilanes plant was calculated based on a discounted cash flow model using management’s assumptions (Level 3).
As a result of shuttering our Merano, Italy polysilicon facility, we entered into a letter of agreement on December 14, 2012 with a subsidiary of SunEdison pertaining to a polysilicon supply agreement. The letter agreement required the subsidiary of SunEdison to reimburse the Company 57.9 million Euro related to damages paid to suppliers and lost profits. As a result of this letter of agreement, approximately $75.7 million of income was recorded within restructuring charges on the combined statement of operations with an offset to accounts receivable, affiliate in the combined balance sheet in December 2012. Similarly, in December 2011, a debit memo was issued for approximately $10.5 million, resulting in income within restructuring charges on the combined statement of operations. The parties agreed to offset this accounts receivable, affiliate balance of $75.7 million during 2013 by reducing the long-term loan from the SunEdison subsidiary by 40 million Euro and reducing accounts payable, affiliate by 17.9 million Euro. In addition, the Company retained a deposit of 24 million Euro for each of the periods ended December 31, 2012, December 2011 and June 30, 2013 related to the polysilicon supply agreement, which is included within the accounts payable, affiliate line in the combined balance sheet.
Details of the 2013 expenses, cash payments and expected costs incurred related to the 2011 Global Plan are set out in the following table (unaudited):
| As of June 30, 2013 | ||||||||||||||||||||||||||||
| In millions | Accrued January 1, 2013 |
Year-to-date Restructuring Charges (Reversals) |
Cash Payments | Currency | Accrued June 30, 2013 |
Cumulative Costs Incurred |
Total Costs Expected to be Incurred |
|||||||||||||||||||||
| 2011 Global Plan |
||||||||||||||||||||||||||||
| Severance and Employee benefits | $ | 31.0 | $ | (0.1) | $ | (0.1) | $ | (0.1) | $ | 30.7 | $ | 48.0 | $ | 48.0 | ||||||||||||||
| Contract termination | 69.5 | — | (39.4) | (0.4) | 29.7 | 106.5 | 106.5 | |||||||||||||||||||||
| Other |
37.0 | (6.0) | (2.3) | (0.4) | 28.3 | 33.4 | 33.4 | |||||||||||||||||||||
|
|
|
|
|
|
|
|
|
|
|
|
|
|
|
|||||||||||||||
| Total |
$ | 137.5 | $ | (6.1) | $ | (41.8) | $ | (0.9) | $ | 88.7 | $ | 187.9 | $ | 187.9 | ||||||||||||||
|
|
|
|
|
|
|
|
|
|
|
|
|
|
|
|||||||||||||||
2009 Restructuring Plan
In order to better align manufacturing capabilities to projected demand, we committed to workforce reductions during the first and second quarters of 2009 (the “2009 Global Plan”). In September 2009, we committed to actions to reduce manufacturing costs by shifting manufacturing from our St. Peters, Missouri and Sherman, Texas facilities to other locations which are closer to a number of our customers in the Asia Pacific region (the “2009 U.S. Plan”). We have provided and paid severance benefits to those terminated under the 2009 Global Plan and will provide severance benefits to those employees who have been or will be terminated under the 2009 U.S. Plan. We expect the 2009 U.S. Plan to be completed by the fourth quarter of 2013.
F-16
Table of Contents
During the six months ended June 30, 2013 there were $1.6 million of net payments for severance and other employee benefits, resulting in a liability of $1.1 million as of June 30, 2013.
Details of 2012 expenses related to the 2009 U.S. and Global Plans are set out in the following table:
| Accrued January 1, 2012 |
Year-to-Date Restructuring Charges (Reversals) |
Cash Payments |
Accrued December 31, 2012 |
As of December 31, 2012 | ||||||||||||||||||||
| Cumulative Costs Incurred |
Total Costs Expected to be Incurred |
|||||||||||||||||||||||
| In millions | ||||||||||||||||||||||||
| 2009 U.S. and Global Plans | ||||||||||||||||||||||||
| Severance and other employee benefits |
$ | 12.6 | $ | (2.5) | $ | (7.4) | $ | 2.7 | $ | 15.5 | $ | 15.5 | ||||||||||||
| Asset move costs |
— | — | — | — | 8.5 | 8.8 | ||||||||||||||||||
| Contract termination |
2.9 | — | (2.9) | — | 2.9 | 2.9 | ||||||||||||||||||
| Infrastructure costs |
— | 4.3 | (4.3) | — | 4.3 | 4.3 | ||||||||||||||||||
|
|
|
|
|
|
|
|
|
|
|
|
|
|||||||||||||
| Total |
$ | 15.5 | $ | 1.8 | $ | (14.6) | $ | 2.7 | $ | 31.2 | $ | 31.5 | ||||||||||||
|
|
|
|
|
|
|
|
|
|
|
|
|
|||||||||||||
Details of 2011 expenses related to the 2009 U.S. and Global Plans are set out in the following table:
| Accrued January 1, 2011 |
Year-to-Date Restructuring Charges (Reversals) |
Cash Payments |
Accrued December 31, 2011 |
As of December 31, 2011 | ||||||||||||||||||||
| Cumulative Costs Incurred |
Total Costs Expected to be Incurred |
|||||||||||||||||||||||
| In millions | ||||||||||||||||||||||||
| 2009 U.S. and Global Plans | ||||||||||||||||||||||||
| Severance and other employee benefits |
$ | 16.2 | $ | (0.2) | $ | (3.4) | $ | 12.6 | $ | 18.0 | $ | 18.8 | ||||||||||||
| Asset move costs |
— | 5.3 | (5.3) | — | 8.5 | 20.3 | ||||||||||||||||||
| Contract termination |
— | 2.9 | — | 2.9 | 2.9 | 2.9 | ||||||||||||||||||
| Infrastructure costs |
— | — | — | — | — | 4.0 | ||||||||||||||||||
|
|
|
|
|
|
|
|
|
|
|
|
|
|||||||||||||
| Total |
$ | 16.2 | $ | 8.0 | $ | (8.7) | $ | 15.5 | $ | 29.4 | $ | 46.0 | ||||||||||||
|
|
|
|
|
|
|
|
|
|
|
|
|
|||||||||||||
F-17
Table of Contents
4. INVENTORIES
Inventories consist of the following:
| As of December 31, | As of June 30, | |||||||||||
| 2012 | 2011 | 2013 (unaudited) |
||||||||||
| In millions | ||||||||||||
| Raw materials and supplies |
$ | 35.3 | $ | 36.6 | $ | 31.3 | ||||||
| Goods in process |
43.6 | 62.7 | 48.7 | |||||||||
| Finished goods |
51.6 | 66.5 | 47.4 | |||||||||
|
|
|
|
|
|
|
|||||||
| Total inventories |
$ | 130.5 | $ | 165.8 | $ | 127.4 | ||||||
|
|
|
|
|
|
|
|||||||
Included in the table above at December 31, 2012, we had $27.7 million of finished goods inventory held on consignment, compared to $28.5 million at December 31, 2011.
Due to adverse market conditions and the shuttering of our Merano, Italy polysilicon facility, we recorded lower of cost or market charges on our raw materials and supplies inventory of $8.6 million for the year ended December 31, 2011. Lower of cost or market charges for the year ended December 31, 2012 and for the six months ended June 30, 2013 were immaterial.
Due to the earthquake and tsunami in Japan on March 11, 2011, wafer production in our semiconductor wafer plant in Japan was suspended from that time through April 12, 2011. Due to the unplanned downtime, we recorded a total of $14.9 million of adjustments during the year ended December 31, 2011 as period charges to cost of goods sold for the under absorption of production costs. We recorded no similar adjustments for the year ended December 31, 2012 and for the six months ended June 30, 2013.
5. PROPERTY, PLANT AND EQUIPMENT
Property, plant and equipment consists of the following:
| As of December 31, | ||||||||
| 2012 | 2011 | |||||||
| In millions | ||||||||
| Land |
$ | 6.1 | $ | 6.2 | ||||
| Software |
17.2 | 18.5 | ||||||
| Buildings and improvements |
238.5 | 242.4 | ||||||
| Machinery and equipment |
1,149.0 | 1,147.1 | ||||||
|
|
|
|
|
|||||
| 1,410.8 | 1,414.2 | |||||||
| Less accumulated depreciation |
(729.4) | (678.6) | ||||||
|
|
|
|
|
|||||
| 681.4 | 735.6 | |||||||
| Construction in progress |
108.5 | 56.3 | ||||||
|
|
|
|
|
|||||
| Total property, plant and equipment, net |
$ | 789.9 | $ | 791.9 | ||||
|
|
|
|
|
|||||
We recorded asset impairment charges of $1.5 million for the year ended December 31, 2012, primarily related to software. These charges are reflected in the long-lived asset impairment charges in our combined statement of operations.
Due to the downturn in market conditions, we performed an asset impairment analysis of the polysilicon production assets at our shuttered Merano, Italy polysilicon facility. As a result of this analysis, the polysilicon
F-18
Table of Contents
manufacturing assets at our shuttered Merano, Italy polysilicon facility were determined to be impaired as of December 31, 2011 and written down to its net realizable salvage value, which was based primarily on an appraisal. We recognized asset impairment charges of $225.7 million during the year ended December 31, 2011, which were recorded in the long-lived asset impairment charges in our combined statement of operations.
No asset impairment charges were recorded for the six months ended June 30, 2013.
6. DEBT
Debt outstanding consists of the following:
| As of December 31, 2012 | As of December 31, 2011 | As of June 30, 2013 | ||||||||||||||||||||||||||||||||||
|
|
|
(unaudited) | ||||||||||||||||||||||||||||||||||
| Total Principal |
Current and Short-Term |
Long-Term | Total Principal |
Current and Short-Term |
Long-Term | Total Principal |
Current and Short-Term |
Long-Term | ||||||||||||||||||||||||||||
| In millions | ||||||||||||||||||||||||||||||||||||
| Long-term notes |
$ | 16.0 | $ | 3.4 | $ | 12.6 | $ | 21.5 | $ | 3.7 | $ | 17.8 | $ | 12.4 | $ | 2.9 | $ | 9.5 | ||||||||||||||||||
Long-term notes totaling $16.0 million, $21.5 million and $12.4 million as of December 31, 2012, December 31, 2011 and June 30, 2013, respectively, are owed to a bank by our Japanese subsidiary. The notes are guaranteed by our Parent and are secured by the property, plant and equipment of our Japanese subsidiary. These loans mature in years ranging from 2013 to 2017. The guarantees require our Parent to satisfy the loan obligations in the event that the Japanese subsidiary fails to pay such debt in accordance with its stated terms. The cost of borrowing is a fixed 2.2% interest rate and the notes mature in 2017. There are no debt covenants related to this loan. For information on intercompany borrowings, see Note 13.
The estimated fair value of our debt was $15.0 million, $19.9 million and $11.7 million as of December 31, 2012, December 31, 2011 and June 30, 2013, respectively. Fair value of this debt is calculated using a discounted cash flow model (Level 2 assumptions) with consideration for our non-performance risk (Level 3 assumptions).
Maturities
The aggregate amounts of payments on long-term debt, excluding affiliate debt, after December 31, 2012 are as follows:
| 2013 | 2014 | 2015 | 2016 | 2017 | Thereafter | Total | ||||||||||||||||||||||
| In millions | ||||||||||||||||||||||||||||
| Maturities of long-term debt |
$ | 3.4 | $ | 3.4 | $ | 3.4 | $ | 3.4 | $ | 2.4 | $ | — | $ | 16.0 | ||||||||||||||
7. STOCK-BASED COMPENSATION
Our Participation in Parent’s Incentive Plans
SunEdison maintains a number of stock-based compensation programs at a corporate level. Our employees participate in those programs and as such, we were allocated expenses associated with those programs based on the actual number of stock-based compensation awards granted to our employees. Our combined balance sheets do not include any Parent outstanding equity related to the stock-based compensation programs.
Our Parent has equity incentive plans that provide for the award of non-qualified stock options, restricted stock, performance shares and restricted stock units (“RSU”) to employees, non-employee directors and consultants. We historically have participated in these equity incentive plans and have provided disclosures for these awards allocated to us. As of December 31, 2012, there were 5.1 million shares authorized for future grant under these
F-19
Table of Contents
plans from the Parent. Options to employees are generally granted upon hire and annually or semi-annually, usually with four-year ratable vesting, although certain grants have three, four or five-year cliff vesting. No option has a term of more than 10 years. The exercise price of stock options granted has historically equaled the market price on the date of the grant.
The following table presents information regarding outstanding stock options as of December 31, 2012 and changes during the year then ended with regard to stock options allocated to us:
| Shares | Weighted- Average Exercise Price |
Aggregate Intrinsic Value (in millions) |
Weighted-Average Remaining Contractual Life |
|||||||||||||
| Beginning of 2012 |
4,419,341 | $ | 22.76 | |||||||||||||
| Granted |
3,775,779 | 2.76 | ||||||||||||||
| Exercised |
— | — | ||||||||||||||
| Forfeited |
(1,499,891) | 12.71 | ||||||||||||||
| Expired |
(2,178,166) | 32.18 | ||||||||||||||
|
|
|
|||||||||||||||
| December 31, 2012 |
4,517,063 | $ | 4.84 | $ | 2.0 | 9 | ||||||||||
|
|
|
|||||||||||||||
| Options exercisable at December 31, 2012 |
429,101 | $ | 18.03 | $ | — | 5 | ||||||||||
The following table presents information regarding outstanding stock options as of June 30, 2013 and changes during the six months then ended with regard to stock options allocated to us:
| (unaudited) | Shares | Weighted- Average Exercise Price |
Aggregate Intrinsic Value (in millions) |
Weighted-Average Remaining Contractual Life |
||||||||||||
| Beginning of 2013 |
4,517,063 | $ | 4.84 | |||||||||||||
| Granted |
857,383 | 4.60 | ||||||||||||||
| Exercised |
(11,825) | 3.56 | ||||||||||||||
| Forfeited |
(96,308) | 4.17 | ||||||||||||||
| Expired |
(31,962) | 19.13 | ||||||||||||||
|
|
|
|||||||||||||||
| June 30, 2013 |
5,234,351 | $ | 4.73 | $ | 23.0 | 9 | ||||||||||
|
|
|
|||||||||||||||
| Options exercisable at June 30, 2013 |
621,905 | $ | 13.87 | $ | 0.8 | 6 | ||||||||||
The aggregate intrinsic value in the tables above represents the total pre-tax intrinsic value (the difference between SunEdison’s closing stock price on the last trading day of the year ended December 31, 2012 and the six months ended June 30, 2013 and the exercise price, multiplied by the number of in-the-money options) that would have been received by the option holders had all option holders exercised their options on December 31, 2012 and June 30, 2013. This amount changes based on the fair market value of SunEdison’s stock. There were no material amounts of option exercises and related cash receipts or tax benefits realized for the years ended December 31, 2012 and 2011 and for the six months ended June 30, 2013 and 2012.
At our Parent’s May 25, 2012 annual meeting of stockholders, stockholders approved amendments to the equity incentive plans to permit a one-time stock option exchange program pursuant to which certain employees, excluding directors and executive officers, would be permitted to surrender for cancellation certain outstanding stock options with an exercise price substantially greater than the then current trading price in exchange for fewer stock options at a lower exercise price. The option exchange program commenced on July 17, 2012 and closed on August 17, 2012. The number of new stock options replacing surrendered eligible options was determined by an exchange ratio dependent on the exercise price of the original options and constructed to result in the new option value being approximately equal to the value of surrendered options. The program was designed to cause us to incur minimal incremental stock-based compensation expense in future periods. The option exchange resulted in the cancellation of old options and the issuance of new options with an award date of August 20, 2012
F-20
Table of Contents
and a new exercise price of $2.77 per share. The cancelled options are reflected in the rollforward above as either forfeited or expired, depending on whether or not the old options were vested or not. New options issued in the exchange will vest over a two or three year period depending on whether the surrendered options were fully or partially vested. The cost associated with the awards created under the stock option exchange will be recognized on a straight line basis over the two or three year vesting period. The compensation cost of the original awards will continue to be expensed under the original vesting schedule.
During the third quarter of 2012, the Parent granted options with a 10-year contractual term to select employees, including senior executives, excluding the Parent’s chief executive officer. The options will vest in three tranches one year after the Parent company stock achieves the following three price hurdles for 30 consecutive calendar days: $7.00, $10.00 and $15.00. If the individual price hurdles are not met within five years of the grant date, the options tied to that individual price hurdle will be cancelled. The compensation cost associated with these awards will be expensed on a straight line basis over the service period of each separately identified tranche. The grant date fair value was calculated for these awards using a probabilistic approach under a Monte Carlo simulation taking into consideration volatility, interest rates and expected term. Because the vesting of these awards is based on stock price performance (i.e., a market condition), it is classified as an equity award. The market price hurdles were not met during 2012.
The weighted-average assumptions are as follows:
| 2012 | 2011 | As of June 30, 2013 (unaudited) |
||||||||||
| Risk-free interest rate |
0.8% | 1.7% | 0.6% | |||||||||
| Expected stock price volatility |
67.6% | 65.8% | 64.8% | |||||||||
| Expected term until exercise (years) |
4 | 4 | 4 | |||||||||
| Expected dividends |
—% | —% | —% | |||||||||
The weighted-average grant-date fair value per share of options granted was $1.05, $5.81 and $2.25 for the years ended December 31, 2012 and 2011 and for the six months ended June 30, 2013, respectively. As of December 31, 2012, $6.2 million of total unrecognized compensation cost related to stock options is expected to be recognized over a weighted-average period of 3 years.
Restricted stock units represent the right to receive a share of our Parent’s stock at a designated time in the future, provided the stock unit is vested at the time. Recipients of restricted stock units do not pay any cash consideration for the restricted stock units or the underlying shares, and do not have the right to vote or have any other rights of a stockholder until such time as the underlying shares of stock are distributed. Restricted stock units granted to non-employee directors generally vest over a two-year period from the grant date. Restricted stock units granted to employees usually have three-, four- or five-year cliff vesting, or four-year ratable vesting, and certain grants are subject to performance conditions established at the time of grant.
The following table presents information regarding outstanding restricted stock units allocated to us as of December 31, 2012 and changes during the year then ended:
| Restricted Stock Units |
Aggregate Intrinsic Value (in millions) |
Weighted- Average Remaining Contractual Life |
||||||||||
| Beginning of 2012 |
1,296,849 | |||||||||||
| Granted |
325,608 | |||||||||||
| Converted |
(37,565) | |||||||||||
| Forfeited |
(194,532) | |||||||||||
|
|
|
|||||||||||
| December 31, 2012 |
1,390,360 | $ | 4.5 | 2 | ||||||||
|
|
|
|||||||||||
F-21
Table of Contents
The following table presents information regarding outstanding restricted stock units allocated to us as of June 30, 2013 and changes during the six months then ended:
| (unaudited) | Restricted Stock Units |
Aggregate Intrinsic Value (in millions) |
Weighted- Average Remaining Contractual Life |
|||||||||
| Beginning of 2013 |
1,390,360 | |||||||||||
| Granted |
60,200 | |||||||||||
| Converted |
(301,130) | |||||||||||
| Forfeited |
(43,012) | |||||||||||
|
|
|
|||||||||||
| June 30, 2013 |
1,106,418 | $ | 9.0 | 2 | ||||||||
|
|
|
|||||||||||
As of December 31, 2012, there were no restricted stock units which were convertible. As of December 31, 2012, $5.1 million of total unrecognized compensation cost related to restricted stock units was expected to be recognized over a weighted-average period of approximately 2 years. The weighted-average fair value of restricted stock units on the date of grant was $3.53, $11.37 and $4.09 for the years ended December 31, 2012 and 2011 and for the six months ended June 30, 2013, respectively.
The amount of stock-based compensation cost capitalized into inventory and fixed assets was not material for the years ended December 31, 2012 and 2011 and for the six months ended June 30, 2013 and 2012. Further, the recognition of excess tax benefits from share-based payment arrangements was not material for the years ended December 31, 2012 and 2011 and for the six months ended June 30, 2013 and 2012.
Stock-based compensation expense recorded for the years ended December 31, 2012 and 2011 and for the six months ended June 30, 2013 and 2012 was allocated as follows:
| For the Year Ended December 31, | For the Six Months Ended June 30, | |||||||||||||||
| 2012 | 2011 | 2013 | 2012 | |||||||||||||
| (unaudited) | ||||||||||||||||
| In millions |
||||||||||||||||
| Cost of goods sold |
$ | 4.8 | $ | 4.2 | $ | 1.7 | $ | 2.1 | ||||||||
| Marketing and administration |
6.2 | 13.4 | 3.8 | 2.7 | ||||||||||||
| Research and development |
2.0 | 2.9 | 1.0 | 1.0 | ||||||||||||
|
|
|
|
|
|
|
|
|
|||||||||
| Stock-based employee compensation | $ | 13.0 | $ | 20.5 | $ | 6.5 | $ | 5.8 | ||||||||
|
|
|
|
|
|
|
|
|
|||||||||
8. ACCUMULATED OTHER COMPREHENSIVE LOSS
Comprehensive income (loss) represents a measure of all changes in equity that result from recognized transactions and other economic events other than transactions with owners in their capacity as owners. Other comprehensive income (loss) from the company includes foreign currency translations, gains / (losses) on available-for-sale securities and pension adjustments.
F-22
Table of Contents
The following table presents the changes in each component of accumulated other comprehensive loss, net of tax (unaudited):
| In millions |
Foreign Currency Items (1) |
Available-for-sale Securities |
Pension Plans | Accumulated Other Comprehensive Loss |
||||||||||||
| Balance, December 31, 2012 | $ | (28.1) | $ | 0.2 | $ | (67.3) | $ | (95.2) | ||||||||
| Other comprehensive loss before reclassifications | (42.2) | — | — | (42.2) | ||||||||||||
| Amounts reclassified from accumulated other comprehensive loss (2) | — | — | — | — | ||||||||||||
|
|
|
|
|
|
|
|
|
|||||||||
| Net current period other comprehensive loss | (42.2) | — | — | (42.2) | ||||||||||||
|
|
|
|
|
|
|
|
|
|||||||||
| Balance June 30, 2013 | $ | (70.3) | $ | 0.2 | $ | (67.3) | $ | (137.4) | ||||||||
|
|
|
|
|
|
|
|
|
|||||||||
(1) Excludes foreign currency adjustments as it relates to noncontrolling interests. See the combined statements of comprehensive income (loss).
(2) There are no reclassification adjustments out of accumulated other comprehensive loss into earnings.
9. EMPLOYEE-RELATED LIABILITIES
SunEdison maintains a number of benefit programs at a corporate level. Our employees participate in those programs and as such, we were allocated expenses associated with those programs. Since substantially all of the Parent pension and other post-employment benefit plans relate solely to us, our combined balance sheets include net benefit plan obligations related to those plans and those benefit plans in certain foreign locations that are our direct obligation. For the six months ended June 30, 2013 and 2012, the changes in pension and other post-employment benefit plans are not material to our combined financial statements.
Pension and Other Post-Employment Benefit Plans
Prior to January 2, 2002, SunEdison’s defined benefit pension plan covered most U.S. employees. Benefits for this plan were based on years of service and qualifying compensation during the final years of employment. Effective January 2, 2002, our Parent amended the defined benefit plan to discontinue future benefit accruals for certain participants. In addition, effective January 2, 2002, no new participants will be added to the plan. Effective January 1, 2012, the accumulation of new benefits for all participants under this defined benefit pension plan was frozen. This change did not have a material impact on the Company’s combined financial statements because the plan was frozen to new participants in 2001 and combined with turnover, the level of active participants was not significant.
Our Parent also has a non-qualified plan under the Employee Retirement Income Security Act of 1974. This plan provides benefits in addition to the defined benefit plan. Eligibility for participation in this plan requires coverage under the defined benefit plan and other specific circumstances. The non-qualified plan has also been amended to discontinue future benefit accruals.
Prior to January 1, 2002, our Parent’s health care plan provided post-retirement medical benefits to full-time U.S. employees who met minimum age and service requirements. The plan is contributory, with retiree contributions adjusted annually, and contains other cost-sharing features such as deductibles and coinsurance. Effective January 1, 2002, our Parent amended our health care plan to discontinue eligibility for post-retirement medical benefits for certain participants. In addition, effective January 2, 2002, no new participants will be eligible for post-retirement medical benefits under the plan.
F-23
Table of Contents
Effective January 1, 2012, the amortization period for the unamortized unrealized loss was changed to the remaining life expectancy of the plan participants, which was derived from an actuarial mortality table. This change was triggered since substantially all the plan participants are now inactive/retired. Prior to 2012, the amortization period was derived based on the average remaining service period of the active participants expected to receive benefits. This change has reduced the amortization expense related to the unrealized loss.
Net periodic post-retirement benefit cost (income) consists of the following:
| Pension Plans | Health Care and Other Plans | |||||||||||||||
| Year ended December 31, |
2012 | 2011 | 2012 | 2011 | ||||||||||||
| In millions | ||||||||||||||||
| Service cost |
$ | 1.1 | $ | 2.9 | $ | — | $ | — | ||||||||
| Interest cost |
7.8 | 9.4 | 0.8 | 1.1 | ||||||||||||
| Expected return on plan assets |
(13.8) | (15.4) | — | — | ||||||||||||
| Amortization of prior service cost |
— | — | (0.7) | (0.5) | ||||||||||||
| Net actuarial loss (gain) |
4.1 | 7.9 | (0.5) | (1.5) | ||||||||||||
| Settlement charges |
6.7 | — | — | — | ||||||||||||
|
|
|
|
|
|
|
|
|
|||||||||
| Net periodic benefit cost (income) |
$ | 5.9 | $ | 4.8 | $ | (0.4) | $ | (0.9) | ||||||||
|
|
|
|
|
|
|
|
|
|||||||||
In 2012, our Parent’s pension plans experienced significant lump sum payment activity related to the 2011 global reduction in workforce previously described in Note 3. This event triggered settlement accounting with both the U.S. and foreign plans because there were significant pension benefit obligations settled during 2012.
To determine pension and other post-retirement and post-employment benefit measurements for the plans, our Parent uses a measurement date of December 31. The following is a table of actuarial assumptions used to determine the net periodic benefit cost (income):
| Pension Plans | Health Care and Other Plans | |||||||||||||||
| Year ended December 31, |
2012 | 2011 | 2012 | 2011 | ||||||||||||
| Weighted-average assumptions: |
||||||||||||||||
| Discount rate |
3.65% | 4.58% | 3.93% | 5.09% | ||||||||||||
| Expected return on plan assets |
8.34% | 8.36% | NA | NA | ||||||||||||
| Rate of compensation increase |
3.62% | 3.63% | 3.75% | 3.75% | ||||||||||||
| Current medical cost trend rate |
NA | NA | 8.00% | 8.00% | ||||||||||||
| Ultimate medical cost trend rate |
NA | NA | 5.00% | 5.00% | ||||||||||||
| Year the rate reaches ultimate trend rate |
NA | NA | 2018 | 2017 | ||||||||||||
F-24
Table of Contents
The following summarizes the change in benefit obligation, change in plan assets and funded status of the plans:
| Pension Plans | Health Care and Other Plans | |||||||||||||||
| Year ended December 31, |
2012 | 2011 | 2012 | 2011 | ||||||||||||
| In millions | ||||||||||||||||
| Change in benefit obligation: |
||||||||||||||||
| Benefit obligation at beginning of year |
$ | 227.2 | $ | 213.3 | $ | 20.1 | $ | 23.0 | ||||||||
| Service cost |
1.1 | 2.9 | — | — | ||||||||||||
| Interest cost |
7.8 | 9.4 | 0.8 | 1.1 | ||||||||||||
| Plan participants’ contributions |
— | — | 0.5 | 0.8 | ||||||||||||
| Plan amendments |
— | — | — | (3.9) | ||||||||||||
| Actuarial loss |
17.8 | 19.0 | 2.3 | 1.1 | ||||||||||||
| Gross benefits paid |
(8.7) | (14.9) | (2.2) | (2.0) | ||||||||||||
| Settlements |
(21.0) | (2.1) | — | — | ||||||||||||
| Currency exchange gain |
(0.7) | (0.4) | — | — | ||||||||||||
|
|
|
|
|
|
|
|
|
|||||||||
| Benefit obligation at end of year |
$ | 223.5 | $ | 227.2 | $ | 21.5 | $ | 20.1 | ||||||||
|
|
|
|
|
|
|
|
|
|||||||||
| Change in plan assets: |
||||||||||||||||
| Fair value of plan assets at beginning of year |
$ | 176.0 | $ | 192.2 | $ | — | $ | — | ||||||||
| Actual (loss) gain on plan assets |
22.3 | (2.4) | — | — | ||||||||||||
| Employer contributions |
0.6 | 1.5 | 1.7 | 1.2 | ||||||||||||
| Plan participants’ contributions |
— | — | 0.5 | 0.8 | ||||||||||||
| Settlements |
(18.5) | — | — | — | ||||||||||||
| Gross benefits paid |
(8.7) | (14.9) | (2.2) | (2.0) | ||||||||||||
| Currency exchange gain (loss) |
0.1 | (0.4) | — | — | ||||||||||||
|
|
|
|
|
|
|
|
|
|||||||||
| Fair value of plan assets at end of year |
$ | 171.8 | $ | 176.0 | $ | — | $ | — | ||||||||
|
|
|
|
|
|
|
|
|
|||||||||
| Net amount recognized |
$ | (51.7) | $ | (51.2) | $ | (21.5) | $ | (20.1) | ||||||||
|
|
|
|
|
|
|
|
|
|||||||||
| Amounts recognized in statement of financial position: | ||||||||||||||||
| Accrued liabilities, current |
$ | (0.6) | $ | (0.7) | $ | (1.4) | $ | (1.2) | ||||||||
| Pension and post-employment liabilities, noncurrent |
(51.1) | (50.5) | (20.1) | (18.9) | ||||||||||||
|
|
|
|
|
|
|
|
|
|||||||||
| Net amount recognized |
$ | (51.7) | $ | (51.2) | $ | (21.5) | $ | (20.1) | ||||||||
|
|
|
|
|
|
|
|
|
|||||||||
Amounts recognized in accumulated other comprehensive (loss) income (before tax):
| Pension Plans | Health Care and Other Plans | |||||||||||||||
| As of December 31, |
2012 | 2011 | 2012 | 2011 | ||||||||||||
| In millions | ||||||||||||||||
| Net actuarial loss (gain) |
$ | 86.8 | $ | 88.2 | $ | (0.3) | $ | (3.1) | ||||||||
| Prior service credit |
— | — | (12.1) | (12.8) | ||||||||||||
|
|
|
|
|
|
|
|
|
|||||||||
| Net amount recognized |
$ | 86.8 | $ | 88.2 | $ | (12.4) | $ | (15.9) | ||||||||
|
|
|
|
|
|
|
|
|
|||||||||
The estimated amounts that will be amortized from accumulated other comprehensive (loss) income into net periodic benefit cost (income) in 2013 are as follows:
| Pension Plans | Health Care and Other Plans |
|||||||
| In millions | ||||||||
| Actuarial loss |
$ | 2.6 | $ | — | ||||
| Prior service credit |
— | (0.7) | ||||||
|
|
|
|
|
|||||
| Total |
$ | 2.6 | $ | (0.7) | ||||
|
|
|
|
|
|||||
F-25
Table of Contents
The following is a table of the actuarial assumptions used to determine the benefit obligation:
| Pension Plans | Health Care and Other Plans | |||||||||||||||
| As of December 31, |
2012 | 2011 | 2012 | 2011 | ||||||||||||
| Weighted-average assumptions: |
||||||||||||||||
| Discount rate |
3.14% | 3.65% | 3.37% | 3.95% | ||||||||||||
| Rate of compensation increase |
—% | 3.62% | 3.75% | 3.75% | ||||||||||||
The composition of our Parent’s plans and age of our participants are such that, as of December 31, 2012 and 2011, the medical cost trend rate no longer has a significant effect on the valuation of our Parent’s health care plans.
The U.S. pension plan assets are invested primarily in marketable securities, including common stocks, bonds and interest-bearing deposits. The weighted-average allocation of pension benefit plan assets at year ended December 31 were as follows:
| Actual Allocation | Fair Value | |||||||||||||||||||
| Asset Category (Dollars in millions) |
2012 Target Allocation |
2012 | 2011 | 2012 | 2011 | |||||||||||||||
| Cash |
—% | —% | 15% | $ | — | $ | 24.8 | |||||||||||||
| Group annuity contract |
—% | 32% | —% | 53.7 | — | |||||||||||||||
| Equity securities |
60% | 55% | 61% | 92.9 | 105.2 | |||||||||||||||
| Fixed income securities |
40% | 13% | 24% | 21.9 | 41.6 | |||||||||||||||
|
|
|
|
|
|
|
|
|
|
|
|||||||||||
| Total |
100% | 100% | 100% | $ | 168.5 | $ | 171.6 | |||||||||||||
|
|
|
|
|
|
|
|
|
|
|
|||||||||||
| Asset Category (In millions) |
Asset Value as of December 31, 2012 |
Asset Value as of December 31, 2011 |
||||||
| Cash and cash equivalents |
$ | — | $ | 24.8 | ||||
| Group annuity contract |
53.7 | — | ||||||
| Equity securities: |
||||||||
| U.S. large cap |
38.5 | 50.9 | ||||||
| Mid cap |
11.1 | 11.9 | ||||||
| Small cap |
11.0 | 11.3 | ||||||
| International |
22.0 | 21.3 | ||||||
| Emerging markets |
10.3 | 9.8 | ||||||
| Fixed income: |
||||||||
| Investment grade bonds |
8.3 | 15.8 | ||||||
| Corporate bonds |
13.6 | 25.8 | ||||||
|
|
|
|
|
|||||
| Total |
$ | 168.5 | $ | 171.6 | ||||
|
|
|
|
|
|||||
The investment objectives of our Parent’s pension plan assets are as follows:
| • | To achieve a favorable relative return as compared to inflation; |
| • | To achieve an above average total rate of return relative to capital markets; |
| • | Preservation of capital through a broad diversification among asset classes which react, as nearly as possible, independently to varying economic and market circumstances; and |
| • | Long-term growth, with a degree of emphasis on stable growth, rather than short-term capital gains. |
Our Parent’s pension cost (income) and pension liabilities are determined using various actuarial assumptions, including the discount rate, rate of salary increase, and expected return on plan assets to estimate our pension cost (income) and obligations. The Parent determines the expected return on plan assets based on the pension plans’ intended long-term asset mix. The expected investment return assumption used for the pension plans reflects
F-26
Table of Contents
what the plans can reasonably expect to earn over a long-term period considering plan target allocations. The expected return includes an inflation assumption and adds real returns for the asset mix and a premium for active management, and subtracts expenses. While the assumed expected rate of return on the U.S. pension plan assets in 2012 and 2011 was 8.5% and 8.5%, respectively, the actual return experienced in our Parent’s pension plan assets in the comparable periods in 2012 and 2011 was 12.8% and (1.3)%, respectively. Our Parent consults with the plans’ actuaries to determine a discount rate assumption for pension and other post-retirement and post-employment plans that reflects the characteristics of these plans, including expected cash outflows from the plans, and utilize an analytical tool that incorporates the concept of a hypothetical yield curve.
The pension obligations are funded in accordance with provisions of federal law. Contributions to the pension and post-employment plans in 2012 totaled $0.6 million and $1.7 million, respectively, and in 2011 totaled $1.5 million and $1.2 million, respectively. The funding status of the U.S pension plan was underfunded by $19.5 million and $19.1 million as of December 31, 2012 and 2011, respectively, and recorded in pension and post-employment liabilities. The foreign pension plans and health care and other plans continue to maintain an underfunded status as of December 31, 2012 and 2011 and are recorded in pension and post-employment liabilities. As of December 31, 2012, the accumulated benefit obligation for the U.S. pension plan was $187.9 million and the fair value of plan assets was $168.5 million. We expect our Parent’s contribution to the pension and post-employment plans in 2013 to be approximately $0.0 million and $1.4 million, respectively.
Our Parent uses appropriate valuation techniques based on the available inputs to measure the fair value of its investments. When available, we measure fair value using Level 1 inputs because they generally provide the most reliable evidence of fair value. As of December 31, 2012 and 2011, the pension plan’s investments in equity and fixed income securities were all valued using Level 1 inputs based on the fair value as determined by quoted market price on a daily basis, except for $53.7 million that was valued using Level 3 inputs as of December 31, 2012. This asset is an investment in a group annuity contract and the fair value is estimated to be the contract value of the group annuity contract. The pension plan can make withdrawals from the group annuity contract subject to certain provisions and restrictions. As there is a full guarantee of the contract value and the risk to the plan assets is minimized with such a guarantee the contract value is deemed to be an appropriate approximation of fair value. There were no similar assets as of December 31, 2011.
As discussed above, in 2011 the U.S. pension plan assets decreased to less than the accumulated benefit obligation. As of December 31, 2012 and 2011, the projected benefit obligation, accumulated benefit obligation and fair value of plan assets for pension plans with an accumulated benefit obligation in excess of plan assets were as follows:
| Pension Plans | ||||||||
| 2012 | 2011 | |||||||
| In millions | ||||||||
| Projected benefit obligation, end of year |
$ | 223.5 | $ | 227.2 | ||||
| Accumulated benefit obligation, end of year |
$ | 212.5 | $ | 216.2 | ||||
| Fair value of plan assets, end of year |
$ | 171.8 | $ | 176.0 | ||||
We estimate that the future benefits payable for the pension and other post-retirement plans are as follows:
| Pension Plans | Health Care and Other Plans |
|||||||
| In millions | ||||||||
| 2013 |
$ | 18.4 | $ | 1.4 | ||||
| 2014 |
$ | 12.2 | $ | 1.6 | ||||
| 2015 |
$ | 12.0 | $ | 1.5 | ||||
| 2016 |
$ | 12.5 | $ | 1.4 | ||||
| 2017 |
$ | 12.3 | $ | 1.4 | ||||
| 2018-2022 |
$ | 61.4 | $ | 6.5 | ||||
F-27
Table of Contents
Defined Contribution Plans
SunEdison sponsors a defined contribution plan under Section 401(k) of the Internal Revenue Code covering all U.S. salaried and hourly employees, and a defined contribution plan in Taiwan covering most salaried and hourly employees of our Taiwan subsidiary. Our allocated costs under this plan included in our combined statement of operations totaled $4.0 million and $4.5 million for 2012 and 2011, respectively.
Other Employee-Related Liabilities
Employees of our subsidiaries in Italy and Korea are covered by an end of service entitlement that provides payment upon termination of employment. Contributions to these plans are based on statutory requirements and are not actuarially determined. The accrued liability was $21.6 million at December 31, 2012 and $20.9 million at December 31, 2011, and is included in other long-term liabilities and accrued liabilities on our combined balance sheet. The accrued liability is based on the vested benefits to which the employee is entitled assuming employee termination at the measurement date.
10. DERIVATIVES AND HEDGING INSTRUMENTS
SunEdison Semiconductor’s derivatives and hedging activities consist of:
| Assets (Liabilities) Fair Value | ||||||||||||||||||
| In millions | Balance Sheet Location |
As of December 31, 2012 |
As of December 31, 2011 |
As of June 30, 2013 (unaudited) |
||||||||||||||
| Derivatives not designated as hedging: |
||||||||||||||||||
| Currency forward contracts (1) |
Prepaid and other current assets | $ | 0.3 | $ | 0.3 | $ | — | |||||||||||
| Currency forward contracts (1) |
Accrued liabilities | $ | (6.4 | ) | $ | (0.8 | ) | $ | (1.5 | ) | ||||||||
| (1) Currency forward contracts are recorded on the combined balance sheet at fair value using Level 1 inputs. |
| |||||||||||||||||
|
|
||||||||||||||||||
| Losses (Gains) | ||||||||||||||||||
|
|
Year Ended December 31, |
Six Months Ended June 30, | ||||||||||||||||
| In millions | Statement of Operations Location |
2012 | 2011 | 2013 (unaudited) |
2012 (unaudited) |
|||||||||||||
| Derivatives not designated as hedging: |
||||||||||||||||||
| Currency forward contracts |
Other, net | $ | 5.2 | $ | 0.2 | $ | 10.4 | $ | 0.2 | |||||||||
To mitigate financial market risks of fluctuations in foreign currency exchange rates, we utilize currency forward contracts. We do not use derivative financial instruments for speculative or trading purposes. We generally hedge transactional currency risks with currency forward contracts. Gains and losses on these foreign currency exposures are generally offset by corresponding losses and gains on the related hedging instruments, reducing the net exposure to SunEdison Semiconductor. A substantial portion of our revenue and capital spending is transacted in the U.S. dollar. However, we do enter into transactions in other currencies, primarily the Euro, the Japanese Yen and certain other Asian currencies. To protect against reductions in value and volatility of future cash flows caused by changes in foreign exchange rates, we have established transaction-based hedging programs. Our hedging programs reduce, but do not always eliminate, the impact of foreign currency exchange rate movements. At any point in time, we may have outstanding contracts with several major financial
F-28
Table of Contents
institutions for these hedging transactions. Our maximum credit risk loss with these institutions is limited to any gain on our outstanding contracts. As of December 31, 2012, December 31, 2011 and June 30, 2013, these currency forward contracts had net notional amounts of $169.3 million, $96.4 million and $173.9 million, respectively, and are accounted for as economic hedges, for which hedge accounting was not applied.
11. COMMITMENTS AND CONTINGENCIES
Operating Leases and Purchase Obligations
We lease buildings, equipment and automobiles under operating leases. Rental expense was $4.6 million and $2.1 million for the years ended December 31, 2012 and 2011, respectively. The total future commitments under operating leases as of December 31, 2012 were $22.3 million, of which $21.6 million is noncancellable. Our operating lease obligations as of December 31, 2012 were as follows:
| Payments Due By Period | ||||||||||||||||||||||||||||
| Total | 2013 | 2014 | 2015 | 2016 | 2017 | Thereafter | ||||||||||||||||||||||
| In millions | ||||||||||||||||||||||||||||
| Operating leases |
$ | 22.3 | $ | 5.8 | $ | 4.9 | $ | 4.7 | $ | 3.5 | $ | 1.6 | $ | 1.8 | ||||||||||||||
Purchase Commitments
As part of our restructuring activities announced in the fourth quarter of 2011, we provided notice to several of our vendors with whom we had long-term supply contracts that we will no longer be fulfilling our purchase obligations under those contracts. In connection with the restructuring, we recorded significant restructuring liabilities associated with the estimated settlements arising from these actions based on management’s best estimates of the ultimate outcome of these contract resolutions at that time. As of December 31, 2012, and June 30, 2013, we have recorded total liabilities of $69.5 million and $29.7 million, respectively, associated with the settlements arising from these take-or-pay supply agreements and estimated purchase obligations, all recorded as short-term restructuring liabilities in the combined balance sheet. These amounts include purchase obligations as well as two settlement agreements with Evonik. See Note 3 for additional information regarding the two settlement agreements. The amount of purchase obligations accrued as of December 31, 2012 and June 30, 2013 represents our best estimate of the probable amounts to settle all of our obligations based on presently known information, which involve the use of assumptions requiring significant judgment. These estimates include the contractual terms of the agreements, including whether or not there are fixed volumes and/or fixed prices. In addition, under certain contracts, the counterparty may have a contractual obligation to sell the materials to mitigate their losses. We also included in our estimate of losses consideration around whether we believe the obligation will be settled through arbitration, litigation or commercially viable alternative resolutions or settlements. We intend to vigorously defend ourselves against any arbitration or litigation. Due to the inherent uncertainties of arbitration and litigation, we cannot predict the ultimate outcome or resolution of such actions. The actual amounts ultimately settled with these vendors could vary significantly, which could have a material adverse impact on our business, results of operations and financial condition.
Indemnification
We have agreed to indemnify some of our semiconductor customers against claims of infringement of the intellectual property rights of others in our sales contracts with these customers. Historically, we have not paid any claims under these indemnification obligations, and we do not have any pending indemnification claims as of December 31, 2012, December 31, 2011 and June 30, 2013.
Legal Proceedings
We are involved in various legal proceedings, claims, investigations and other legal matters which arise in the ordinary course of business. Although it is not possible to predict the outcome of these matters, we believe that the ultimate outcome of these proceedings, individually and in the aggregate, will not have a material adverse effect on our financial position, cash flows or results of operations.
F-29
Table of Contents
S.O.I.TEC Silicon on Insulator Technologies S.A. v. MEMC, Inc.
On May 19, 2008, Soitec and Commissariat A L’Energie Atomique (“CEA”) filed a complaint against MEMC in the U.S. District Court for the District of Delaware (Civil Action No. 08-292) alleging infringement, including willful infringement, by MEMC of three U.S. patents related to silicon-on-insulator technology, and requested damages and an injunction. Soitec and CEA filed an amended complaint on July 21, 2009, adding a fourth, related patent to the lawsuit. MEMC filed a counterclaim against Soitec for infringement of one of MEMC’s U.S. patents. The Court bifurcated the case into two phases, a first liability phase, which, to the extent liability is found, will be followed by a second damages phase. In a memorandum opinion dated October 13, 2010, the Court found that all of MEMC’s current products and processes do not infringe any valid claim of the four asserted Soitec patents.
The Court held a jury trial from October 25, 2010 to November 2, 2010. After the Court’s October 13, 2010 ruling in favor of MEMC, the only remaining claim that Soitec continued to assert at trial was a single patent claim directed against some mono-implant research and development efforts conducted by MEMC approximately six to eight years ago, none of which have occurred since 2006, and none of which are material or relevant to the current operations at MEMC. MEMC continued to assert at trial its counterclaim for infringement of MEMC’s patent. On November 2, 2010, the jury found that certain of Soitec’s wafers infringed the patent asserted by MEMC at trial. The jury also found that one of the Soitec patent claims was valid. This single patent claim covers MEMC’s mono-implant research and development efforts that ended in 2006. On July 13, 2011, the court denied all post trial motions. Soitec subsequently filed an appeal and MEMC filed a cross-appeal. The appeal is now fully briefed in the U.S. Court of Appeals for the Federal Circuit. The appeal was stayed pending en banc review of a jurisdictional question unrelated to the merits of the appeal. The stay has now been lifted and the case will be heard by the Court of Appeals later this year. The damages phase of this trial will occur, if at all, after the appeal. We believe that Soitec and CEA’s suit against us has no merit, and we are asserting a vigorous defense, as well as the infringement counterclaim. Although it is not possible to predict the outcome of such matters, we believe that the ultimate outcome of this proceeding will not have a material adverse effect on our financial position, cash flows or results of operations.
Semi-Materials Co., Ltd. v. MEMC, Inc. and MEMC Pasadena, Inc.
On September 28, 2006, Semi-Materials Co., Ltd. (“Semi-Materials”) filed a complaint against MEMC in the U.S. District Court for the Eastern District of Missouri (Case No. 4:06-CV-01426-FRB) alleging breach of contract, unjust enrichment, fraud, and conversion, and seeking specific performance, all related to a series of purchase orders for chunk polysilicon and polysilicon solar ingot (the “Ingot Action”). This litigation resulted in a trial which commenced on February 22, 2011. On March 2, 2011, the jury found for MEMC on the fraud and unjust enrichment claims made by Semi-Materials against the Company. The jury found for Semi-Materials on the breach of contract claim, awarding damages to Semi-Materials of $19.0 million. Approximately $5.1 million of this amount related to an amount previously recorded by MEMC. During the first quarter of 2011, we recorded allocated amounts from our Parent of $4.7 million to marketing and administration expenses as a result of the jury verdict pending the appeal.
On March 31, 2008, Semi-Materials and its affiliate SMC Shanghai (“SMC”) filed two additional lawsuits against MEMC, one in the United States District Court for the Southern District of Texas (Case No. 4:08-CV-00991) (the “Texas Action”) and another in the United States District Court for the Eastern District of Missouri (Case No. 4:08-CV-00434-JCH) (the “Missouri Action”). In both cases, Semi-Materials and SMC alleged that: (i) MEMC Pasadena, Inc. (“MEMC Pasadena”) breached an agreement with SMC for SMC to act as MEMC Pasadena’s exclusive sales agent in China; (ii) MEMC Pasadena breached an agreement with Semi-Materials for Semi-Materials to act as MEMC Pasadena’s exclusive sales agent in Korea; (iii) MEMC tortiously interfered with the purported sales agency agreements among MEMC Pasadena and SMC and Semi-Materials; and (iv) MEMC tortiously interfered with a separate sales agency agreement Semi-Materials claimed existed with an unrelated party. In the Missouri Action, Semi-Materials also claimed that MEMC tortiously interfered with an
F-30
Table of Contents
expectancy for an on-going business relationship Semi-Materials claimed existed with the unrelated party. Upon MEMC’s motions for summary judgment in the Missouri Action, the Court dismissed the claim that MEMC tortiously interfered with the purported sales agency agreements, and the claim that MEMC tortiously interfered with an alleged sales agency agreement between Semi-Materials and the unrelated party. The Court also granted MEMC partial summary judgment as to the scope of the sales transactions on which plaintiffs based their alleged damages for breach of contract. The remaining claims were tried before a jury between January 4 and January 12, 2010. At trial, the jury found in favor of Semi-Materials and SMC on their respective claims for breach of contract against MEMC Pasadena, awarding a verdict of $0.2 million, and found in favor of MEMC on Semi-Materials’ claim for tortious interference with an expectancy of an ongoing business relationship with the unrelated party. Semi-Materials and SMC filed a notice of appeal to the United States Court of Appeals for the Eighth Circuit concerning aspects of the Court’s summary judgment rulings that pertained to the plaintiffs’ alleged damages on their breach of contract claims. MEMC Pasadena filed a notice of cross-appeal concerning the Court’s entry of judgment based upon the jury verdict. The Court of Appeals issued its decision on September 14, 2011 reversing the District Court’s damages-related summary judgment ruling. The Court of Appeals also denied MEMC Pasadena’s cross-appeal and remanded the case to the trial court for further proceedings. No activity was undertaken in the Texas Action, as it had been stayed. On December 6, 2011, the parties entered into a confidential Settlement Agreement and Mutual Release pursuant to which the Ingot Action, Missouri Action and Texas Action, as well as an ancillary garnishment action in Korea, were dismissed with prejudice.
12. INCOME TAXES
As discussed in Note 2 “Summary of Significant Accounting Policies,” we were historically included in SunEdison’s consolidated U.S. federal income tax return; our income taxes are computed and reported herein under the “separate return” method. Use of the separate return method may result in differences when the sum of the amounts allocated to carve-out tax provisions are compared with amounts presented in SunEdison’s consolidated financial statements. In that event, the related deferred tax assets and liabilities could be significantly different from those presented herein. Furthermore, certain tax attributes (i.e., net operating loss carry forwards) may or may not exist at the carve-out level that were actually reflected in SunEdison’s consolidated financial statements.
The net income (loss) before income tax expense (benefit) consists of the following:
| For the year ended December 31, | ||||||||
| 2012 | 2011 | |||||||
| In millions | ||||||||
| U.S. |
$ | (117.1) | $ | (113.1) | ||||
| Foreign |
243.4 | (405.1) | ||||||
|
|
|
|
|
|||||
| Total |
$ | 126.3 | $ | (518.2) | ||||
|
|
|
|
|
|||||
Income tax expense (benefit) consists of the following:
| Current | Deferred | Total | ||||||||||
| In millions | ||||||||||||
| Year ended December 31, 2012: |
||||||||||||
| U.S. Federal |
$ | (1.9) | $ | — | $ | (1.9) | ||||||
| Foreign |
22.1 | (16.6) | 5.5 | |||||||||
|
|
|
|
|
|
|
|||||||
| Total |
$ | 20.2 | $ | (16.6) | $ | 3.6 | ||||||
|
|
|
|
|
|
|
|||||||
| Year ended December 31, 2011: |
||||||||||||
| U.S. Federal |
$ | 2.9 | $ | — | $ | 2.9 | ||||||
| Foreign |
12.3 | 22.1 | 34.4 | |||||||||
|
|
|
|
|
|
|
|||||||
| Total |
$ | 15.2 | $ | 22.1 | $ | 37.3 | ||||||
|
|
|
|
|
|
|
|||||||
F-31
Table of Contents
Effective Tax Rate
Income tax expense (benefit) differed from the amounts computed by applying the statutory U.S. federal income tax rate of 35% to income (loss) before income taxes and noncontrolling interests. The “Effect of foreign operations” includes the net reduced taxation of foreign profits from combining jurisdictions with rates above and below the U.S. federal statutory rate and the impact of U.S. foreign tax credits.
| For the year ended December 31, |
||||||||
| 2012 | 2011 | |||||||
| Income tax at federal statutory rate |
35.0% | (35.0)% | ||||||
| Increase (reduction) in income taxes: |
||||||||
| Effect of foreign operations (including valuation allowance) |
(57.9) | 37.9 | ||||||
| Foreign incentives |
(3.5) | (1.3) | ||||||
| Foreign repatriation |
— | 2.6 | ||||||
| Tax authority positions, net |
(3.1) | — | ||||||
| Valuation allowance |
32.8 | 3.5 | ||||||
| Other, net |
(0.4) | (0.5) | ||||||
|
|
|
|
|
|||||
| Effective tax expense rate |
2.9% | 7.2% | ||||||
|
|
|
|
|
|||||
The 2012 net expense is primarily the result of the worldwide operational earnings mix at various rates, change in valuation allowances and a net decrease to the reserve for uncertain tax positions. The 2011 net expense is primarily the result of the worldwide operation earnings mix at various rates.
Certain of our Asian subsidiaries have been granted a concessionary tax rate of 0.0% on all qualifying income for a period of up to five to ten years based on investments in certain plant and equipment and other development and expansion activities, resulting in a tax benefit for 2012 and 2011 of approximately $4.6 million and $6.6 million, respectively. Under the awards, the income tax rate for qualifying income will be taxed at an incentive tax rate lower than the corporate tax rate. The Company is in compliance with the qualifying condition of the tax incentives. The last of these incentives will expire between 2013 and 2022.
SunEdison is currently under examination by the IRS for the 2008, 2009, 2010 and 2011 tax years. We do not believe the finalization of these exams would result in any material adjustments to our tax positions. We are also under examination by certain foreign tax jurisdictions. We believe it is reasonably possible that some portions of these examinations could be completed within the next twelve months and have currently recorded amounts in the financial statements that are reflective of the current status of these examinations.
Prior to 2011, we determined that the undistributed earnings of one of our foreign subsidiaries would be remitted to the U.S. in the foreseeable future. These earnings were previously considered not permanently reinvested in the business, and the unrecognized deferred tax asset related to these earnings was not previously recognized resulting in a $13.4 million tax benefit, offset by a valuation allowance. Due to the restructuring announcement made in December 2011, we reviewed our policy for repatriation of all our subsidiaries. Based on this review, it was determined that the undistributed earnings of all our foreign subsidiaries are not expected to be remitted to the U.S. parent corporation in the foreseeable future, and the deferred tax benefit previously recorded of $13.4 million was reversed with a corresponding decrease to the valuation allowance. Federal and state income taxes have not been provided on accumulated but undistributed earnings of foreign subsidiaries aggregating approximately $614.4 million and $886.8 million as of December 31, 2012 and 2011, respectively, because such earnings have been permanently reinvested in the business. The determination of the amount of the unrecognized deferred tax liability related to our undistributed earnings is not practicable. During the first six months of 2013, we determined the undistributed earnings of one of our foreign wholly owned subsidiaries would be remitted to the United States in the foreseeable future. These earnings were previously considered permanently reinvested in the business and the unrecognized deferred tax assets related to these earnings was not recognized. The deferred
F-32
Table of Contents
tax effect of these newly planned remittances was recorded as a discrete deferred tax benefit in the amount of $54.5 million, which has been fully offset by a valuation allowance. The undistributed earnings of all other foreign subsidiaries are not expected to be remitted to the U.S. parent corporation in the foreseeable future. We plan foreign remittance amounts based on projected cash flow needs as well as the working capital and long-term investment requirements of our foreign subsidiaries and our domestic operations. Cash and cash equivalents as of December 31, 2012 and June 30, 2013 was $103.2 million and $55.2 million, respectively. The cash and cash equivalents for both periods were all held by our foreign subsidiaries and a portion may be subject to repatriation tax effects. We believe that any repatriation tax effects would have minimal impacts on future cash flows.
For the six months ended June 30, 2013 and June 30, 2012, we record income tax expense each quarter based on our best estimate as to the full year’s effective tax rate. This estimated tax expense is reported based on a pro-ration of the actual income earned in the period divided by the full year forecasted income (loss). There are certain items, however, which are given discrete period treatment, and the tax effects of those items are reported in the quarter that such event arises. Items that give rise to discrete recognition include (but are not limited to) finalizing tax authority examinations, changes in statutory tax rates and expiration of a statute of limitations. The process for calculating income tax expense includes estimating current taxes due and assessing temporary differences between the recognition of assets and liabilities for tax and financial statement reporting purposes. The income tax expense for the six months ended June 30, 2013 and June 30, 2012 is primarily the result of the worldwide operational earnings mix at various rates and change in valuation allowances.
Uncertain Tax Positions
A reconciliation of the beginning and ending amount of gross unrecognized tax benefits is as follows:
| For the year ended December 31, |
||||||||
| 2012 | 2011 | |||||||
| In millions | ||||||||
| Beginning of year |
$ | 5.2 | $ | 5.4 | ||||
| Additions based on tax positions related to the current year |
— | — | ||||||
| Reductions for tax positions of prior years |
(3.6) | (0.2) | ||||||
|
|
|
|
|
|||||
| End of year |
$ | 1.6 | $ | 5.2 | ||||
|
|
|
|
|
|||||
As of December 31, 2012, December 31, 2011 and June 30, 2013, we had $1.8 million, $6.1 million and $1.8 million, respectively, of unrecognized tax benefits, net of U.S. federal, state and local deductions, associated with open tax years for which we are subject to audit in various U.S. federal, state and foreign jurisdictions. This also includes estimated interest and penalties. The change to the reserve from December 31, 2011 to December 31, 2012 includes a decrease of $4.2 million primarily related to taxable income adjustments attributable to foreign operations. All of our unrecognized tax benefits as of December 31, 2012, December 31, 2011 and June 30, 2013 would favorably affect our effective tax rate if recognized. We are subject to examination in various jurisdictions for the 2003 through 2011 tax years. For the periods ended December 31, 2012, December 31, 2011 and June 30, 2013, the Company accrued an immaterial amount for the payment of interest and penalties.
F-33
Table of Contents
Deferred Taxes
The tax effects of the major items recorded as deferred tax assets and liabilities are:
| As of December 31, | ||||||||
| 2012 | 2011 | |||||||
| In millions | ||||||||
| Deferred tax assets: |
||||||||
| Inventories |
$ | 6.7 | $ | 8.5 | ||||
| Restructuring liabilities |
26.1 | 97.7 | ||||||
| Expense accruals |
16.5 | 17.3 | ||||||
| Property, plant and equipment |
92.2 | 93.9 | ||||||
| Pension, medical and other employee benefits |
23.8 | 23.4 | ||||||
| Net operating loss carryforwards |
63.4 | 14.6 | ||||||
| Foreign tax credits |
25.6 | 23.7 | ||||||
| Other |
23.2 | 17.1 | ||||||
|
|
|
|
|
|||||
| Total deferred tax assets |
277.5 | 296.2 | ||||||
| Valuation allowance |
(240.9) | (273.9) | ||||||
|
|
|
|
|
|||||
| Net deferred tax assets |
36.6 | 22.3 | ||||||
|
|
|
|
|
|||||
| Deferred tax liabilities: |
(4.0) | (6.9) | ||||||
|
|
|
|
|
|||||
| Net deferred tax assets |
$ | 32.6 | $ | 15.4 | ||||
|
|
|
|
|
|||||
Our deferred tax assets and liabilities, netted by taxing location, are in the following captions in the combined balance sheet:
| As of December 31, | ||||||||
| 2012 | 2011 | |||||||
| In millions | ||||||||
| Current deferred tax assets, net (recorded in deferred tax asset and accrued liabilities) |
$ | 12.4 | $ | 2.1 | ||||
| Non-current deferred tax assets, net (recorded in other assets and other liabilities) |
20.2 | 13.3 | ||||||
|
|
|
|
|
|||||
| Total |
$ | 32.6 | $ | 15.4 | ||||
|
|
|
|
|
|||||
Our net deferred tax assets totaled $32.6 million as of December 31, 2012 compared to $15.4 million as of December 31, 2011. In 2012, the increase of $17.2 million in net deferred tax assets is primarily attributable to additional deferred tax assets associated with net operating losses offset by decreases in restructuring liabilities. Deferred tax assets generated in 2011 were offset by recognizing an increase of $197.3 million in the valuation allowance primarily associated with changes in restructuring liabilities and changes to valuation allowance in certain foreign jurisdictions. Deferred tax assets utilized in 2012 were offset by recognizing a decrease of $33.0 million in the valuation allowance primarily associated with changes in restructuring liabilities and changes to valuation allowance in certain foreign jurisdictions. As of December 31, 2012, we have valuation allowances of $240.9 million. We believe that it is more likely than not, with our projections of future taxable income in certain foreign jurisdictions, that we will generate sufficient taxable income to realize the benefits of the net deferred tax assets of $32.6 million. As of December 31, 2012, we had deferred tax assets associated with net operating loss carryforwards of $11.2 million in certain foreign jurisdictions; if unused, these will expire in 2022.
Our total deferred tax assets, net of valuation allowance, as of June 30, 2013 was $28.0 million. We believe that it is more likely than not, with our projections of future taxable income in certain foreign jurisdictions, that we will generate sufficient taxable income to realize the benefits of the net deferred tax assets which have not been offset by a valuation allowance at June 30, 2013.
F-34
Table of Contents
13. Related Party Transactions
Corporate Allocations
Refer to Note 1 for discussion on corporate expense allocations.
Sales to Affiliates
Sales to affiliates represent polysilicon sales made to subsidiaries of our Parent which are then sold to external parties. These products were sold on a cost plus basis for polysilicon mainly produced at our Merano, Italy polysilicon facility. After shuttering our Merano, Italy polysilicon facility during the fourth quarter of 2011, we significantly reduced our sales to affiliates since subsidiaries of our Parent purchased polysilicon externally or sourced polysilicon through its other subsidiaries. Net sales to affiliates were $6.8 million, $147.0 million, $5.1 million and $3.3 million for the years ended December 31, 2012 and 2011 and for the six months ended June 30, 2013 and 2012, respectively.
Due to/from Affiliates
We ship intermediate products such as polysilicon, trichlorosilane gas, ingots and scrap wafers and other inventory items to SunEdison’s subsidiaries in the United States, Europe and Asia for use in their operations. Any sales related to these shipments are recognized as an accounts receivable, affiliate in the combined balance sheet and revenue is recognized as net sales to affiliates in the combined statement of operations. Any intracompany sales between our subsidiaries are eliminated. SunEdison performs financing, cash management, treasury and other services for us on a centralized basis and the related amounts due to SunEdison are recorded as an accounts payable, affiliate in the combined balance sheet. As of December 31, 2012, December 31, 2011 and June 30, 2013, we had $89.1 million, $20.4 million and $19.4 million, respectively, of receivables due from affiliates, and $102.0 million, $59.7 million and $111.9 million, respectively, of payables due to affiliates.
Notes Receivable and Debt—Affiliates
We have various note receivables from certain SunEdison subsidiaries. As of December 31, 2012, December 31, 2011 and June 30, 2013, we had $158.5 million, $111.5 million and $181.6 million, respectively, of note receivables due from affiliates. Interest is calculated based on fixed rates ranging from 2% to 3%. The notes mature one year or less but are usually renewed and are therefore considered long-term.
We have long-term intercompany borrowings with our Parent of $129.4 million, $127.3 million and $76.0 million as of December 31, 2012, December 31, 2011 and June 30, 2013, respectively. The weighted-average costs of borrowing were 0.5%, 1.4% and 0.5% as of December 31, 2012, December 31, 2011 and June 30, 2013, respectively. Interest is determined based on the Euribor one year rate. The payments on long-term affiliate debt are due in 2049. There are no guarantees or debt covenants related to these intercompany borrowings.
Interest income on intercompany notes receivable and interest expense on intercompany borrowings is recorded as interest (income) expense, net—affiliates on the combined statements of operations.
Collateralized Debt Obligations
Certain of our assets are pledged as collateral under SunEdison’s revolving credit facility and second lien term loan credit agreement. The indebtedness related to these SunEdison debt obligations has not been allocated to us but our pledged assets may be seized or sold in the event SunEdison defaults on these debt obligations to satisfy the guaranteed obligations. However, we do not believe it is likely SunEdison will default on these debt obligations. Upon consummation of the Transactions, these assets will no longer be pledged as collateral under SunEdison’s credit facility or term loan.
F-35
Table of Contents
14. GEOGRAPHIC SEGMENTS
We are engaged in one reportable segment that includes the development, production and marketing of semiconductor wafers with a wide variety of features satisfying numerous product specifications to meet our customers’ exacting requirements, which wafers are utilized in the manufacture of semiconductor devices.
Net sales to non-affiliates (see Note 13 for discussion of sales to affiliates):
| For the Year Ended December 31, | ||||||||
| 2012 | 2011 | |||||||
| In millions | ||||||||
| United States |
$ | 147.7 | $ | 177.9 | ||||
| Foreign |
779.7 | 873.4 | ||||||
|
|
|
|
|
|||||
| Total |
$ | 927.4 | $ | 1,051.3 | ||||
|
|
|
|
|
|||||
Foreign sales to non-affiliates were derived from sales to the following countries:
| For the Year Ended December 31, |
||||||||
| 2012 | 2011 | |||||||
| In millions | ||||||||
| Taiwan |
$ | 219.4 | $ | 264.1 | ||||
| Korea |
197.3 | 208.8 | ||||||
| Singapore |
56.7 | 72.4 | ||||||
| Japan |
55.7 | 64.0 | ||||||
| Germany |
48.6 | 41.1 | ||||||
| China |
46.5 | 45.9 | ||||||
| Italy |
42.8 | 50.5 | ||||||
| France |
33.0 | 38.2 | ||||||
| Malaysia |
15.7 | 21.4 | ||||||
| Other foreign countries |
64.0 | 67.0 | ||||||
|
|
|
|
|
|||||
| Total |
$ | 779.7 | $ | 873.4 | ||||
|
|
|
|
|
|||||
Net sales are attributed to countries based on the location of the customer.
Our net sales to non-affiliates and affiliates attributable to polysilicon for the years ended December 31, 2012 and 2011 were 0.2% and 12.4%% as a percent of total net sales, respectively. See Note 13 for discussion of sales to affiliates.
Long-lived assets, net of accumulated depreciation:
| As of December 31, | ||||||||
| 2012 | 2011 | |||||||
| In millions | ||||||||
| United States |
$ | 13.8 | $ | 26.0 | ||||
| Japan |
115.4 | 158.7 | ||||||
| Korea |
128.3 | 102.9 | ||||||
| Malaysia |
135.6 | 125.8 | ||||||
| Taiwan |
234.5 | 258.3 | ||||||
| Italy |
162.2 | 120.1 | ||||||
| Other foreign countries |
0.1 | 0.1 | ||||||
|
|
|
|
|
|||||
| Total |
$ | 789.9 | $ | 791.9 | ||||
|
|
|
|
|
|||||
F-36
Table of Contents
Credit Concentration
Our customers include semiconductor device manufacturers and are located in various geographic regions including North America, Europe and the Asia Pacific region. Our customers are generally well capitalized, and the concentration of credit risk is considered minimal. Sales to non-affiliate specific customers exceeding 10% of net sales for the years ended December 31 were as follows:
| For the Year Ended December 31, | ||||||||||||||||
| 2012 | 2011 | |||||||||||||||
| Revenues | Percent | Revenues | Percent | |||||||||||||
| In millions, except for percentages | ||||||||||||||||
| Customer A |
$ | 183.1 | 19.7% | $ | 182.6 | 17.4% | ||||||||||
| Customer B |
$ | 119.2 | 12.9% | $ | 124.9 | 11.9% | ||||||||||
| Customer C |
$ | 102.1 | 11.0% | $ | 115.0 | 10.9% | ||||||||||
15. Subsequent Events
For our combined financial statements as of and for the years ended December 31, 2012 and 2011, we have evaluated subsequent events through September 8, 2013, the date the combined financial statements were available to be issued.
F-37
Table of Contents
Through and including (the 25th day after the date of this prospectus), all dealers that effect transactions in these securities may be required to deliver a prospectus.
Shares
SunEdison Semiconductor, Inc.
Common Stock
PRELIMINARY PROSPECTUS
Deutsche Bank Securities
Goldman, Sachs & Co.
, 2013
Table of Contents
PART II
INFORMATION NOT REQUIRED IN PROSPECTUS
| Item 13. | Other Expenses of Issuance and Distribution |
The following table sets forth all costs and expenses, other than the underwriting discounts and commissions payable by us, in connection with the offer and sale of the securities being registered. All amounts shown are estimates except for the SEC registration fee and the FINRA filing fee.
| Amount | ||||
| SEC registration fee |
$ | 34,100 | ||
| FINRA filing fee |
38,000 | |||
| Stock exchange listing fee |
* | |||
| Legal fees and expenses |
* | |||
| Accounting fees and expenses |
* | |||
| Printing expenses |
* | |||
| Miscellaneous expenses |
* | |||
|
|
|
|||
| Total |
$ | * | ||
|
|
|
|||
* To be completed by amendment.
| Item 14. | Indemnification of Directors and Officers |
Section 102(b)(7) of the DGCL allows a corporation to provide in its certificate of incorporation that a director of the corporation will not be personally liable to the corporation or its stockholders for monetary damages for breach of fiduciary duty as a director, except where the director breached the duty of loyalty, failed to act in good faith, engaged in intentional misconduct or knowingly violated a law, authorized the payment of a dividend or approved a stock repurchase in violation of Delaware corporate law or obtained an improper personal benefit. Our amended and restated certificate of incorporation provides for this limitation of liability.
Section 145 of the DGCL, or Section 145, provides that a Delaware corporation may indemnify any person who was, is or is threatened to be made, party to any threatened, pending or completed action, suit or proceeding, whether civil, criminal, administrative or investigative (other than an action by or in the right of such corporation), by reason of the fact that such person is or was an officer, director, employee or agent of such corporation or is or was serving at the request of such corporation as a director, officer, employee or agent of another corporation or enterprise. The indemnity may include expenses (including attorneys’ fees), judgments, fines and amounts paid in settlement actually and reasonably incurred by such person in connection with such action, suit or proceeding, provided such person acted in good faith and in a manner he reasonably believed to be in or not opposed to the corporation’s best interests and, with respect to any criminal action or proceeding, had no reasonable cause to believe that his or her conduct was illegal. A Delaware corporation may indemnify any persons who are, were or are threatened to be made a party to any threatened, pending or completed action or suit by or in the right of the corporation by reason of the fact that such person is or was a director, officer, employee or agent of another corporation or enterprise. The indemnity may include expenses (including attorneys’ fees) actually and reasonably incurred by such person in connection with the defense or settlement of such action or suit, provided such person acted in good faith and in a manner he reasonably believed to be in or not opposed to the corporation’s best interests, provided that no indemnification is permitted without judicial approval if the officer, director, employee or agent is adjudged to be liable to the corporation. Where an officer or director is successful on the merits or otherwise in the defense of any action referred to above, the corporation must indemnify him against the expenses which such officer or director has actually and reasonably incurred.
Section 145 further authorizes a corporation to purchase and maintain insurance on behalf of any person who is or was a director, officer, employee or agent of the corporation or is or was serving at the request
II-1
Table of Contents
of the corporation as a director, officer, employee or agent of another corporation or enterprise, against any liability asserted against him and incurred by him in any such capacity, or arising out of his or her status as such, whether or not the corporation would otherwise have the power to indemnify him under Section 145.
Our amended and restated bylaws will provide that we must indemnify our directors and officers to the fullest extent authorized by the DGCL and must also pay expenses incurred in defending any such proceeding in advance of its final disposition; provided, that if and to the extent required by the DGCL, such an advance shall be made only upon delivery of an undertaking, by or on behalf of an indemnified person, to repay all amounts so advanced if it should be determined ultimately by final judicial decision from which there is no further right to appeal that such person is not entitled to be indemnified under such section or otherwise.
We intend to enter into indemnification agreements with each of our directors and officers. These agreements will require us to indemnify these individuals to the fullest extent permitted under Delaware law against liabilities that may arise by reason of their service to us, and to advance expenses incurred as a result of any proceeding against them as to which they could be indemnified.
The indemnification rights set forth above shall not be exclusive of any other right which an indemnified person may have or hereafter acquire under any statute, provision of our amended and restated certificate of incorporation, our amended and restated bylaws, agreement, vote of stockholders or disinterested directors or otherwise.
We expect to maintain standard policies of insurance that provide coverage (1) to our directors and officers against loss rising from claims made by reason of breach of duty or other wrongful act and (2) to us with respect to indemnification payments that we may make to such directors and officers.
The proposed form of Underwriting Agreement to be filed as Exhibit 1.1 to this Registration Statement provides for indemnification to our directors and officers by the underwriters against certain liabilities.
| Item 15. | Recent Sales of Unregistered Securities |
We have not sold any securities, registered or otherwise, within the past three years, except for the shares issued upon our formation to our sole stockholder, SunEdison.
| Item 16. | Exhibits and Financial Statement Schedules |
| (a) | The list of exhibits is set forth under “Exhibit Index” at the end of this registration statement and is incorporated herein by reference. |
| (b) | See the Index to Financial Statements included on page F-1 for a list of the financial statements included in this registration statement. All schedules not identified above have been omitted because they are not required, are inapplicable, or the information is included in the combined financial statements or notes contained in this registration statement. |
Certain of the agreements included as exhibits to this prospectus contain representations and warranties by each of the parties to the applicable agreement. These representations and warranties have been made solely for the benefit of the other parties to the applicable agreement and:
| • | should not in all instances be treated as categorical statements of fact, but rather as a way of allocating the risk to one of the parties if those statements prove to be inaccurate; |
| • | have been qualified by disclosures that were made to the other party in connection with the negotiation of the applicable agreement, which disclosures are not necessarily reflected in the agreement; |
II-2
Table of Contents
| • | may apply standards of materiality in a way that is different from what may be viewed as material to you or other investors; and |
| • | were made only as of the date of the applicable agreement or such other date or dates as may be specified in the agreement and are subject to more recent developments. |
The registrant acknowledges that, notwithstanding the inclusion of the foregoing cautionary statements, it is responsible for considering whether additional specific disclosures of material information regarding material contractual provisions are required to make the statements in this registration statement not misleading.
| Item 17. | Undertakings |
The undersigned registrant hereby undertakes to provide to the underwriters at the closing specified in the underwriting agreement certificates in such denominations and registered in such names as required by the underwriters to permit prompt delivery to each purchaser.
Insofar as indemnification for liabilities arising under the Securities Act may be permitted to directors, officers and controlling persons of the registrant pursuant to the foregoing provisions, or otherwise, the registrant has been advised that in the opinion of the Securities and Exchange Commission, such indemnification is against public policy as expressed in the Securities Act, and is, therefore, unenforceable. In the event that a claim for indemnification against such liabilities (other than the payment by the registrant of expenses incurred or paid by a director, officer or controlling person of the registrant in the successful defense of any action, suit or proceeding) is asserted by such director, officer or controlling person in connection with the securities being registered, the registrant will, unless in the opinion of its counsel the matter has been settled by controlling precedent, submit to a court of appropriate jurisdiction the question of whether such indemnification is against public policy as expressed in the Securities Act and will be governed by the final adjudication of such issue.
The undersigned registrant hereby undertakes that:
(i) for purposes of determining any liability under the Securities Act, the information omitted from the form of prospectus filed as part of this registration statement in reliance upon Rule 430A and contained in a form of prospectus filed by the registrant pursuant to Rule 424(b)(1) or (4) or 497(h) under the Securities Act shall be deemed to be part of this registration statement as of the time it was declared effective; and
(ii) for the purpose of determining any liability under the Securities Act, each post-effective amendment that contains a form of prospectus shall be deemed to be a new registration statement relating to the securities offered therein, and the offering of such securities at that time shall be deemed to be the initial bona fide offering thereof.
II-3
Table of Contents
SIGNATURES
Pursuant to the requirements of the Securities Act of 1933, the registrant has duly caused this Registration Statement on Form S-1 to be signed on its behalf by the undersigned, thereunto duly authorized, in the City of St. Peters, State of Missouri, on September 9, 2013.
| SUNEDISON SEMICONDUCTOR, INC. |
| By: /s/ Shaker Sadasivam |
| Name: Shaker Sadasivam Title: President and Chief Executive Officer |
POWER OF ATTORNEY
Each person whose signature appears below constitutes and appoints Shaker Sadasivam, Brian Wuebbels and Martin Truong, and each of them singly, his true and lawful attorneys-in-fact and agents, with full power of substitution and resubstitution, for him and in his name, place and stead, in any and all capacities, to sign any and all amendments (including post-effective amendments) to this Registration Statement and any and all additional Registration Statements pursuant to Rule 462(b) of the Securities Act, and to file the same, with all exhibits thereto, and all other documents in connection therewith, with the Securities and Exchange Commission, granting unto each said attorney-in-fact and agents full power and authority to do and perform each and every act in person, hereby ratifying and confirming all that said attorneys-in-fact and agents or either of them or their or his substitute or substitutes may lawfully do or cause to be done by virtue hereof.
Pursuant to the requirements of the Securities Act of 1933, this Registration Statement has been signed by the following persons in the capacities and on the dates indicated.
| /s/ Shaker Sadasivam Shaker Sadasivam |
President, Chief Executive Officer and Director (principal executive officer) |
September 9, 2013 | ||
| /s/ Brian Wuebbels Brian Wuebbels |
Chief Financial Officer of SunEdison, Inc. and Director (principal financial officer and principal accounting officer) | September 9, 2013 | ||
Table of Contents
EXHIBIT INDEX
| Exhibit Number |
Exhibit Description | |
| 1.1* | Form of Underwriting Agreement. | |
| 3.1* | Form of Amended and Restated Certificate of Incorporation of SunEdison Semiconductor, Inc. to be effective prior to the completion of this offering. | |
| 3.2* | Form of Amended and Restated Bylaws of SunEdison Semiconductor, Inc. to be effective prior to the completion of this offering. | |
| 4.1* | Specimen Stock Certificate. | |
| 5.1 | Form of Opinion of Kirkland & Ellis LLP. | |
| 10.1* | Separation Agreement, by and between SunEdison Semiconductor, Inc. and SunEdison, Inc. | |
| 10.2*† | Supply Agreement, by and between SunEdison Semiconductor, Inc. and SunEdison, Inc. | |
| 10.3* | Intellectual Property Licensing Agreement, by and between SunEdison Semiconductor, Inc. and SunEdison, Inc. | |
| 10.4* | Transition Services Agreement, by and between SunEdison Semiconductor, Inc. and SunEdison, Inc. | |
| 10.5* | Tax Matters Agreement, by and between SunEdison Semiconductor, Inc. and SunEdison, Inc. | |
| 10.6* | Registration Rights Agreement, by and between SunEdison Semiconductor, Inc. and SunEdison, Inc. | |
| 10.7* | Form of Indemnification Agreement with Directors and Officer | |
| 10.8* | Credit Agreement, by and among SunEdison Semiconductor, Inc., , as administrative agent, and the various lenders signatory thereto. | |
| 10.9* | SunEdison Semiconductor, Inc. 2013 Equity Incentive Plan. | |
| 21.1* | List of subsidiaries. | |
| 23.1 | Consent of KPMG LLP. | |
| 23.2 | Consent of Kirkland & Ellis (included in Exhibit 5.1). | |
| 24.1 | Power of Attorney (included on the signature page of this Registration Statement). | |
| 99.1* | Consent of Director Nominees. | |
| * | To be filed by amendment. |
| † | We will omit certain portions pursuant to a confidential treatment request. Omitted information will be provided separately to the SEC. |
E-1