Attached files
| file | filename |
|---|---|
| 8-K - 8-K - ASSOCIATED BANC-CORP | d594319d8k.htm |
 THIRD
QUARTER 2013 ASSOCIATED BANC-CORP
INVESTOR
PRESENTATION
Exhibit 99.1 |
 FORWARD-LOOKING STATEMENTS
1
Important note regarding forward-looking statements:
Statements made in this presentation which are not purely historical are
forward-looking statements, as defined in the Private Securities
Litigation Reform Act of 1995. This includes any statements regarding
management’s plans, objectives, or goals for future operations,
products or services, and forecasts of its revenues, earnings, or other measures of
performance.
Such forward-looking statements may be identified by the use of words such
as “believe”, “expect”, “anticipate”,
“plan”, “estimate”, “should”, “will”, “intend”, “outlook”, or
similar expressions.
Forward-looking statements are based on current management
expectations and, by their nature, are subject to risks and uncertainties. Actual
results may differ
materially
from
those
contained
in
the
forward-looking
statements.
Factors
which
may
cause actual results to differ materially from those contained in such
forward-looking statements include those identified in the
company’s most recent Form 10-K and subsequent SEC filings.
Such factors are incorporated herein by reference. |
 OUR
FOOTPRINT AND FRANCHISE •
Top 50, publicly traded,
U.S. bank holding
company
•
$24 billion in assets;
largest bank
headquartered in
Wisconsin
•
239 branches serving
approximately one
million customers
About Associated
ASBC
Deposits¹ ($
in billions)
ASBC
Branches¹
WI
$11.5
170
IL
$4.0
44
MN
$1.6
25
Total
$17.1
239
1
FDIC market share data 6/30/13
2 |
 ATTRACTIVE MIDWEST MARKETS
3
•
Population:
Over 60 mm people live in our footprint (~ 20% of USA)
1
.
•
GDP Metrics:
$2.9 trillion in 2012 (18.4% of US GDP). 4% growth from
2011 is consistent with the national average.
2
•
Employment Data:
Five states in our footprint have lower unemployment
rates than the national average of 7.4%. Total jobs in footprint
grew 371
thousand YoY.
3
•
Manufacturing Concentrated:
Top 3 states (Indiana, Wisconsin, and
Iowa) for concentration of manufacturing jobs and two other states in the
top 10.
4
•
Manufacturing Growth:
Midwest Manufacturing output is up 6.9% CAGR
from 2011 vs. national index increase of 3.1% CAGR
5
.
•
Favorable Credit:
Five of the top ten cities with the best credit ratings are
in footprint.
6
1
US Census Bureau 2012 ; ²
US Department of Commerce;
3
U.S. BLS, State: Jul 2013 ;
4
March 2012 Brookings Paper ;
5
FRB Chicago Midwest Manufacturing Index, Jul 2013. Jul 2012, Jul 2011;
6
Experian State of Credit Survey 2012; |
 ASSOCIATED AT ITS CORE
4
Community
bank values,
flexibility,
decision-
making,
attention to
relationships
and service
Big bank
products,
strength,
lending limits,
efficiency,
innovation,
depth of
expertise |
 SECOND
QUARTER HIGHLIGHTS AND OUTLOOK 5
•
Net income of $47 mm
•
Average loans of $15.7 bn, up
2% QoQ
•
Net interest income of $160
mm, up 2% QoQ
•
CET1 ratio of 11.5%
•
Repurchased $30 mm of stock
•
ROCET1 of 9.9%, compared to
9.3% for Q2 2012
Second Quarter 2013 Highlights:
Outlook –
Growing the
Franchise & Creating Long-
Term Shareholder Value
•
Continued focus on organic
growth opportunities
•
Defending NIM compression in
low-rate environment
•
Strong focus on efficiency &
expense management
•
Disciplined focus on deploying
capital to drive long-term
shareholder value |
 RESHAPING & REBUILDING THE LOAN
PORTFOLIO
1
6
1
Based on Average Balances, $ in Billions
Installment
Home Equity
Residential
Mortgage &
HE 1
st
Liens
Construction
CRE
Investor
Commercial
&
Business
Lending
$16.3
$14.6
$12.6
$14.0
$15.1
$15.7
•
Portfolio peaked at
$16.3 b in 4Q 2008
•
Goal: A balanced
portfolio between
Commercial & Business,
Commercial Real
Estate, and Retail
•
Reduced Construction
exposure by ~ 70% from
2008
•
Home Equity run off as
more consumers
refinance into fixed rate
mortgages
35%
33%
32%
33%
36%
37%
19%
19%
24%
31%
30%
29%
14%
18%
19%
18%
19%
19%
14%
11%
6%
4%
4%
5%
13%
13%
13%
10%
8%
7%
5%
6%
6%
4%
3%
3% |
 LOAN
PORTFOLIO GROWTH AND COMPOSITION 7
Average Loans of $15.7 billion for Second Quarter 2013
2Q 2013 Average Net Loan Growth of $280 million
Loan Mix –
2Q 2013 (Average)
($ balances in millions)
Home Equity & Installment
Commercial Real Estate
Residential Mortgage
Power & Utilities
Oil & Gas
Mortgage Warehouse
General Commercial Loans
Average Quarterly Loans ($ in billions)
+2% QoQ
Peak Loans (4Q 2008) $16.3 billion |
 BRANCH
STRATEGY 8
Refine
Footprint
•
Footprint Project –
60%
complete. Began in 2011.
Rationalize
Footprint
•
Consolidated 24% of
branches since 2007.
Reinvigorate
Model
Deposit Automation ATM
Transaction Express
Financial Outlet
Video Teller
Lower Cost Branch Concepts
•
Leverage technology solutions for service.
Deposits & Customer Funding
($ in billions)
Non-maturity deposits
Time Deposits
Retain
Relationships
•
Grow deposits |
 New Features:
•
Associated SnapDeposit™
(Picture of Checks)
•
Popmoney (Person to
Person Transfers)
•
View/Pay eBills
•
New Alerts
•
Enhanced Security
ENHANCING MOBILE BANKING OFFERINGS
9
•
New iPad App
(Sept 2013)
•
Enhanced
Smartphone
Apps (Sept 2013) |
 COMMITTED TO EFFICIENCY IMPROVEMENTS
10
Efficiency Ratio¹
Trend
1
–
Efficiency ratio
= Noninterest expense, excluding amortization of intangibles, divided by sum of
taxable equivalent net interest income plus noninterest income, excluding
investment securities gains, net, and asset gains, net. This is a non-GAAP
financial measure. Please refer to the appendix for a reconciliation of this and
other non-GAAP items. 2
–
Peer Average
= based on ASBC’s peer group and sourced from SNL.
64.5%
Peer Average²
Net Interest Income Trend
Noninterest Income Trend
Noninterest Expense Trend
Opportunity |
 PURSUING EFFICIENCY GAINS
11
Project Pathway Benefits:
Customer
Relationship
Reporting &
Analytics
Workflow
Management
Time to
Market
Audit Trail
Data Quality
Automation
Compliance
Enforcement
Colleague
Engagement
Green Bay
Chicago
Real Estate Initiatives:
•
Actions to optimize our real estate
holdings and capacity
•
2013 –
Consolidated Corporate offices in
Green Bay (6 buildings) and Chicago (3
buildings)
Back Office Initiatives:
•
Implementing technology solutions in
labor intensive processes
•
2013 -
Commercial loan system with
end to end processing |
 GROWING NET INTEREST INCOME WHILE
MARGIN COMPRESSES
12
Yield on Interest-earning Assets
Cost of Interest-bearing Liabilities
Net Interest Income & Net Interest Margin
($ in millions) |
 CAPITAL MANAGEMENT PRIORITIES
13
Funding Organic
Growth
Paying a
Competitive
Dividend
Non-organic
Growth
Opportunities
Share Buybacks
and Redemptions
Priority
Highest
Lowest
2012
2013
•
Fund Loan Growth and other Capital Investments
•
Announced $125 mm
share repurchase program
(November 2012)
•
Repurchased $30 mm in
Q4 2012
•
Repurchased $90 mm YTD
•
Announced additional $120
mm share repurchase
program (July 2013)
•
Announced authorization to
repurchase $10 mm
preferred shares (July 2013)
•
Increased quarterly
dividend to $0.08/share in
Q4 2012 (60% increase
from $0.05/ share)
•
Paid $0.08 /share in Q1
and Q2
•
~
2% Dividend Yield
•
~ 30% Cash Payout on
EPS
•
Cost Take-out Provides Greater Value
•
Maintain Discipline in Pricing of any Transaction |
 CAPITAL
DEPLOYMENT OPPORTUNITIES 14
Basel I ASBC
2Q = 11.5%
2Q = 11.0%
8% -
9.5%
Basel III ASBC
3
Basel III
2
Systematically Important Financial Institutions
1
Regional and Community Banks
= 7%
+1 -
2.5%
Organic Asset
Growth
Non Organic
Cash Acquisition
Repurchase /
Special Dividend
Capacity
3
In July 2013, the Federal Reserve and the OCC published final rules (the
“Basel III Capital Rules”) establishing a new comprehensive
capital framework for U.S. banking organizations. 11.0% is 2Q estimate of
Basel III capital ratio. Potential
Excess Capital
1.5 –
3%
Capital
Deployment
Options
2
1 |
 2013
SECOND HALF OUTLOOK 15
Loan Trends
•
Quarterly loan growth of 1 –
2%.
•
Continued disciplined loan
pricing
Deposit Trends
Fee Income
Expenses
NIM
Growing the Franchise & Creating Long-Term Shareholder Value
Footprint
Credit
Capital
•
Continued disciplined deposit
pricing
•
Sustained focus on treasury
management solutions to drive
growth in commercial deposits
•
Continued compression over
the second half of the year
•
Modest improvement in core fee-
based revenues with lower net
mortgage banking revenues
•
Flat year-over-year
•
Reduced regulatory costs offset by
continued franchise investments
•
Continuing to invest in our
branches while optimizing our
network
•
Complete Green Bay and Chicago
corporate office consolidations
•
Modest improvement in credit
trends
•
Provision expense to increase
based on quarterly loan growth
•
Disciplined focus on
deploying capital to drive
long-term shareholder value
•
$26 million of 9.25% sub-debt
called for redemption in
October |
 WHY
ASSOCIATED 16
•
Committed to Efficiency Ratio Improvement
•
Strong Capital Profile & Opportunities for
Capital Deployment
•
Leading Midwest Bank Operating in
Attractive Markets
•
Core Organic Growth Opportunity
•
Disciplined Loan and Deposit Pricing
•
Improving Credit Quality
•
Improving Earnings Profile
Net Income
Available to
Common
($ in millions)
Return on
Common Equity
Tier 1
Reasons to Invest
Net Income Available to Common & ROCET1¹
Management Team Focused on Creating
Long-Term Shareholder Value
1
–
Return on Common Equity Tier 1 (ROCET1)
= Management uses Tier 1 common equity, along with other
capital measures, to assess and monitor our capital position. This is a
non-GAAP financial measure. Please refer to the appendix for a
definition of this and other non-GAAP items. |
 OUR
VISION 17
ASSOCIATED
will be the most
admired Midwestern financial
services company, distinguished by
sound, value-added financial
solutions with personal service for
our customers, built upon a strong
commitment to our colleagues and
the communities we serve, resulting
in exceptional value for our
shareholders. |
 APPENDIX
18 |
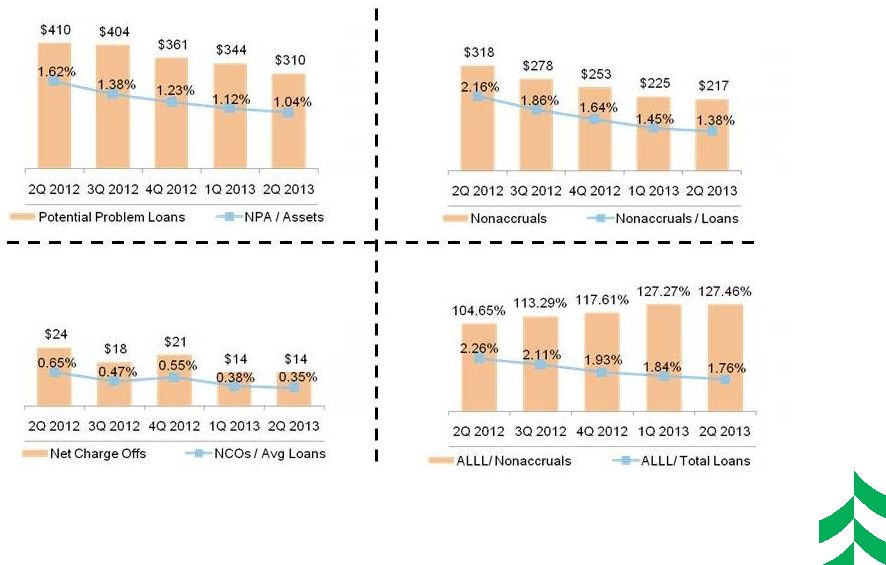 IMPROVEMENT IN CREDIT QUALITY INDICATORS
($ IN MILLIONS)
19 |
 INVESTMENT SECURITIES PORTFOLIO
20
Type
Mkt Value
(000’s)
%of Total
0% RWA
$ 468,264
9%
20% RWA
4,349,847
88%
50% RWA
25,585
1%
=>100% RWA
72,075
1%
Not subject to RW
10,046
1%
TOTAL
$4,925,817
100%
Risk –
Weighted Profile –
June 30, 2013
Investment Portfolio –
June 30, 2013
Credit Rating
($ in thousands)
Mkt Value
% of Total
Govt & Agency
$ 4,037,284
82.0%
AAA
68,692
1.4%
AA
559,555
11.4%
A
249,565
5.1%
BAA1, BAA2 &
BAA3
---
0.0%
BA1 & Lower
2,534
0.1%
Non-rated
8,186
0.2%
Total
$4,925,817
100.0%
Portfolio Composition Ratings –
June 30, 2013
Market Value Composition –
June 30, 2013
Type
Bk Value
(000’s)
Mkt Value
(000’s)
TEY
(%)
Duration
(Yrs)
Govt &
Agencies
$ 1,002
$ 1,004
0.30
1.13
MBS
2,536,056
2,533,037
2.74
3.84
CMOs
1,068,119
1,075,432
2.57
2.45
Agency CMBS
446,807
431,252
1.89
3.95
Municipals
777,482
801,731
5.23
4.84
Corporates
84,095
83,316
1.59
1.07
Other
18
45
---
---
TOTAL HTM &
AFS
$4,913,579
$4,925,817
3.01
3.65
Risk
–
weighted
profile
estimated
as
of
July
12,
2013
CMOs
22%
MBS
51%
Municipals
16%
Agency CMBS
9%
Corporates
2%
All Other
97% |
 COMMERCIAL LOANS BY INDUSTRY
AS OF JUNE 30, 2013
21
CB&L Loans by Industry ¹
1
Based on NAICS codes
($6.0 billion)
CRE Loans by Industry
($3.8 billion) |
 COMMERCIAL LOAN PORTFOLIOS BY
GEOGRAPHY
AS OF JUNE 30, 2013
22
Commercial & Business Loans by State
CRE Loans by State
($6.0 billion)
($3.8 billion)
1
Includes Missouri, Indiana, Ohio, Michigan, & Iowa
|
 CONSUMER LOAN PORTFOLIOS BY
GEOGRAPHY
AS OF JUNE 30, 2013
23
Residential Mortgage Loans by State
Home Equity Loans by State
Approximately half of home equity
portfolio is in first-lien position
($3.5 billion)
($2.0 billion)
1
Includes Missouri, Indiana, Ohio, Michigan, & Iowa
|
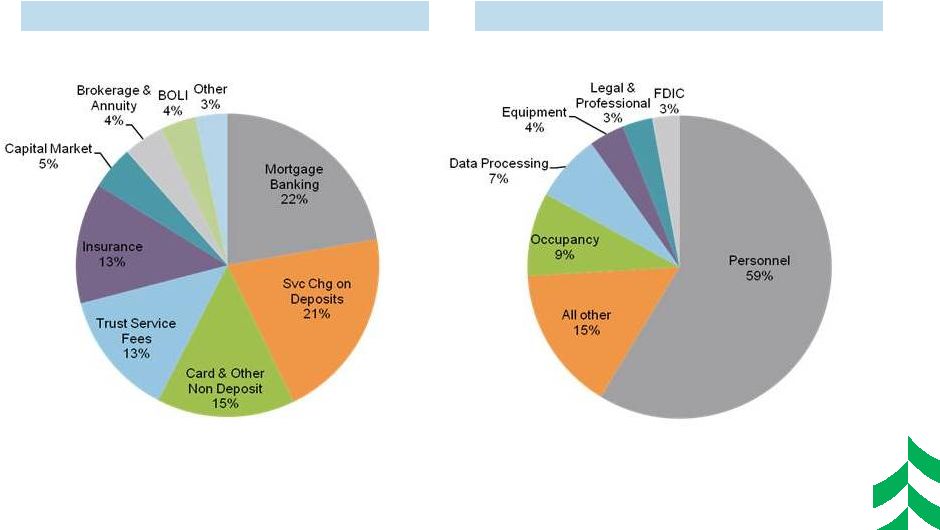 NON
INTEREST INCOME AND EXPENSE COMPOSITION
1
ST
HALF 2013
24
Noninterest Income by Category
Noninterest Expense by Category
($166 million)
($337 million) |
 RECONCILIATION AND DEFINITIONS OF
NON-GAAP ITEMS
25
1H 2013
1H 2012
2Q 2013
1Q 2013
4Q 2012
3Q 2012
2Q 2012
Efficiency Ratio Reconciliation:
Efficiency ratio (1)
69.64%
72.57%
69.54%
69.74%
73.71%
72.81%
72.30%
Taxable equivalent adjustment
(1.43)
(1.62)
(1.39)
(1.46)
(1.57)
(1.61)
(1.62)
Asset gain (losses), net
0.12
(1.26)
(0.01)
0.24
(0.06)
(0.98)
(1.47)
Other intangible amortization
(0.42)
(0.44)
(0.41)
(0.42)
(0.43)
(0.43)
(0.44)
Efficiency ratio, fully taxable equivalent (1)
67.91%
69.25%
67.73%
68.10%
71.65%
69.79%
68.77%
(1)
Efficiency
ratio
is
defined
by
the
Federal
Reserve
guidance
as
noninterest
expense
divided
by
the
sum
of
net
interest
income
plus
noninterest
income,
excluding investment securities gains / losses, net. Efficiency
ratio, fully taxable equivalent, is noninterest expense, excluding other
intangible amortization, divided by the sum of taxable equivalent net
interest income plus noninterest income, excluding investment securities gains / losses, net
and asset gains / losses, net. This efficiency ratio is presented on a
taxable equivalent basis, which adjusts net interest income for the tax-favored status
of certain loans and investment securities. Management believes
this measure to be the preferred industry measurement of net interest income as it
enhances the comparability of net interest income arising from taxable and
tax-exempt sources and it excludes certain specific revenue items (such as
investment securities gains / losses, net and asset gains / losses, net).
Definition of Common Equity Tier 1:
Common
Equity
Tier
1
(CET1),
a
non-GAAP
financial
measure,
is
used
by
banking
regulators,
investors
and
analysts
to
assess
and
compare
the
quality
and composition of our capital with the capital of other financial services
companies. Management uses Tier 1 common equity, along with other capital
measures, to assess and monitor our capital position. Common Equity Tier 1 is Tier
1 capital excluding qualifying perpetual preferred stock and qualifying
trust preferred securities. |