Attached files
| file | filename |
|---|---|
| 8-K - FORM 8-K - PATHEON INC | d592277d8k.htm |
| EX-99.1 - EX-99.1 - PATHEON INC | d592277dex991.htm |
 Patheon
Fiscal 2013 Third Quarter Results
September 5, 2013
Exhibit 99.2 |
 1
Forward-looking statements
This
presentation
contains
forward-looking
statements
or
information
which
reflect
our
expectations
regarding
possible
events,
conditions,
our
future
growth,
results
of
operations,
performance,
and
business
prospects
and
opportunities.
All
statements,
other
than
statements
of
historical
fact,
are forward-
looking
statements.
Forward-looking
statements
necessarily
involve
significant
known
and
unknown
risks,
assumptions
and
uncertainties
that
may
cause
our
actual
results
in
future
periods
to
differ
materially
from
those
expressed
or
implied
by
such
forward-looking
statements,
including
risks
related
to
acquisitions
and
divestitures,
our
operational
excellence
initiatives
and
transformation
activities,
our
exposure
to
complex
production
issues,
our
substantial
financial
leverage,
international
operations,
competition,
government
regulations,
customer
demand,
potential
environmental,
health
and
safety
liabilities,
existence
of
a
majority
shareholder,
and
product
liability
claims.
For
additional
information
regarding
risks
and
uncertainties
that
could
affect
our
business
and
our
financial
results,
please
see
our
Annual
Report
on
Form
10-K
for
the
fiscal
year
ended
October
31,
2012
and
our
subsequent
filings
with
the
U.S.
Securities
and
Exchange
Commission
and
the
Canadian
Securities
Administrators.
Accordingly,
you
are
cautioned
not
to
place
undue
reliance
on
forward-looking
statements.
These
forward-looking
statements
are
made
as
of
the
date
hereof,
and
except
as
required
by
law,
we
assume
no
obligation
to
update
or
revise
them
to
reflect
new
events
or
circumstances.
Use of Non-GAAP Financial Measures
Commencing
in
fiscal
2013,
we
revised
our
calculation
of
Adjusted
EBITDA
to
exclude
stock-based
compensation
expense,
consulting
costs
related
to
our
operational
initiatives,
purchase
accounting
adjustments,
and
acquisition-related
litigation
expenses.
We
believe
that
excluding
these
items
from
Adjusted
EBITDA
better
reflects
our
underlying
performance.
Based
on
the
revisions
to
the
definition
of
Adjusted
EBITDA,
we
have
recast
the
presentation
of
Adjusted
EBITDA
for
the
three
and
nine
months
periods
ended
July
31,
2012
to
be
consistent
with
the
current
period
presentation.
Our
Adjusted
EBITDA
is
now
income
(loss)
from
continuing
operations
before
repositioning
expenses,
interest
expense,
foreign
exchange
losses
reclassified
from
other
comprehensive
income
(loss),
refinancing
expenses,
acquisition
and
integration
costs
(including
certain
product
returns
and
inventory
write-offs
recorded
in
gross
profit),
gains
and
losses
on
sale
of
capital
assets,
income
taxes,
asset
impairment
charges,
depreciation
and
amortization,
stock-based
compensation
expense,
consulting
costs
related
to
our
operational
initiatives,
purchase
accounting
adjustments,
acquisition-related
litigation
expenses
and
other
income
and
expenses.
Adjusted
EBITDA
margin
is
Adjusted
EBITDA
as
a
percentage
of
revenues.
Since
Adjusted
EBITDA
is
a
non-GAAP
measure
that
does
not
have
a
standardized
meaning,
it
may
not
be
comparable
to
similar
measures
presented
by
other
issuers.
Readers
are
cautioned
that
Adjusted
EBITDA
should
not
be
construed
as
an
alternative
to
net
income
(loss)
determined
in
accordance
with
U.S.
GAAP
as
an
indicator
of
performance.
Adjusted
EBITDA
is
used
by
management
as
an
internal
measure
of
profitability.
We
have
included
Adjusted
EBITDA
because
we
believe
that
this
measure
is
used
by
certain
investors
to
assess
our
financial
performance
before
non-cash
charges
and
certain
costs
that
we
do
not
believe
are
reflective
of
our
underlying
business.
A
reconciliation
of
Adjusted
EBITDA
to
the
closest
U.S.
GAAP
measure
is
included
with
the
financial
statements
in
this
press
release. |
 2
•
Revenues increased by 30.4% from prior year
•
Gross profit improved by $15.6 million or 28.1% compared to the
same period last year
•
Adjusted EBITDA increase of $4.6 million from prior year
•
Banner integration complete and yielding benefits
•
On track to achieve more than $1 billion in revenue in fiscal year 2013
Fiscal 2013 third quarter highlights |
 3
Strengthen
core operations
Sell business
differently
Enter logical
adjacencies
Drive industry
consolidation
•
Delivered $42M in
Adjusted EBITDA
savings in 2012 and on
track to deliver above
$30M in 2013
•
Right First Time and On
Time Delivery metrics
continue to improve
across our facilities
•
Talent upgrades across
several facilities
•
Executive sponsor
program for key
accounts driving right
level of dialogue
•
New project proposals
continue to grow across
many customers
•
Banner integration
complete and yielding
attractive results
•
Additional technology
and/or company
opportunities being
explored linked to
differentiated model
•
High degree of consolidation activity
underway across CDMO industry
•
Customer market research indicates
that building an integrated offering at
scale is an attractive proposition
Strategy |
 4
Key accomplishments
CMO
Revenue increased by 35.4% compared to the
same quarter last year, including Banner
Factory performance, improved customer matrix,
Right First Time, On Time Delivery
PDS
Strong revenue of $37.9 million
7.1% year-over-year growth
Ongoing results from operating
excellence and top line growth
Product Updates
FDA approval of Calcitriol
Positive results from Entericare
(fish oil) clinical trial
First-to-file PIV ANDA for
Diclofenac |
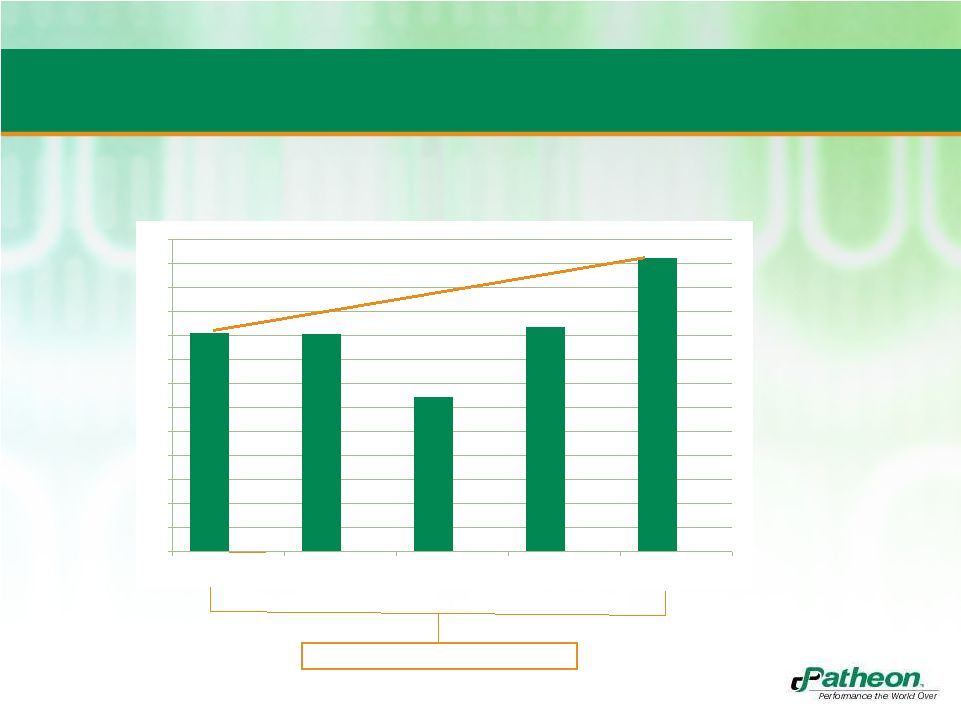
 5
203.7
210.0
213.5
253.9
265.7
100
120
140
160
180
200
220
240
260
Q3 2012
Q4 2012
Q1 2013
Q2 2013
Q3 2013
Revenues increased by $62.0
million from prior year
Banner represented $66.4
million of the increase
Revenues
(U.S. $ in millions)
30.4% yr-yr revenue growth |
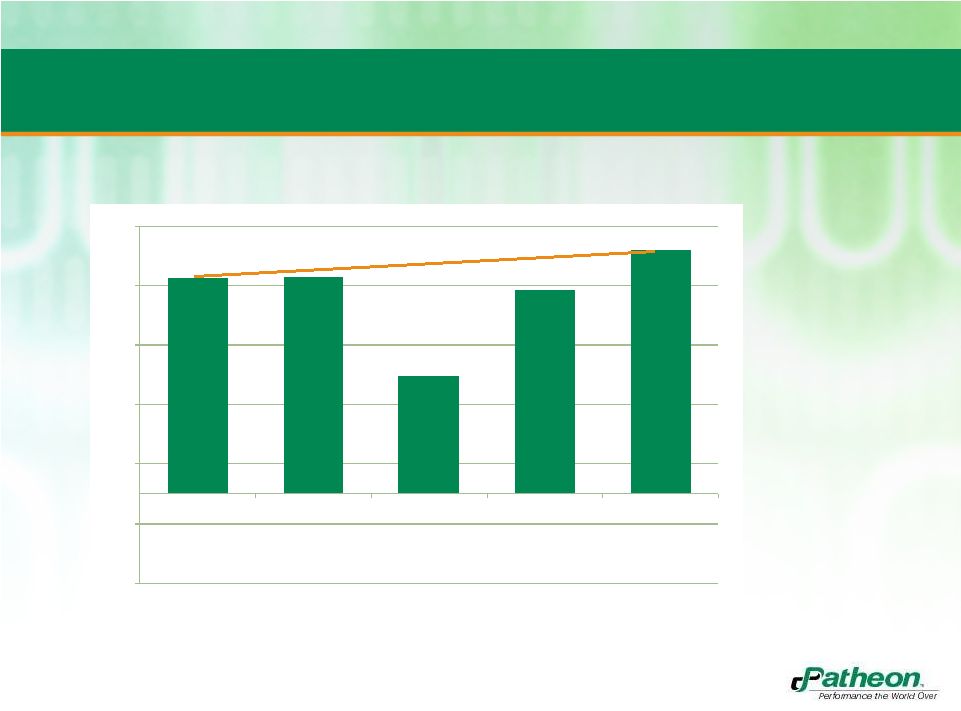
 6
55.5
55.4
42.4
57.0
71.1
10
15
20
25
30
35
40
45
50
55
60
65
70
75
Q3 2012
Q4 2012
Q1 2013
Q2 2013
Q3 2013
Gross profit increased by $15.6
million from prior year
Gross Profit
(U.S. $ in millions)
28.1% yr-yr gross profit growth |
 7
Adjusted EBITDA increase of $4.6 million from prior year
36.4
36.5
19.8
34.4
41.0
-15
-5
5
15
25
35
45
Q3 2012
Q4 2012
Q1 2013
Q2 2013
Q3 2013
Adjusted EBITDA
(U.S. $ in millions) |
 8
Summary financial results
Three months ended July 31,
Statement of Operations
2013
2012
Change
(in millions of U.S. dollars)
$
$
$
Revenues
265.7
203.7
62.0
Gross Profit
71.1
55.5
15.6
Selling, general and administrative expenses
44.8
29.9
14.9
Operating income
16.6
25.5
(8.9)
Income from continuing operations
4.3
15.5
(11.2)
Adjusted EBITDA
41.0
36.4
4.6
Balance Sheets
Q3 2013
Q4 2012
Cash and cash equivalents
40.9
39.4
Inventories
144.3
82.3
Intangible assets
70.6
-
Goodwill
45.3
3.5
Deferred tax liabilities (LT & ST)
57.7
23.0
Total debt (LT & ST)
610.4
313.1
Undrawn lines of credit
63.4
64.4 |
 9
•
Provide industry leading customer experience
–
Right First Time
–
On Time Delivery
•
Exceed industry growth rates
•
Continue to improve financial results
–
Margin expansion
–
Free cash flow
–
Enhance shareholder value
2013 priorities |
 10
Thank you |
 11
Appendix
ADJUSTED EBITDA BRIDGE
Three months ended July 31,
Nine months ended July 31,
2013
2012
2013
2012
$
$
$
$
Total Adjusted EBITDA
41.0
36.4
95.2
51.0
Depreciation and amortization
(12.4)
(9.3)
(35.6)
(30.8)
Repositioning expenses
(4.5)
(0.1)
(11.0)
(6.9)
Acquisition and integration costs
(1.2)
—
(15.4)
—
Interest expense, net
(12.6)
(6.8)
(35.0)
(19.8)
Impairment charge
(1.2)
—
(11.3)
(57.9)
Gain on sale of capital assets
—
—
1.6
—
(Provision for) benefit from income taxes
(0.9)
(3.3)
5.5
(3.6)
Refinancing expenses
—
—
(29.2)
—
Operational initiatives related consulting costs
(0.4)
(1.0)
(2.3)
(13.3)
Acquisition-related litigation expenses
(4.0)
—
(4.0)
—
Stock-based compensation expense
(0.7)
(0.7)
(2.4)
(2.5)
Purchase accounting adjustments
—
—
(5.0)
—
Other
1.2
0.3
2.0
0.5
Income (loss) from continuing operations
4.3
15.5
(46.9)
(83.3) |