Attached files
| file | filename |
|---|---|
| 8-K - 8-K - ABM INDUSTRIES INC /DE/ | d590772d8k.htm |
| EX-99.1 - EX-99.1 - ABM INDUSTRIES INC /DE/ | d590772dex991.htm |
Exhibit 99.2

| ABMThird Quarter 2013Teleconference |
| Agenda 2 1 Introduction & Overview | Henrik Slipsager, CEO 2 Third Quarter 2013 Financial Review | Jim Lusk, CFO 3 Third Quarter 2013 Operational Review | Jim McClure, EVP, Tracy Price, EVP & Henrik Slipsager, CEO 4 Fiscal 2013 Outlook | Henrik Slipsager, CEO Forward-Looking Statements and Non-GAAP Financial Information:Our discussions during this conference call will include forward-looking statements. Actual results could differ materially from those projected in the forward-looking statements. The factors that could cause actual results to differ are discussed in the Company's 2012 Annual Report on Form 10-K and in our 2013 reports on Form 10-Q and Form 8-K. These reports are available on our website at http://investor.abm.com/ under "SEC Filings". A description of factors that could cause actual results to differ is also set forth at the end of this presentation. Also, the discussion during this conference call will include certain financial measures that were not prepared in accordance with U.S. generally accepted accounting principles ("U.S. GAAP"). Reconciliations of those non-GAAP financial measures to the most directly comparable U.S. GAAP financial measures can be found on the Investor Relations portion of our website at http://investor.abm.com and at the end of this presentation. 5 Questions and Answers |
| Third Quarter 2013 Review of Financial Results |
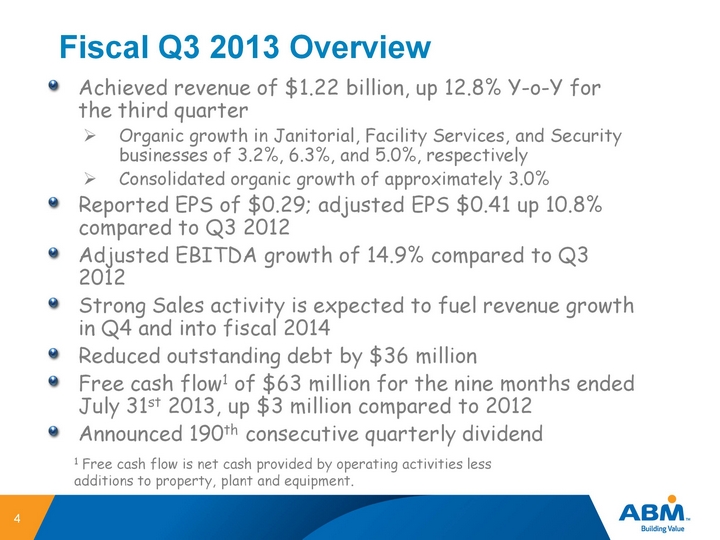
| Fiscal Q3 2013 Overview 4 Achieved revenue of $1.22 billion, up 12.8% Y-o-Y for the third quarter Organic growth in Janitorial, Facility Services, and Security businesses of 3.2%, 6.3%, and 5.0%, respectivelyConsolidated organic growth of approximately 3.0%Reported EPS of $0.29; adjusted EPS $0.41 up 10.8% compared to Q3 2012Adjusted EBITDA growth of 14.9% compared to Q3 2012Strong Sales activity is expected to fuel revenue growth in Q4 and into fiscal 2014Reduced outstanding debt by $36 millionFree cash flow1 of $63 million for the nine months ended July 31st 2013, up $3 million compared to 2012Announced 190th consecutive quarterly dividend 1 Free cash flow is net cash provided by operating activities less additions to property, plant and equipment. |
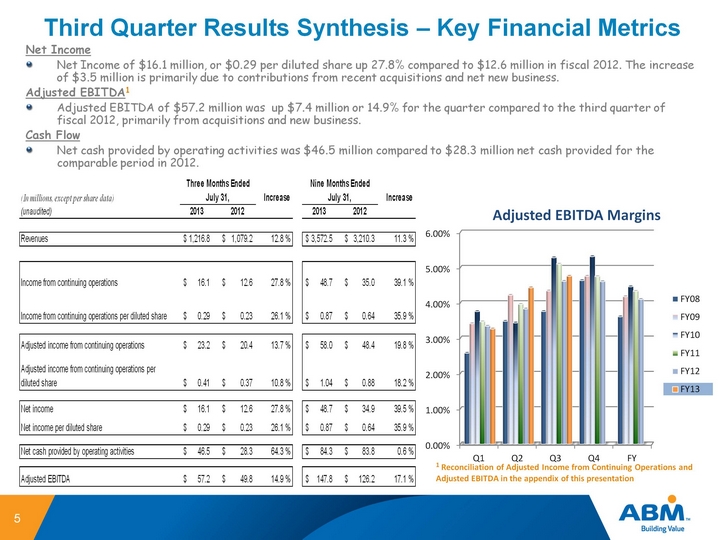
| Third Quarter Results Synthesis - Key Financial Metrics 5 Net Income Net Income of $16.1 million, or $0.29 per diluted share up 27.8% compared to $12.6 million in fiscal 2012. The increase of $3.5 million is primarily due to contributions from recent acquisitions and net new business.Adjusted EBITDA1Adjusted EBITDA of $57.2 million was up $7.4 million or 14.9% for the quarter compared to the third quarter of fiscal 2012, primarily from acquisitions and new business.Cash FlowNet cash provided by operating activities was $46.5 million compared to $28.3 million net cash provided for the comparable period in 2012. 1 Reconciliation of Adjusted Income from Continuing Operations and Adjusted EBITDA in the appendix of this presentation (CHART) |
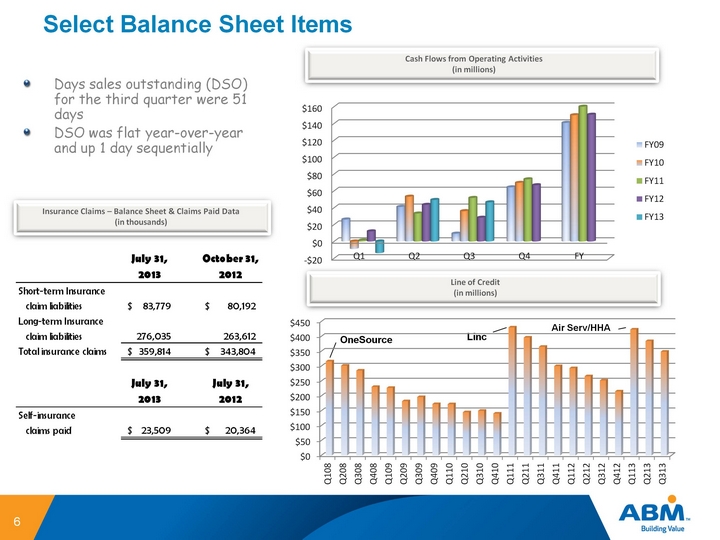
| Select Balance Sheet Items Cash Flows from Operating Activities(in millions) Days sales outstanding (DSO) for the third quarter were 51 daysDSO was flat year-over-year and up 1 day sequentially 6 Insurance Claims - Balance Sheet & Claims Paid Data(in thousands) Line of Credit(in millions) OneSource Linc Air Serv/HHA (CHART) (CHART) |
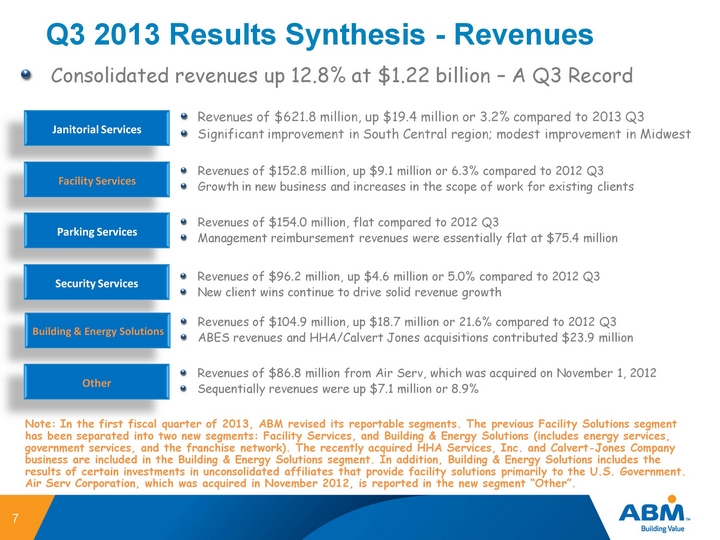
| Q3 2013 Results Synthesis - Revenues Revenues of $621.8 million, up $19.4 million or 3.2% compared to 2013 Q3Significant improvement in South Central region; modest improvement in Midwest Consolidated revenues up 12.8% at $1.22 billion - A Q3 Record Janitorial Services 7 Facility Services Parking Services Security Services Building & Energy Solutions Other Revenues of $152.8 million, up $9.1 million or 6.3% compared to 2012 Q3Growth in new business and increases in the scope of work for existing clients Revenues of $154.0 million, flat compared to 2012 Q3Management reimbursement revenues were essentially flat at $75.4 million Revenues of $96.2 million, up $4.6 million or 5.0% compared to 2012 Q3New client wins continue to drive solid revenue growth Revenues of $104.9 million, up $18.7 million or 21.6% compared to 2012 Q3ABES revenues and HHA/Calvert Jones acquisitions contributed $23.9 million Revenues of $86.8 million from Air Serv, which was acquired on November 1, 2012Sequentially revenues were up $7.1 million or 8.9% Note: In the first fiscal quarter of 2013, ABM revised its reportable segments. The previous Facility Solutions segment has been separated into two new segments: Facility Services, and Building & Energy Solutions (includes energy services, government services, and the franchise network). The recently acquired HHA Services, Inc. and Calvert-Jones Company business are included in the Building & Energy Solutions segment. In addition, Building & Energy Solutions includes the results of certain investments in unconsolidated affiliates that provide facility solutions primarily to the U.S. Government. Air Serv Corporation, which was acquired in November 2012, is reported in the new segment "Other". |
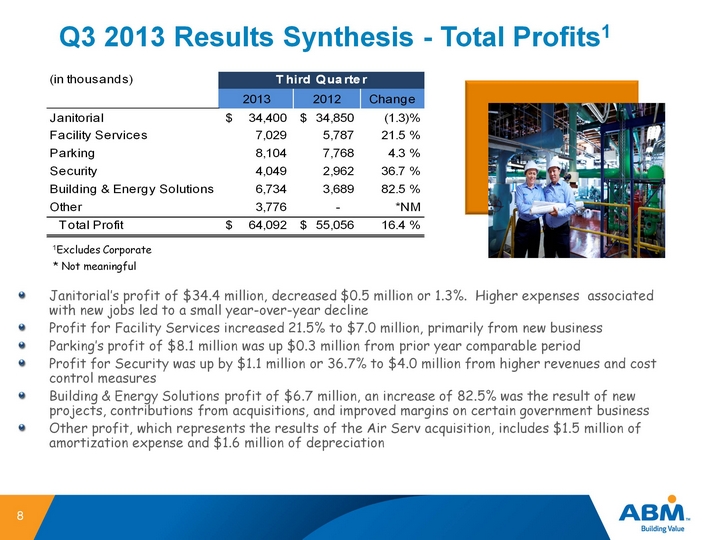
| Q3 2013 Results Synthesis - Total Profits1 Janitorial's profit of $34.4 million, decreased $0.5 million or 1.3%. Higher expenses associated with new jobs led to a small year-over-year decline Profit for Facility Services increased 21.5% to $7.0 million, primarily from new business Parking's profit of $8.1 million was up $0.3 million from prior year comparable periodProfit for Security was up by $1.1 million or 36.7% to $4.0 million from higher revenues and cost control measuresBuilding & Energy Solutions profit of $6.7 million, an increase of 82.5% was the result of new projects, contributions from acquisitions, and improved margins on certain government businessOther profit, which represents the results of the Air Serv acquisition, includes $1.5 million of amortization expense and $1.6 million of depreciation 1Excludes Corporate 8 * Not meaningful |
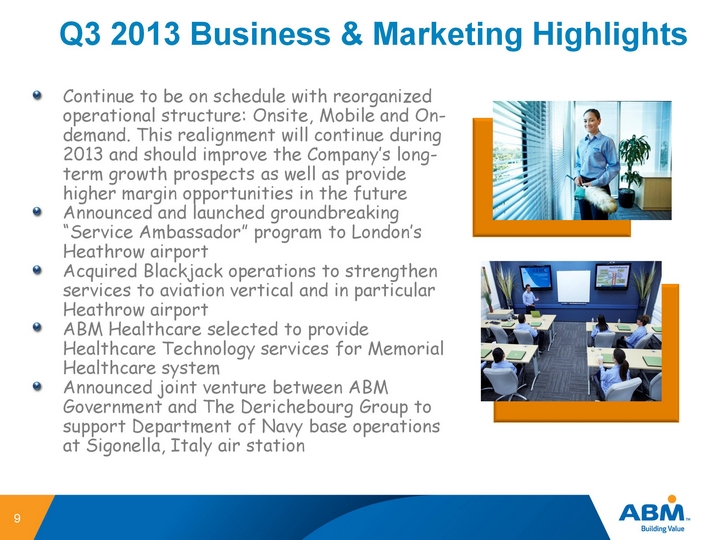
| Q3 2013 Business & Marketing Highlights Continue to be on schedule with reorganized operational structure: Onsite, Mobile and On- demand. This realignment will continue during 2013 and should improve the Company's long- term growth prospects as well as provide higher margin opportunities in the futureAnnounced and launched groundbreaking "Service Ambassador" program to London's Heathrow airportAcquired Blackjack operations to strengthen services to aviation vertical and in particular Heathrow airportABM Healthcare selected to provide Healthcare Technology services for Memorial Healthcare systemAnnounced joint venture between ABM Government and The Derichebourg Group to support Department of Navy base operations at Sigonella, Italy air station 9 |

| Outlook |
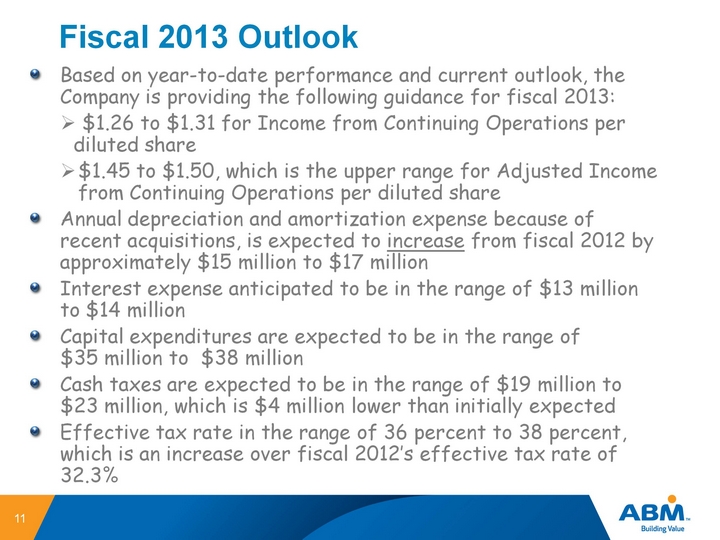
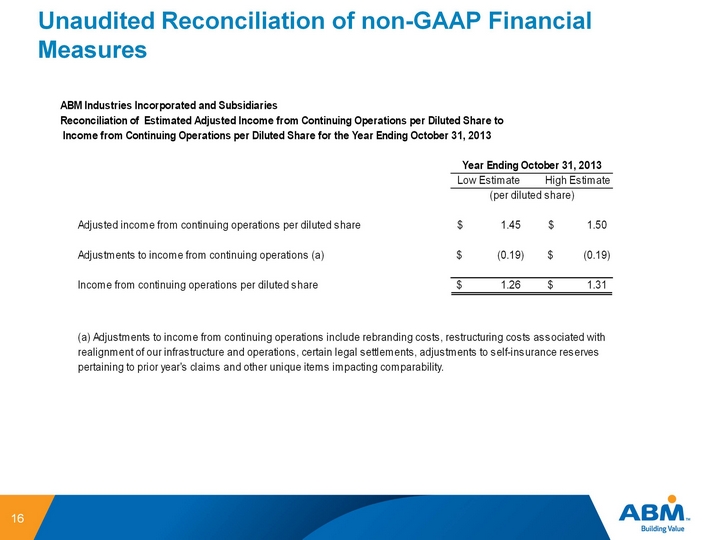
| Fiscal 2013 Outlook Based on year-to-date performance and current outlook, the Company is providing the following guidance for fiscal 2013: $1.26 to $1.31 for Income from Continuing Operations per diluted share$1.45 to $1.50, which is the upper range for Adjusted Income from Continuing Operations per diluted shareAnnual depreciation and amortization expense because of recent acquisitions, is expected to increase from fiscal 2012 by approximately $15 million to $17 millionInterest expense anticipated to be in the range of $13 million to $14 millionCapital expenditures are expected to be in the range of $35 million to $38 millionCash taxes are expected to be in the range of $19 million to $23 million, which is $4 million lower than initially expectedEffective tax rate in the range of 36 percent to 38 percent, which is an increase over fiscal 2012's effective tax rate of 32.3% 11 |
| Forward-Looking Statement 12 |
| Appendix - Unaudited Reconciliation of non-GAAP Financial Measures |
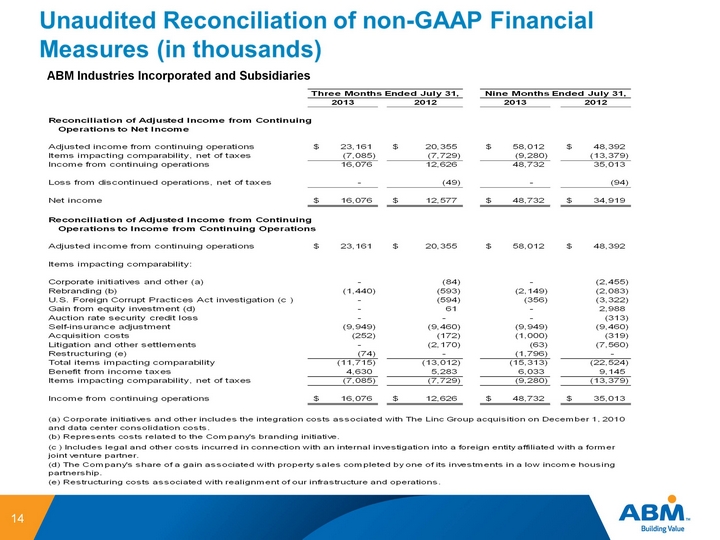
| 14 ABM Industries Incorporated and Subsidiaries |
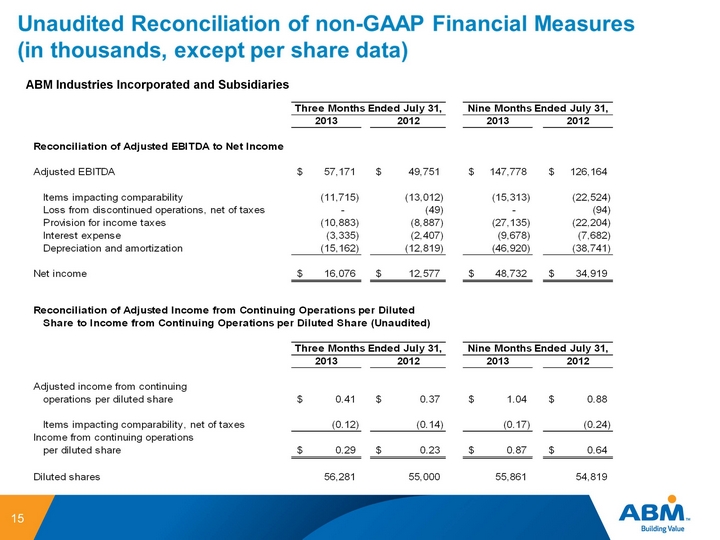
| 15 ABM Industries Incorporated and Subsidiaries |
| Unaudited Reconciliation of non-GAAP Financial Measures 16 |