UNITED STATES
SECURITIES AND EXCHANGE COMMISSION
Washington, DC 20549
FORM 8-K
CURRENT REPORT
Pursuant to Section 13 or 15(d) of the
Securities Exchange Act of 1934
Date of Report (Date of earliest event reported): September 3, 2013
MB FINANCIAL, INC.
(Exact name of registrant as specified in its charter)
|
Maryland |
|
0-24566-01 |
|
36-4460265 |
|
(State or other jurisdiction |
|
(Commission File No.) |
|
(IRS Employer |
|
800 West Madison Street, Chicago, Illinois |
|
60607 |
|
(Address of principal executive offices) |
|
(Zip Code) |
Registrant’s telephone number, including area code: (888) 422-6562
N/A
(Former name or former address, if changed since last report)
Check the appropriate box below if the Form 8-K filing is intended to simultaneously satisfy the filing obligation of the registrant under any of the following provisions (see General Instruction A.2. below):
o Written communications pursuant to Rule 425 under the Securities Act (17 CFR 230.425)
o Soliciting material pursuant to Rule 14a-12 under the Exchange Act (17 CFR 240.14a-12)
o Pre-commencement communications pursuant to Rule 14d-2(b) under the Exchange Act (17 CFR 240.14d-2(b))
o Pre-commencement communications pursuant to Rule 13e-4(c) under the Exchange Act (17 CFR 240.13e-4(c))
Item 7.01. Regulation FD Disclosure
Forward-Looking Statements
When used in this Current Report on Form 8-K and in other reports filed with or furnished to the Securities and Exchange Commission (the “SEC”), in press releases or other public stockholder communications, or in oral statements made with the approval of an authorized executive officer, the words or phrases “believe,” “will,” “should,” “will likely result,” “are expected to,” “will continue” “is anticipated,” “estimate,” “project,” “plans,” or similar expressions are intended to identify “forward-looking statements” within the meaning of the Private Securities Litigation Reform Act of 1995. You are cautioned not to place undue reliance on any forward-looking statements, which speak only as of the date made. These statements may relate to our future financial performance, strategic plans or objectives, revenues or earnings projections, or other financial items. By their nature, these statements are subject to numerous uncertainties that could cause actual results to differ materially from those anticipated in the statements.
Important factors that could cause actual results to differ materially from the results anticipated or projected include, but are not limited to, the following: (1) expected revenues, cost savings, synergies and other benefits from the pending merger of MB Financial, Inc. (“MB Financial”) and Taylor Capital Group, Inc. (“Taylor Capital”) and our other merger and acquisition activities might not be realized within the anticipated time frames or at all, and costs or difficulties relating to integration matters, including but not limited to customer and employee retention, might be greater than expected; (2) requisite stockholder and regulatory approvals for the MB Financial-Taylor Capital merger might not be obtained; (3) the possibility that the expected benefits of the FDIC-assisted and other transactions we previously completed will not be realized; (4) the credit risks of lending activities, including changes in the level and direction of loan delinquencies and write-offs and changes in estimates of the adequacy of the allowance for loan losses, which could necessitate additional provisions for loan losses, resulting both from loans we originate and loans we acquire from other financial institutions; (5) results of examinations by the Office of Comptroller of Currency, the Federal Reserve Board and other regulatory authorities, including the possibility that any such regulatory authority may, among other things, require us to increase our allowance for loan losses or write-down assets; (6) competitive pressures among depository institutions; (7) interest rate movements and their impact on customer behavior and net interest margin; (8) the impact of repricing and competitors’ pricing initiatives on loan and deposit products; (9) fluctuations in real estate values; (10) the ability to adapt successfully to technological changes to meet customers’ needs and developments in the market-place; (11) our ability to realize the residual values of our direct finance, leveraged, and operating leases; (12) our ability to access cost-effective funding; (13) changes in financial markets; (14) changes in economic conditions in general and in the Chicago metropolitan area in particular; (15) the costs, effects and outcomes of litigation; (16) new legislation or regulatory changes, including but not limited to the Dodd-Frank Wall Street Reform and Consumer Protection Act (the “Dodd-Frank Act”) and regulations adopted thereunder, changes in capital requirements pursuant to the Dodd-Frank Act and the implementation of the Basel III capital standards, other governmental initiatives affecting the financial services industry and changes in federal and/or state tax laws or interpretations thereof by taxing authorities; (17) changes in accounting principles, policies or guidelines; (18) our future acquisitions of other depository institutions or lines of business; and (19) future goodwill impairment due to changes in our business, changes in market conditions, or other factors.
MB Financial does not undertake any obligation to update any forward-looking statement to reflect circumstances or events that occur after the date on which the forward-looking statement is made.
Additional Information
MB Financial will file a registration statement on Form S-4 with the SEC in connection with the proposed MB Financial-Taylor Capital merger. The registration statement will include a joint proxy statement of MB Financial and Taylor Capital that also constitutes a prospectus of MB Financial, which will be sent to the stockholders of MB Financial and Taylor Capital. Stockholders are advised to read the joint proxy statement/prospectus when it becomes available because it will contain important information about MB Financial, Taylor Capital and the proposed transaction. When filed, this document and other documents relating to the merger filed by MB
Financial and Taylor Capital can be obtained free of charge from the SEC’s website at www.sec.gov. These documents also can be obtained free of charge by accessing MB Financial’s website at www.mbfinancial.com under the tab “Investor Relations” and then under “SEC Filings” or by accessing Taylor Capital’s website at www.taylorcapitalgroup.com under the tab “SEC Filings” and then under “Documents”. Alternatively, these documents, when available, can be obtained free of charge from MB Financial upon written request to MB Financial, Inc., Secretary, 6111 North River Road, Rosemont, Illinois 60018 or by calling (847) 653-1992, or from Taylor Capital, upon written request to Taylor Capital Group, Inc., Investor Relations, 9550 West Higgins Road, Rosemont, Illinois 60018 or by calling (847) 653-7978.
Participants in the Transaction
MB Financial, Taylor Capital and certain of their respective directors and executive officers may be deemed to be participants in the solicitation of proxies from stockholders in connection with the proposed transaction under the rules of the SEC. Information about these participants may be found in the definitive proxy statement of MB Financial relating to its 2013 Annual Meeting of Stockholders filed with the SEC by MB Financial on April 12, 2013 and the definitive proxy statement of Taylor Capital relating to its 2013 Annual Meeting of Stockholders filed with the SEC on April 24, 2013. These definitive proxy statements can be obtained free of charge from the sources indicated above. Additional information regarding the interests of these participants will also be included in the joint proxy statement/prospectus regarding the proposed transaction when it becomes available.
Set forth below are investor presentation materials.
|
|
September 2013 NASDAQ: MBFI Investor Presentation |

|
|
Forward-Looking Statements and Additional Information 1 Forward-Looking Statements When used in this presentation and in reports filed with or furnished to the Securities and Exchange Commission, in press releases or other public stockholder communications, or in oral statements made with the approval of an authorized executive officer, the words or phrases “believe,” “will,” “should,” “will likely result,” “are expected to,” “will continue” “is anticipated,” “estimate,” “project,” “plans,” or similar expressions are intended to identify “forward-looking statements” within the meaning of the Private Securities Litigation Reform Act of 1995. You are cautioned not to place undue reliance on any forward-looking statements, which speak only as of the date made. These statements may relate to our future financial performance, strategic plans or objectives, revenues or earnings projections, or other financial items. By their nature, these statements are subject to numerous uncertainties that could cause actual results to differ materially from those anticipated in the statements. Important factors that could cause actual results to differ materially from the results anticipated or projected include, but are not limited to, the following: (1) expected revenues, cost savings, synergies and other benefits from the pending MB Financial-Taylor Capital merger and our other merger and acquisition activities might not be realized within the anticipated time frames or at all, and costs or difficulties relating to integration matters, including but not limited to customer and employee retention, might be greater than expected; (2) requisite stockholder and regulatory approvals for the MB Financial-Taylor Capital merger might not be obtained; (3) the possibility that the expected benefits of the FDIC-assisted and other transactions we previously completed will not be realized; (4) the credit risks of lending activities, including changes in the level and direction of loan delinquencies and write-offs and changes in estimates of the adequacy of the allowance for loan losses, which could necessitate additional provisions for loan losses, resulting both from loans we originate and loans we acquire from other financial institutions; (5) results of examinations by the Office of Comptroller of Currency, the Federal Reserve Board and other regulatory authorities, including the possibility that any such regulatory authority may, among other things, require us to increase our allowance for loan losses or write-down assets; (6) competitive pressures among depository institutions; (7) interest rate movements and their impact on customer behavior and net interest margin; (8) the impact of repricing and competitors’ pricing initiatives on loan and deposit products; (9) fluctuations in real estate values; (10) the ability to adapt successfully to technological changes to meet customers’ needs and developments in the market-place; (11) our ability to realize the residual values of our direct finance, leveraged, and operating leases; (12) our ability to access cost-effective funding; (13) changes in financial markets; (14) changes in economic conditions in general and in the Chicago metropolitan area in particular; (15) the costs, effects and outcomes of litigation; (16) new legislation or regulatory changes, including but not limited to the Dodd-Frank Wall Street Reform and Consumer Protection Act (the “Dodd-Frank Act“) and regulations adopted thereunder, changes in capital requirements pursuant to the Dodd-Frank Act and the implementation of the Basel III capital standards, other governmental initiatives affecting the financial services industry and changes in federal and/or state tax laws or interpretations thereof by taxing authorities; (17) changes in accounting principles, policies or guidelines; (18) our future acquisitions of other depository institutions or lines of business; and (19) future goodwill impairment due to changes in our business, changes in market conditions, or other factors. We do not undertake any obligation to update any forward-looking statement to reflect circumstances or events that occur after the date on which the forward-looking statement is made. |
|
|
Forward-Looking Statements and Additional Information 2 Additional Information MB Financial will file a registration statement on Form S-4 with the SEC in connection with the proposed MB Financial-Taylor Capital merger. The registration statement will include a joint proxy statement of MB Financial and Taylor Capital that also constitutes a prospectus of MB Financial, which will be sent to the stockholders of MB Financial and Taylor Capital. Stockholders are advised to read the joint proxy statement/prospectus when it becomes available because it will contain important information about MB Financial, Taylor Capital and the proposed transaction. When filed, this document and other documents relating to the merger filed by MB Financial and Taylor Capital can be obtained free of charge from the SEC’s website at www.sec.gov. These documents also can be obtained free of charge by accessing MB Financial’s website at www.mbfinancial.com under the tab “Investor Relations” and then under “SEC Filings” or by accessing Taylor Capital’s website at www.taylorcapitalgroup.com under the tab “SEC Filings” and then under “Documents”. Alternatively, these documents, when available, can be obtained free of charge from MB Financial upon written request to MB Financial, Inc., Secretary, 6111 North River Road, Rosemont, Illinois 60018 or by calling (847) 653-1992, or from Taylor Capital, upon written request to Taylor Capital Group, Inc., Investor Relations, 9550 West Higgins Road, Rosemont, Illinois 60018 or by calling (847) 653-7978. Participants in the Transaction MB Financial, Taylor Capital and certain of their respective directors and executive officers may be deemed to be participants in the solicitation of proxies from stockholders in connection with the proposed transaction under the rules of the SEC. Information about these participants may be found in the definitive proxy statement of MB Financial relating to its 2013 Annual Meeting of Stockholders filed with the SEC by MB Financial on April 12, 2013 and the definitive proxy statement of Taylor Capital relating to its 2013 Annual Meeting of Stockholders filed with the SEC on April 24, 2013. These definitive proxy statements can be obtained free of charge from the sources indicated above. Additional information regarding the interests of these participants will also be included in the joint proxy statement/prospectus regarding the proposed transaction when it becomes available. |
|
|
Improved return on average assets (“ROA”) and net income: Strong fee income: Non-performing loans and non-performing assets stable Key positives for the quarter: Net interest margin increased 2 bps during the quarter, and net interest income was stable; Total loans excluding covered loans increased approximately $50 million during the quarter; Credit costs remain low and had OREO gains for the quarter; Core fee income remains strong - core fee revenues made up 35% of total revenues, and Expenses continue to be well controlled. Announced Taylor Capital Group, Inc. (“Taylor Capital”) acquisition. Expected to close in first half of 2014. Increased quarterly common dividend to $0.12 per share. Recent Company Highlights 3 2Q12 1Q13 2Q13 Change from 2Q12 to 2Q13 Change from 1Q13 to 2Q13 Non-performing loans to total loans 1.98% 2.00% 2.03% +0.05% +0.03% Non-performing assets to total assets 1.72% 1.56% 1.59% -0.13% +0.03% Net charge-offs (recoveries) to average loans 0.31% 0.25% -0.02% -0.33% -0.27% 2Q12 1Q13 2Q13 Change from 2Q12 to 2Q13 Change from 1Q13 to 2Q13 (dollars in thousands) Total core non-interest income 29,539 $ 38,221 $ 38,904 $ +31.70% +1.79% Core non-interest income to total revenues 27% 35% 35% +7.52% +0.45% 0.94% 1.07% 1.09% +0.15% +0.02% 11.28% 12.53% 12.31% +1.03% -0.22% $22,143 $24,906 $25,293 +14.23% +1.55% |
|
|
Company Strategy Build a bank with lower risk and consistently better returns than peers over the long term Develop balance sheet with superior profitability and lower risk Add great customers in our four business lines, whether they borrow or not Maintain low credit risk and low credit costs Attract low cost and stable funding Maintain strong liquidity and capital Focus intensely on fee income Fees need to be high quality, recurring, and profitable Not an easy task; requires meaningful investment Emphasize leasing, capital markets, international banking, cards, commercial deposit fees, treasury management, and trust and asset management Grow select fee businesses nationally (leasing, cards and treasury management) Invest in human talent Recruit and retain the best staff – very low turnover rate of “A” employees Maintain strong training programs – large commercial banker training program Be the employer of choice; Awards received – ranked in the top 10 among the large employer category in the Chicago Tribune's Top 100 Workplaces survey two years in a row, and ranked among best places to work in National Top Workplace Survey Make opportunistic acquisitions Skilled and disciplined acquirer Long track record of successful integrations 4 |
|
|
Lines of Business 5 Retail Banking Provides the majority of funding for commercial lending business; provides 58% of deposits and 16% of loans High percentage of core funding Low reliance on CDs Focuses on business banking customers and individuals that live or work near our branches Key fee initiatives include card services and treasury management services for business banking customers Wealth Management Provides customized private banking, trust, investment management, brokerage, and retirement plan services through a team of experienced advisors Specializes in serving business owners, high-net worth families, foundations, and endowments Focused on asset management, low-cost deposits, and private banking services Manages more than $2.9 billion of client assets through trust department and asset management subsidiary (Cedar Hill Associates, LLC) Commercial Banking Lending and depository services to middle-market companies with revenues ranging from $10 to $250mm “Relationship banking” culture; calling officers have 20+ years average experience Commercial and industrial and commercial real estate loan portfolio – terms generally range from 1 to 5 years; 98% with total relationship credit exposure of $25 million or less; approximately 57% have a floating rate of interest (69% indexed to LIBOR and 31% indexed to Prime) Key fee initiatives include treasury management, capital markets, international banking and cross-selling wealth management products Note: Business line financial data as of June 30, 2013 Leasing Lease banking – provides banking services to lessors located throughout the U.S.; lease and working capital loans and lease equity investments Lease loans totaled $1.4 billion at 6/30/13 Lease loans are underwritten primarily on the creditworthiness of the lessee Lessees include mostly investment grade “Fortune 1000” companies located throughout the U.S. and large middle-market companies Lease originations and related services – through our lease subsidiaries, LaSalle Systems Leasing, Inc. and Celtic Leasing Corp. Lease technology-related and material handling equipment to “Fortune 1000”, large middle-market companies, and healthcare providers located throughout the U.S. Specialize in selling third party equipment maintenance contracts to large companies |
|
|
Great Branch Footprint for Serving Business Customers 6 Chicago MSA – 84 branches Regularly optimize branch network (closed 1 branch in 2013, 3 branches in 2012 and 2 branches in 2011) Branches predominantly located in Cook and DuPage counties in the Chicago MSA where approximately 80% of middle-market companies are located Source: SNL Financial (11/2012) |
|
|
Composition of the Loan Portfolio – Favorable Mix Changes Improved loan mix over the last twelve months while total loan balances, excluding covered loans, increased 4% from June 30, 2012. C&I and lease loans increased as a percent of total portfolio from 40% to 46% from June 30, 2012 to June 30, 2013. Decreased emphasis on construction and commercial real estate loans; these categories went from 34% to 33% of the total portfolio. As expected, covered loans declined from a year ago. 7 (Dollars in millions) Balance Percent of Total Q2 Yield Balance Percent of Total Q2 Yield Change in Balance Commercial loans 1,079 $ 19% 4.77% 1,199 $ 21% 4.18% 11% Commercial loans collateralized by assignment of lease payments 1,221 21% 4.54% 1,423 25% 3.87% 17% Commercial real estate 1,795 31% 5.11% 1,711 30% 4.54% -5% Construction real estate 151 3% 3.98% 121 3% 3.76% -20% Residential real estate 313 5% 4.57% 306 5% 3.96% -2% Other consumer loans 611 11% 4.84% 599 11% 4.68% -2% Gross loans, excluding covered loans 5,170 90% 4.87% 5,359 95% 4.28% 4% Covered loans 553 10% 5.67% 309 5% 5.09% -44% Total loans 5,723 $ 100% 4.95% 5,668 $ 100% 4.33% -1% June 30, 2012 June 30, 2013 |
|
|
NPL Composition June 30, 2013 Asset Quality Statistics – Improvement Continues 8 Payment Status of NPLs Ratio 12/31/2009 12/31/2010 12/31/2011 12/31/2012 6/30/2012 6/30/2013 ALLL to total loans 2.71% 2.90% 2.13% 2.15% 2.13% 2.18% NPLs to total loans 4.16% 5.48% 2.17% 2.03% 1.98% 2.03% ALLL to non-performing loans 65.26% 53.03% 98.00% 106.17% 107.25% 107.32% Net charge-offs (recoveries) to average loans 3.09% 3.42% 2.90% (0.02%) 0.36% 0.12% At or For the Year Ended At or For the Six Months Ended |
|
|
Investment Securities Portfolio 9 Note: Includes available for sale and held to maturity securities as well as non-marketable securities (FRB and FHLB stock). Tax US Gov't Equivalent Balance maturing in (1) Agency MBS Municipals Corporate Equity (2) Total Yield Year 1 - $ 241 $ 43 $ - $ - $ 284 $ 1.42% Year 2 - 158 42 5 - 205 2.04% Year 3 - 111 64 8 - 184 3.16% Year 4 30 160 105 34 - 329 3.72% Year 5 121 73 134 - 329 3.47% Year 6 - 59 81 16 - 156 4.03% Year 7 - 20 57 - - 77 4.33% Year 8 - 11 177 - - 187 5.14% Year 9 - 8 179 - - 187 5.13% Year 10 - 4 53 - - 57 3.82% Over 10 Years - 10 8 5 61 85 4.01% Total Par 30 $ 902 $ 882 $ 202 $ 61 $ 2,078 $ 3.46% Estimated Fair Value 34 $ 970 $ 971 $ 215 $ 61 $ 2,251 $ Appreciation 2 $ 25 $ 18 $ (4) $ 0 $ 41 $ Duration (Years) 2.9 2.5 4.5 3.5 3.4 Tax Equivalent Yield 2.71% 1.83% 5.29% 2.75% 3.97% 3.46% (1) Includes maturities and estimated paydowns in the case of MBS. (2) Primarily consists of FHLB and FRB stock. Maturity/Paydown Analysis June 30, 2013 (Dollars in millions) |
|
|
Liquidity Ratios – Robust Liquidity (A) Total deposits (excluding brokered deposits) and customer repurchase agreements/Total deposits, customer repurchase agreements and other borrowings. 10 Strong liquidity Not reliant on non-core funding High lending capacity |
|
|
Low Cost Deposit Base – Improved Mix Deposit mix improved significantly over the last several years. Not reliant on wholesale funding. 11 Percent Percent Percent Percent Percent Amount of Total Amount of Total Amount of Total Amount of Total Amount of Total Noninterest bearing deposits 1,552 $ 18% 1,692 $ 21% 1,886 $ 25% 2,165 $ 29% 2,230 $ 30% Money market and NOW accounts 2,776 32% 2,776 34% 2,645 34% 2,747 36% 2,719 37% Savings accounts 584 7% 698 8% 754 10% 811 11% 846 11% 4,912 57% 5,166 63% 5,285 69% 5,723 76% 5,795 78% Certificates of deposit 3,243 37% 2,519 31% 1,926 25% 1,525 20% 1,358 18% Brokered deposit accounts 528 6% 468 6% 437 6% 294 4% 292 4% 3,771 43% 2,987 37% 2,363 31% 1,819 24% 1,650 22% 8,683 $ 100% 8,153 $ 100% 7,648 $ 100% 7,542 $ 100% 7,445 $ 100% Customer repurchase agreements 224 $ 28% 265 $ 37% 216 $ 34% 208 $ 43% 231 $ 52% Wholesale borrowings 381 46% 239 34% 220 34% 79 16% 63 14% Subordinated debt and junior subordinated notes issued to capital trusts 209 26% 209 29% 209 32% 202 41% 152 34% 814 $ 100% 713 $ 100% 645 $ 100% 489 $ 100% 446 $ 100% Total borrowings Total deposits Low cost deposits: Total low cost deposits Certificates of deposit: Total certificates of deposit Borrowings: 12/31/2010 12/31/2011 12/31/2012 (Dollars in millions) 6/30/2013 12/31/2009 |
|
|
Capital Composition 6/30/2013 12 Simple capital structure. Dominated by common equity. |
|
|
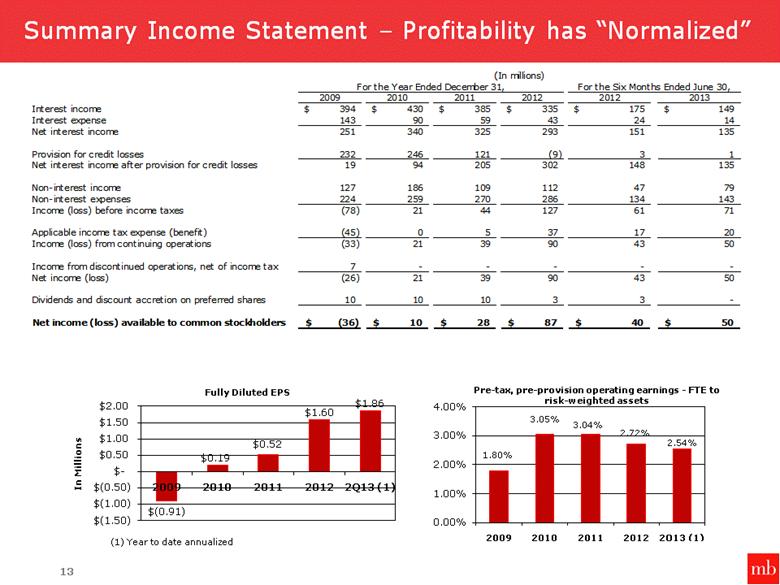
Summary Income Statement – Profitability has “Normalized” 13 (1) Year to date annualized 2009 2010 2011 2012 2012 2013 Interest income 394 $ 430 $ 385 $ 335 $ 175 $ 149 $ Interest expense 143 90 59 43 24 14 Net interest income 251 340 325 293 151 135 Provision for credit losses 232 246 121 (9) 3 1 Net interest income after provision for credit losses 19 94 205 302 148 135 Non-interest income 127 186 109 112 47 79 Non-interest expenses 224 259 270 286 134 143 Income (loss) before income taxes (78) 21 44 127 61 71 Applicable income tax expense (benefit) (45) 0 5 37 17 20 Income (loss) from continuing operations (33) 21 39 90 43 50 Income from discontinued operations, net of income tax 7 - - - - - Net income (loss) (26) 21 39 90 43 50 Dividends and discount accretion on preferred shares 10 10 10 3 3 - Net income (loss) available to common stockholders (36) $ 10 $ 28 $ 87 $ 40 $ 50 $ For the Year Ended December 31, For the Six Months Ended June 30, (In millions) |
|
|
Performance Ratios – Reflects Improving Operations 14 (1) Year to date annualized (2) Quarter to date annualized |
|
|
Key Fee Initiatives – Becoming More Meaningful 15 Capital markets fees Team built in first quarter of 2012 Includes fees for the following services: derivatives and interest rate risk solutions, capital solutions, merger and acquisition advisory and real estate debt placement International banking fees Team built two years ago Includes fees for the following services: trade services (letters of credit), export trade finance, and foreign exchange Commercial deposit and treasury management fees Includes fees for the following services: account management, payments systems access, information management, and fraud and risk mitigation Expanding nationally where we have expertise Lease financing Includes fees related to equipment leases as well as selling third party equipment maintenance contracts Trust and asset management fees Wealth management solutions for individuals, corporations and not-for-profits Includes fees for the following services: investment management, custody, personal trust, financial planning, and wealth advisory services for high net worth individuals Card fees Expanded into prepaid and credit cards in 2012 Includes fees for debit, credit, prepaid, incentive and gift cards 2009 2010 2011 2012 2012 2013 Key fee initiatives: Capital markets and international banking fees 502 $ 344 $ 1,870 $ $ 5,086 $ $ 1,300 $ 1,747 $ Commercial deposit and treasury management fees 16,545 21,806 23,559 23,636 11,682 11,995 Lease financing, net 18,528 21,853 26,939 36,382 14,292 31,365 Trust and asset management fees 12,593 15,037 17,324 17,990 8,939 9,368 Card fees 4,558 7,057 7,032 9,368 4,473 5,430 Total key fee initiatives 52,726 $ 66,097 $ 76,724 $ 92,462 $ 40,686 $ 59,905 $ (In Thousands) Year Ended December 31, June 30, Six Months Ended |
|
|
Market Leading Operating Performance 16 Source: Company filings, SNL Financial Note: Chicago peers consist of public banks headquartered in Chicago MSA with assets between $2.0bn and $16.6bn at June 30, 2013 and include: First Midwest, Old Second, PrivateBancorp, Taylor Capital, Wintrust Net non-interest expense / average assets (%) Core non-interest income / revenues - FTE (%) Asset yields - FTE (%) Pre-tax, pre-provision operating earnings - FTE / risk-weighted assets (%) Cost of funds (%) MBFI Chicago Peers Median Net interest margin - FTE (%) 16 (1) Year to date annualized 25 25 27 29 35 25 23 24 29 33 2009 2010 2011 2012 2Q13 4.59 4.82 4.59 4.24 3.95 4.82 4.54 4.23 3.92 5.00 2009 2010 2011 2012 2Q13 (1) 1.67 0.70 0.52 0.36 1.73 1.13 0.90 0.66 0.56 0.99 2009 2010 2011 2012 2Q13 (1) 2.97 3.90 3.73 3.60 3.83 3.32 3.46 3.52 3.51 3.04 2009 2010 2011 2012 2Q13 (1) |
|
|
Stronger Capital Than Local Peers 17 Source: Company filings, SNL Financial Note: Chicago peers consist of median data for public banks headquartered in Chicago MSA with assets between $2.0bn and $16.6bn at June 30, 2013 and include: First Midwest, Old Second, PrivateBancorp, Taylor Capital, Wintrust. TCE / TA (%) Tier I Capital Ratio (%) Total Risk-Based Capital Ratio (%) TCE / RWA (%) MBFI Chicago Peers Median 6.2 7.5 8.4 9.1 9.6 5.5 7.3 7.6 7.6 7.9 2009 2010 2011 2012 2Q13 8.8 10.9 12.5 13.1 13.2 6.5 8.8 9.0 8.9 9.0 2009 2010 2011 2012 2Q13 15.5 17.8 19.4 16.6 16.5 13.6 14.0 14.0 13.4 14.2 2009 2010 2011 2012 2Q13 13.5 15.8 17.3 14.7 15.2 11.4 12.3 11.7 11.2 11.5 2009 2010 2011 2012 2Q13 |
|
|
18 Source: Company filings, SNL Financial Note: Chicago peers consist of median data for public banks headquartered in Chicago MSA with assets between $2.0bn and $16.6bn at June 30, 2013 and include: First Midwest, Old Second, PrivateBancorp, Taylor Capital, Wintrust. NPAs / Assets (%) Reserves/Loans (%) Reserves / NPLs (%) Credit Metrics Similar to Local Peers Reserves / Loans (%) NPLs / Loans (%) MBFI Chicago Peers Median 2.84 4.21 2.12 1.62 1.59 3.72 3.93 2.93 1.59 1.55 2009 2010 2011 2012 2Q13 65 53 98 106 107 62 63 82 106 104 2009 2010 2011 2012 2Q13 2.71 2.90 2.13 2.15 2.18 2.71 2.75 2.18 2.00 1.95 2009 2010 2011 2012 2Q13 4.16 5.48 2.17 2.03 2.03 4.41 4.55 3.05 1.80 1.87 2009 2010 2011 2012 2Q13 |
|
|
Valuable Position in the Chicago MSA Rank Institution Branches Total deposits in market ($mm) Total market share (%) 1 JPMorgan Chase 441 70,527 22.5 2 BMO Financial Group 228 36,303 11.6 3 Bank of America 172 22,992 7.3 4 Northern Trust 11 22,185 7.1 5 Wintrust Financial 116 13,513 4.2 6 PNC Financial Services 152 11,714 3.7 7 Fifth Third 180 11,000 3.5 8 MB Financial, Post Taylor1 95 11,138 3.4 8 Citigroup 74 10,542 3.4 9 PrivateBancorp 20 9,176 2.9 10 MB Financial1 84 7,445 2.4 11 US Bancorp 89 6,254 2.0 12 First Midwest 83 6,070 1.9 13 Royal Bank of Scotland 105 5,459 1.7 14 Wells Fargo 9 4,600 1.5 15 TCF Financial 199 3,938 1.3 All other institutions 1,199 72,035 23.0 MSA Total 3,162 313,753 100.0 Rank Institution Branches Total deposits in market ($mm) Total market share (%) 1 JPMorgan Chase 326 38,407 16.0 2 ABN Amro (LaSalle Bank) 140 30,957 12.9 3 Harris (Bank of Montreal) 192 23,237 9.7 4 Northern Trust 18 8,461 3.5 5 Fifth Third 123 8,052 3.4 6 Royal Bank of Scotland 136 6,446 2.7 7 Wintrust Financial 55 6,019 2.5 8 Corus Bankshares 14 5,500 2.3 9 Citigroup 51 5,441 2.3 10 MAF Bancorp 49 4,904 2.0 11 National City 59 4,528 1.9 12 First Midwest 56 4,488 1.9 13 Bank of America 31 4,159 1.7 14 MB Financial 39 3,770 1.6 15 FBOP Corp 25 2,824 1.2 All other institutions 1,686 82,474 34.4 MSA Total 3,000 239,667 100.0 Current Chicago MSA Rankings 2005 Chicago MSA Rankings Source: SNL Financial Note: Data as of June 30, 2012 reflects announced acquisitions post June 30, 2012 1 Deposits as of 6/30/2013 19 |
|
|
Market Share of Top Banks in 10 Largest U.S. MSAs 20 Market share of top 10 banks in 10 largest U.S. MSAs Market share of top 3 banks in 10 largest U.S. MSAs Source: SNL Financial as 6/30/2012 |
|
|
21 Skilled Acquirer Skilled acquirer of both depository and non-depository entities Sixteen acquisitions since 2000 Disciplined financial analyses focused on: Internal rates of return Returns on invested capital Long-term per share earnings accretion Long track record of successful and rapid employee, customer and systems integrations Ability to manage multiple integrations simultaneously Branch network size and location makes acquired branch consolidations more likely to result in enhanced expense savings opportunities Company culture suited for acquisitions |
|
|
22 2001 2002 2004 2006 2008 2004 First SecurityFed Financial (Chicago, IL) January 9, 2004 2002 South Holland Bancorp (South Holland, IL) November 1, 2002 LaSalle Systems Leasing, Inc. July 22, 2002 2006 First Oak Brook Bancshares (Oak Brook, IL) May 1, 2006 2009 Heritage Community Bank (Glenwood, IL) February 27, 2009 InBank (Oak Forest IL) September 4, 2009 Corus Bank (Chicago, IL) September 11, 2009 Benchmark Bank (Aurora, IL) December 4, 2009 Source: Company filings Note: Transaction dates indicate announcement date 2008 Cedar Hill Associates, LLC (Chicago, IL) April 18, 2008 Track Record of Being a Disciplined Acquirer and Experienced Integrator 2009 2010 2010 Broadway Bank (Chicago, IL) April 23, 2010 New Century Bank (Chicago, IL) April 23, 2010 2001 FSL Holdings, Inc. (South Holland, IL) February 8, 2001 MidCity Financial (Chicago, IL) April 19, 2001 First Lincolnwood (Lincolnwood, IL) December 27, 2001 2012 2012 Celtic Leasing Corp. (Irvine, CA) December 28, 2012 2003 2005 2007 2011 2013 2014 Taylor Capital Group, Inc. (Rosemont, IL) Expected to close in first half of 2014 2014 |
|
|
Taylor Capital Acquisition – Combination of complementary commercial banks with similar business models Strategically attractive combination Financially compelling, high-return, low-risk opportunity Two leading Chicago commercial banks merging to better serve the metropolitan community: $14.9bn assets, $9.0bn gross loans, and $11.1bn deposits Complementary commercial customer bases with shared lending philosophies Nearly doubles middle-market commercial banking market share Attractive national businesses Increased presence in attractive Cook county (top 5 pro forma) Combined management team with strong Chicago roots Allows MB Financial to deploy excess capital in an attractive manner: 15%+ EPS accretion with fully phased-in synergies, 3.5 years tangible book value per share earnback, and 15%+ IRR Maintain strong capital position with 8%+ tangible common equity ratio Compelling returns with pro-forma profitability significantly above peer median Achievable cost savings estimated at 30% of Taylor’s core operating expenses, excluding the mortgage business line Management team with significant merger integration experience Mortgage business provides a potential additional fee revenue source for MB Financial 23 |
|
|
Combination with Taylor Capital meets previously stated strategic priorities Build a bank with lower risk and consistently better returns than peers over the long-term Develop balance sheet with superior profitability and lower risk Focus intensely on fee income Invest in human talent Make opportunistic acquisitions Meaningfully improves ROA and ROATCE Deploys excess capital and improves strategic flexibility Further diversifies revenue stream and asset generation capabilities Effectively utilizes balance sheet liquidity to fund commercial loan growth Diversifies loan portfolio into new asset classes Provides opportunities to cross-sell fee income products Mortgage business provides another source of fee income Adds depth and additional capabilities to commercial banking Brings expertise in other areas, including asset-based lending Transaction solidifies MB Financial’s market position in Chicago Significantly increases scarcity value – largest independent bank in Chicago MSA by market capitalization 24 |
|
|
Leasing Appendix 25 |
|
|
Components of our Leasing Business Lease Banking Our lease banking group provides banking services to equipment lessors located throughout the U.S. Debt financing Working capital financing Partners with customers on equity/residual investments in leases Treasury management services Debt financing (Lease Loans) are non-recourse loans to lessors, collateralized by leased equipment and underwritten based on the financial wherewithal of each lessee. Lessees generally consist of investment grade Fortune 1000, large middle-market, and health care companies located throughout the U.S. No residual risk on Lease Loans funded with third parties. Most loans fully amortize over periods ranging from 30 to 60 months. Credit experience has been stellar. Non-performing loans and charge-offs have been minimal for more than 10 years. Lease Loans outstanding totaled $1.4 billion at 6/30/2013. Revenues from Lease Loans and working capital financing are reflected in interest income. 26 |
|
|
Components of our Leasing Business (Continued) Lease Originations Leases are originated directly through our LaSalle and Celtic subsidiaries ($75 to $100 million per year per company). Leased equipment generally consists of technology-related and material handling equipment. Direct Finance and Leverage Leases are grouped with Lease Loans on the balance sheet. Operating Leases are reflected in the Other Assets section of the balance sheet under the heading Lease Investments, Net. Lessors generally finance much of their equipment cost with debt (85% to 95% of original equipment cost). The amount of debt available is based on the present value of future lease payments discounted at prevailing market interest rates. The portion of the equipment cost not funded with debt represents the equity or residual investment in the lease. Our residual investments in equipment leases totaled $74 million at 6/30/2013. Residual income is accreted over the life of the lease so that at the end of the lease term the accreted residual amount approximates the fair value of the leased equipment. 27 |
|
|
Lease Originations (continued) Interest income on Direct Finance and Leverage Leases and accreted residual income on Direct Finance and Leverage Leases are included in Interest Income. Lease payments on Operating Leases plus residual income that is accreted on Operating Leases less depreciation on equipment underlying Operating Leases are included in Lease Financing Fee Income. At the end of a lease term the lease may be renewed, extended on a month-to-month basis, or the equipment may be returned and sold. Proceeds received as a result of lease renewals and equipment sales less the residual investment in a lease results in a gain or loss that is reflected in Lease Financing Fee Income. Other leasing related services included in Lease Financing Fee Income We broker maintenance contracts sold by equipment manufacturers to our customers covering equipment leased from MB as well as other equipment owned or leased by our clients. Equipment manufacturers are responsible for completing any maintenance covered by a maintenance contract. Maintenance contract revenue is presented net of the related cost of sales paid to the third party provider. Components of our Leasing Business (Continued) 28 |
|
|
Interest income includes: Interest income on Lease Loans Interest income on Direct Finance Leases Interest income on Leverage Leases, less related funding cost Residual accretion on Direct Finance and Leverage Leases Lease financing fee income includes: Rental payments on Operating Leases Depreciation expense on Operating Leases Residual accretion on Operating Leases Gains or losses on residuals Interim rent Equipment maintenance contract revenue, less related cost of sales Vendor promotional revenue related to equipment maintenance contracts Income Statement Geography 29 |
|
|
Non-GAAP Disclosure Appendix 30 |

|
|
Non-GAAP Disclosure Reconciliations This presentation contains certain financial information determined by methods other than in accordance with accounting principles generally accepted in the United States of America (GAAP). These measures include net interest margin on a fully tax equivalent basis; core non-interest income; ratio of core non-interest income to total revenue on a fully tax equivalent basis, ratio of net non-interest expense to average assets and ratio of pre-tax, pre-provision operating earnings on a fully tax equivalent basis to risk-weighted assets, with net gains and losses on investment securities, net gains on sale of other assets, net gain on sale of loans held for sale, net gains and losses on other real estate owned, acquisition related gains and increase (decrease) in market value of assets held in trust for deferred compensation excluded from the calculations of the non-interest income, core non-interest income and pre-tax, pre-provision operating earnings components of these ratios, and the FDIC special assessment expense, impairment charges, prepayment fees on interest-bearing liabilities and increase (decrease) in market value of assets held in trust for deferred compensation excluded from the non-interest expense components of the ratios of net non-interest expense to average assets and pretax, pre-provision operating earnings, on a fully tax equivalent basis to risk-weighted assets with tax equivalent adjustments for tax-exempt interest income and increase in cash surrender value of life insurance, as applicable; ratios of tangible common equity to risk weighted assets and tangible common equity to tangible assets; core funding to total funding; and cash return on average tangible common equity (net cash flow available to common stockholders divided by average tangible common equity). Our management uses these non-GAAP measures, together with the related GAAP measures, in its analysis of our performance and in making business decisions. Management also uses these measures for peer comparisons. The tax equivalent adjustments to net interest margin, pre-tax, pre-provision operating earnings, non-interest income and total revenue recognizes the income tax savings when comparing taxable and tax-exempt assets and assumes a 35% tax rate. Management believes that others within the banking industry present these measures on a fully tax equivalent basis, and accordingly believes that providing these measures may be useful for peer comparison purposes. For the same reasons, management believes the tax equivalent adjustments for tax-exempt interest income and increase in cash surrender value of life insurance are useful. Management believes that pre-tax, pre-provision operating earnings are a useful measure in assessing our operating performance, particularly during times of economic stress. In recent periods, our results of operations have been negatively impacted by adverse economic conditions, as seen in our elevated levels of loan charge-offs and provision for credit losses. Management believes that measuring earnings before the impact of the provision for credit losses makes our financial data more comparable between reporting periods so that investors can better understand our operating performance trends. Management also believes that this is a standard figure used in the banking industry to measure performance. Management believes that core and non-core non-interest income and expense are useful in assessing our operating performance and in understanding the primary drivers of our non-interest income and expense when comparing periods. Management, likewise, believes that presenting the ratio of core funding to total funding is useful in understanding our funding sources when comparing periods. 31 |
|
|
Non-GAAP Disclosure Reconciliations (Continued) Management also believes that by excluding net gains on investment securities, net gains and losses on sale of other assets, net gain on sale of loans held for sale, net gains and losses on other real estate owned, acquisition related gains and increase (decrease) in market value of assets held in trust for deferred compensation from the other (non-interest) income components and excluding the FDIC special assessment expense, impairment charges, prepayment fees on interest-bearing liabilities and increase (decrease) in market value of assets held in trust for deferred compensation from the other (non-interest) expense components of the ratios of net non-interest expense to average assets and pre-tax, pre-provision operating earnings on a fully tax equivalent basis to risk-weighted assets and, in the case of the income-related items, the ratio of core non-interest income to total revenue on a fully tax equivalent basis, this information better reflects our operating performance, as the excluded items do not pertain to our core business operations and their exclusion makes this information more meaningful when comparing our operating results from period to period. The ratios of tangible common equity to tangible assets and tangible common equity to risk-weighted assets exclude goodwill and other intangible assets, net of tax benefits, in determining tangible assets and tangible common equity. Management believes that the presentation of these measures excluding the impact of such items provides useful supplemental information that is helpful in understanding our financial results, as they provide a method to assess management’s success in utilizing our tangible capital as well as our capital strength. Management also believes that providing measures that exclude balances of goodwill and other intangible assets, which are subjective components of valuation, facilitates the comparison of our performance with the performance of our peers. In addition, management believes that these are standard financial measures used in the banking industry to evaluate performance. The non-GAAP disclosures contained herein should not be viewed as substitutes for the results determined to be in accordance with GAAP, nor are they necessarily comparable to non-GAAP performance measures that may be presented by other companies. The following table reconciles net interest margin on a fully tax equivalent basis to net interest margin for the periods presented: 32 Three Months Six Months Net interest margin Ended Ended June 30, June 30, 2009 2010 2011 2012 2013 (1) 2013 (1) Net interest margin 2.85% 3.72% 3.75% 3.49% 3.33% 3.33% Plus: tax equivalent effect 0.12% 0.11% 0.15% 0.24% 0.28% 0.27% Net interest margin, fully tax equivalent 2.97% 3.83% 3.90% 3.73% 3.61% 3.60% (1) Annualized |
|
|
Non-GAAP Disclosure Reconciliations (Continued) The following table presents a reconciliation of tangible common equity to common stockholders’ equity (in thousands): 33 The following table presents a reconciliation of average tangible common equity to average common stockholders’ equity (in thousands): The following table presents a reconciliation of net cash flow available to common stockholders to net income available to common stockholders (in thousands): $ 855,532 $ 833,218 $ 792,068 $ 740,760 $ 646,079 Tangible common equity 17,180 19,183 19,171 22,853 24,510 Less: other intangible, net of tax benefit 423,369 423,369 387,069 387,069 387,069 Less: goodwill $ 1,296,081 $ 1,275,770 $ 1,198,308 $ 1,150,682 $ 1,057,658 Common stockholders' equity - as reported 2013 2012 2011 2010 2009 June 30, December 31, $ 52,203 $ 26,293 $ 25,910 $ 22,956 $ 90,362 $ 31,996 $ 14,185 $ (33,505) Net cash flow available to common stockholders 2,004 1,000 1,004 813 3,257 3,682 4,039 2,919 net of tax Add: other intangible amortization expense, $ 50,199 $ 25,293 $ 24,906 $ 22,143 $ 87,105 $ 28,314 $ 10,146 $ (36,424) - as reported Net income available to common stockholders 2013 2013 2013 2012 2012 2011 2010 2009 June 30, June 30, March 31, June 30, Ended Three Months Ended Six Months $ 847,712 $ 856,390 $ 838,941 $ 818,695 $ 831,147 $ 756,382 $ 724,966 $ 526,469 Average tangible common equity 18,106 17,605 18,611 17,903 17,465 20,865 23,154 18,971 Less: other intangible, net of tax benefit 423,369 423,369 423,369 387,069 387,168 387,069 387,069 387,069 Less: goodwill $ 1,289,187 $ 1,297,364 $ 1,280,921 $ 1,223,667 $1,235,780 $1,164,316 $1,135,189 $ 932,509 - as reported Average common stockholders' equity 2013 2013 2013 2012 2012 2011 2010 2009 June 30, June 30, March 31, June 30, Ended Three Months Ended Six Months |
|
|
Non-GAAP Disclosure Reconciliations (Continued) The following table presents a reconciliation of tangible assets to total assets (in thousands): 34 $ 8,929,110 $ 9,129,253 $ 9,426,832 $ 9,910,442 $ 10,453,814 Tangible assets 17,180 19,183 19,171 22,853 24,510 Less: other intangible, net of tax benefit 423,369 423,369 387,069 387,069 387,069 Less: goodwill $ 9,369,659 $ 9,571,805 $ 9,833,072 $ 10,320,364 $ 10,865,393 Total assets - as reported 2013 2012 2011 2010 2009 June 30, December 31, |
|
|
Non-GAAP Disclosure Reconciliations (Continued) 35 Net Non-interest Expense to Average Assets Calculation (in thousands) Six Months Ended June 30, 2009 2010 2011 2012 2013 Non-interest expense 223,750 $ 258,776 $ 269,633 $ 286,436 $ 143,367 $ Adjustment for FDIC special assessment 3,850 - - - - Adjustment for prepayment fees on interest bearing liabilities - - - 12,682 - Adjustment for impairment charges 4,000 - 1,594 2,190 - Adjustment for increase (decrease) in market value of assets held in trust for deferred compensation 710 562 (40) 811 504 Non-interest expense - as adjusted 215,190 258,214 268,079 270,753 142,863 Non-interest income 127,154 185,756 109,106 111,599 79,327 Less net gains on investment securities 14,029 18,648 640 555 13 Less net (losses) gains on sale of other assets (13) 630 283 (942) - Less net gain on sale of loans held for sale - - 1,790 - - Less net (losses) gains on other real estate owned (429) (9,284) (13,613) (17,594) 1,685 Less acquisition related gains 28,547 62,649 - - - Less increase (decrease) in market value of assets held in trust for deferred compensation 710 562 (40) 811 504 Non-interest income - as adjusted 84,310 112,551 120,046 128,769 77,125 Less tax equivalent adjustment on the increase in cash surrender value of life insurance 1,324 1,893 2,357 1,922 908 Net non-interest expense 129,556 $ 143,770 $ 145,676 $ 140,062 $ 64,830 $ Average assets 9,777,288 $ 10,506,028 $ 9,956,133 $ 9,547,985 $ 9,369,042 $ Net non-interest expense to average assets 1.33% 1.37% 1.46% 1.47% 1.40% |
|
|
Non-GAAP Disclosure Reconciliations (Continued) 36 Pre-Tax, Pre-Provision Operating Earnings (in thousands) Six Months Ended June 30, 2009 2010 2011 2012 2013 (Loss) income before income taxes (77,844) $ 20,552 $ 43,996 $ 126,851 $ 70,625 $ Provision for credit losses 231,800 246,200 120,750 (8,900) 500 Pre-tax, pre-provision earnings 153,956 266,752 164,746 117,951 71,125 Tax equivalent adjustment on tax-exempt interest income 10,625 10,458 13,188 20,429 11,149 1,324 1,893 2,357 1,922 908 Pre-tax, pre-provision earnings on a fully tax equivalent basis 165,905 279,103 180,291 140,302 83,182 Non-core non-interest income Net (losses) gains on other real estate owned (429) (9,284) (13,613) (17,594) 1,685 Net gains on investment securities 14,029 18,648 640 555 13 Net (loss) gain on sale of other assets (13) 630 283 (942) - Net gain on sale of loans held for sale - - 1,790 - - Acquisition related gains 28,547 62,649 - - - Increase (decrease) in market value of assets held in trust for deferred compensation 710 562 (40) 811 504 Total non-core non-interest income 42,844 73,205 (10,940) (17,170) 2,202 Non-core non-interest expense FDIC special assessment 3,850 - - - - Prepayment fees on interest bearing liabilities - - - 12,682 - Impairment charges 4,000 - 1,594 2,190 - Increase (decrease) in market value of assets held in trust for deferred compensation 710 562 (40) 811 504 Total non-core non-interest expense 8,560 562 1,554 15,683 504 Pre-tax, pre-provision operating earnings 131,621 $ 206,460 $ 192,785 $ 173,155 $ 81,484 $ Risk-weighted assets 7,315,255 $ 6,772,762 $ 6,345,357 $ 6,373,564 $ 6,465,482 $ Annualized pre-tax, pre-provision operating earnings to risk-weighted assets 1.80% 3.05% 3.04% 2.72% 2.55% Tax equivalent adjustment on the increase in cash surrender value of life insurance |
|
|
Non-GAAP Disclosure Reconciliations (Continued) 37 Total revenue, fully tax equivalent reconciliation (in thousands) Six Months Ended June 30, March 31, June 30, June 30, 2009 2010 2011 2012 2012 2013 2013 2013 Net interest income 250,552 $ 339,772 $ 325,273 $ 292,788 $ 74,104 $ 67,685 $ 67,480 $ 135,165 $ Plus: tax equivalent effect 10,625 10,458 13,188 20,429 5,057 5,555 5,594 11,149 Net interest income, fully tax equivalent 261,177 350,230 338,461 313,217 79,161 73,240 73,074 146,314 Core non-interest income 84,310 112,551 120,046 128,769 29,539 38,221 38,904 77,125 Plus: tax equivalent adjustment on the increase in cash surrender value of life insurance 1,324 1,893 2,357 1,922 468 454 454 908 Total revenues, fully tax equivalent 346,811 $ 464,674 $ 460,864 $ 443,908 $ 109,168 $ 111,915 $ 112,432 $ 224,347 $ Core non-interest income to revenues, fully tax equivalent 25% 25% 27% 29% 27% 35% 35% 34.78% Three Months Ended 2009 2010 2011 2012 June 30, 2012 March 31, 2013 June 30, 2013 Three Months Ended Six Months Ended June 30, 2013 $127,154 $185,756 $109,106 $111,599 $23,907 $38,373 $40,954 $79,327 14,029 18,648 640 555 (34) (1) 14 13 (13) 630 283 (942) (8) - - - - - 1,790 - - - - (429) (9,284) (13,613) (17,594) (5,441) (330) 2,015 1,685 28,547 62,649 - - - - - - 710 562 (40) 811 (149) 483 21 504 84,310 112,551 120,046 128,769 29,539 38,221 38,904 77,125 1,324 1,893 2,357 1,922 468 454 454 908 $85,634 $114,444 $122,403 $130,691 $30,007 $38,675 $39,358 $78,033 Non-interest income Less net gains on investment securities Less net (losses) gains on sale of other assets Less net gain on sale of loans held for sale Less net (losses) gains on other real estate owned Less acquisition related gains Less increase (decrease) in market value of assets held in trust for deferred compensation Total core non-interest income Plus tax equivalent adjustment on the increase in cash surrender value of life insurance Core non-interest income, fully tax equivalent |
|
|
September 2013 NASDAQ: MBFI Investor Presentation |
SIGNATURES
Pursuant to the requirements of the Securities Exchange Act of 1934, the registrant has duly caused this report to be signed on its behalf by the undersigned hereunto duly authorized.
|
|
MB FINANCIAL, INC. | |
|
|
|
|
|
Date: September 3, 2013 |
By: |
/s/Jill E. York |
|
|
|
Jill E. York |
|
|
|
Vice President and Chief Financial Officer |