Attached files
| file | filename |
|---|---|
| 8-K - FORM 8-K - JARDEN CORP | d591320d8k.htm |
| EX-99.2 - EX-99.2 - JARDEN CORP | d591320dex992.htm |
| EX-23.2 - EX-23.2 - JARDEN CORP | d591320dex232.htm |
| EX-23.1 - EX-23.1 - JARDEN CORP | d591320dex231.htm |
| EX-99.5 - EX-99.5 - JARDEN CORP | d591320dex995.htm |
| EX-99.4 - EX-99.4 - JARDEN CORP | d591320dex994.htm |
| EX-99.1 - EX-99.1 - JARDEN CORP | d591320dex991.htm |
Exhibit 99.3
YCC HOLDINGS LLC AND SUBSIDIARIES
CONDENSED CONSOLIDATED BALANCE SHEETS
(in thousands)
(Unaudited)
| June 29, 2013 |
December 29, 2012 |
|||||||
| ASSETS | ||||||||
| CURRENT ASSETS: |
||||||||
| Cash |
$ | 3,784 | $ | 39,979 | ||||
| Accounts receivable, net |
52,324 | 63,572 | ||||||
| Inventory |
108,284 | 77,969 | ||||||
| Prepaid expenses and other current assets |
26,713 | 4,882 | ||||||
| Deferred tax assets |
8,564 | 6,814 | ||||||
|
|
|
|
|
|||||
| TOTAL CURRENT ASSETS |
199,669 | 193,216 | ||||||
| PROPERTY AND EQUIPMENT, NET |
128,114 | 121,553 | ||||||
| GOODWILL |
643,570 | 643,570 | ||||||
| INTANGIBLE ASSETS, NET |
267,870 | 268,033 | ||||||
| DEFERRED FINANCING COSTS |
17,340 | 19,684 | ||||||
| OTHER ASSETS |
3,039 | 2,326 | ||||||
|
|
|
|
|
|||||
| TOTAL ASSETS |
$ | 1,259,602 | $ | 1,248,382 | ||||
|
|
|
|
|
|||||
| LIABILITIES AND MEMBER’S DEFICIT | ||||||||
| CURRENT LIABILITIES: |
||||||||
| Accounts payable |
$ | 23,652 | $ | 25,309 | ||||
| Accrued payroll |
9,049 | 13,680 | ||||||
| Accrued interest |
19,028 | 22,547 | ||||||
| Accrued income taxes |
— | 7,110 | ||||||
| Accrued purchases of property and equipment |
5,057 | 3,434 | ||||||
| Current portion of capital leases |
1,709 | 1,661 | ||||||
| Other accrued liabilities |
33,039 | 39,686 | ||||||
|
|
|
|
|
|||||
| TOTAL CURRENT LIABILITIES |
91,534 | 113,427 | ||||||
| DEFERRED TAX LIABILITIES |
118,346 | 117,135 | ||||||
| LONG-TERM DEBT |
1,208,082 | 1,156,840 | ||||||
| DEFERRED RENT |
13,254 | 12,886 | ||||||
| CAPITAL LEASES, NET OF CURRENT PORTION |
3,007 | 3,767 | ||||||
| OTHER LONG-TERM LIABILITIES |
7,355 | 5,911 | ||||||
| COMMITMENTS AND CONTINGENCIES |
||||||||
| MEMBER’S DEFICIT |
||||||||
| Common Units |
120,044 | 120,204 | ||||||
| Accumulated deficit |
(297,999 | ) | (280,086 | ) | ||||
| Accumulated other comprehensive loss |
(4,021 | ) | (1,702 | ) | ||||
|
|
|
|
|
|||||
| Total member’s deficit |
(181,976 | ) | (161,584 | ) | ||||
|
|
|
|
|
|||||
| TOTAL LIABILITIES AND MEMBER’S DEFICIT |
$ | 1,259,602 | $ | 1,248,382 | ||||
|
|
|
|
|
|||||
See notes to condensed consolidated financial statements
YCC HOLDINGS LLC AND SUBSIDIARIES
CONDENSED CONSOLIDATED STATEMENTS OF OPERATIONS
(in thousands)
(Unaudited)
| Thirteen Weeks Ended June 29, 2013 |
Thirteen Weeks Ended June 30, 2012 |
|||||||
| Net sales |
$ | 155,680 | $ | 145,327 | ||||
| Cost of sales |
71,866 | 63,906 | ||||||
|
|
|
|
|
|||||
| Gross profit |
83,814 | 81,421 | ||||||
| Selling expenses |
56,066 | 53,231 | ||||||
| General and administrative expenses |
20,732 | 17,951 | ||||||
| Restructuring charges |
— | 1,070 | ||||||
|
|
|
|
|
|||||
| Operating income |
7,016 | 9,169 | ||||||
| Interest expense |
23,780 | 27,320 | ||||||
| Loss on extinguishment of debt |
— | 13,376 | ||||||
| Other income |
(469 | ) | (1,735 | ) | ||||
|
|
|
|
|
|||||
| Loss from continuing operations before benefit from income taxes |
(16,295 | ) | (29,792 | ) | ||||
| Benefit from income taxes |
(5,748 | ) | (11,105 | ) | ||||
|
|
|
|
|
|||||
| Loss from continuing operations |
(10,547 | ) | (18,687 | ) | ||||
| Loss from discontinued operations, net of income taxes |
(21 | ) | (31 | ) | ||||
|
|
|
|
|
|||||
| Net loss |
$ | (10,568 | ) | $ | (18,718 | ) | ||
|
|
|
|
|
|||||
See notes to condensed consolidated financial statements
YCC HOLDINGS LLC AND SUBSIDIARIES
CONDENSED CONSOLIDATED STATEMENTS OF COMPREHENSIVE LOSS
(in thousands)
(Unaudited)
| Thirteen Weeks Ended June 29, 2013 |
Thirteen Weeks Ended June 30, 2012 |
|||||||
| Net loss |
$ | (10,568 | ) | $ | (18,718 | ) | ||
| Other comprehensive income (loss): |
||||||||
| Foreign currency translation adjustments |
209 | (675 | ) | |||||
|
|
|
|
|
|||||
| Other comprehensive income (loss) |
209 | (675 | ) | |||||
|
|
|
|
|
|||||
| Comprehensive loss |
$ | (10,359 | ) | $ | (19,393 | ) | ||
|
|
|
|
|
|||||
See notes to condensed consolidated financial statements
YCC HOLDINGS LLC AND SUBSIDIARIES
CONDENSED CONSOLIDATED STATEMENTS OF OPERATIONS
(in thousands)
(Unaudited)
| Twenty-Six Weeks Ended June 29, 2013 |
Twenty-Six Weeks Ended June 30, 2012 |
|||||||
| Net sales |
$ | 319,056 | $ | 300,394 | ||||
| Cost of sales |
144,808 | 135,183 | ||||||
|
|
|
|
|
|||||
| Gross profit |
174,248 | 165,211 | ||||||
| Selling expenses |
113,542 | 108,714 | ||||||
| General and administrative expenses |
40,209 | 34,897 | ||||||
| Restructuring charges |
764 | 1,725 | ||||||
|
|
|
|
|
|||||
| Operating income |
19,733 | 19,875 | ||||||
| Interest expense |
49,065 | 53,264 | ||||||
| Loss on extinguishment of debt |
— | 13,376 | ||||||
| Other income |
(2,250 | ) | (2,827 | ) | ||||
|
|
|
|
|
|||||
| Loss from continuing operations before benefit from income taxes |
(27,082 | ) | (43,938 | ) | ||||
| Benefit from income taxes |
(9,214 | ) | (16,323 | ) | ||||
|
|
|
|
|
|||||
| Loss from continuing operations |
(17,868 | ) | (27,615 | ) | ||||
| Loss from discontinued operations, net of income taxes |
(45 | ) | (74 | ) | ||||
|
|
|
|
|
|||||
| Net loss |
$ | (17,913 | ) | $ | (27,689 | ) | ||
|
|
|
|
|
|||||
See notes to condensed consolidated financial statements
YCC HOLDINGS LLC AND SUBSIDIARIES
CONDENSED CONSOLIDATED STATEMENTS OF COMPREHENSIVE LOSS
(in thousands)
(Unaudited)
| Twenty-Six Weeks Ended June 29, 2013 |
Twenty-Six Weeks Ended June 30, 2012 |
|||||||
| Net loss |
$ | (17,913 | ) | $ | (27,689 | ) | ||
| Other comprehensive (loss) income: |
||||||||
| Foreign currency translation adjustments |
(2,319 | ) | 403 | |||||
|
|
|
|
|
|||||
| Other comprehensive (loss) income |
(2,319 | ) | 403 | |||||
|
|
|
|
|
|||||
| Comprehensive loss |
$ | (20,232 | ) | $ | (27,286 | ) | ||
|
|
|
|
|
|||||
See notes to condensed consolidated financial statements
YCC HOLDINGS LLC AND SUBSIDIARIES
CONDENSED CONSOLIDATED STATEMENTS OF CHANGES IN MEMBER’S DEFICIT
(in thousands, except units)
(Unaudited)
| Common Units | ||||||||||||||||||||
| Units | Amount | Accumulated Deficit |
Accumulated Other Comprehensive Loss |
Total Member’s Equity (Deficit) |
||||||||||||||||
| BALANCE, DECEMBER 31, 2011 |
1,000 | $ | 122,038 | $ | (313,009 | ) | $ | (3,184 | ) | $ | (194,155 | ) | ||||||||
| Issuance of Common Units |
— | 17 | — | — | 17 | |||||||||||||||
| Repurchase of Common Units |
— | (279 | ) | — | — | (279 | ) | |||||||||||||
| Equity-based compensation expense |
— | 424 | — | — | 424 | |||||||||||||||
| Net loss |
— | — | (27,689 | ) | — | (27,689 | ) | |||||||||||||
| Other comprehensive income tax |
— | — | — | 403 | 403 | |||||||||||||||
|
|
|
|
|
|
|
|
|
|
|
|||||||||||
| BALANCE, JUNE 30, 2012 |
1,000 | $ | 122,200 | $ | (340,698 | ) | $ | (2,781 | ) | $ | (221,279 | ) | ||||||||
|
|
|
|
|
|
|
|
|
|
|
|||||||||||
| BALANCE, DECEMBER 29, 2012 |
1,000 | 120,204 | (280,086 | ) | (1,702 | ) | (161,584 | ) | ||||||||||||
| Repurchase of Common Units |
— | (484 | ) | — | — | (484 | ) | |||||||||||||
| Equity-based compensation expense |
— | 324 | — | — | 324 | |||||||||||||||
| Net loss |
— | — | (17,913 | ) | — | (17,913 | ) | |||||||||||||
| Other comprehensive loss |
— | — | — | (2,319 | ) | (2,319 | ) | |||||||||||||
|
|
|
|
|
|
|
|
|
|
|
|||||||||||
| BALANCE, JUNE 29, 2013 |
1,000 | $ | 120,044 | $ | (297,999 | ) | $ | (4,021 | ) | $ | (181,976 | ) | ||||||||
|
|
|
|
|
|
|
|
|
|
|
|||||||||||
See notes to condensed consolidated financial statements
YCC HOLDINGS LLC AND SUBSIDIARIES
CONDENSED CONSOLIDATED STATEMENTS OF CASH FLOWS
(in thousands)
(Unaudited)
| Twenty-Six Weeks Ended June 29, 2013 |
Twenty-Six Weeks Ended June 30, 2012 |
|||||||
| CASH FLOWS FROM OPERATING ACTIVITIES: |
||||||||
| Net loss |
$ | (17,913 | ) | $ | (27,689 | ) | ||
| Adjustments to reconcile net loss to net cash used in operating activities: |
||||||||
| Realized gain on derivative contracts |
(1,757 | ) | (3,741 | ) | ||||
| Depreciation and amortization |
16,672 | 17,693 | ||||||
| Unrealized gain on marketable securities |
(135 | ) | (92 | ) | ||||
| Equity-based compensation expense |
324 | 424 | ||||||
| Deferred taxes |
50 | 3,138 | ||||||
| Loss on extinguishment of debt |
77 | 13,376 | ||||||
| Loss on disposal and impairment of property and equipment |
273 | 37 | ||||||
| Restructuring charges |
— | 1,070 | ||||||
| Changes in assets and liabilities: |
||||||||
| Accounts receivable |
9,879 | 17,693 | ||||||
| Inventory |
(31,783 | ) | (33,726 | ) | ||||
| Prepaid expenses and other assets |
(10,970 | ) | (6,111 | ) | ||||
| Accounts payable |
(1,463 | ) | (194 | ) | ||||
| Income taxes |
(17,803 | ) | (27,107 | ) | ||||
| Accrued expenses and other liabilities |
(11,700 | ) | (10,459 | ) | ||||
|
|
|
|
|
|||||
| NET CASH USED IN OPERATING ACTIVITIES |
(66,249 | ) | (55,688 | ) | ||||
|
|
|
|
|
|||||
| CASH FLOWS USED IN INVESTING ACTIVITIES: |
||||||||
| Purchases of property and equipment |
(18,493 | ) | (14,869 | ) | ||||
|
|
|
|
|
|||||
| NET CASH USED IN INVESTING ACTIVITIES |
(18,493 | ) | (14,869 | ) | ||||
|
|
|
|
|
|||||
| CASH FLOWS FROM FINANCING ACTIVITIES: |
||||||||
| Borrowings under Senior Secured Credit Facility |
— | 15,000 | ||||||
| Borrowings under Senior Secured Asset-Based Credit Facility |
60,000 | 32,000 | ||||||
| Borrowings under Term Loan Facility |
— | 717,750 | ||||||
| Repayments under Senior Notes |
(10,000 | ) | — | |||||
| Payments of call premiums and fees for extinguishment of debt |
— | (6,763 | ) | |||||
| Repayments under Senior Secured Credit Facility |
— | (718,125 | ) | |||||
| Repayments under Term Loan Facility |
— | (1,812 | ) | |||||
| Financing costs |
— | (11,579 | ) | |||||
| Proceeds from issuance of Common Units |
— | 17 | ||||||
| Repurchase of Common Units |
(484 | ) | (279 | ) | ||||
| Principal payments on capital lease obligations |
(774 | ) | (665 | ) | ||||
|
|
|
|
|
|||||
| NET CASH PROVIDED BY FINANCING ACTIVITIES |
48,742 | 25,544 | ||||||
|
|
|
|
|
|||||
| EFFECT OF EXCHANGE RATE CHANGES ON CASH |
(195 | ) | 10 | |||||
|
|
|
|
|
|||||
| NET DECREASE IN CASH |
(36,195 | ) | (45,003 | ) | ||||
| CASH, BEGINNING OF PERIOD |
39,979 | 50,833 | ||||||
|
|
|
|
|
|||||
| CASH, END OF PERIOD |
$ | 3,784 | $ | 5,830 | ||||
|
|
|
|
|
|||||
| SUPPLEMENTAL DISCLOSURES OF CASH FLOW INFORMATION: |
||||||||
| Cash paid during the period for: |
||||||||
| Interest |
$ | 48,937 | $ | 59,611 | ||||
|
|
|
|
|
|||||
| Income taxes |
$ | 8,500 | $ | 7,597 | ||||
|
|
|
|
|
|||||
| Net change in accrued purchases of property and equipment |
$ | (1,623 | ) | $ | (1,398 | ) | ||
|
|
|
|
|
|||||
| Noncash Financing Activities: |
||||||||
| Capital lease obligations related to equipment purchase |
$ | 109 | $ | 2,195 | ||||
|
|
|
|
|
|||||
See notes to condensed consolidated financial statements
YANKEE HOLDING CORP. AND SUBSIDIARIES
CONDENSED CONSOLIDATED BALANCE SHEETS
(in thousands except share data)
(Unaudited)
| June 29, 2013 |
December 29, 2012 |
|||||||
| ASSETS | ||||||||
| CURRENT ASSETS: |
||||||||
| Cash |
$ | 3,784 | $ | 39,979 | ||||
| Accounts receivable, net |
52,324 | 63,572 | ||||||
| Inventory |
108,284 | 77,969 | ||||||
| Prepaid expenses and other current assets |
26,713 | 4,882 | ||||||
| Deferred tax assets |
8,564 | 6,814 | ||||||
|
|
|
|
|
|||||
| TOTAL CURRENT ASSETS |
199,669 | 193,216 | ||||||
| PROPERTY AND EQUIPMENT, NET |
128,114 | 121,553 | ||||||
| GOODWILL |
643,570 | 643,570 | ||||||
| INTANGIBLE ASSETS, NET |
267,870 | 268,033 | ||||||
| DEFERRED FINANCING COSTS |
11,399 | 12,799 | ||||||
| OTHER ASSETS |
3,039 | 2,326 | ||||||
|
|
|
|
|
|||||
| TOTAL ASSETS |
$ | 1,253,661 | $ | 1,241,497 | ||||
|
|
|
|
|
|||||
| LIABILITIES AND STOCKHOLDER’S EQUITY | ||||||||
| CURRENT LIABILITIES: |
||||||||
| Accounts payable |
$ | 23,652 | $ | 25,309 | ||||
| Accrued payroll |
9,049 | 13,680 | ||||||
| Accrued interest |
7,077 | 10,614 | ||||||
| Accrued income taxes |
— | 7,110 | ||||||
| Accrued purchases of property and equipment |
5,057 | 3,434 | ||||||
| Current portion of capital leases |
1,709 | 1,661 | ||||||
| Other accrued liabilities |
33,039 | 39,686 | ||||||
|
|
|
|
|
|||||
| TOTAL CURRENT LIABILITIES |
79,583 | 101,494 | ||||||
| DEFERRED TAX LIABILITIES |
118,346 | 117,135 | ||||||
| LONG-TERM DEBT |
896,821 | 846,174 | ||||||
| DEFERRED RENT |
13,254 | 12,886 | ||||||
| CAPITAL LEASES, NET OF CURRENT PORTION |
3,007 | 3,767 | ||||||
| OTHER LONG-TERM LIABILITIES |
7,355 | 5,911 | ||||||
| COMMITMENTS AND CONTINGENCIES |
||||||||
| STOCKHOLDER’S EQUITY: |
||||||||
| Common stock: $.01 par value; 500,000 issued and 497,981 outstanding at June 29, 2013 and December 29, 2012 |
414,304 | 414,788 | ||||||
| Additional paid-in capital |
36,912 | 30,144 | ||||||
| Treasury stock: at cost, 2,019 shares at March 30, 2013 and December 29, 2012 |
(1,809 | ) | (1,809 | ) | ||||
| Accumulated deficit |
(310,091 | ) | (287,291 | ) | ||||
| Accumulated other comprehensive loss |
(4,021 | ) | (1,702 | ) | ||||
|
|
|
|
|
|||||
| Total stockholder’s equity |
135,295 | 154,130 | ||||||
|
|
|
|
|
|||||
| TOTAL LIABILITIES AND STOCKHOLDER’S EQUITY |
$ | 1,253,661 | $ | 1,241,497 | ||||
|
|
|
|
|
|||||
See notes to condensed consolidated financial statements
YANKEE HOLDING CORP. AND SUBSIDIARIES
CONDENSED CONSOLIDATED STATEMENTS OF OPERATIONS
(in thousands)
(Unaudited)
| Thirteen Weeks Ended June 29, 2013 |
Thirteen Weeks Ended June 30, 2012 |
|||||||
| Net sales |
$ | 155,680 | $ | 145,327 | ||||
| Cost of sales |
71,866 | 63,906 | ||||||
|
|
|
|
|
|||||
| Gross profit |
83,814 | 81,421 | ||||||
| Selling expenses |
56,066 | 53,231 | ||||||
| General and administrative expenses |
20,712 | 17,951 | ||||||
| Restructuring charges |
— | 1,070 | ||||||
|
|
|
|
|
|||||
| Operating income |
7,036 | 9,169 | ||||||
| Interest expense |
14,883 | 18,553 | ||||||
| Loss on extinguishment of debt |
— | 13,376 | ||||||
| Other income |
(469 | ) | (1,735 | ) | ||||
|
|
|
|
|
|||||
| Loss from continuing operations before benefit from income taxes |
(7,378 | ) | (21,025 | ) | ||||
| Benefit from income taxes |
(2,521 | ) | (7,515 | ) | ||||
|
|
|
|
|
|||||
| Loss from continuing operations |
(4,857 | ) | (13,510 | ) | ||||
| Loss from discontinued operations, net of income taxes |
(21 | ) | (31 | ) | ||||
|
|
|
|
|
|||||
| Net loss |
$ | (4,878 | ) | $ | (13,541 | ) | ||
|
|
|
|
|
|||||
See notes to condensed consolidated financial statements
YANKEE HOLDING CORP. AND SUBSIDIARIES
CONDENSED CONSOLIDATED STATEMENTS OF COMPREHENSIVE LOSS
(in thousands)
(Unaudited)
| Thirteen Weeks Ended June 29, 2013 |
Thirteen Weeks Ended June 30, 2012 |
|||||||
| Net loss |
$ | (4,878 | ) | $ | (13,541 | ) | ||
| Other comprehensive income (loss): |
||||||||
| Foreign currency translation adjustments |
209 | (675 | ) | |||||
|
|
|
|
|
|||||
| Other comprehensive income (loss) |
209 | (675 | ) | |||||
|
|
|
|
|
|||||
| Comprehensive loss |
$ | (4,669 | ) | $ | (14,216 | ) | ||
|
|
|
|
|
|||||
See notes to condensed consolidated financial statements
YANKEE HOLDING CORP. AND SUBSIDIARIES
CONDENSED CONSOLIDATED STATEMENTS OF OPERATIONS
(in thousands)
(Unaudited)
| Twenty-Six Weeks Ended June 29, 2013 |
Twenty-Six Weeks Ended June 30, 2012 |
|||||||
| Net sales |
$ | 319,056 | $ | 300,394 | ||||
| Cost of sales |
144,808 | 135,183 | ||||||
|
|
|
|
|
|||||
| Gross profit |
174,248 | 165,211 | ||||||
| Selling expenses |
113,542 | 108,714 | ||||||
| General and administrative expenses |
40,170 | 34,852 | ||||||
| Restructuring charges |
764 | 1,725 | ||||||
|
|
|
|
|
|||||
| Operating income |
19,772 | 19,920 | ||||||
| Interest expense |
31,357 | 35,787 | ||||||
| Loss on extinguishment of debt |
— | 13,376 | ||||||
| Other income |
(2,250 | ) | (2,827 | ) | ||||
|
|
|
|
|
|||||
| Loss from continuing operations before benefit from income taxes |
(9,335 | ) | (26,416 | ) | ||||
| Benefit from income taxes |
(2,769 | ) | (9,436 | ) | ||||
|
|
|
|
|
|||||
| Loss from continuing operations |
(6,566 | ) | (16,980 | ) | ||||
| Loss from discontinued operations, net of income taxes |
(45 | ) | (74 | ) | ||||
|
|
|
|
|
|||||
| Net loss |
$ | (6,611 | ) | $ | (17,054 | ) | ||
|
|
|
|
|
|||||
See notes to condensed consolidated financial statements
YANKEE HOLDING CORP. AND SUBSIDIARIES
CONDENSED CONSOLIDATED STATEMENTS OF COMPREHENSIVE LOSS
(in thousands)
(Unaudited)
| Twenty-Six Weeks Ended June 29, 2013 |
Twenty-Six Weeks Ended June 30, 2012 |
|||||||
| Net loss |
$ | (6,611 | ) | $ | (17,054 | ) | ||
| Other comprehensive (loss) income: |
||||||||
| Foreign currency translation adjustments |
(2,319 | ) | 403 | |||||
|
|
|
|
|
|||||
| Other comprehensive (loss) income |
(2,319 | ) | 403 | |||||
|
|
|
|
|
|||||
| Comprehensive loss |
$ | (8,930 | ) | $ | (16,651 | ) | ||
|
|
|
|
|
|||||
See notes to condensed consolidated financial statements
YANKEE HOLDING CORP. AND SUBSIDIARIES
CONDENSED CONSOLIDATED STATEMENTS OF CHANGES IN STOCKHOLDER’S EQUITY
(in thousands, except treasury shares)
(Unaudited)
| Accumulated | ||||||||||||||||||||||||||||||||
| Additional | Other | |||||||||||||||||||||||||||||||
| Common Stock | Paid in | Treasury Stock | Accumulated | Comprehensive | ||||||||||||||||||||||||||||
| Shares | Amount | Capital | Shares | Amount | Deficit | Loss | Total | |||||||||||||||||||||||||
| BALANCE, DECEMBER 31, 2011 |
500 | 417,411 | 17,718 | 2,019 | (1,809 | ) | (311,225 | ) | (3,184 | ) | 118,911 | |||||||||||||||||||||
| Issuance of common stock |
— | — | 17 | — | — | — | — | 17 | ||||||||||||||||||||||||
| Repurchase of common stock |
— | (279 | ) | — | — | — | — | — | (279 | ) | ||||||||||||||||||||||
| Equity-based compensation expense |
— | — | 424 | — | — | — | — | 424 | ||||||||||||||||||||||||
| Contributions by YCC Holdings LLC |
— | — | 6,886 | — | — | — | — | 6,886 | ||||||||||||||||||||||||
| Dividend to YCC Holdings LLC |
— | — | — | — | — | (16,195 | ) | — | (16,195 | ) | ||||||||||||||||||||||
| Net loss |
— | — | — | — | — | (17,054 | ) | — | (17,054 | ) | ||||||||||||||||||||||
| Other comprehensive income |
— | — | — | — | — | — | 403 | 403 | ||||||||||||||||||||||||
|
|
|
|
|
|
|
|
|
|
|
|
|
|
|
|
|
|||||||||||||||||
| BALANCE, JUNE 30, 2012 |
500 | $ | 417,132 | $ | 25,045 | 2,019 | $ | (1,809 | ) | $ | (344,474 | ) | $ | (2,781 | ) | $ | 93,113 | |||||||||||||||
|
|
|
|
|
|
|
|
|
|
|
|
|
|
|
|
|
|||||||||||||||||
| BALANCE, DECEMBER 29, 2012 |
500 | $ | 414,788 | $ | 30,144 | 2,019 | $ | (1,809 | ) | $ | (287,291 | ) | $ | (1,702 | ) | $ | 154,130 | |||||||||||||||
| Repurchase of common stock |
— | (484 | ) | — | — | — | — | — | (484 | ) | ||||||||||||||||||||||
| Equity-based compensation expense |
— | — | 324 | — | — | — | — | 324 | ||||||||||||||||||||||||
| Contributions by YCC Holdings LLC |
— | — | 6,444 | — | — | — | — | 6,444 | ||||||||||||||||||||||||
| Dividend to YCC Holdings LLC |
— | — | — | — | — | (16,189 | ) | — | (16,189 | ) | ||||||||||||||||||||||
| Net loss |
— | — | — | — | — | (6,611 | ) | — | (6,611 | ) | ||||||||||||||||||||||
| Other comprehensive loss |
— | — | — | — | — | — | (2,319 | ) | (2,319 | ) | ||||||||||||||||||||||
|
|
|
|
|
|
|
|
|
|
|
|
|
|
|
|
|
|||||||||||||||||
| BALANCE, JUNE 29, 2013 |
500 | $ | 414,304 | $ | 36,912 | 2,019 | $ | (1,809 | ) | $ | (310,091 | ) | $ | (4,021 | ) | $ | 135,295 | |||||||||||||||
|
|
|
|
|
|
|
|
|
|
|
|
|
|
|
|
|
|||||||||||||||||
See notes to condensed consolidated financial statements
YANKEE HOLDING CORP. AND SUBSIDIARIES
CONDENSED CONSOLIDATED STATEMENTS OF CASH FLOWS
(in thousands)
(Unaudited)
| Twenty-Six Weeks Ended June 29, 2013 |
Twenty-Six Weeks Ended June 30, 2012 |
|||||||
| CASH FLOWS FROM OPERATING ACTIVITIES: |
||||||||
| Net loss |
$ | (6,611 | ) | $ | (17,054 | ) | ||
| Adjustments to reconcile net loss to net cash used in operating activities: |
||||||||
| Realized gain on derivative contracts |
(1,757 | ) | (3,741 | ) | ||||
| Depreciation and amortization |
15,133 | 16,322 | ||||||
| Unrealized gain on marketable securities |
(135 | ) | (92 | ) | ||||
| Equity-based compensation expense |
324 | 424 | ||||||
| Deferred taxes |
50 | 3,138 | ||||||
| Loss on extinguishment of debt |
77 | 13,376 | ||||||
| Loss on disposal and impairment of property and equipment |
273 | 37 | ||||||
| Restructuring charges |
— | 1,070 | ||||||
| Changes in assets and liabilities: |
||||||||
| Accounts receivable |
9,879 | 17,693 | ||||||
| Inventory |
(31,783 | ) | (33,726 | ) | ||||
| Prepaid expenses and other assets |
(10,970 | ) | (6,111 | ) | ||||
| Accounts payable |
(1,463 | ) | (194 | ) | ||||
| Income taxes |
(11,359 | ) | (20,221 | ) | ||||
| Accrued expenses and other liabilities |
(11,718 | ) | (10,414 | ) | ||||
|
|
|
|
|
|||||
| NET CASH USED IN OPERATING ACTIVITIES |
(50,060 | ) | (39,493 | ) | ||||
|
|
|
|
|
|||||
| CASH FLOWS FROM INVESTING ACTIVITIES: |
||||||||
| Purchases of property and equipment |
(18,493 | ) | (14,869 | ) | ||||
|
|
|
|
|
|||||
| NET CASH USED IN INVESTING ACTIVITIES |
(18,493 | ) | (14,869 | ) | ||||
|
|
|
|
|
|||||
| CASH FLOWS FROM FINANCING ACTIVITIES: |
||||||||
| Borrowings under Senior Secured Credit Facility |
— | 15,000 | ||||||
| Borrowings under Senior Secured Asset-Based Credit Facility |
60,000 | 32,000 | ||||||
| Borrowings under Term Loan Facility |
— | 717,750 | ||||||
| Repayments under Senior Notes |
(10,000 | ) | — | |||||
| Payments of call premiums and fees for extinguishment of debt |
— | (6,763 | ) | |||||
| Repayments under Term Loan Facility |
— | (1,812 | ) | |||||
| Repayments under Senior Secured Credit Facility |
— | (718,125 | ) | |||||
| Financing costs |
— | (11,579 | ) | |||||
| Dividend to YCC Holdings LLC |
(16,189 | ) | (16,195 | ) | ||||
| Proceeds from issuance of common stock |
— | 17 | ||||||
| Repurchase of common stock |
(484 | ) | (279 | ) | ||||
| Principal payments on capital lease obligations |
(774 | ) | (665 | ) | ||||
|
|
|
|
|
|||||
| NET CASH PROVIDED BY FINANCING ACTIVITIES |
32,553 | 9,349 | ||||||
|
|
|
|
|
|||||
| EFFECT OF EXCHANGE RATE CHANGES ON CASH |
(195 | ) | 10 | |||||
|
|
|
|
|
|||||
| NET DECREASE IN CASH |
(36,195 | ) | (45,003 | ) | ||||
| CASH, BEGINNING OF PERIOD |
39,979 | 50,833 | ||||||
|
|
|
|
|
|||||
| CASH, END OF PERIOD |
$ | 3,784 | $ | 5,830 | ||||
|
|
|
|
|
|||||
| SUPPLEMENTAL DISCLOSURES OF CASH FLOW INFORMATION: |
||||||||
| Cash paid during the period for: |
||||||||
| Interest |
$ | 32,794 | $ | 43,467 | ||||
|
|
|
|
|
|||||
| Income taxes |
$ | 8,500 | $ | 7,597 | ||||
|
|
|
|
|
|||||
| Net change in accrued purchases of property and equipment |
$ | (1,623 | ) | $ | (1,398 | ) | ||
|
|
|
|
|
|||||
| Noncash Financing Activities: |
||||||||
| Noncash contribution by YCC Holdings LLC |
$ | 6,444 | $ | 6,886 | ||||
|
|
|
|
|
|||||
| Capital lease obligations related to equipment purchase |
$ | 109 | $ | 2,195 | ||||
|
|
|
|
|
|||||
See notes to condensed consolidated financial statements
YCC HOLDINGS LLC AND SUBSIDIARIES
YANKEE HOLDING CORP. AND SUBSIDIARIES
NOTES TO CONDENSED CONSOLIDATED FINANCIAL STATEMENTS
(Unaudited)
1. BASIS OF PRESENTATION AND ORGANIZATION
Basis of Presentation
The unaudited interim condensed consolidated financial statements of YCC Holdings LLC (“YCC Holdings”) and Yankee Holding Corp. (“Holding Corp.” together with YCC Holdings and its direct and indirect subsidiaries, the “Companies”) have been prepared in accordance with accounting principles generally accepted in the United States of America (“generally accepted accounting principles” or “GAAP”). The financial information included herein is unaudited; however, in the opinion of management such information reflects all adjustments (consisting of normal recurring accruals) necessary for a fair presentation of financial position, results of operations, and cash flows as of the date and for the periods indicated. All intercompany transactions and balances have been eliminated. The results of operations for the interim periods are not necessarily indicative of the results to be expected for the full fiscal year.
The accompanying unaudited condensed consolidated financial statements of YCC Holdings and Holding Corp. should be read in conjunction with the audited consolidated financial statements of YCC Holdings and Holding Corp. for the year ended December 29, 2012 included in their Annual Report on Form 10-K.
Reclassifications
Certain amounts included in the condensed consolidated financial statements for the prior year have been reclassified to conform with the current year presentation on the condensed consolidated balance sheets. Marketable securities are now reported as part of other assets.
Organization
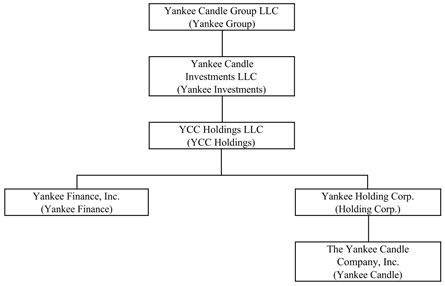
YCC Holdings and Holding Corp. are holding companies with no direct operations. Their principal assets are the indirect equity interests in The Yankee Candle Company, Inc. (“Yankee Candle”), and all of their operations are conducted through Yankee Candle, the wholly owned operating subsidiary of Holding Corp. Holding Corp. is a wholly owned subsidiary of YCC Holdings. YCC Holdings is a wholly owned subsidiary of Yankee Candle Investments LLC (“Yankee Investments”), which is in turn a wholly owned subsidiary of Yankee Candle Group LLC (“Yankee Group”). See the entity chart below:
2. RECENT ACCOUNTING PRONOUNCEMENTS
Disclosures Relating To Comprehensive Income (Loss)
In February 2013, the FASB issued ASU 2013-02, Comprehensive Income (Topic 220): Reporting of Amounts Reclassified Out of Accumulated Other Comprehensive Income (“ASU 2013-02”) to improve the reporting of reclassifications out of Accumulated Other Comprehensive Income (“AOCI”). ASU 2013-12 does not change the current requirements for reporting net income or other comprehensive income in the financial statements. Under ASU 2013-02, an entity is required to provide information about the amounts reclassified out of AOCI by component. In addition, an entity is required to present, either on the face of the financial statements or in the notes, significant amounts reclassified out of AOCI by the respective line items of net income, but only if the amount reclassified is required under U.S. GAAP to be reclassified in its entirety in the same reporting period. For amounts that are not required under U.S. GAAP to be reclassified in their entirety to net income, an entity is required to cross-reference to other disclosures that provide additional details about those amounts. The Companies adopted ASU 2013-02 on December 30, 2012. The adoption did not have a material impact on the Companies’ condensed consolidated financial statements.
3. INVENTORY
The Companies value their inventory on the first–in first–out (“FIFO”) basis. The components of inventory were as follows (in thousands):
| June 29, | December 29, | |||||||
| 2013 | 2012 | |||||||
| Finished goods |
$ | 98,558 | $ | 69,293 | ||||
| Work-in-process |
363 | 678 | ||||||
| Raw materials and packaging |
9,363 | 7,998 | ||||||
|
|
|
|
|
|||||
| Total inventory |
$ | 108,284 | $ | 77,969 | ||||
|
|
|
|
|
|||||
4. GOODWILL AND INTANGIBLE ASSETS
The Companies have determined that their tradenames have an indefinite useful life and, therefore, are not being amortized. In accordance with Accounting Standards Codification (“ASC”) Topic 350 “Intangibles - Goodwill and Other,” goodwill and indefinite lived intangible assets are not amortized but are subject to an annual impairment test. There were no changes in the carrying amount of goodwill during the twenty-six weeks ended June 29, 2013 and June 30, 2013.
Intangible Assets
The carrying amount and accumulated amortization of intangible assets consisted of the following (in thousands):
| Weighted Average Useful Life (in years) |
Gross Carrying Amount |
Accumulated Amortization |
Net Book Value |
|||||||||||||
| June 29, 2013 |
||||||||||||||||
| Indefinite life: |
||||||||||||||||
| Tradenames |
N/A | $ | 267,700 | $ | — | $ | 267,700 | |||||||||
|
|
|
|
|
|
|
|||||||||||
| Finite-lived intangible assets: |
||||||||||||||||
| Customer lists |
5 | 63,759 | (63,721 | ) | 38 | |||||||||||
| Favorable lease agreements |
5 | 2,330 | (2,198 | ) | 132 | |||||||||||
| Other |
3 | 36 | (36 | ) | — | |||||||||||
|
|
|
|
|
|
|
|||||||||||
| Total finite-lived intangible assets |
66,125 | (65,955 | ) | 170 | ||||||||||||
|
|
|
|
|
|
|
|||||||||||
| Total intangible assets |
$ | 333,825 | $ | (65,955 | ) | $ | 267,870 | |||||||||
|
|
|
|
|
|
|
|||||||||||
| December 29, 2012 |
||||||||||||||||
| Indefinite life: |
||||||||||||||||
| Tradenames |
N/A | $ | 267,700 | $ | — | $ | 267,700 | |||||||||
|
|
|
|
|
|
|
|||||||||||
| Finite-lived intangible assets: |
||||||||||||||||
| Customer lists |
5 | 63,788 | (63,663 | ) | 125 | |||||||||||
| Favorable lease agreements |
5 | 2,330 | (2,122 | ) | 208 | |||||||||||
| Other |
3 | 36 | (36 | ) | — | |||||||||||
|
|
|
|
|
|
|
|||||||||||
| Total finite-lived intangible assets |
66,154 | (65,821 | ) | 333 | ||||||||||||
|
|
|
|
|
|
|
|||||||||||
| Total intangible assets |
$ | 333,854 | $ | (65,821 | ) | $ | 268,033 | |||||||||
|
|
|
|
|
|
|
|||||||||||
Total amortization expense from finite–lived intangible assets was $0.1 million for both the thirteen weeks ended June 29, 2013 and June 30, 2012. Total amortization expense from finite–lived intangible assets was $0.1 million and $1.3 million for the twenty-six weeks ended June 29, 2013 and June 30, 2012, respectively. These intangible assets are amortized on a straight line basis. Favorable lease agreements are amortized over the remaining lease term of each respective lease.
5. LONG-TERM DEBT
Long-term debt consisted of the following at June 29, 2013 and December 29, 2012 (in thousands):
| June 29, 2013 |
December 29, 2012 |
|||||||
| Holding Corp. |
||||||||
| Senior secured asset-based credit facility |
$ | 60,000 | $ | — | ||||
| Senior secured term loan facility, net of unamortized discount of $5,554 at June 29, 2013 and $6,201 at December 29, 2012 |
648,821 | 648,174 | ||||||
| Senior notes due 2015 |
— | 10,000 | ||||||
| Senior subordinated notes due 2017 |
188,000 | 188,000 | ||||||
|
|
|
|
|
|||||
| Total Holding Corp. |
896,821 | 846,174 | ||||||
| Senior PIK notes due 2016, net of unamortized discount of $3,739 at June 29, 2013 and $4,334 at December 29, 2012 |
311,261 | 310,666 | ||||||
|
|
|
|
|
|||||
| Total YCC Holdings |
$ | 1,208,082 | $ | 1,156,840 | ||||
|
|
|
|
|
|||||
Term Loan Facility
The Senior Secured Term Loan Facility (the “Term Loan Facility”) matures on April 2, 2019; however, the maturity date of the Term Loan Facility will accelerate if the senior subordinated notes due 2017 (the “Senior Subordinated Notes”) and the senior PIK notes due 2016 (“Senior PIK Notes”) are not defeased, repurchased, refinanced or redeemed 91 days prior to their respective maturity dates. The Term Loan Facility is payable in quarterly principal payments of $1.8 million with the balance due at maturity. However, at the end of 2012, the Company made a principal payment of $67.0 million; as a result of the payment, no quarterly principal payments are due on the Term Loan Facility through its maturity and no amounts are classified as current in the accompanying condensed consolidated balance sheets. Amounts repaid under the Term Loan Facility cannot be reborrowed. As of June 29, 2013, the Term Loan Facility had outstanding borrowings of $654.4 million.
Interest is payable on the Term Loan Facility at either (i) the Eurodollar Rate (subject to a 1.25% floor) plus 4.00% or (ii) the ABR (subject to a 2.25% floor) plus 3.00%. The default rate of interest will accrue (i) on the overdue principal amount of any loan at a rate of 2% in excess of the rate otherwise applicable to such loan and (ii) on any overdue interest or any other outstanding overdue amount at a rate of 2% in excess of the non-default interest rate then applicable to ABR loans. As of June 29, 2013, the interest rate applicable to the Term Loan Facility was 5.25%.
Yankee Candle’s Term Loan Facility contains a financial covenant which requires that Yankee Candle maintain at the end of each fiscal quarter, commencing with the quarter ended December 29, 2012 through the quarter ending September 28, 2013, a consolidated net debt (net of cash and cash equivalents not to exceed $75.0 million) to Consolidated EBITDA ratio of no more than 7.00 to 1.00. As of June 29, 2013, Yankee Candle’s actual net total leverage ratio was 4.53 to 1.00, as defined in the Term Loan Facility. As of June 29, 2013, total Holding Corp. debt (including Yankee Candle’s capital lease obligations of $4.7 million and net of $3.8 million in cash) was approximately $903.3 million. Under Yankee Candle’s Term Loan Facility, Consolidated EBITDA is defined as net income plus, interest, taxes, depreciation and amortization, further adjusted to add back extraordinary, unusual or non-recurring losses, non-cash stock option expense, fees and expenses related to the Merger, fees and expenses under the Management Agreement with our equity sponsor, restructuring charges or reserves, as well as other non-cash charges, expenses or losses, and further adjusted to subtract extraordinary, unusual or non-recurring gains, other non-cash income or gains, and certain cash contributions to our common equity.
Asset-Based Credit Facility
The Senior Secured Asset-Based Credit Facility (the “ABL Facility”) expires on April 2, 2017; however, the expiration date of the ABL Facility will accelerate if the Senior Subordinated Notes and the Senior PIK Notes are not defeased, repurchased, refinanced or redeemed 91 days prior to their respective maturity dates. The ABL Facility permits revolving borrowings of up to $175.0 million subject to eligible inventory and eligible accounts receivable balances. The ABL Facility is inclusive of sub-facilities for up to $25.0 million in swing line advances, up to $25.0 million for letters of credit, up to $10.0 million for borrowings by Yankee Candle’s Canadian subsidiary, up to $10.0 million for borrowings by Yankee Candle’s German subsidiary and up to $75.0 million for borrowing by Yankee Candle’s wholly-owned subsidiary Yankee Candle (Europe), LTD (“YCE”). Borrowings under the ABL Facility bear interest at a rate equal to either (i) LIBOR or the BofA rate plus the applicable margin or (ii) the prime rate plus the applicable margin. The applicable margin ranges from 0.50% to 2.00%, dependent on the currency of the borrowing. For purposes of determining interest rates, the applicable margin is subject to a variable grid, dependent on average daily excess availability calculated as of the immediately preceding fiscal quarter. As of June 29, 2013 the interest rate applicable to the ABL Facility was 1.75%.
The unused line fee payable under the ABL Facility is equal to (i) 0.50% per annum if less than 50% of the ABL Facility has been used on average during the immediately preceding fiscal quarter or (ii) 0.375% per annum if 50% or more of the ABL Facility has been utilized on average during the immediately preceding fiscal quarter.
The ABL Facility requires Yankee Candle and its subsidiaries to maintain a consolidated fixed charge coverage ratio of at least 1.0:1.0 during a covenant compliance event, which occurs if unused borrowing availability is less than the greater of (x) 10% of the maximum amount that can be borrowed under the ABL Facility, which amount is the lesser of $175.0 million and a borrowing formula based on eligible receivables and inventory (the “ABL Loan Cap”) and (y) $15.0 million and continues until excess availability has exceeded the amounts set forth herein for 30 consecutive days. As of June 29, 2013, the ABL Loan Cap was $88.2 million. As of June 29, 2013, Yankee Candle had outstanding letters of credit of $2.5 million and $60.0 million outstanding under the ABL Facility resulting in available borrowing capacity of $25.7 million, or 29.2% of the Loan Cap. As such, Yankee Candle was not subject to the fixed charge coverage ratio.
Senior Notes and Senior Subordinated Notes
In April 2012, $315.0 million of Yankee Candle’s Senior Notes due 2015 (“Senior Notes”) were redeemed in connection with the refinancing of the senior secured credit facility (“Senior Secured Credit Facility”). During the first quarter of 2013, Yankee Candle redeemed the remaining $10.0 million in aggregate principal amount of its Senior Notes at par. As all of the Senior Notes have been redeemed, the obligations of Yankee Candle and the guarantors under the related indenture have been discharged.
Yankee Candle’s senior subordinated notes due 2017 bear interest at a per annum rate equal to 9.75%. Interest is paid every six months on February 15 and August 15. The senior subordinated notes mature on February 15, 2017. The indenture governing the senior subordinated notes restricts the ability of Holding Corp., Yankee Candle and most or all of Yankee Candle’s subsidiaries to: incur additional debt; pay dividends or make other distributions on the Company’s capital stock or repurchase capital stock or subordinated indebtedness; make investments or other specified restricted payments; create liens; sell assets and subsidiary stock; enter into transactions with affiliates; and enter into mergers, consolidations and sales of substantially all assets.
Obligations under the senior subordinated notes are guaranteed on an unsecured senior subordinated basis, by Holding Corp. and Yankee Candle’s existing and future domestic subsidiaries. If Yankee Candle cannot make any payment on the senior subordinated notes, the guarantors must make the payment instead.
In the event of certain change in control events specified in the indenture s governing the senior subordinated notes, Yankee Candle must offer to repurchase all or a portion of such notes at 101% of the principal amount of the such notes on the date of purchase, plus any accrued and unpaid interest to the date of repurchase.
Senior PIK Notes - YCC Holdings
In February 2011, YCC Holdings and Yankee Finance co-issued $315.0 million of Senior PIK Notes pursuant to an indenture at a discount of $6.3 million for net proceeds of $308.7 million. Cash interest on the Senior PIK Notes accrues at a rate of 10.25% per annum, and PIK Interest (defined below) accrues at the cash interest rate plus 0.75%. YCC Holdings is required to pay interest on the Senior PIK Notes entirely in cash interest, unless the conditions described in the indenture are satisfied with respect to the related interest period, in which case, YCC Holdings may pay interest on the Senior PIK Notes for such interest period by increasing the principal amount of the Senior PIK Notes or by issuing new PIK Notes for up to the entire amount of the interest payment (in each case, “PIK Interest”) to the extent described in the related indenture.
YCC Holdings is indirectly dependent upon dividends from Yankee Candle to generate the funds necessary to meet its outstanding debt service obligations. Neither Yankee Candle nor Holding Corp. guarantees the Senior PIK Notes. Yankee Candle is not obligated to pay dividends to Holding Corp. and Holding Corp. is not obligated to pay dividends to YCC Holdings. Yankee Candle’s ability to pay dividends to Holding Corp. to permit Holding Corp. to pay dividends to YCC Holdings was restricted at June 29, 2013 by A) Yankee Candle’s Term Loan Facility, B) Yankee Candle’s ABL Facility and C) the indenture governing the Senior Subordinated Notes. Because the Term Loan Facility, ABL Facility and the indenture governing Yankee Candle’s senior subordinated notes each contain limitations on dividends, Yankee Candle is permitted to make dividends only to the extent it is permitted to do so at the time the dividend is made under each of these agreements. For a more detailed description of these restrictions reference our most recently issued Form 10-K.
During both of the twenty-six weeks ended June 29, 2013 and June 30, 2012, Holding Corp. declared and paid dividends of $16.2 million to YCC Holdings to fund interest payments for the Senior PIK Notes, which decreased the amount available for future dividends. At June 29, 2013, the amount available for dividends from Yankee Candle to YCC Holdings was approximately $152.1 million.
Holding Corp. receives the tax benefit of the interest expense for YCC Holdings’ Senior PIK Notes. As such, for the twenty-six weeks ended June 29, 2013 and June 30, 2012, Holding Corp. recorded non-cash contributions of $6.4 million and $6.9 million, respectively, from YCC Holdings. The contributions for the twenty-six weeks ended June 29, 2013 and June 30, 2012 are shown as a contribution by YCC Holdings LLC in Holding Corp.‘s respective consolidated statement of changes in stockholder’s equity and in Holding Corp.‘s non-cash financing section of the respective condensed consolidated statements of cash flows.
6. MEMBER’S DEFICIT, STOCKHOLDER’S EQUITY AND EQUITY-BASED COMPENSATION
A summary of Yankee Group Class A, B and C nonvested units as of June 29, 2013 and June 30, 2012, and the activity for the twenty-six weeks ended June 29, 2013 and June 30, 2012 is presented below:
| Class A Common Units |
Weighted Average Calculated Value |
Class B Common Units |
Weighted Average Calculated Value |
Class C Common Units |
Weighted Average Calculated Value |
|||||||||||||||||||
| Nonvested stock at December 29, 2012 |
— | — | — | — | 95,155 | $ | 25.42 | |||||||||||||||||
| Granted |
— | — | — | — | — | $ | — | |||||||||||||||||
| Forfeited |
— | — | — | — | (1,963 | ) | $ | 24.29 | ||||||||||||||||
| Vested |
— | — | — | — | (13,355 | ) | $ | 21.09 | ||||||||||||||||
|
|
|
|
|
|
|
|||||||||||||||||||
| Nonvested stock at June 29, 2013 |
— | — | — | — | 79,837 | $ | 26.17 | |||||||||||||||||
|
|
|
|
|
|
|
|||||||||||||||||||
| Class A Common Units |
Weighted Average Calculated Value |
Class B Common Units |
Weighted Average Calculated Value |
Class C Common Units |
Weighted Average Calculated Value |
|||||||||||||||||||
| Nonvested stock at December 31, 2011 |
— | — | 4,577 | $ | 9.39 | 54,614 | $ | 24.99 | ||||||||||||||||
| Granted |
181 | — | — | — | 63,209 | $ | 27.83 | |||||||||||||||||
| Forfeited |
— | — | (13 | ) | $ | 9.39 | (20,365 | ) | $ | 34.18 | ||||||||||||||
| Vested |
(181 | ) | — | (4,564 | ) | $ | 9.39 | (14,216 | ) | $ | 22.99 | |||||||||||||
|
|
|
|
|
|
|
|||||||||||||||||||
| Nonvested stock at June 30, 2012 |
— | — | — | — | 83,242 | $ | 25.25 | |||||||||||||||||
|
|
|
|
|
|
|
|||||||||||||||||||
During the twenty-six weeks ended June 29, 2013, 94 Class A common units, 3,324 vested Class B common units and 1,882 vested Class C common units were repurchased for $0.5 million. During the twenty-six weeks ended June 30, 2012, 9 Class A common units, 5,452 vested Class B common units and 711 vested Class C common units were repurchased for $0.3 million. Yankee Group anticipates that all of its nonvested common units will vest with the exception of performance shares for which an estimated forfeiture rate has been applied.
The total estimated fair value of equity awards vested was $0.3 million and $0.4 million for the twenty-six weeks ended June 29, 2013 and June 30, 2012, respectively. Equity-based compensation expense was $0.3 million and $0.4 million for the twenty-six weeks ended June 29, 2013 and June 30, 2012, respectively. As of June 29, 2013, there was approximately $1.9 million of total unrecognized compensation cost related to Yankee Group’s Class C common unit equity awards and there was no unrecognized expense related to Yankee Group’s Class A and Class B common unit equity awards. This cost is expected to be recognized over the remaining vesting period, of approximately 4 years (July 2013 to October 2017).
Presented below is a summary of assumptions for the indicated periods. There were no Class C grants during the twenty-six weeks ended June 29, 2013. There were 63,209 Class C grants for the twenty-six weeks ended June 30, 2012.
| Assumptions |
Twenty-Six Weeks Ended June 30, 2012 Option Pricing Method Black-Scholes |
|||
| Weighted average calculated value of awards granted |
$ | 27.83 | ||
| Weighted average volatility |
77.0 | % | ||
| Weighted average expected term (in years) |
5.0 | |||
| Dividend yield |
— | |||
| Weighted average risk-free interest rate |
0.9 | % | ||
With respect to the Class C common units, since Yankee Group is not publicly traded, the estimate of expected volatility is based on the median historical volatility of a group of eight comparable public companies, adjusted for differences in leverage. The historical volatilities of the comparable companies were measured over a 5-year historical period. The expected term of the Class C common units granted represents the period of time that the units are expected to be outstanding and is assumed to be approximately five years based on management’s estimate of the time to a liquidity event. Yankee Group does not expect to pay dividends, and accordingly, the dividend yield is zero. The risk free interest rate reflects a five-year period commensurate with the expected time to a liquidity event and was based on the U.S. Treasury yield curve.
7. RESTRUCTURING CHARGES
During the first quarter of 2013, the Companies’ wholly-owned subsidiary YCE, closed a satellite office located in Germany and also initiated a change in reporting structure and changes of roles and responsibilities within the organization that resulted in workforce reductions. As a result of these changes the Companies incurred restructuring charges of $0.8 million during the first quarter of 2013 related to employee severance costs and costs for exiting the German office.
During 2012, the Companies restructured their Wholesale and Retail operations. The Companies also initiated a change in reporting structure and changes of roles and responsibilities within the organization that resulted in workforce reductions. These changes included changes to the executive committee, changes to the reporting structure and operational focus within the retail segment, alignment of the brand innovation and merchandising teams across all channels of the business, and other administrative changes. As a result of these changes the Companies incurred restructuring charges of $0.7 million during the thirteen weeks ended March 31, 2012 for employee related severance costs. During the second quarter of 2012, the Companies’ wholly-owned subsidiary YCE, relocated its corporate headquarters and distribution center in England. As a result of these changes the Company incurred restructuring charges of $1.1 million during the thirteen weeks ended June 30, 2012 related to exiting the old facility and non-cash writeoffs for the impairment of equipment and deferred rent. Total restructuring costs recorded for the twenty-six weeks ended June 30, 2012 were $1.7 million.
The Company made restructuring related payments of $0.6 million and $1.1 million during the thirteen and twenty-six weeks ended June 29, 2013, respectively. As of June 29, 2013, the balance of $1.2 million in the restructuring accrual was related to (i) continuing operations employee related expenses of $0.3 million mainly comprised of the first quarter of 2013 organization changes detailed above, (ii) continuing operations occupancy related expenses of $0.3 million related to YCE exiting the old facility prior to the termination of the lease agreement and (iii) discontinued operations of $0.5 million primarily related to lease agreements for one Illuminations retail store. The lease at the old YCE facility expires in May 2014; the lease for the Illuminations retail store expires in January 2017. These leases will continue to be paid through their lease termination dates unless the Companies are able to structure buyout agreements with the landlords or find replacement tenants.
8. DERIVATIVE FINANCIAL INSTRUMENTS
The Companies follow the guidance under ASC Topic 815 “Derivatives and Hedging,” which establishes accounting and reporting standards for derivative instruments. The guidance requires an entity to recognize all derivatives as either assets or liabilities in the statement of financial position and to measure those instruments at fair value. Additionally, the fair value adjustments will affect either stockholder’s equity or member’s deficit as accumulated other comprehensive income (loss) (“OCI”) or net income (loss) depending on whether the derivative instrument qualifies and has been designated as a hedge for accounting purposes and, if so, the nature of the hedging activity.
Interest Rate Swaps
Yankee Candle, from time to time, uses interest rate swaps to eliminate the variability of a portion of the cash flows associated with forecasted interest payments on its Term Facility. Yankee Candle’s interest rate swaps are not designated as cash flow hedges and the swaps are measured at fair value with changes in fair value recognized as other (income) expense.
As of June 29, 2013, Yankee Candle has no derivative liabilities as the Companies’ interest rate swaps expired during March 2013.
The fair values of the Companies’ derivative instruments as of June 29, 2013 and December 29, 2012, were as follows (in thousands):
| Fair Value of Derivative Instruments Liability Derivatives |
||||||||||
| Balance Sheet Location | June 29, 2013 |
December 29, 2012 |
||||||||
| Derivatives not designated as hedging instruments |
||||||||||
| Interest rate swap agreements |
Other accrued liabilities | $ | — | $ | 1,757 | |||||
|
|
|
|
|
|||||||
| Total Derivative Liabilities |
$ | — | $ | 1,757 | ||||||
|
|
|
|
|
|||||||
The effect of derivative instruments on the condensed consolidated statements of operations for the thirteen and twenty-six weeks ended June 29, 2013 and June 30, 2012, was as follows (in thousands):
| Amount of Realized Gain Recognized on Derivatives |
||||||||||
| Location of Realized Gain Recognized on Derivatives | Thirteen Weeks Ended June 29, 2013 |
Thirteen Weeks Ended June 30, 2012 |
||||||||
| Derivatives not designated as hedging instruments |
||||||||||
| Interest rate swap agreements |
Other expense | $ | — | $ | (2,182 | ) | ||||
|
|
|
|
|
|||||||
| Total |
$ | — | $ | (2,182 | ) | |||||
|
|
|
|
|
|||||||
| Amount of Realized Gain Recognized on Derivatives |
||||||||||
| Location of Realized Gain Recognized on Derivatives | Twenty-Six Weeks Ended June 29, 2013 |
Twenty-Six Weeks Ended June 30, 2012 |
||||||||
| Derivatives not designated as hedging instruments |
||||||||||
| Interest rate swap agreements |
Other expense | $ | (1,757 | ) | $ | (3,741 | ) | |||
|
|
|
|
|
|||||||
| Total |
$ | (1,757 | ) | $ | (3,741 | ) | ||||
|
|
|
|
|
|||||||
9. FAIR VALUE MEASUREMENTS
The Companies follow the guidance prescribed by ASC Topic 820 “Fair Value Measurement.” ASC Topic 820 defines fair value and provides a consistent framework for measuring fair value under GAAP, including financial statement disclosure requirements. As specified under this Topic, valuation techniques are based on observable and unobservable inputs. Observable inputs reflect readily obtainable data from independent sources, while unobservable inputs reflect market assumptions. The Fair Value Measurement Topic classifies these inputs into the following hierarchy:
Level 1 Inputs– Quoted prices for identical instruments in active markets.
Level 2 Inputs– Quoted prices for similar instruments in active markets; quoted prices for identical or similar instruments in markets that are not active; and model-derived valuations whose inputs are observable or whose significant value drivers are observable.
Level 3 Inputs– Instruments with primarily unobservable value drivers.
The following table represents the fair value hierarchy for those financial assets and liabilities measured at fair value on a recurring basis as of June 29, 2013 and December 29, 2012 (in thousands):
| Fair Value Measurements on a Recurring Basis as of June 29, 2013 |
||||||||||||||||
| Level 1 | Level 2 | Level 3 | Total | |||||||||||||
| Assets |
||||||||||||||||
| Marketable securities |
$ | 2,662 | $ | — | $ | — | $ | 2,662 | ||||||||
|
|
|
|
|
|
|
|
|
|||||||||
| Total Assets |
$ | 2,662 | $ | — | $ | — | $ | 2,662 | ||||||||
|
|
|
|
|
|
|
|
|
|||||||||
| Liabilities |
||||||||||||||||
| Interest rate swap agreements |
$ | — | $ | — | $ | — | $ | — | ||||||||
|
|
|
|
|
|
|
|
|
|||||||||
| Total Liabilities |
$ | — | $ | — | $ | — | $ | — | ||||||||
|
|
|
|
|
|
|
|
|
|||||||||
| Fair Value Measurements on a Recurring Basis as of December 29, 2012 |
||||||||||||||||
| Level 1 | Level 2 | Level 3 | Total | |||||||||||||
| Assets |
||||||||||||||||
| Marketable securities |
$ | 1,971 | $ | — | $ | — | $ | 1,971 | ||||||||
|
|
|
|
|
|
|
|
|
|||||||||
| Total Assets |
$ | 1,971 | $ | — | $ | — | $ | 1,971 | ||||||||
|
|
|
|
|
|
|
|
|
|||||||||
| Liabilities |
||||||||||||||||
| Interest rate swap agreements |
$ | — | $ | 1,757 | $ | $ | 1,757 | |||||||||
|
|
|
|
|
|
|
|
|
|||||||||
| Total Liabilities |
$ | — | $ | 1,757 | $ | — | $ | 1,757 | ||||||||
|
|
|
|
|
|
|
|
|
|||||||||
The Companies hold marketable securities in Yankee Candle’s deferred compensation plan. The marketable securities consist of investments in mutual funds and are recorded at fair value based on third party quotes and are included in other assets on the Companies accompanying condensed consolidated balance sheets. The Companies have used an income approach to value the asset and liability for Yankee Candle’s interest rate swaps using a discounted cash flow model that takes into account the present value of future cash flows under the terms of the contract using current market information as of the reporting date such as the one month LIBOR curve and the creditworthiness of the Companies and their counterparties.
Financial Instruments Not Measured at Fair Value
The Companies’ long-term debt is recorded at historical amounts. The Companies determine the fair value of its Senior Notes, Senior Subordinated Notes and Senior PIK Notes based on current quoted market prices (Level 1 in the fair value hierarchy). The Companies estimate the fair value of its Term Loan Facility based on current quoted market prices (Level 2 in the fair value hierarchy). The following table represents the carrying value and fair value of Yankee Candle’s Senior Notes, Senior Subordinated Notes and Term Loan Facility and YCC Holdings’ Senior PIK Notes as of June 29, 2013 and December 29, 2012 (in thousands). The fair value of the Companies’ ABL Facility approximates the carrying value.
| June 29, 2013 | ||||||||
| Carrying Value |
Fair Value | |||||||
| Holding Corp.: |
||||||||
| Term loan facility, net of unamortized discount of $ 5,554 |
$ | 648,821 | $ | 653,786 | ||||
| Senior subordinated notes due 2017 |
$ | 188,000 | $ | 195,050 | ||||
| YCC Holdings: |
||||||||
| Senior PIK notes due 2016, net of unamortized discount of $ 3,739 |
$ | 311,261 | $ | 322,481 | ||||
| December 29, 2012 | ||||||||
| Carrying Value |
Fair Value | |||||||
| Holding Corp.: |
||||||||
| Term loan facility, net of unamortized discount of $ 6,201 |
$ | 648,174 | $ | 661,573 | ||||
| Senior notes due 2015 |
$ | 10,000 | $ | 10,025 | ||||
| Senior subordinated notes due 2017 |
$ | 188,000 | $ | 195,285 | ||||
| YCC Holdings: |
||||||||
| Senior PIK notes due 2016, net of unamortized discount of $ 4,334 |
$ | 310,666 | $ | 324,450 | ||||
At June 29, 2013 and December 29, 2012, management believes that the carrying value of cash, receivables and payables approximate fair value, due to the short maturity of these financial instruments.
10. SEGMENTS OF ENTERPRISE AND RELATED INFORMATION
The Companies have segmented their operations in a manner that reflects how their chief operating decision–maker (the “CEO”) currently reviews the results of the Companies and their subsidiaries’ businesses. The CEO evaluates its retail, wholesale, and international operations based on an “operating income” measure. Such measure gives recognition to specifically identifiable operating costs such as cost of sales and selling expenses. Costs and income not specifically identifiable are included within the unallocated/corporate/other column and include administrative charges, interest expense, fair value changes of derivative contracts, restructuring charges for continuing operations, loss on extinguishment of debt, and other costs not allocated to specific operating segments. The Companies do not account for or report assets, capital expenditures or depreciation and amortization by segment to the CEO.
The following are the relevant data for the thirteen and twenty-six weeks ended June 29, 2013 and June 30, 2012 (in thousands):
| YCC Holdings |
||||||||||||||||||||
| Thirteen Weeks June 29, 2013 | Retail | Wholesale | International | Unallocated/ Corporate/ Other |
Balance per Condensed Consolidated Statement of Operations |
|||||||||||||||
| Net sales |
$ | 86,814 | $ | 41,518 | $ | 27,348 | $ | — | $ | 155,680 | ||||||||||
| Gross profit |
54,314 | 19,909 | 10,053 | (462 | ) | 83,814 | ||||||||||||||
| Selling expenses |
45,120 | 3,085 | 7,399 | 462 | 56,066 | |||||||||||||||
| Operating income |
9,194 | 16,824 | 2,654 | (21,656 | ) | 7,016 | ||||||||||||||
| Interest and other expense, net |
— | — | — | (23,311 | ) | (23,311 | ) | |||||||||||||
|
|
|
|||||||||||||||||||
| Loss from continuing operations before benefit from income taxes |
$ | (16,295 | ) | |||||||||||||||||
|
|
|
|||||||||||||||||||
| Thirteen Weeks June 30, 2012 | Retail | Wholesale | International | Unallocated/ Corporate/ Other |
Balance per Condensed Consolidated Statement of Operations |
|||||||||||||||
| Net sales |
$ | 81,809 | $ | 40,530 | $ | 22,988 | $ | — | $ | 145,327 | ||||||||||
| Gross profit |
52,417 | 20,030 | 9,171 | (197 | ) | 81,421 | ||||||||||||||
| Selling expenses |
42,936 | 2,920 | 6,907 | 468 | 53,231 | |||||||||||||||
| Operating income |
9,481 | 17,110 | 2,264 | (19,686 | ) | 9,169 | ||||||||||||||
| Interest and other expense, net |
— | — | — | (38,961 | ) | (38,961 | ) | |||||||||||||
|
|
|
|||||||||||||||||||
| Loss from continuing operations before benefit from income taxes |
$ | (29,792 | ) | |||||||||||||||||
|
|
|
|||||||||||||||||||
| Holding Corp. |
||||||||||||||||||||
| Thirteen Weeks June 29, 2013 | Retail | Wholesale | International | Unallocated/ Corporate/ Other |
Balance per Condensed Consolidated Statement of Operations |
|||||||||||||||
| Net sales |
$ | 86,814 | $ | 41,518 | $ | 27,348 | $ | — | $ | 155,680 | ||||||||||
| Gross profit |
54,314 | 19,909 | 10,053 | (462 | ) | 83,814 | ||||||||||||||
| Selling expenses |
45,120 | 3,085 | 7,399 | 462 | 56,066 | |||||||||||||||
| Operating income |
9,194 | 16,824 | 2,654 | (21,636 | ) | 7,036 | ||||||||||||||
| Interest and other expense, net |
— | — | — | (14,414 | ) | (14,414 | ) | |||||||||||||
|
|
|
|||||||||||||||||||
| Loss from continuing operations before benefit from income taxes |
$ | (7,378 | ) | |||||||||||||||||
|
|
|
|||||||||||||||||||
| Thirteen Weeks June 30, 2012 | Retail | Wholesale | International | Unallocated/ Corporate/ Other |
Balance per Condensed Consolidated Statement of Operations |
|||||||||||||||
| Net sales |
$ | 81,809 | $ | 40,530 | $ | 22,988 | $ | — | $ | 145,327 | ||||||||||
| Gross profit |
52,417 | 20,030 | 9,171 | (197 | ) | 81,421 | ||||||||||||||
| Selling expenses |
42,936 | 2,920 | 6,907 | 468 | 53,231 | |||||||||||||||
| Operating income |
9,481 | 17,110 | 2,264 | (19,686 | ) | 9,169 | ||||||||||||||
| Interest and other expense, net |
— | — | — | (30,194 | ) | (30,194 | ) | |||||||||||||
|
|
|
|||||||||||||||||||
| Loss from continuing operations before benefit from income taxes |
$ | (21,025 | ) | |||||||||||||||||
|
|
|
|||||||||||||||||||
| YCC Holdings |
||||||||||||||||||||
| Twenty-Six Weeks June 29, 2013 | Retail | Wholesale | International | Unallocated/ Corporate/ Other |
Balance per Condensed Consolidated Statement of Operations |
|||||||||||||||
| Net sales |
$ | 176,026 | $ | 85,096 | $ | 57,934 | $ | — | $ | 319,056 | ||||||||||
| Gross profit |
110,144 | 41,407 | 23,297 | (600 | ) | 174,248 | ||||||||||||||
| Selling expenses |
91,086 | 6,019 | 15,468 | 969 | 113,542 | |||||||||||||||
| Operating income |
19,058 | 35,388 | 7,829 | (42,542 | ) | 19,733 | ||||||||||||||
| Interest and other expense, net |
— | — | — | (46,815 | ) | (46,815 | ) | |||||||||||||
|
|
|
|||||||||||||||||||
| Loss from continuing operations before benefit from income taxes |
$ | (27,082 | ) | |||||||||||||||||
|
|
|
|||||||||||||||||||
| Twenty-Six Weeks June 30, 2012 | Retail | Wholesale | International | Unallocated/ Corporate/ Other |
Balance per Condensed Consolidated Statement of Operations |
|||||||||||||||
| Net sales |
$ | 162,777 | $ | 90,703 | $ | 46,914 | $ | — | $ | 300,394 | ||||||||||
| Gross profit |
103,473 | 43,208 | 19,259 | (729 | ) | 165,211 | ||||||||||||||
| Selling expenses |
87,711 | 5,936 | 13,038 | 2,029 | 108,714 | |||||||||||||||
| Operating income |
15,762 | 37,272 | 6,221 | (39,380 | ) | 19,875 | ||||||||||||||
| Interest and other expense, net |
— | — | — | (63,813 | ) | (63,813 | ) | |||||||||||||
|
|
|
|||||||||||||||||||
| Loss from continuing operations before benefit from income taxes |
$ | (43,938 | ) | |||||||||||||||||
|
|
|
|||||||||||||||||||
| Holding Corp. |
||||||||||||||||||||
| Twenty-Six Weeks June 29, 2013 | Retail | Wholesale | International | Unallocated/ Corporate/ Other |
Balance per Condensed Consolidated Statement of Operations |
|||||||||||||||
| Net sales |
$ | 176,026 | $ | 85,096 | $ | 57,934 | $ | — | $ | 319,056 | ||||||||||
| Gross profit |
110,144 | 41,407 | 23,297 | (600 | ) | 174,248 | ||||||||||||||
| Selling expenses |
91,086 | 6,019 | 15,468 | 969 | 113,542 | |||||||||||||||
| Operating income |
19,058 | 35,388 | 7,829 | (42,503 | ) | 19,772 | ||||||||||||||
| Interest and other expense, net |
— | — | — | (29,107 | ) | (29,107 | ) | |||||||||||||
|
|
|
|||||||||||||||||||
| Loss from continuing operations before benefit from income taxes |
$ | (9,335 | ) | |||||||||||||||||
|
|
|
|||||||||||||||||||
| Twenty-Six Weeks June 30, 2012 | Retail | Wholesale | International | Unallocated/ Corporate/ Other |
Balance per Condensed Consolidated Statement of Operations |
|||||||||||||||
| Net sales |
$ | 162,777 | $ | 90,703 | $ | 46,914 | $ | — | $ | 300,394 | ||||||||||
| Gross profit |
103,473 | 43,208 | 19,259 | (729 | ) | 165,211 | ||||||||||||||
| Selling expenses |
87,711 | 5,936 | 13,038 | 2,029 | 108,714 | |||||||||||||||
| Operating income |
15,762 | 37,272 | 6,221 | (39,335 | ) | 19,920 | ||||||||||||||
| Interest and other expense, net |
— | — | — | (46,336 | ) | (46,336 | ) | |||||||||||||
|
|
|
|||||||||||||||||||
| Loss from continuing operations before benefit from income taxes |
$ | (26,416 | ) | |||||||||||||||||
|
|
|
|||||||||||||||||||
11. COMMITMENTS AND CONTINGENCIES
The Companies are engaged in various lawsuits, either as plaintiff or defendant. In the opinion of management, the ultimate outcome of these lawsuits will not have a material adverse effect on the Companies’ financial condition, results of operations or cash flows.
12. FINANCIAL INFORMATION RELATED TO GUARANTOR SUBSIDIARIES UNDER YANKEE CANDLE’S SENIOR NOTES AND SENIOR SUBORDINATED NOTES
In April 2012, $315.0 million of Yankee Candle’s Senior Notes due 2015 were redeemed in connection with the refinancing of the Senior Secured Credit Facility as detailed in our most recent Form 10-K. During the first quarter of 2013, Yankee Candle redeemed the remaining $10.0 million in aggregate principal amount of its Senior Notes at par. Because all of the Senior Notes have been redeemed, the obligations of Yankee Candle and the guarantors under the related indenture have been discharged.
Obligations under the senior subordinated notes are guaranteed on an unsecured senior subordinated basis by Holding Corp. and 100% of Yankee Candle’s existing and future domestic subsidiaries (the “Guarantor Subsidiaries” and collectively with the Holding Corp., the “Guarantors”). Yankee Candle’s foreign subsidiaries did not guarantee the senior subordinated notes.
The following tables present condensed consolidating supplementary financial information for Yankee Candle, as the issuer of the senior subordinated notes, Holding Corp., Yankee Candle’s domestic guarantor subsidiaries and the non guarantor subsidiaries together with eliminations as of and for the periods indicated. Holding Corp. is also a guarantor of the senior subordinated notes. Separate complete financial statements of the respective Guarantors would not provide additional material information that would be useful in assessing the financial composition of the Guarantors.
Condensed consolidating financial information is as follows:
YANKEE HOLDING CORP. AND SUBSIDIARIES
CONDENSED CONSOLIDATING BALANCE SHEETS
June 29, 2013
(in thousands)
| Holding Corp. |
Issuer | Guarantor Subsidiaries |
Non Guarantor Subsidiaries |
Intercompany Eliminations |
Consolidated | |||||||||||||||||||
| ASSETS | ||||||||||||||||||||||||
| CURRENT ASSETS: |
||||||||||||||||||||||||
| Cash |
$ | — | $ | 689 | $ | 219 | $ | 2,876 | $ | — | $ | 3,784 | ||||||||||||
| Accounts receivable, net |
— | 30,243 | 23 | 22,058 | — | 52,324 | ||||||||||||||||||
| Inventory |
— | 86,629 | 74 | 21,581 | — | 108,284 | ||||||||||||||||||
| Prepaid expenses and other current assets |
— | 24,293 | 49 | 2,371 | — | 26,713 | ||||||||||||||||||
| Deferred tax assets |
— | 8,163 | 39 | 362 | — | 8,564 | ||||||||||||||||||
|
|
|
|
|
|
|
|
|
|
|
|
|
|||||||||||||
| TOTAL CURRENT ASSETS |
— | 150,017 | 404 | 49,248 | — | 199,669 | ||||||||||||||||||
| PROPERTY AND EQUIPMENT, NET |
— | 117,230 | 121 | 10,763 | — | 128,114 | ||||||||||||||||||
| GOODWILL |
— | 643,570 | — | — | — | 643,570 | ||||||||||||||||||
| INTANGIBLE ASSETS, NET |
— | 267,861 | — | 9 | — | 267,870 | ||||||||||||||||||
| DEFERRED FINANCING COSTS |
— | 11,399 | — | — | — | 11,399 | ||||||||||||||||||
| OTHER ASSETS |
— | 3,034 | — | 5 | — | 3,039 | ||||||||||||||||||
| INTERCOMPANY RECEIVABLES |
— | 49,761 | 717 | — | (50,478 | ) | — | |||||||||||||||||
| INVESTMENT IN SUBSIDIARIES |
135,295 | (2,068 | ) | — | — | (133,227 | ) | — | ||||||||||||||||
|
|
|
|
|
|
|
|
|
|
|
|
|
|||||||||||||
| TOTAL ASSETS |
$ | 135,295 | $ | 1,240,804 | $ | 1,242 | $ | 60,025 | $ | (183,705 | ) | $ | 1,253,661 | |||||||||||
|
|
|
|
|
|
|
|
|
|
|
|
|
|||||||||||||
| LIABILITIES AND STOCKHOLDER’S EQUITY |
||||||||||||||||||||||||
| CURRENT LIABILITIES: |
||||||||||||||||||||||||
| Accounts payable |
$ | — | $ | 20,732 | $ | 34 | $ | 2,886 | $ | — | $ | 23,652 | ||||||||||||
| Accrued payroll |
— | 8,268 | 107 | 674 | — | 9,049 | ||||||||||||||||||
| Accrued interest |
— | 7,077 | — | — | — | 7,077 | ||||||||||||||||||
| Accrued purchases of property and equipment |
— | 4,950 | — | 107 | — | 5,057 | ||||||||||||||||||
| Current portion of capital leases |
— | 1,237 | — | 472 | — | 1,709 | ||||||||||||||||||
| Other accrued liabilities |
— | 26,080 | 1,255 | 5,704 | — | 33,039 | ||||||||||||||||||
|
|
|
|
|
|
|
|
|
|
|
|
|
|||||||||||||
| TOTAL CURRENT LIABILITIES |
— | 68,344 | 1,396 | 9,843 | — | 79,583 | ||||||||||||||||||
| DEFERRED TAX LIABILITIES |
— | 118,346 | — | — | — | 118,346 | ||||||||||||||||||
| LONG-TERM DEBT |
— | 896,821 | — | — | — | 896,821 | ||||||||||||||||||
| DEFERRED RENT |
— | 13,106 | — | 148 | — | 13,254 | ||||||||||||||||||
| CAPITAL LEASES, NET OF CURRENT PORTION |
— | 1,537 | — | 1,470 | — | 3,007 | ||||||||||||||||||
| OTHER LONG-TERM LIABILITIES |
— | 7,355 | — | — | — | 7,355 | ||||||||||||||||||
| INTERCOMPANY PAYABLES |
— | — | — | 50,478 | (50,478 | ) | — | |||||||||||||||||
| STOCKHOLDER’S EQUITY |
135,295 | 135,295 | (154 | ) | (1,914 | ) | (133,227 | ) | 135,295 | |||||||||||||||
|
|
|
|
|
|
|
|
|
|
|
|
|
|||||||||||||
| TOTAL LIABILITIES AND STOCKHOLDER’S EQUITY |
$ | 135,295 | $ | 1,240,804 | $ | 1,242 | $ | 60,025 | $ | (183,705 | ) | $ | 1,253,661 | |||||||||||
|
|
|
|
|
|
|
|
|
|
|
|
|
|||||||||||||
YANKEE HOLDING CORP. AND SUBSIDIARIES
CONDENSED CONSOLIDATING BALANCE SHEETS
December 29, 2012
(in thousands)
| Holding Corp. |
Issuer | Guarantor Subsidiaries |
Non Guarantor Subsidiaries |
Intercompany Eliminations |
Consolidated | |||||||||||||||||||
| ASSETS | ||||||||||||||||||||||||
| CURRENT ASSETS: |
||||||||||||||||||||||||
| Cash |
$ | — | $ | 32,678 | $ | 2,122 | $ | 5,179 | $ | — | $ | 39,979 | ||||||||||||
| Accounts receivable, net |
— | 32,767 | 48 | 30,757 | — | 63,572 | ||||||||||||||||||
| Inventory |
— | 61,566 | 95 | 16,308 | — | 77,969 | ||||||||||||||||||
| Prepaid expenses and other current assets |
— | 3,714 | 47 | 1,121 | — | 4,882 | ||||||||||||||||||
| Deferred tax assets |
— | 6,518 | 33 | 263 | — | 6,814 | ||||||||||||||||||
|
|
|
|
|
|
|
|
|
|
|
|
|
|||||||||||||
| TOTAL CURRENT ASSETS |
— | 137,243 | 2,345 | 53,628 | — | 193,216 | ||||||||||||||||||
| PROPERTY AND EQUIPMENT, NET |
— | 111,604 | 135 | 9,814 | — | 121,553 | ||||||||||||||||||
| GOODWILL |
— | 643,570 | — | — | — | 643,570 | ||||||||||||||||||
| INTANGIBLE ASSETS, NET |
— | 267,966 | — | 67 | — | 268,033 | ||||||||||||||||||
| DEFERRED FINANCING COSTS |
— | 12,799 | — | — | — | 12,799 | ||||||||||||||||||
| OTHER ASSETS |
— | 2,320 | — | 6 | — | 2,326 | ||||||||||||||||||
| INTERCOMPANY RECEIVABLES |
— | 42,822 | — | — | (42,822 | ) | — | |||||||||||||||||
| INVESTMENT IN SUBSIDIARIES |
154,130 | 4,730 | — | — | (158,860 | ) | — | |||||||||||||||||
|
|
|
|
|
|
|
|
|
|
|
|
|
|||||||||||||
| TOTAL ASSETS |
$ | 154,130 | $ | 1,223,054 | $ | 2,480 | $ | 63,515 | $ | (201,682 | ) | $ | 1,241,497 | |||||||||||
|
|
|
|
|
|
|
|
|
|
|
|
|
|||||||||||||
| LIABILITIES AND STOCKHOLDER’S EQUITY |
||||||||||||||||||||||||
| CURRENT LIABILITIES: |
||||||||||||||||||||||||
| Accounts payable |
$ | — | $ | 20,787 | $ | 34 | $ | 4,488 | $ | — | $ | 25,309 | ||||||||||||
| Accrued payroll |
— | 12,824 | 26 | 830 | — | 13,680 | ||||||||||||||||||
| Accrued interest |
— | 10,614 | — | — | — | 10,614 | ||||||||||||||||||
| Accrued income taxes |
— | 6,457 | — | 653 | — | 7,110 | ||||||||||||||||||
| Accrued purchases of property and equipment |
— | 3,434 | — | — | — | 3,434 | ||||||||||||||||||
| Current portion of capital leases |
— | 1,222 | — | 439 | — | 1,661 | ||||||||||||||||||
| Other accrued liabilities |
— | 29,470 | 2,233 | 7,983 | — | 39,686 | ||||||||||||||||||
|
|
|
|
|
|
|
|
|
|
|
|
|
|||||||||||||
| TOTAL CURRENT LIABILITIES |
— | 84,808 | 2,293 | 14,393 | — | 101,494 | ||||||||||||||||||
| DEFERRED TAX LIABILITIES |
— | 117,135 | — | — | — | 117,135 | ||||||||||||||||||
| LONG-TERM DEBT |
— | 846,174 | — | — | — | 846,174 | ||||||||||||||||||
| DEFERRED RENT |
— | 12,748 | — | 138 | — | 12,886 | ||||||||||||||||||
| CAPITAL LEASES, NET OF CURRENT PORTION |
— | 2,148 | — | 1,619 | — | 3,767 | ||||||||||||||||||
| OTHER LONG-TERM LIABILITIES |
— | 5,911 | — | — | — | 5,911 | ||||||||||||||||||
| INTERCOMPANY PAYABLES |
— | — | 92 | 42,730 | (42,822 | ) | — | |||||||||||||||||
| STOCKHOLDER’S EQUITY |
154,130 | 154,130 | 95 | 4,635 | (158,860 | ) | 154,130 | |||||||||||||||||
|
|
|
|
|
|
|
|
|
|
|
|
|
|||||||||||||
| TOTAL LIABILITIES AND STOCKHOLDER’S EQUITY |
$ | 154,130 | $ | 1,223,054 | $ | 2,480 | $ | 63,515 | $ | (201,682 | ) | $ | 1,241,497 | |||||||||||
|
|
|
|
|
|
|
|
|
|
|
|
|
|||||||||||||
YANKEE HOLDING CORP. AND SUBSIDIARIES
CONDENSED CONSOLIDATING STATEMENTS OF OPERATIONS
For the Thirteen Weeks Ended June 29, 2013
(in thousands)
| Holding Corp. |
Issuer | Guarantor Subsidiaries |
Non Guarantor Subsidiaries |
Intercompany Eliminations |
Consolidated | |||||||||||||||||||
| Net sales |
$ | — | $ | 147,242 | $ | 505 | $ | 25,951 | $ | (18,018 | ) | $ | 155,680 | |||||||||||
| Cost of sales |
— | 64,746 | 199 | 22,522 | (15,601 | ) | 71,866 | |||||||||||||||||
|
|
|
|
|
|
|
|
|
|
|
|
|
|||||||||||||
| Gross profit |
— | 82,496 | 306 | 3,429 | (2,417 | ) | 83,814 | |||||||||||||||||
| Selling expenses |
— | 47,999 | 474 | 7,653 | (60 | ) | 56,066 | |||||||||||||||||
| General and administrative expenses |
— | 20,631 | — | 42 | 39 | 20,712 | ||||||||||||||||||
|
|
|
|
|
|
|
|
|
|
|
|
|
|||||||||||||
| Operating income (loss) |
— | 13,866 | (168 | ) | (4,266 | ) | (2,396 | ) | 7,036 | |||||||||||||||
| Interest expense |
— | 14,854 | — | 29 | — | 14,883 | ||||||||||||||||||
| Other loss (income) |
— | 4,622 | — | (5,091 | ) | — | (469 | ) | ||||||||||||||||
|
|
|
|
|
|
|
|
|
|
|
|
|
|||||||||||||
| (Loss) income before (benefit from) provision for income taxes |
— | (5,610 | ) | (168 | ) | 796 | (2,396 | ) | (7,378 | ) | ||||||||||||||
| (Benefit from) provision for income taxes |
— | (1,205 | ) | (60 | ) | 185 | (1,441 | ) | (2,521 | ) | ||||||||||||||
|
|
|
|
|
|
|
|
|
|
|
|
|
|||||||||||||
| (Loss) income from continuing operations |
— | (4,405 | ) | (108 | ) | 611 | (955 | ) | (4,857 | ) | ||||||||||||||
| Loss from discontinued operations, net of income taxes |
— | (21 | ) | — | — | — | (21 | ) | ||||||||||||||||
|
|
|
|
|
|
|
|
|
|
|
|
|
|||||||||||||
| (Loss) income before equity in losses of subsidiaries, net of tax |
— | (4,426 | ) | (108 | ) | 611 | (955 | ) | (4,878 | ) | ||||||||||||||
| Equity in losses of subsidiaries, net of tax |
4,878 | (503 | ) | — | — | (4,375 | ) | — | ||||||||||||||||
|
|
|
|
|
|
|
|
|
|
|
|
|
|||||||||||||
| Net (loss) income |
$ | (4,878 | ) | $ | (3,923 | ) | $ | (108 | ) | $ | 611 | $ | 3,420 | $ | (4,878 | ) | ||||||||
|
|
|
|
|
|
|
|
|
|
|
|
|
|||||||||||||
YANKEE HOLDING CORP. AND SUBSIDIARIES
CONDENSED CONSOLIDATING STATEMENTS OF OPERATIONS
For the Thirteen Weeks Ended June 30, 2012
(in thousands)
| Holding Corp. |
Issuer | Guarantor Subsidiaries |
Non Guarantor Subsidiaries |
Intercompany Eliminations |
Consolidated | |||||||||||||||||||
| Sales |
$ | — | $ | 144,836 | $ | 547 | $ | 22,205 | $ | (22,261 | ) | $ | 145,327 | |||||||||||
| Cost of sales |
— | 62,672 | 162 | 18,620 | (17,548 | ) | 63,906 | |||||||||||||||||
|
|
|
|
|
|
|
|
|
|
|
|
|
|||||||||||||
| Gross profit |
— | 82,164 | 385 | 3,585 | (4,713 | ) | 81,421 | |||||||||||||||||
| Selling expenses |
— | 45,562 | 484 | 7,245 | (60 | ) | 53,231 | |||||||||||||||||
| General and administrative expenses |
— | 17,873 | — | 41 | 37 | 17,951 | ||||||||||||||||||
| Restructuring charges |
— | — | — | 1,070 | — | 1,070 | ||||||||||||||||||
|
|
|
|
|
|
|
|
|
|
|
|
|
|||||||||||||
| Operating income (loss) |
— | 18,729 | (99 | ) | (4,771 | ) | (4,690 | ) | 9,169 | |||||||||||||||
| Interest expense |
— | 18,536 | — | 17 | — | 18,553 | ||||||||||||||||||
| Loss on extinguishment of debt |
— | 13,376 | — | — | — | 13,376 | ||||||||||||||||||
| Other expense (income) |
— | 1,089 | — | (2,824 | ) | — | (1,735 | ) | ||||||||||||||||
|
|
|
|
|
|
|
|
|
|
|
|
|
|||||||||||||
| Loss before benefit from income taxes |
— | (14,272 | ) | (99 | ) | (1,964 | ) | (4,690 | ) | (21,025 | ) | |||||||||||||
| Benefit from income taxes |
— | (5,309 | ) | (38 | ) | (493 | ) | (1,675 | ) | (7,515 | ) | |||||||||||||
|
|
|
|
|
|
|
|
|
|
|
|
|
|||||||||||||
| Loss from continuing operations |
— | (8,963 | ) | (61 | ) | (1,471 | ) | (3,015 | ) | (13,510 | ) | |||||||||||||
| Loss from discontinued operations, net of income taxes |
— | (31 | ) | — | — | — | (31 | ) | ||||||||||||||||
|
|
|
|
|
|
|
|
|
|
|
|
|
|||||||||||||
| Loss before equity in losses (earnings) of subsidiaries, net of tax |
— | (8,994 | ) | (61 | ) | (1,471 | ) | (3,015 | ) | (13,541 | ) | |||||||||||||
| Equity in losses (earnings) of subsidiaries, net of tax |
13,541 | 1,532 | — | — | (15,073 | ) | — | |||||||||||||||||
|
|
|
|
|
|
|
|
|
|
|
|
|
|||||||||||||
| Net (loss) income |
$ | (13,541 | ) | $ | (10,526 | ) | $ | (61 | ) | $ | (1,471 | ) | $ | 12,058 | $ | (13,541 | ) | |||||||
|
|
|
|
|
|
|
|
|
|
|
|
|
|||||||||||||
YANKEE HOLDING CORP. AND SUBSIDIARIES
CONDENSED CONSOLIDATING STATEMENTS OF COMPREHENSIVE LOSS
For the Thirteen Weeks Ended June 29, 2013
(in thousands)
| Holding Corp. |
Issuer | Guarantor Subsidiaries |
Non Guarantor Subsidiaries |
Intercompany Eliminations |
Consolidated | |||||||||||||||||||
| Net (loss) income |
$ | (4,878 | ) | $ | (3,923 | ) | $ | (108 | ) | $ | 611 | $ | 3,420 | $ | (4,878 | ) | ||||||||
| Other comprehensive income: |
||||||||||||||||||||||||
| Foreign currency translation adjustments |
— | — | — | 209 | — | 209 | ||||||||||||||||||
|
|
|
|
|
|
|
|
|
|
|
|
|
|||||||||||||
| Other comprehensive income |
— | — | — | 209 | — | 209 | ||||||||||||||||||
| Equity in other comprehensive income of subsidiaries |
209 | — | — | — | (209 | ) | — | |||||||||||||||||
|
|
|
|
|
|
|
|
|
|
|
|
|
|||||||||||||
| Comprehensive (loss) income |
$ | (4,669 | ) | $ | (3,923 | ) | $ | (108 | ) | $ | 820 | $ | 3,211 | $ | (4,669 | ) | ||||||||
|
|
|
|
|
|
|
|
|
|
|
|
|
|||||||||||||
YANKEE HOLDING CORP. AND SUBSIDIARIES
CONDENSED CONSOLIDATING STATEMENTS OF COMPREHENSIVE LOSS
For the Thirteen Weeks Ended June 30, 2012
(in thousands)
| Holding Corp. |
Issuer | Guarantor Subsidiaries |
Non Guarantor Subsidiaries |
Intercompany Eliminations |
Consolidated | |||||||||||||||||||
| Net (loss) income |
$ | (13,541 | ) | $ | (10,526 | ) | $ | (61 | ) | $ | (1,471 | ) | $ | 12,058 | $ | (13,541 | ) | |||||||
| Other comprehensive loss: |
||||||||||||||||||||||||
| Foreign currency translation adjustments |
— | — | — | (675 | ) | — | (675 | ) | ||||||||||||||||
|
|
|
|
|
|
|
|
|
|
|
|
|
|||||||||||||
| Other comprehensive loss |
— | — | — | (675 | ) | — | (675 | ) | ||||||||||||||||
| Equity in other comprehensive loss of subsidiaries |
(675 | ) | — | — | — | 675 | — | |||||||||||||||||
|
|
|
|
|
|
|
|
|
|
|
|
|
|||||||||||||
| Comprehensive (loss) income |
$ | (14,216 | ) | $ | (10,526 | ) | $ | (61 | ) | $ | (2,146 | ) | $ | 12,733 | $ | (14,216 | ) | |||||||
|
|
|
|
|
|
|
|
|
|
|
|
|
|||||||||||||
YANKEE HOLDING CORP. AND SUBSIDIARIES
CONDENSED CONSOLIDATING STATEMENTS OF OPERATIONS
For the Twenty-Six Weeks Ended June 29, 2013
(in thousands)
| Holding Corp. |
Issuer | Guarantor Subsidiaries |
Non Guarantor Subsidiaries |
Intercompany Eliminations |
Consolidated | |||||||||||||||||||
| Net sales |
$ | — | $ | 304,600 | $ | 986 | $ | 55,951 | $ | (42,481 | ) | $ | 319,056 | |||||||||||
| Cost of sales |
— | 133,248 | 331 | 46,979 | (35,750 | ) | 144,808 | |||||||||||||||||
|
|
|
|
|
|
|
|
|
|
|
|
|
|||||||||||||
| Gross profit |
— | 171,352 | 655 | 8,972 | (6,731 | ) | 174,248 | |||||||||||||||||
| Selling expenses |
— | 96,768 | 916 | 15,978 | (120 | ) | 113,542 | |||||||||||||||||
| General and administrative expenses |
— | 40,001 | — | 77 | 92 | 40,170 | ||||||||||||||||||
| Restructuring charges |
— | — | — | 764 | — | 764 | ||||||||||||||||||
|
|
|
|
|
|
|
|
|
|
|
|
|
|||||||||||||
| Operating income (loss) |
— | 34,583 | (261 | ) | (7,847 | ) | (6,703 | ) | 19,772 | |||||||||||||||
| Interest expense |
— | 31,282 | — | 75 | — | 31,357 | ||||||||||||||||||
| Other loss (income) |
— | 6,399 | — | (8,649 | ) | — | (2,250 | ) | ||||||||||||||||
|
|
|
|
|
|
|
|
|
|
|
|
|
|||||||||||||
| (Loss) income before (benefit from) provision for income taxes |
— | (3,098 | ) | (261 | ) | 727 | (6,703 | ) | (9,335 | ) | ||||||||||||||
| (Benefit from) provision for income taxes |
— | (875 | ) | (73 | ) | 169 | (1,990 | ) | (2,769 | ) | ||||||||||||||
|
|
|
|
|
|
|
|
|
|
|
|
|
|||||||||||||
| (Loss) income from continuing operations |
— | (2,223 | ) | (188 | ) | 558 | (4,713 | ) | (6,566 | ) | ||||||||||||||
| Loss from discontinued operations, net of income taxes |
— | (45 | ) | — | — | — | (45 | ) | ||||||||||||||||
|
|
|
|
|
|
|
|
|
|
|
|
|
|||||||||||||
| (Loss) income before equity in losses of subsidiaries, net of tax |
— | (2,268 | ) | (188 | ) | 558 | (4,713 | ) | (6,611 | ) | ||||||||||||||
| Equity in losses of subsidiaries, net of tax |
6,611 | (370 | ) | — | — | (6,241 | ) | — | ||||||||||||||||
|
|
|
|
|
|
|
|
|
|
|
|
|
|||||||||||||
| Net (loss) income |
$ | (6,611 | ) | $ | (1,898 | ) | $ | (188 | ) | $ | 558 | $ | 1,528 | $ | (6,611 | ) | ||||||||
|
|
|
|
|
|
|
|
|
|
|
|
|
|||||||||||||
YANKEE HOLDING CORP. AND SUBSIDIARIES
CONDENSED CONSOLIDATING STATEMENTS OF OPERATIONS
For the Twenty-Six Weeks Ended June 30, 2012
(in thousands)
| Holding Corp. |
Issuer | Guarantor Subsidiaries |
Non Guarantor Subsidiaries |
Intercompany Eliminations |
Consolidated | |||||||||||||||||||
| Sales |
$ | — | $ | 291,195 | $ | 1,048 | $ | 45,776 | $ | (37,625 | ) | $ | 300,394 | |||||||||||
| Cost of sales |
— | 128,648 | 335 | 37,480 | (31,280 | ) | 135,183 | |||||||||||||||||
|
|
|
|
|
|
|
|
|
|
|
|
|
|||||||||||||
| Gross profit |
— | 162,547 | 713 | 8,296 | (6,345 | ) | 165,211 | |||||||||||||||||
| Selling expenses |
— | 94,045 | 958 | 13,831 | (120 | ) | 108,714 | |||||||||||||||||
| General and administrative expenses |
— | 34,697 | — | 72 | 83 | 34,852 | ||||||||||||||||||
| Restructuring charges |
— | 655 | — | 1,070 | — | 1,725 | ||||||||||||||||||
|
|
|
|
|
|
|
|
|
|
|
|
|
|||||||||||||
| Operating income (loss) |
— | 33,150 | (245 | ) | (6,677 | ) | (6,308 | ) | 19,920 | |||||||||||||||
| Interest expense |
— | 35,753 | — | 34 | — | 35,787 | ||||||||||||||||||
| Loss on extinguishment of debt |
— | 13,376 | — | — | — | 13,376 | ||||||||||||||||||
| Other expense (income) |
— | 2,176 | — | (5,003 | ) | — | (2,827 | ) | ||||||||||||||||
|
|
|
|
|
|
|
|
|
|
|
|
|
|||||||||||||
| Loss before benefit from income taxes |
— | (18,155 | ) | (245 | ) | (1,708 | ) | (6,308 | ) | (26,416 | ) | |||||||||||||
| Benefit from income taxes |
— | (6,667 | ) | (90 | ) | (427 | ) | (2,252 | ) | (9,436 | ) | |||||||||||||
|
|
|
|
|
|
|
|
|
|
|
|
|
|||||||||||||
| Loss from continuing operations |
— | (11,488 | ) | (155 | ) | (1,281 | ) | (4,056 | ) | (16,980 | ) | |||||||||||||
| Loss from discontinued operations, net of income taxes |
— | (74 | ) | — | — | — | (74 | ) | ||||||||||||||||
|
|
|
|
|
|
|
|
|
|
|
|
|
|||||||||||||
| Loss before equity in losses (earnings) of subsidiaries, net of tax |
— | (11,562 | ) | (155 | ) | (1,281 | ) | (4,056 | ) | (17,054 | ) | |||||||||||||
| Equity in losses (earnings) of subsidiaries, net of tax |
17,054 | 1,436 | — | — | (18,490 | ) | — | |||||||||||||||||
|
|
|
|
|
|
|
|
|
|
|
|
|
|||||||||||||
| Net (loss) income |
$ | (17,054 | ) | $ | (12,998 | ) | $ | (155 | ) | $ | (1,281 | ) | $ | 14,434 | $ | (17,054 | ) | |||||||
|
|
|
|
|
|
|
|
|
|
|
|
|
|||||||||||||
YANKEE HOLDING CORP. AND SUBSIDIARIES
CONDENSED CONSOLIDATING STATEMENTS OF COMPREHENSIVE LOSS
For the Twenty-Six Weeks Ended June 29, 2013
(in thousands)
| Holding Corp. |
Issuer | Guarantor Subsidiaries |
Non Guarantor Subsidiaries |
Intercompany Eliminations |
Consolidated | |||||||||||||||||||
| Net (loss) income |
$ | (6,611 | ) | $ | (1,898 | ) | $ | (188 | ) | $ | 558 | $ | 1,528 | $ | (6,611 | ) | ||||||||
| Other comprehensive loss: |
||||||||||||||||||||||||
| Foreign currency translation adjustments |
— | — | — | (2,319 | ) | — | (2,319 | ) | ||||||||||||||||
|
|
|
|
|
|
|
|
|
|
|
|
|
|||||||||||||
| Other comprehensive loss |
— | — | — | (2,319 | ) | — | (2,319 | ) | ||||||||||||||||
| Equity in other comprehensive loss of subsidiaries |
(2,319 | ) | — | — | — | 2,319 | — | |||||||||||||||||
|
|
|
|
|
|
|
|
|
|
|
|
|
|||||||||||||
| Comprehensive (loss) income |
$ | (8,930 | ) | $ | (1,898 | ) | $ | (188 | ) | $ | (1,761 | ) | $ | 3,847 | $ | (8,930 | ) | |||||||
|
|
|
|
|
|
|
|
|
|
|
|
|
|||||||||||||
YANKEE HOLDING CORP. AND SUBSIDIARIES
CONDENSED CONSOLIDATING STATEMENTS OF COMPREHENSIVE LOSS
For the Twenty-Six Weeks Ended June 30, 2012
(in thousands)
| Holding Corp. |
Issuer | Guarantor Subsidiaries |
Non Guarantor Subsidiaries |
Intercompany Eliminations |
Consolidated | |||||||||||||||||||
| Net (loss) income |
$ | (17,054 | ) | $ | (12,998 | ) | $ | (155 | ) | $ | (1,281 | ) | $ | 14,434 | $ | (17,054 | ) | |||||||
| Other comprehensive income: |
||||||||||||||||||||||||
| Foreign currency translation adjustments |
— | — | — | 403 | — | 403 | ||||||||||||||||||
|
|
|
|
|
|
|
|
|
|
|
|
|
|||||||||||||
| Other comprehensive income |
— | — | — | 403 | — | 403 | ||||||||||||||||||
| Equity in other comprehensive income of subsidiaries |
403 | — | — | — | (403 | ) | — | |||||||||||||||||
|
|
|
|
|
|
|
|
|
|
|
|
|
|||||||||||||
| Comprehensive (loss) income |
$ | (16,651 | ) | $ | (12,998 | ) | $ | (155 | ) | $ | (878 | ) | $ | 14,031 | $ | (16,651 | ) | |||||||
|
|
|
|
|
|
|
|
|
|
|
|
|
|||||||||||||
YANKEE HOLDING CORP. AND SUBSIDIARIES
CONDENSED CONSOLIDATING STATEMENTS OF CASH FLOWS
For the Twenty-Six Weeks Ended June 29, 2013
(in thousands)
| Holding Corp. |
Issuer | Guarantor Subsidiaries |
Non Guarantor Subsidiaries |
Intercompany Eliminations |
Consolidated | |||||||||||||||||||
| CASH FLOWS PROVIDED BY (USED IN) OPERATING ACTIVITIES: |
||||||||||||||||||||||||
| Net (loss) income |
$ | (6,611 | ) | $ | (1,898 | ) | $ | (188 | ) | $ | 558 | $ | 1,528 | $ | (6,611 | ) | ||||||||
| Adjustments to reconcile net (loss) income to net cash used in operating activities: |
||||||||||||||||||||||||
| Realized gain on derivative contracts |
— | (1,757 | ) | — | — | — | (1,757 | ) | ||||||||||||||||
| Depreciation and amortization |
— | 13,996 | 13 | 1,124 | — | 15,133 | ||||||||||||||||||
| Unrealized gain on marketable securities |
— | (135 | ) | — | — | — | (135 | ) | ||||||||||||||||
| Equity-based compensation expense |
— | 324 | — | — | — | 324 | ||||||||||||||||||
| Deferred taxes |
— | 155 | (6 | ) | (99 | ) | — | 50 | ||||||||||||||||
| Loss on extinguishment of debt |
— | 77 | — | — | — | 77 | ||||||||||||||||||
| Loss on disposal and impairment of property and equipment |
— | 273 | — | — | — | 273 | ||||||||||||||||||
| Equity in (earnings) losses of subsidiaries |
6,611 | (370 | ) | — | (4,713 | ) | (1,528 | ) | — | |||||||||||||||
| Changes in assets and liabilities: |
||||||||||||||||||||||||
| Accounts receivable |
— | 2,524 | 25 | 7,330 | — | 9,879 | ||||||||||||||||||
| Inventory |
— | (25,063 | ) | 21 | (6,741 | ) | — | (31,783 | ) | |||||||||||||||
| Prepaid expenses and other assets |
— | (9,652 | ) | (2 | ) | (1,316 | ) | — | (10,970 | ) | ||||||||||||||
| Accounts payable |
— | (55 | ) | — | (1,408 | ) | — | (1,463 | ) | |||||||||||||||
| Income taxes |
— | (10,689 | ) | — | (670 | ) | — | (11,359 | ) | |||||||||||||||
| Accrued expenses and other liabilities |
— | (8,787 | ) | (897 | ) | (2,034 | ) | — | (11,718 | ) | ||||||||||||||
|
|
|
|
|
|
|
|
|
|
|
|
|
|||||||||||||
| NET CASH USED IN OPERATING ACTIVITIES |
— | (41,057 | ) | (1,034 | ) | (7,969 | ) | — | (50,060 | ) | ||||||||||||||
|
|
|
|
|
|
|
|
|
|
|
|
|
|||||||||||||
| CASH FLOWS USED IN INVESTING ACTIVITIES: |
||||||||||||||||||||||||
| Purchases of property and equipment |
— | (16,272 | ) | — | (2,221 | ) | — | (18,493 | ) | |||||||||||||||
| Intercompany payables/receivables |
— | (7,390 | ) | — | — | 7,390 | — | |||||||||||||||||
|
|
|
|
|
|
|
|
|
|
|
|
|
|||||||||||||
| NET CASH USED IN INVESTING ACTIVITIES |
— | (23,662 | ) | — | (2,221 | ) | 7,390 | (18,493 | ) | |||||||||||||||
|
|
|
|
|
|
|
|
|
|
|
|
|
|||||||||||||
| CASH FLOWS PROVIDED BY FINANCING ACTIVITIES: |
||||||||||||||||||||||||
| Borrowings under Senior Secured Asset-Based Credit Facility |
— | 60,000 | — | — | — | 60,000 | ||||||||||||||||||
| Repayments under Senior Notes |
— | (10,000 | ) | — | — | — | (10,000 | ) | ||||||||||||||||
| Dividend to YCC Holdings LLC |
— | (16,189 | ) | — | — | — | (16,189 | ) | ||||||||||||||||
| Repurchase of common stock |
— | (484 | ) | — | — | — | (484 | ) | ||||||||||||||||
| Principal payments on capital lease obligations |
— | (597 | ) | — | (177 | ) | — | (774 | ) | |||||||||||||||
| Intercompany payables/receivables |
— | — | (869 | ) | 8,259 | (7,390 | ) | — | ||||||||||||||||
|
|
|
|
|
|
|
|
|
|
|
|
|
|||||||||||||
| NET CASH PROVIDED BY FINANCING ACTIVITIES |
— | 32,730 | (869 | ) | 8,082 | (7,390 | ) | 32,553 | ||||||||||||||||
|
|
|
|
|
|
|
|
|
|
|
|
|
|||||||||||||
| EFFECT OF EXCHANGE RATE CHANGES ON CASH |
— | — | — | (195 | ) | — | (195 | ) | ||||||||||||||||
|
|
|
|
|
|
|
|
|
|
|
|
|
|||||||||||||
| NET DECREASE IN CASH |
— | (31,989 | ) | (1,903 | ) | (2,303 | ) | — | (36,195 | ) | ||||||||||||||
|
|
|
|
|
|
|
|
|
|
|
|
|
|||||||||||||
| CASH, BEGINNING OF PERIOD |
— | 32,678 | 2,122 | 5,179 | — | 39,979 | ||||||||||||||||||
|
|
|
|
|
|
|
|
|
|
|
|
|
|||||||||||||
| CASH, END OF PERIOD |
$ | — | $ | 689 | $ | 219 | $ | 2,876 | $ | — | $ | 3,784 | ||||||||||||
|
|
|
|
|
|
|
|
|
|
|
|
|
|||||||||||||
YANKEE HOLDING CORP. AND SUBSIDIARIES
CONDENSED CONSOLIDATING STATEMENTS OF CASH FLOWS
For the Twenty-Six Weeks Ended June 30, 2012
(in thousands)
| Holding Corp. |
Issuer | Guarantor Subsidiaries |
Non Guarantor Subsidiaries |
Intercompany Eliminations |
Consolidated | |||||||||||||||||||
| CASH FLOWS USED IN OPERATING ACTIVITIES: |
||||||||||||||||||||||||
| Net (loss) income |
$ | (17,054 | ) | $ | (12,998 | ) | $ | (155 | ) | $ | (1,281 | ) | $ | 14,434 | $ | (17,054 | ) | |||||||
| Adjustments to reconcile net (loss) income to net cash used in operating activities: |
||||||||||||||||||||||||
| Realized gain on derivative contracts |
— | (3,741 | ) | — | — | — | (3,741 | ) | ||||||||||||||||
| Depreciation and amortization |
— | 15,721 | 12 | 589 | — | 16,322 | ||||||||||||||||||
| Unrealized gain on marketable securities |
— | (92 | ) | — | — | — | (92 | ) | ||||||||||||||||
| Equity-based compensation expense |
— | 424 | — | — | — | 424 | ||||||||||||||||||
| Deferred taxes |
— | 3,250 | 1 | (113 | ) | — | 3,138 | |||||||||||||||||
| Loss on extinguishment of debt |
— | 13,376 | — | — | — | 13,376 | ||||||||||||||||||
| Loss on disposal and impairment of property and equipment |
— | 37 | — | — | — | 37 | ||||||||||||||||||
| Restructuring charges |
— | — | — | 1,070 | — | 1,070 | ||||||||||||||||||
| Equity in losses (earnings) of subsidiaries |
17,054 | 1,436 | — | (4,056 | ) | (14,434 | ) | — | ||||||||||||||||
| Changes in assets and liabilities: |
||||||||||||||||||||||||
| Accounts receivable |
— | 11,148 | 35 | 6,510 | — | 17,693 | ||||||||||||||||||
| Inventory |
— | (21,646 | ) | 2 | (12,082 | ) | — | (33,726 | ) | |||||||||||||||
| Prepaid expenses and other assets |
— | (5,596 | ) | (10 | ) | (505 | ) | — | (6,111 | ) | ||||||||||||||
| Accounts payable |
— | (1,219 | ) | (82 | ) | 1,107 | — | (194 | ) | |||||||||||||||
| Income taxes |
— | (20,453 | ) | — | 232 | — | (20,221 | ) | ||||||||||||||||
| Accrued expenses and other liabilities |
— | (10,356 | ) | (589 | ) | 531 | — | (10,414 | ) | |||||||||||||||
|
|
|
|
|
|
|
|
|
|
|
|
|
|||||||||||||
| NET CASH USED IN OPERATING ACTIVITIES |
— | (30,709 | ) | (786 | ) | (7,998 | ) | — | (39,493 | ) | ||||||||||||||
|
|
|
|
|
|
|
|
|
|
|
|
|
|||||||||||||
| CASH FLOWS USED IN INVESTING ACTIVITIES: |
||||||||||||||||||||||||
| Purchases of property and equipment |
— | (11,313 | ) | (29 | ) | (3,527 | ) | — | (14,869 | ) | ||||||||||||||
| Intercompany payables/receivables |
— | (10,190 | ) | — | — | 10,190 | — | |||||||||||||||||
|
|
|
|
|
|
|
|
|
|
|
|
|
|||||||||||||
| NET CASH USED IN INVESTING ACTIVITIES |
— | (21,503 | ) | (29 | ) | (3,527 | ) | 10,190 | (14,869 | ) | ||||||||||||||
|
|
|
|
|
|
|
|
|
|
|
|
|
|||||||||||||
| CASH FLOWS PROVIDED BY (USED IN) FINANCING ACTIVITIES: |
||||||||||||||||||||||||
| Borrowings under Senior Secured Credit Facility |
— | 15,000 | — | — | — | 15,000 | ||||||||||||||||||
| Borrowings under Asset-Based Credit Facility |
— | 32,000 | — | — | — | 32,000 | ||||||||||||||||||
| Borrowings under Term Loan Facility |
717,750 | — | — | — | 717,750 | |||||||||||||||||||
| Repayments under Senior Secured Credit Facility |
— | (718,125 | ) | — | — | — | (718,125 | ) | ||||||||||||||||
| Payments of call premiums and fees for extinguishment of debt |
(6,763 | ) | — | — | — | (6,763 | ) | |||||||||||||||||
| Repayments under Term Loan Facility |
(1,812 | ) | — | — | — | (1,812 | ) | |||||||||||||||||
| Financing costs |
— | (11,579 | ) | — | — | — | (11,579 | ) | ||||||||||||||||
| Dividend to YCC Holdings LLC |
— | (16,195 | ) | — | — | — | (16,195 | ) | ||||||||||||||||
| Proceeds from issuance of common stock |
— | 17 | — | — | — | 17 | ||||||||||||||||||
| Repurchase of common stock |
— | (279 | ) | — | — | — | (279 | ) | ||||||||||||||||
| Principal payments on capital lease obligations |
— | (511 | ) | — | (154 | ) | — | (665 | ) | |||||||||||||||
| Intercompany payables/receivables |
— | — | 130 | 10,060 | (10,190 | ) | — | |||||||||||||||||
|
|
|
|
|
|
|
|
|
|
|
|
|
|||||||||||||
| NET CASH PROVIDED BY (USED IN) FINANCING ACTIVITIES |
— | 9,503 | 130 | 9,906 | (10,190 | ) | 9,349 | |||||||||||||||||
|
|
|
|
|
|
|
|
|
|
|
|
|
|||||||||||||
| EFFECT OF EXCHANGE RATE CHANGES ON CASH |
— | — | — | 10 | — | 10 | ||||||||||||||||||
|
|
|
|
|
|
|
|
|
|
|
|
|
|||||||||||||
| NET DECREASE IN CASH |
— | (42,709 | ) | (685 | ) | (1,609 | ) | — | (45,003 | ) | ||||||||||||||
|
|
|
|
|
|
|
|
|
|
|
|
|
|||||||||||||
| CASH, BEGINNING OF PERIOD |
— | 45,777 | 1,830 | 3,226 | — | 50,833 | ||||||||||||||||||
|
|
|
|
|
|
|
|
|
|
|
|
|
|||||||||||||
| CASH, END OF PERIOD |
$ | — | $ | 3,068 | $ | 1,145 | $ | 1,617 | $ | — | $ | 5,830 | ||||||||||||
|
|
|
|
|
|
|
|
|
|
|
|
|
|||||||||||||