Attached files
| file | filename |
|---|---|
| 8-K - FORM 8-K - Hillshire Brands Co | d591198d8k.htm |
 Barclays Back to School Conference
September 3, 2013
Sean Connolly, President & CEO
Maria Henry, EVP & CFO
Exhibit 99 |
 Forward-Looking
Statements We caution you that our remarks this morning contain forward-looking
statements about HSH’s future operations, financial performance, business conditions
and our outlook for FY14 and future fiscal years. These forward-looking
statements are based on currently available competitive, financial and economic data, as
well as management’s views and assumptions regarding future events. Such
forward-looking statements are inherently uncertain, and investors must recognize
that actual results may differ materially from those expressed or implied in these
statements. Consequently, we caution you not to place undue reliance on
forward-looking statements. We have provided additional information in our most
recent Form 10-K that we encourage you to review concerning factors that could cause
actual results to differ materially from those expressed or implied by our
forward-looking statements. This presentation includes certain non-GAAP financial
measures intended to supplement, not
substitute
for,
comparable
GAAP
measures.
Reconciliations
of
non-GAAP
financial
measures
to
GAAP
financial
measures
are
provided
in
the
Appendix
at
the
end
of
the
presentation. Investors are urged to consider carefully the comparable GAAP measures
and the reconciliations to those measures provided in the Appendix or on our website at
www.hillshirebrands.com.
1 |
 What We Want You to
Take Away From Today We have a terrific portfolio of leading, iconic brands
We compete in attractive categories
We expect to grow through disciplined investments in
brand building and innovation
We will fuel our growth through rigorous cost
management
We will pursue targeted M&A opportunities to further
accelerate our growth
We have the potential to deliver significant
shareholder returns
2 |
 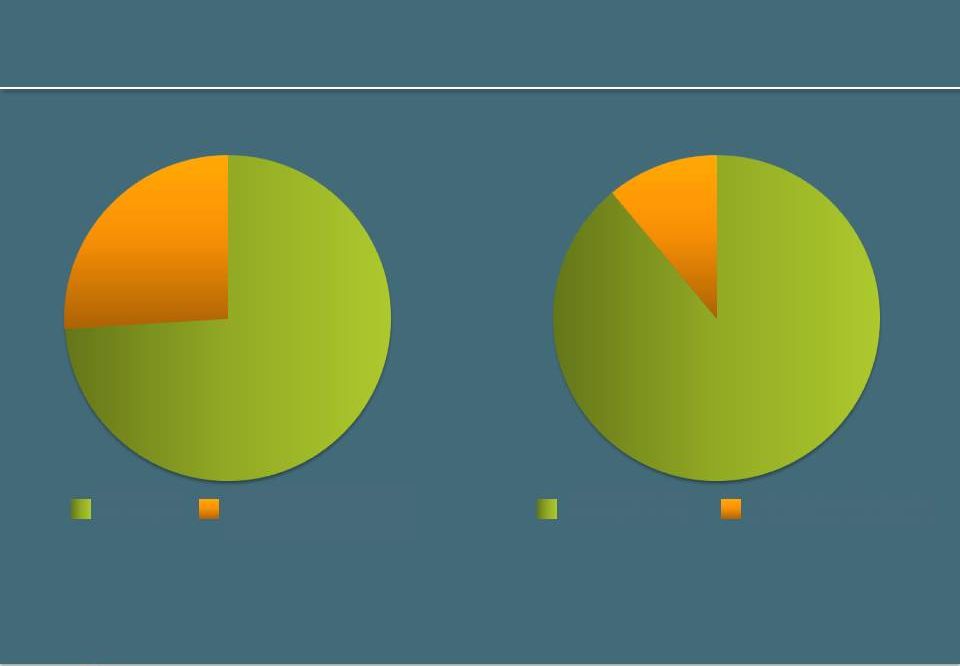  $4B Revenue North
American, Focused Food Company
3
Source: Company Financial Statement information
74%
26%
Retail
Foodservice
89%
11%
Branded
Unbranded |
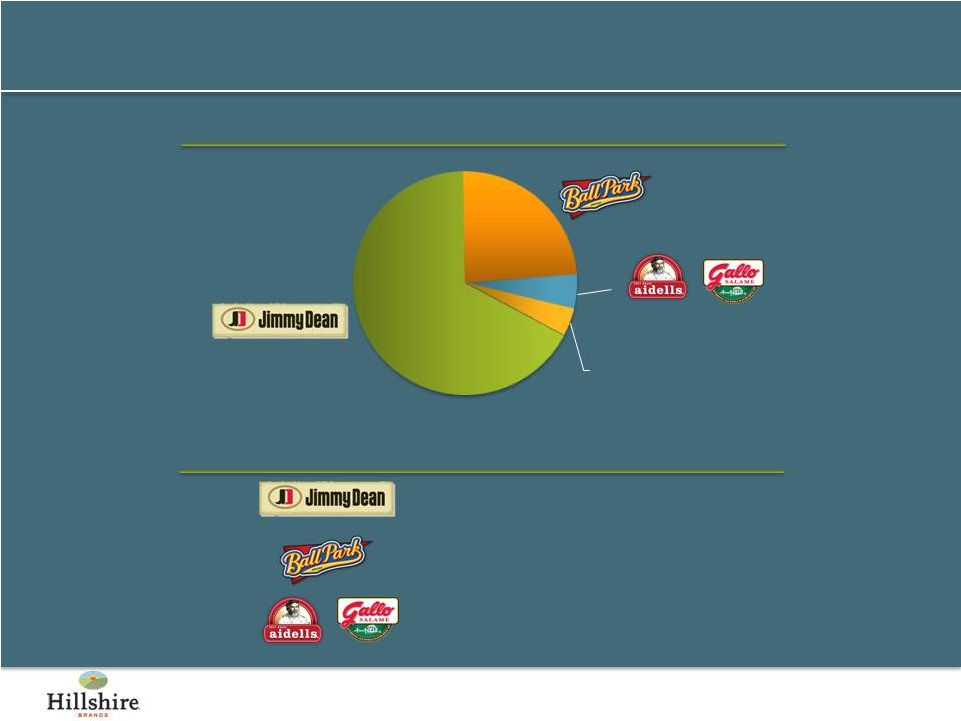
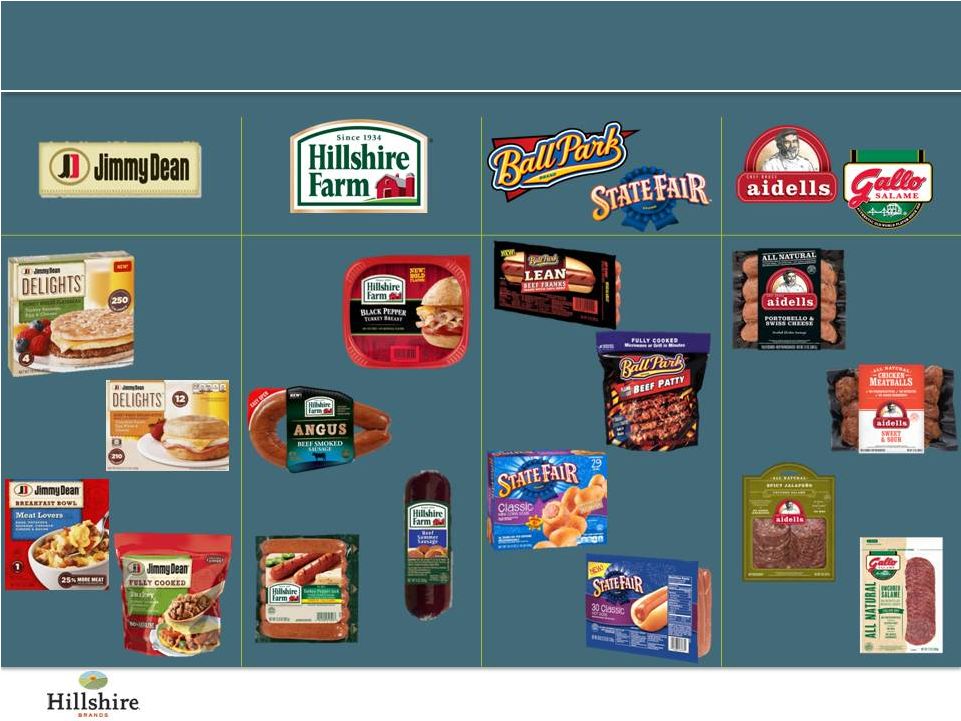
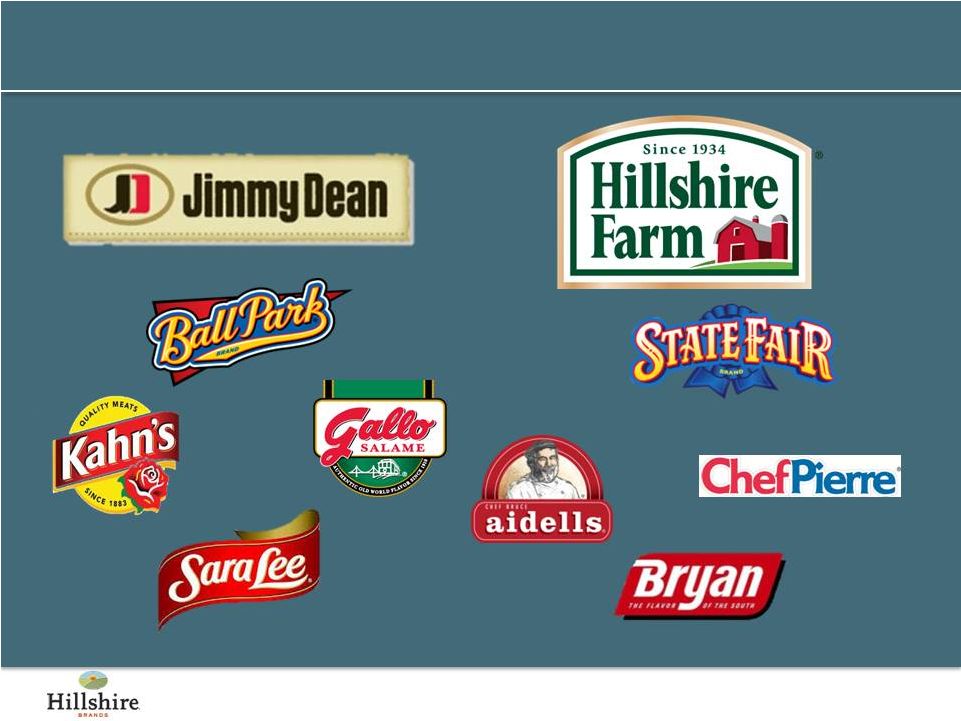 Strong Brand
Portfolio; Two $1B Brands 4 |
 Leading Share
Positions in Core Categories 5
Source: Symphony IRI Group, Total US Multi-Outlet, 52 weeks ending 7/21/13
Brand
Brand
Category
Category
HSH Share
HSH Share
Position
Position
Relative Market
Relative Market
Share
Share
Breakfast Sausage
#1
2.9x
Frozen Protein Breakfast
#1
8.1x
Lunchmeat
#3
0.3x
Smoked Sausage
#1
2.8x
Hot Dogs
#1
1.1x
Corn Dogs
#1
1.5x
Super Premium Sausage
#1
1.8x
Specialty Lunchmeat
#3
0.3x |
 Compete in Large
Categories With Multiple Areas for Growth
6
Source: Symphony IRI Group, National Consumer Panel, Total US–All Outlets, 52 weeks
ending 6/16/13 and Total US Multi-Outlet, 52 weeks ending 7/21/13
Size of
Category
$5.1B
$2.8B
$1.8B
$1.8B
$1.5B
Volume
Growth
+0.2%
(1.2)%
+0.7%
+5.0%
+10.5%
78%
78%
60%
61%
38%
30%
30%
29%
28%
22%
Lunchmeat
Hot Dogs
Smoked
Sausage
Breakfast
Sausage
Frozen Protein
Breakfast
Category HH Penetration
Brand HH Penetration |
 Core Categories Have
Limited Private Label Penetration
7
Source: Symphony IRI Group, Total US Multi-Outlet, 52 Weeks Ending 8/11/2013
Category
Category
Private Label Dollar Share
Private Label Dollar Share
Frozen Protein Breakfast
6%
Hot Dogs
4%
Corn Dogs
4%
Smoked/Cooked Sausage
5%
Cocktail Links
5%
Breakfast Sausage
11%
Mainstream Lunchmeat
17%
Total Industry
12% |
 Four Strategies to
Deliver Long-Term Value Creation
8
Extend Into Adjacencies
Strengthen the Core
Acquire On-Trend Brands
Fuel Growth Through Efficiency |
 Brand Building and
Innovation Key to Growth Agenda
9
Brand Building
Innovation
Brand positioning
World-class advertising
Category management
Upgrade existing
quality and packaging
New line extensions
Adjacent innovations |
 Increasing
Investment in MAP Behind Our Core Brands
10
3.5%
4.4%
5%
Historic Average
FY13
FY15E
MAP Spending as % of Sales |
 FY13 YoY Percent
Change in Sales Where We Increase MAP Support We See
Good Growth
11
FY13 MAP Increase Allocation
High single digits
Low single digits
High single digits
Other |
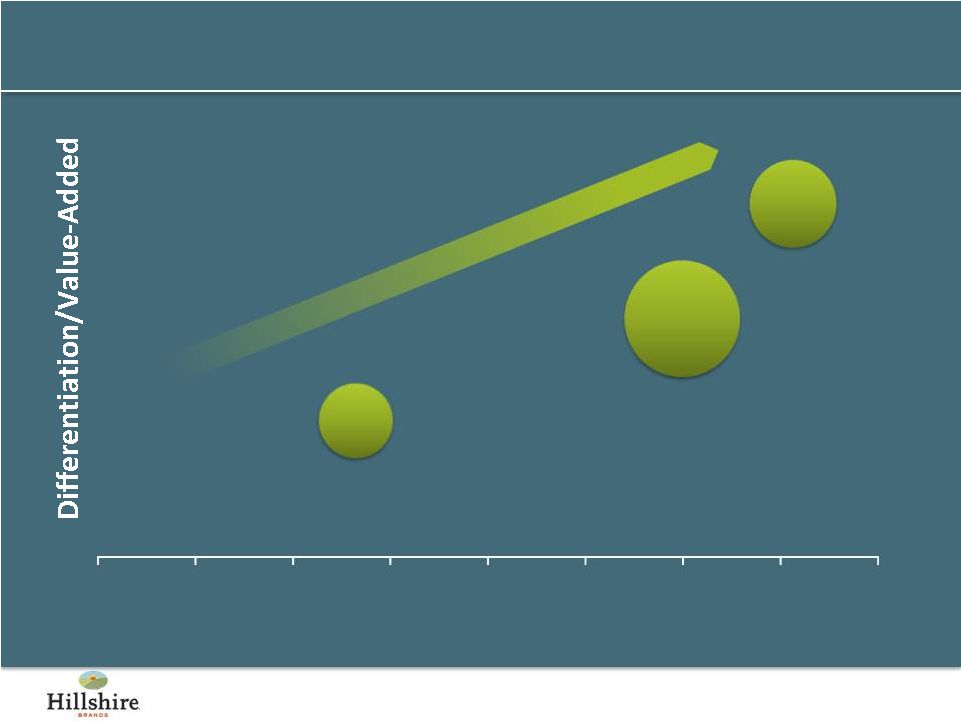   Innovation Focused on
Differentiated, Value-Added Products
12
Source: Company Financial Statement information
0%
5%
10%
15%
20%
25%
30%
35%
40%
Gross Margin
Commodity
Unbranded
Branded
Meal
Components
Branded
Ready
Meals
$0.5B
$2.6B
$0.8B |
 Over $300MM in
Revenue From Products Introduced Within the Last Three Years
13 |
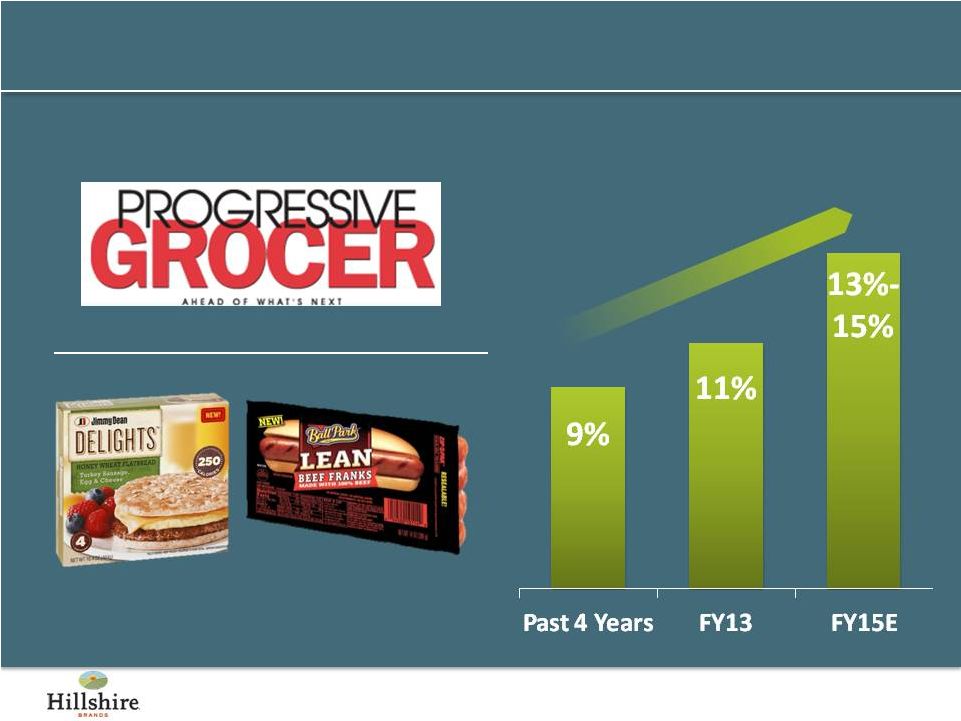 Well on Our Way to
Achieve Our Innovation Goals 14
*Percent
annual
revenue
from
past
three
years’
rolling
innovations,
Retail
segment
only
2013 Editors' Top New Picks
Revenue From New
Innovations* |
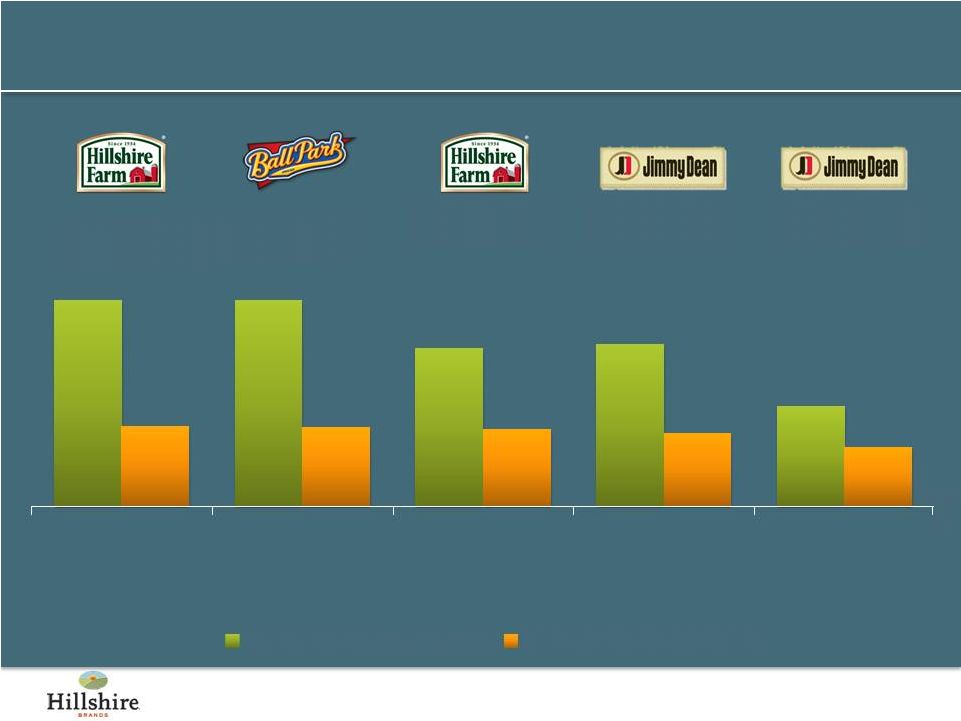
 Overall, Good
Progress in First Year… More Work to Do
15
Source: Symphony IRI Group, Total US Multi-Outlet, 52 weeks ending July 1, 2012 and June
30, 2013 Percent Change in Total Consumption Volume
FY12
FY12
FY13
FY13
Hillshire Farm
(5.9)%
(1.9)%
Jimmy Dean
+1.3%
+7.3%
Ball Park
(4.7)%
+5.0%
State Fair
(1.5)%
(2.4)%
Gallo
(5.7)%
+9.0%
Aidells
+22.3%
+13.9%
Sara Lee Sweet Goods
(8.8)%
(6.6)%
Sara Lee Deli
(17.2)%
(7.0)% |
 What’s
Next… Continue Working the Plan
16
Grow Core Brands
Rigorous Cost Management
Acquire New, On-Trend Brands |
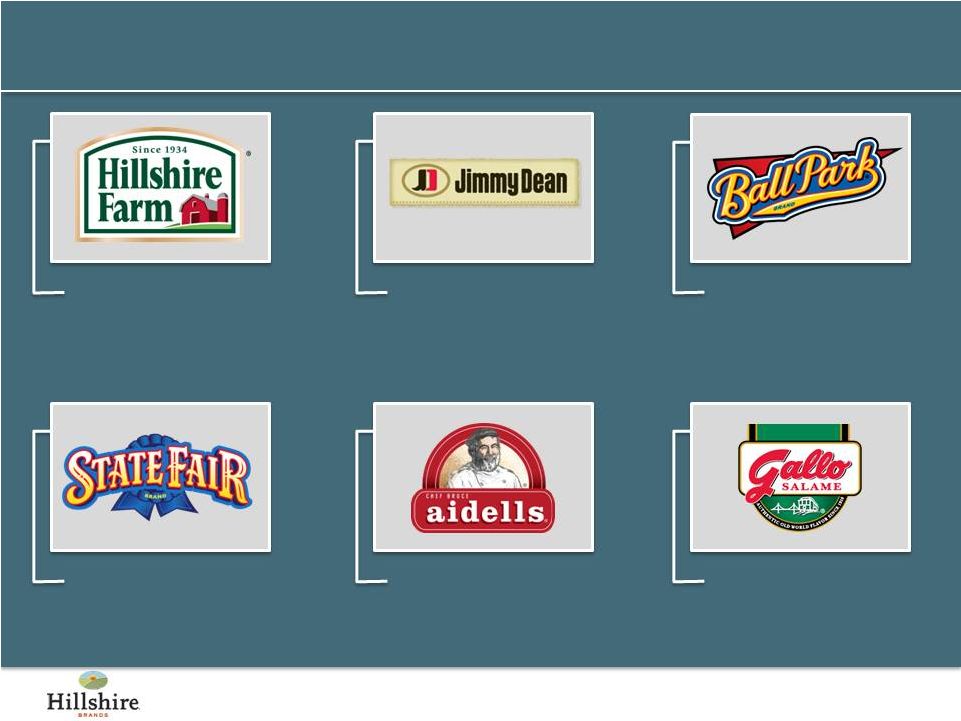 We Will Activate
Our Core Brands Behind Broadened Brand Positionings
17
“Farm House
Quality Meats”
“Hearty
Comfort Food”
“Better Guy
Food for Better
Guy Times”
“Smart and
Sensible
Family Choices”
“Authentic
Ingredients,
Exceptional Tastes”
“Artisanal
Italian Meats” |
 Jimmy Dean
Expanding Hispanic Reach 18 |
 Robust Innovation
Slate Planned for FY14 19
First Half FY14
Second Half FY14
Ramp up distribution for
FY13 innovations
New line extensions in
Jimmy Dean, Aidells,
Sara Lee and Foodservice
Build presence in value
channel
Represents bulk of FY14
innovation activity
Introduce new products
and platforms under
Ball Park and Hillshire Farm
brands
More details to come
First Half Innovations |
 M&A Will
Complement Organic Growth 20
Value-added categories
Strong brands
Complementary / additive
capabilities
Scale with suppliers and customers
Top-line growth
EPS contribution
Attractive financial returns
Alignment
with
Strategic
Vision
Shareholder
Value
Creation |
 M&A Will
Leverage Strong Infrastructure 21
Capabilities
Assets
Consumer insights
Frozen / Breakfast /
Meals expertise
Category captaincies in
key product areas
Robust R&D and
innovation focus
History of success
integrating acquired
businesses
Efficient supply chain
and production
Fully-integrated SAP
enterprise system
Extensive distribution
infrastructure
Powerful brand
equities with proven
ability to penetrate
new segments |
 Golden Island
Acquisition Provides Initial Entry to the Attractive Meat Snacking Market
Source: Symphony IRI Group, Total U.S. FDMx data, ending CY 2011
$59B
$59B
2.6% CAGR
2.6% CAGR
$0.9B
$0.9B
+5% CAGR
+5% CAGR
Meat-Centric
Snacks
Total Snacking Market
22 |
 What is Golden
Island? Manufactures and sells
all natural pork and
beef jerky
Among top ten jerky
brands
Differentiated
technology to make a
more tender jerky
23 |
 Remain Committed to
Achieving Our Mid-Term Targets
24
Net Sales Growth
MAP % of Total
Revenue
Operating Margin
4-5%
5%
10% |
 Maria Henry, EVP
& CFO 25 |
   Total Hillshire
Brands Income Statement 26
“Adjusted”
terms are non-GAAP financial measures. See our reconciliation to the most directly
comparable GAAP measure in our press release dated August 8, 2013 and at the end of
this presentation. Continuing Operations
($ millions, excluding significant items)
FY12
FY13
YoY
Adjusted Net Sales
$3,903
$3,920
+0.4%
Adjusted Op Income
323
363
+12.5%
Adjusted Op Margin
8.3%
9.3%
+100 bps
Adjusted Diluted EPS
$1.45
$1.72
+18.6% |
   Cost Management
Programs Progressing On track for $145MM of efficiencies
•
Achieved $40MM cost savings goal in FY13
•
Plans in place to execute remaining $105MM
Efficiency programs will also strengthen core
capabilities for sustainable growth and profitability
Company culture embracing efficiency mindset
27 |
   Strong Balance
Sheet 28
“Adjusted”
terms are non-GAAP financial measures. See our reconciliation to the most directly
comparable GAAP measure in our press release dated August 8, 2013 and at the end of
this presentation. ($ millions, excluding significant items)
FY13
Adjusted Cash Flow
$ 312
Adjusted EBITDA
$ 509
Cash
$ 400
Debt
$ 951
Net Debt
$ 551 |
   Capital Allocation
Strategy Continue to invest in the business
Increased dividend 40% to $0.70 per share
annual rate
Targeting $200 million in share repurchases over the
next two years
Committed to M&A as a value creation lever
No plans to significantly reduce debt at this time
29 |
 FY14 Outlook
30
Perspective
Facing near-term inflation, lapping one-time benefits
Continue disciplined investment in brand building
Defend market positions where necessary
Sales increase slightly
Adjusted diluted EPS flat to down mid-single digits
Guidance |
 Summary
We have a terrific portfolio of leading, iconic brands
We compete in attractive categories
We expect to grow through disciplined investments in
brand building and innovation
We will fuel our growth through rigorous cost
management
We will pursue targeted M&A opportunities to further
accelerate our growth
We have the potential to deliver significant
shareholder returns
31 |
 Q&A
32 |
 Appendix
33 |
 (1) Represents
a non-GAAP financial measure. See detailed explanation of these and other
non-GAAP measures in the release dated August 8, 2013.
34
EPS Reconciliation—Reported to Adjusted
Twelve Months ended June 29, 2013
Twelve Months Ended June 30, 2012
As
Reported
Impact of
Significant
Items
Adjusted
(1)
As
Reported
Impact of
Significant
Items
Adjusted
(1)
Continuing operations:
Income (loss) from continuing operations before
income taxes
$
256
$
(66)
$
322
$
(35)
$
(294)
$
259
Income tax expense (benefit)
72
(38)
110
(15)
(101)
86
Income (loss) from continuing operations
184
(28)
212
(20)
(193)
173
Discontinued operations:
Income from discontinued operations, net of tax
15
4
11
463
62
401
Gain on sale of discontinued operations, net of tax
53
53
—
405
405
—
Net income from discontinued operations
68
57
11
868
467
401
Net income
252
29
223
848
274
574
Less: Income from noncontrolling interests, net of tax
Discontinued operations
—
—
—
3
3
Net income attributable to Hillshire Brands
$
252
$
29
$
223
$
845
$
274
$
571
Amounts attributable to Hillshire Brands:
Net (loss) income from continuing operations
$
184
$
(28)
$
212
$
(20)
$
(193)
$
173
Net income from discontinued operations
68
57
11
865
467
398
Earnings per share of common stock:
Diluted
Income (loss) from continuing operations
$
1.49
$
(0.23)
$
1.72
$
(0.16)
$
(1.61)
$
1.45
Net income
$
2.04
$
0.23
$
1.81
$
7.13
$
2.36
$
4.77
Effective tax rate—continuing operations
28.1%
34.2%
44.2%
33.1%
Twelve
Months
ended
June
29,
2013
and
June
30,
2012
(in
millions,
except
per
share
data
unaudited)
— |
 35
(1) Represents a non-GAAP financial measure. See detailed explanation of these and other
non-GAAP measures in the release dated August 8, 2013.
Operating Income Reconciliation—Reported to Adjusted
Twelve Months ended June 29, 2013
As
Reported
Impact of
Significant
Items
Dispositions
Adjusted
(1)
Net Sales
$
3,920
$
—
$
—
$
3,920
Cost of Sales
2,758
11
—
2,747
Gross Profit
1,162
(11)
—
1,173
MAP Expense
174
—
—
174
SG&A (excluding MAP)
681
45
—
636
Net charges for exit activities, asset and business dispositions
9
9
—
—
Impairment charges
1
1
—
—
Operating income
$
297
$
(66)
$
—
$
363
Twelve Months Ended June 30, 2012
As
Reported
Impact of
Significant
Items
Dispositions
Adjusted
(1)
Net Sales
$
3,958
$
—
$
55
$
3,903
Cost of Sales
2,857
28
40
2,789
Gross Profit
1,101
(28)
15
1,114
MAP Expense
135
—
—
135
SG&A (excluding MAP)
795
132
7
656
Net charges for exit activities, asset and business dispositions
81
81
—
—
Impairment charges
14
14
—
—
Operating income
$
76
$
(255
)
$
8
$
323
Twelve
Months
ended
June
29,
2013
and
June
30,
2012
(in
millions,
except
per
share
data
unaudited) |
 36
(1) Represents the change in cash, excluding the impact of significant items. See the
press release dated August 8, 2013 for a detailed definition of significant
items. Cash Flow Reconciliation - Reported to Adjusted
Twelve Months ended June 29, 2013 (in millions, except per share data - unaudited)
As
Reported
Restructuring
Swap
Settlement /
Other
Adjusted (1)
Cash Flow
$165
$102
$45
$312 |
 37
(1) EBITDA stands for Earnings Before Interest, Taxes, Depreciation, and Amortization and is
a non-GAAP number
EBITDA
Reconciliation
-
Reported
to
Adjusted
Twelve
Months
ended
June
29,
2013
(in
millions,
except
per
share
data
-
unaudited)
Reported Net Income
252
Income
tax
expense
-
continuing
operations
72
Income
tax
benefit
-
discontinued
operations
(8)
Income
tax
expense
-
gain
on
sale
of
discontinued
operations
15
Interest (net)
41
Depreciation & Amortization
166
EBITDA (1)
538
Significant Items, excluding accelerated depreciation (pre-tax)
(29)
Adjusted EBITDA (1)
509 |