Attached files
| file | filename |
|---|---|
| 8-K - FORM 8-K - EAGLE MATERIALS INC | d592309d8k.htm |
 Low
Cost
Producer
Autumn 2013
Profitable Growth
•
Smart Investments
•
Up-Cycle Tailwinds
•
Favorable Secular Trends
•
Low-Cost Advantages
•
Healthy Balance Sheet
Exhibit 99.1 |
 Forward Looking Statement
2
forward-looking statement to reflect future events or changes in the Company's
expectations. This presentation contains forward-looking statements within the meaning of Section 27A of the
Securities Act of 1933, Section 21E of the Securities Exchange Act of 1934 and the Private
Securities Litigation Reform Act of 1995. Forward-looking statements may be identified by
the context of the statement and generally arise when the Company is discussing its beliefs, estimates or
expectations. These statements are not historical facts or guarantees of future performance but
instead represent only the Company's belief at the time the statements were made regarding
future events which are subject to certain risks, uncertainties and other factors many of which
are outside the Company's control. Actual results and outcomes may differ materially from what is
expressed or forecast in such forward-looking statements. The principal risks and uncertainties
that may affect the Company’s actual performance include the following: the cyclical and
seasonal nature of the Company’s business; public infrastructure expenditures; adverse
weather conditions; the fact that our products are commodities and that prices for our products are subject to
material fluctuation due to market conditions and other factors beyond our control; availability of
raw materials; changes in energy costs including, without limitation, natural gas and oil;
changes in the cost and availability of transportation; unexpected operational difficulties;
inability to timely execute announced capacity expansions; difficulties and delays in the development of new business
lines; governmental regulation and changes in governmental and public policy (including, without
limitation, climate change regulation);possible outcomes of pending or future litigation or
arbitration proceedings; changes in economic conditions specific to any one or more of the
Company’s markets; competition; announced increases in capacity in the gypsum wallboard and cement
industries; changes in the demand for residential housing construction or commercial construction;
general economic conditions; and interest rates. For example, increases in interest
rates, decreases in demand for construction materials or increases in the cost of energy
(including, without limitation, natural gas and oil) could affect the revenues and operating earnings of our operations. In
addition, changes in national or regional economic conditions and levels of infrastructure and
construction spending could also adversely affect the Company's result of operations. With
respect to our acquisition of the Acquired Assets as described in this press release, factors,
risks and uncertainties that may cause actual events and developments to vary materially from those
anticipated in forward-looking statements include, but are not limited to, the risk that we may
not be able to integrate the Acquired Assets in an efficient and cost-effective manner with
our other assets and operations, the possible inability to realize synergies or other expected
benefits of the transaction, the possibility that we may incur significant costs relating to transition or integration
activities or repair and maintenance of the Acquired Assets, the discovery of undisclosed liabilities
associated with the business, the need to repay the indebtedness incurred to fund the
acquisition and the fact that increased debt may limit our ability to respond to any changes in
general economic and business conditions that occur after the acquisition. These and other factors are described in
the Company’s Annual Report on Form 10-K for the fiscal year ended March 31, 2013, and the
Company’s Quarterly Report on Form 10-Q for the fiscal quarter ended June 30,
2013. These reports are filed with the Securities and Exchange Commission. All
forward-looking statements made herein are made as of the date hereof, and the risk that actual
results will differ materially from expectations expressed herein will increase with the
passage of time. The Company undertakes no duty to update any
|
 Eagle Materials Business Definition
Minerals-Based Commodity Products
Infrastructure
and
Related
Construction Materials
Residential
and Commercial
Construction Materials
Strategy Emphasis Now
Key Demand Drivers
Competitive Advantage
Innovation Focus
Asset Optimization
Cyclical Recovery
Cost Position
Profitable, High-Returning Growth
Secular and Cyclical Growth
Oil Well
Cement
Frac
Sand
Construction
Cement
Aggregates
and Concrete
Gypsum
Wallboard
Gypsum
Paperboard
Cost Position
Scarcity
3
Extension of Low Cost Producer Positions
Energy
Industry
Materials |
 Eagle Materials Low Cost Producer Focus
Minerals-Based Commodity Products
Infrastructure
and
Related
Construction Materials
Residential
and Commercial
Construction Materials
Strategy Emphasis Now
Key Demand Drivers
Competitive Advantage
Innovation Focus
Oil Well
Cement
Frac
Sand
Construction
Cement
Aggregates
and Concrete
Gypsum
Wallboard
Gypsum
Paperboard
Cost Position
Scarcity
4
Extension of Low Cost Producer Positions
Asset Optimization
Cyclical Recovery
Cost Position
Energy
Industry
Materials
Profitable, High-Returning Growth
Secular and Cyclical Growth |
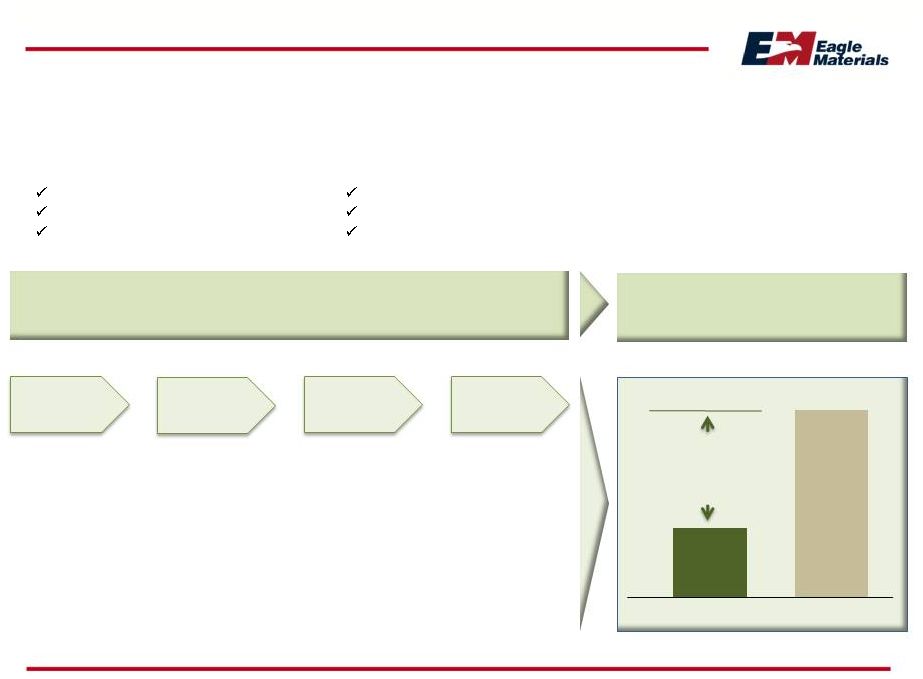 Multiple Sources of Cost Advantage
Lowest Cost Position is Important in a Commodity Industry
Operational Execution
Low-Cost Focused Innovation
Technology and Engineering
Eagle
Cost
Advantages
EXP
Industry
5
Sustained Innovation Focus on Cost
Reduction
Across Every Aspect of the Business System
Inputs
Waste
Overhead
•
Proximity of
raw materials
•
Unique
technologies
•
Material and
energy usage
•
Mining
innovations
•
Manufacturing
innovations
•
Logistics
innovations
•
Process
control
•
Product line
focus
•
Maintenance
disciplines
•
Simple
systems
•
Low staffing
requirements
•
No frills only
necessities
Processing
Process Management
Smart Design and Scale
Sustained Maintenance
Significant, Sustained and
Proven Cost Advantages |
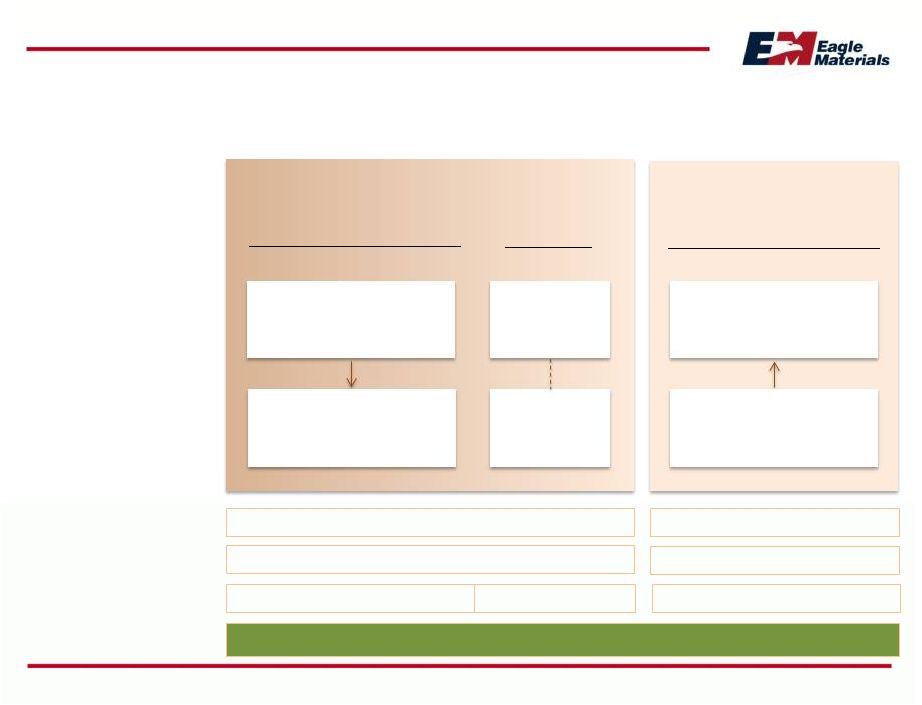
 Our
Low Cost Producer Strategy
Is Closely Aligned with Our Sustainability Objectives
Strategy Objective
Sustainability Result
Less
waste
Reduced cost
Responsible use of
resources
Less
energy
used
Reduced cost
Smaller
environmental footprint
Less mineral
resource used
Reduced cost
Greater
conservation
Less
water
used
Reduced cost
Lower energy
requirements
More recycled
resource use
Reduced cost
Beneficial use
of waste
streams 6 |
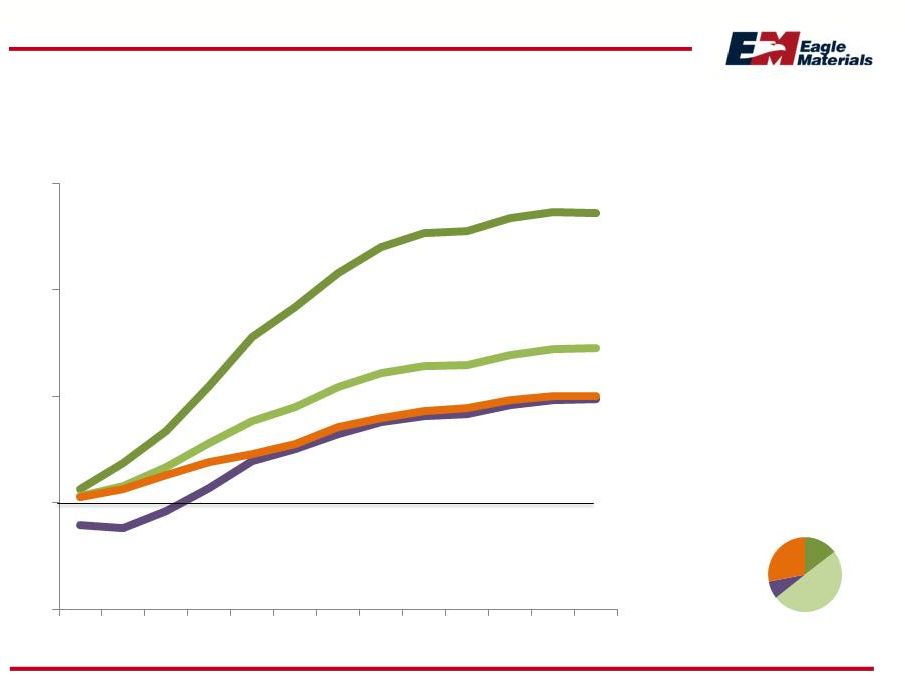
 Shareholder
Value
Creation
Track
Record
-
TSR
Some Say “The Best Predictor of Grades is Grades”
1-Year
3-Year
Since
Inception
(April 15, 1994)
Source: Longnecker & Associates. All measures are as of
3/31/13 fiscal year end. Direct Peers: Martin Marietta, Texas Industries Inc., USG Corp., Vulcan Materials
Industry Peers: Martin Marietta, Texas Industries Inc., USG Corp., Vulcan
Materials, Titan Cement Co. S.A., CRH, Buzzi Unicem S.p.A., Holcim Ltd., HeidelbergCement
AG, Lafarge S.A., Cementos Bio-Bio S.A., Cementos Portland Valderrivas, Cemex
S.A.B. de C.V., Italcementi S.p.A., Cementos Argos S.A., Headwaters Incorporated
7
0%
100%
200%
0%
50%
100%
0%
1000%
2000%
Eagle Materials
Direct Peers
(median)
Industry Peers
(median) |
 Eagle Materials Business Definition
Minerals-Based Commodity Products
Infrastructure and
Related
Construction
Materials Residential and
Commercial
Construction Materials
Strategy Emphasis Now
Key Demand Drivers
Competitive Advantage
Innovation Focus
Oil Well
Cement
Frac
Sand
Aggregates
and Concrete
Gypsum
Wallboard
Gypsum
Paperboard
8
Construction
Cement
Extension of Low Cost Producer Positions
Asset Optimization
Cyclical Recovery
Cost Position
Profitable, High-Returning Growth
Secular and Cyclical Growth
Cost Position
Scarcity
Energy
Industry
Materials |
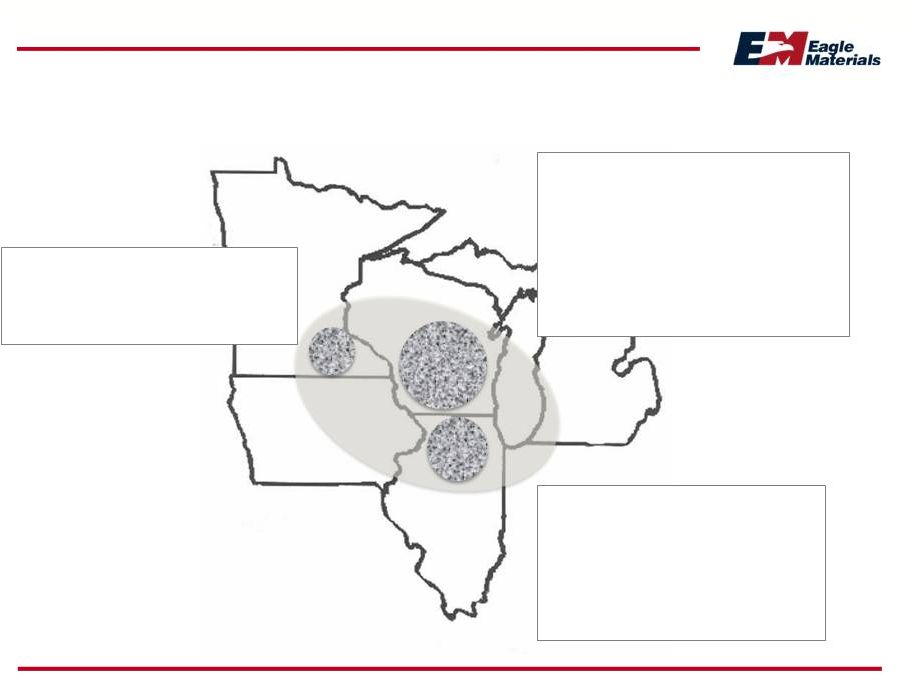
 A
Central US Cement System New Cement Plants “Filled in a Missing Puzzle
Piece” •
Kansas City and
Tulsa cement plant
acquisitions (Nov.
30, 2012) link
east-to-west and
central-to-south
•
Heartland focus
also limits impact
of imports
Acquired Cement Terminals
Eagle Cement Terminals
Eagle Cement Plants
Acquired Cement Plants
9
Mountain
Cement
Nevada
Cement
Illinois
Cement
Kansas City, MO
Tula, OK
Texas
Lehigh
Cement
(50/50 JV)
Houston
Cement
Terminal |
 System Scale
Recent Acquisitions Increased Cement Capacity by 60%
Texas Lehigh (50%)
700
Illinois Cement
1,100
Mountain Cement
700
Nevada Cement
550
Central Plains Kansas City
1,150
Central Plains Tulsa
700
Total
4,900
Cement Short Tons Capacity (000)
10 |
 US
Cement Consumption Outlook Million Metric Tons
Source: Portland Cement Association
US Capacity
•
New capacity --
and capacity
expansion
--
is
constrained for
the foreseeable
future
•
Some existing
capacity may be
closed by 2015
due to NESHAP
compliance
•
Imports will be
required again
to meet demand
regardless
11
0
30
60
90
120
2007
2008
2009
2010
2011
2012
2013
2014
2015
2016
2017
Non-Residential
Governmental
Residential |
 EPA
Regulatory Developments Final Rule Issued –
Extension Granted
On
February
12,
2013
the
EPA
published
the
final
rule
amending
•
National Emission Standards for Hazardous Air Pollutants
(NESHAP) for the Portland Cement Manufacturing Industry
•
New Source Performance Standards (NSPS) for Portland
Cement Plants
Existing Facilities
•
Compliance deadlines
September
New Facilities
•
Standards
continue
to
apply
to
all
sources
which
commenced construction or reconstruction after May 6, 2009
12
extended until
2015 |
 EPA
Regulatory Developments Standards Tough to Meet, Will Chill New Capacity
Addition Pollutant
Existing Source
Standard
New Source
Standard
Particulate Matter
0.07 lb/ton clinker
0.02 lb/ton clinker
Mercury
55 lb/MM tons clinker
21 lb/MM tons clinker
Nitrogen Oxide
3.5 -10 lb/ton clinker
(varies)
1.5 lb/ton clinker
Sulfur Oxide
1.2-5.0 lb/ton clinker
(varies)
0.4 lb/ton clinker
Total Hydrocarbons
24 ppm
24 ppm
Hydrogen Chloride
3 ppm
3 ppm
Organic Air Pollutants
12 ppm
12 ppm
Standards for
new sources
are challenging
to meet
individually --
and as a set of
standards
compliance
may be not be
economically or
even
technologically
feasible
13 |
 Concrete/Cement Value Proposition
In Relation to Asphalt, the Leading Substitute
•
Historically
•
Asphalt is used over 85% of the time in US highway and road construction, and this
has been the case over many decades
•
Life cycle costs have always favored concrete over asphalt
•
Now
initial costs per mile as well as life cycle costs favor concrete, driven by
escalation in asphalt bitumen input costs (oil driven)
•
The cost cross-over point favoring concrete over asphalt occurred in 2008 but
has been masked by the recession and long-standing historical
practices •
Concrete has, in fact, been gaining share over asphalt since 2008
•
Outlook
is for a further strengthening of the concrete/cement value proposition
•
More
rapid
share
gains
for
concrete
are
expected
as
the
cost
and
performance
advantages
of concrete increase, as cost benefits are broadly understood, and as use
adaptations occur 14
initial costs per construction mile have favored asphalt over concrete
|
 Life Cycle Analysis Favors Concrete
Pavement Life Expectancy (Before Reconstruction is Required)
Asphalt
Average:
13.6 Years
Concrete
Average:
29.3 Years
Source: PCA Highway Report
15
0
5
10
15
20
25
1-
5
6-10
Years
11-15
Years
16-20
Years
21-30
Years
31-50
Years
Asphalt
Concrete
Years |
 Asphalt Production Costs Linked to Oil/Bitumen
Asphalt Costs Diverging from Historical Relationship with Concrete
Ready Mix PPI
Dec 1984 =100
Asphalt PPI
Dec 1984 =100
Crude Oil
$/Barrel
Sources: US Department of Labor, International Monetary Fund
16
$0
$50
$100
$150
$200
$250
$300
0
100
200
300
Dec-84
Dec-90
Dec-96
Dec-02
Dec-08 |
 Concrete Share Has, In Fact, Been Growing
Growth Since 2008 Has Been Masked by the Recession
Concrete Share of Highway Paving Volume
Source: PCA June 2012, Oman Data Systems
Long-Term Average 14.4%
17
13.3%
12.1%
15.5%
16.2%
17.5%
8%
13%
18%
2007
2008
2009
2010
2011 |
 Outlook and Strategic Implications
A Game Changer for Cement and Asphalt
•
The
price
of
asphalt
is
expected
to
continue
to
diverge
from
the
price
of concrete as oil price inflation remains higher than the cost inflation
of the fuels used in producing cement (e.g., petcoke, shale gas)
•
High oil prices have also driven refineries to invest in cokers to extract more
high grade
products
from
crude
--
this
has
meant
less
production
of
bitumen
and
more
production
of
petcoke,
further
extending
the
gap
•
Petroleum coke is a low-value solid by-products of the oil refining
industry and this is
reflected
in
pricing
--
decisions
about
production
levels
tend
not
to
be
made
on
the markets for petroleum coke; it is a waste recovery by-product “priced
to move” rather than to store
•
Competition from concrete will limit asphalt’s ability to pass on costs
•
Well-positioned cement producers should enjoy increasing advantages
18 |
 PCA
Projected Initial Bid Paving Costs Per Two Lane Road Mile -
Urban
Concrete
Asphalt
Parity achieved in Fiscal 2009
Bid
costs
do
not
consider
life-cycle
costs
–
which
further
favors
concrete
19
$200
$400
$600
$800
$1,000
$1,200
2003
2005
2007
2009
2011
2013
2015 |
 Eagle Materials Business Definition
Minerals-Based Commodity Products
Strategy Emphasis Now
Key Demand Drivers
Competitive Advantage
Innovation Focus
Asset Optimization
Cyclical Recovery
Cost Position
Profitable, High-Returning Growth
Secular and Cyclical Growth
Extension of Low Cost Producer Positions
Cost Position
Scarcity
20
Infrastructure and
Related
Construction
Materials Residential and
Commercial
Construction Materials
Oil Well
Cement
Frac
Sand
Construction
Cement
Aggregates
and Concrete
Gypsum
Wallboard
Gypsum
Paperboard
Energy
Industry
Materials |
 Close Relationship of End-Uses
Oil Well Cement and Now Frac Sand
Important elements
for unlocking energy
in the shale plays
•
Specialty oil well
cement
for casing
wells
•
Special purpose
frac sand
to keep
the fractures
“propped open”
21 |
 Shifting the Cement Product Mix to Oil Well Cement
A Company Priority
22
•
Very few US cement producers have
the capability, know-how, permits or
customer relationships required to
effectively produce and market
specialty oil-well cement, especially
Class H, the grade used in the most
demanding casing applications
•
The alternative for oil services
companies is to apply additives to
more conventional grade cement to
achieve similar results –
this can be
more costly and less predictable
Eagle has been
the pre-eminent
US producer of oil
well cement for
decades
Strong value
proposition for
Eagle and a key
profit growth
opportunity |
 Oil
Well Cement Strategic Directions A Mutually Reinforcing Growth Opportunity
with Frac Sand Eagle Plant
Current
Production
Proportion
Target
Production
Proportion
Key
Cement
Grades
Target
Shale
Plays
Texas
Lehigh
~ 50%
> 50%
Class H
Eagle Ford
Mature
capability
Mountain
~ 25%
> 25%
Class G
Niobrara
Mature
capability
Illinois
0%
> 25%
Class G
and H
Utica
Now
proven
Tulsa
4%
> 50%
Class C
and H
Miss. Lime,
Ardmore
Acquired,
now proven
Kansas
City
0%
> 25%
Class G
and H
Anadarko,
Bakken
Acquired,
feasible
23
Plant
Capability
Status |
 Increasing
drilling activity
should
continue to
drive growth in
cement
consumption
South Texas
represents
~15-20% of US
oil well cement
spend
Eagle Ford –
Cement Consumption Outlook
Continued Growth is Expected
24
2011
2012
2013
2014
2015
Estimated Annual Oil Well Cement Demand
and Outlook |
 Eagle Materials Business Definition
Minerals-Based Commodity Products
Infrastructure and
Related
Construction
Materials Residential and
Commercial
Construction Materials
Strategy Emphasis Now
Key Demand Drivers
Competitive Advantage
Innovation Focus
Asset Optimization
Cyclical Recovery
Cost Position
Profitable, High-Returning Growth
Secular and Cyclical Growth
Extension of Low Cost Producer Positions
Oil Well
Cement
Frac
Sand
Construction
Cement
Aggregates
and Concrete
Gypsum
Wallboard
Gypsum
Paperboard
Cost Position
Scarcity
25
Energy
Industry
Materials |
 Frac Sand is a Natural, Close Adjacency for Eagle
Key Growth Opportunity and a Top Eagle Priority
Frac sand entry leverages Eagle’s existing
•
Customer base (oil well cement)
•
Owned distribution infrastructure that we
have repurposed (Corpus Christi port
terminal, proximate to Eagle Ford)
•
Processing expertise (aggregates)
•
Advantaged access to scarce northern
white sand resource
•
Long-standing relationships (at Illinois
Cement) enabled acquisition of a 50-year
scale reserve deposit in Illinois
•
Northern white sand is the preferred
proppant in oily plays --
and increasingly so
•
Northern white sand deposits are not near
any shale plays, so logistics is a key
Opportunity to create a low-cost system
26 |
 Northern Illinois
MN / WI
Small Universe of Areas in North America (and in the World)
Highest
Quality
Frac
Sand
Studies have shown geologic conditions creating these deposits are rare across the
globe. England deposits are played out, limited quality deposits in
Poland, Asia/Pacific and Arabia have lower crush strengths –
implies a relatively low sand import threat.
Geology
is
Destiny
–
Quality
Scarcity
Dark Red Represents the Outcroppings of Quartz Sand ~ 500 Million Years Old
27 |
 Sandstone Formation Section View
Sandstone Closest to the Surface is Even Less Common
28 |
 Key
Northern White Sand Sources Top Players Currently
Illinois (Top Quality)
~ 6 million tons capacity
1.
US Silica
2.
Unimin
3.
Fairmount
Wisconsin (Top Quality)
~ 10 million tons capacity
1.
Badger Mining
2.
Unimin
3.
Fairmount
4.
EOG Resources
Minnesota (Top Quality)
~ 4 million ton capacity
•
Unimin
29 |
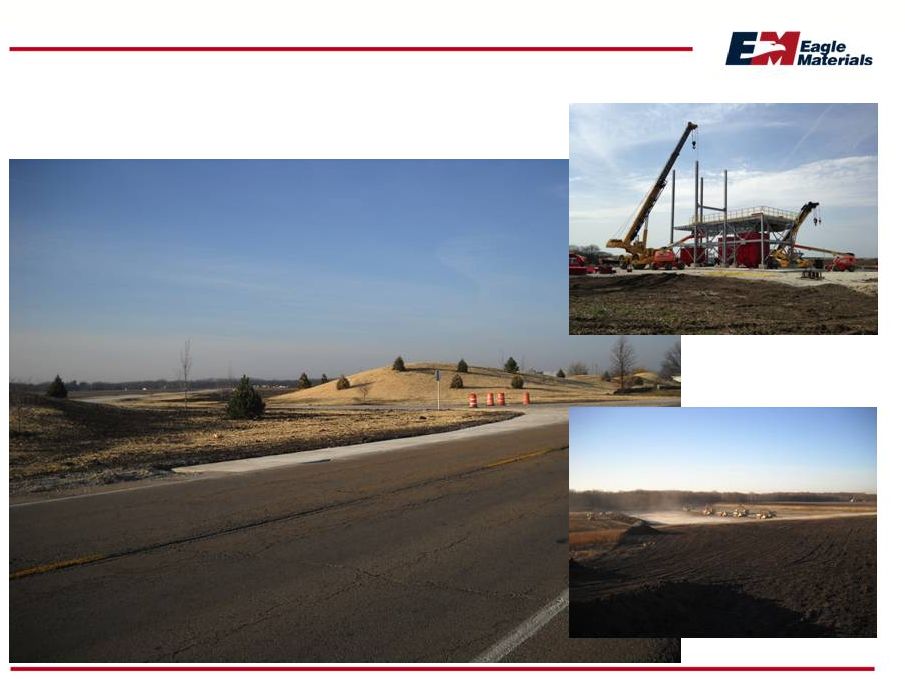 Entrance to Eagle’s Illinois Mine
Northern White Frac Sand
Mine
Preparation
30
Processing
Construction |
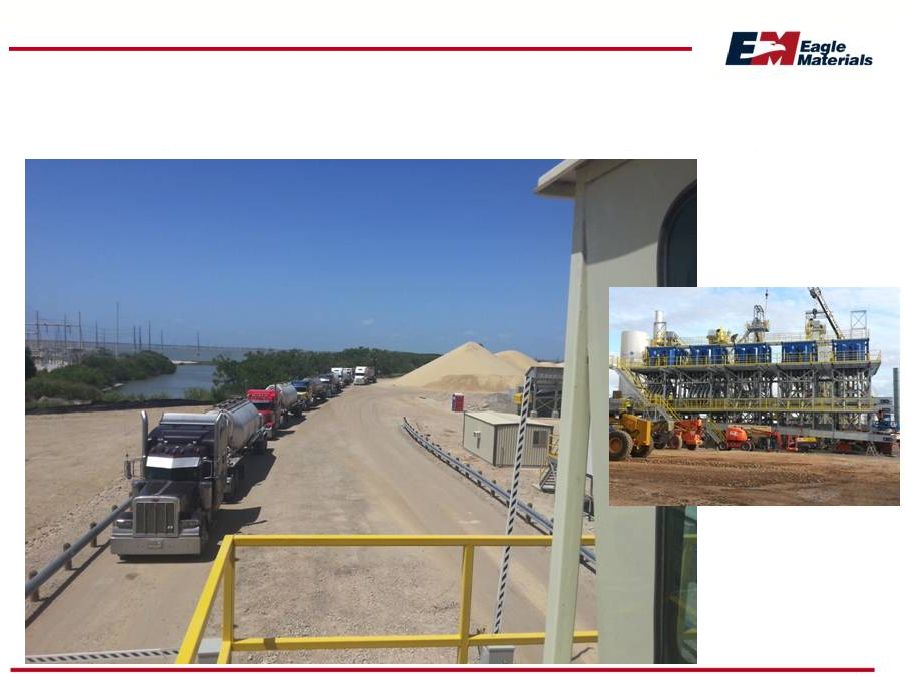 Corpus Christi Site Repurposed, Now Operational
Third-Party Sand to Initialize Processing/Logistics Systems
31
Processing Construction |
 Growth in US Rig Activity, Oil and Gas
Spears and Associates Forecasts
Forecast
Forecast
Forecast
•
The demands of the oily plays are a good fit with
our northern white sand
•
Horizontal drilling is the most frac sand intensive
32 |
 Unconventional Oil/Liquids Land Rig Count Outlook
Key Shale Plays
~ 900
~ 875
Total
840 33
0
50
100
150
200
250
2012 Average
2013E Average
2014E Average |
 Near-Term Oil and Gas Price Outlooks
Relatively Stable According to Spears Forecasts, July 2013
Forecast
Forecast
34 |
 US
Liquids-Focused Threshold Economics Compelling After-Tax Rates of
Return at Expected Oil Prices Eagle Ford
Oil
Eagle Ford
Condensate
Mississippi
Lime
DJ
Niobrara
Granite
Wash
Bakken
Shale
Bakken
Parshall
10%
$53.31
$51.53
$48.45
$59.30
$43.16
$62.86
$44.13
15%
60.99
64.49
59.90
68.23
56.17
71.48
51.59
20%
67.51
75.74
70.05
75.86
67.21
78.92
58.06
25%
73.23
85.70
79.17
82.56
76.82
85.53
63.79
Source: Simmons and Company, June 2013
35 |
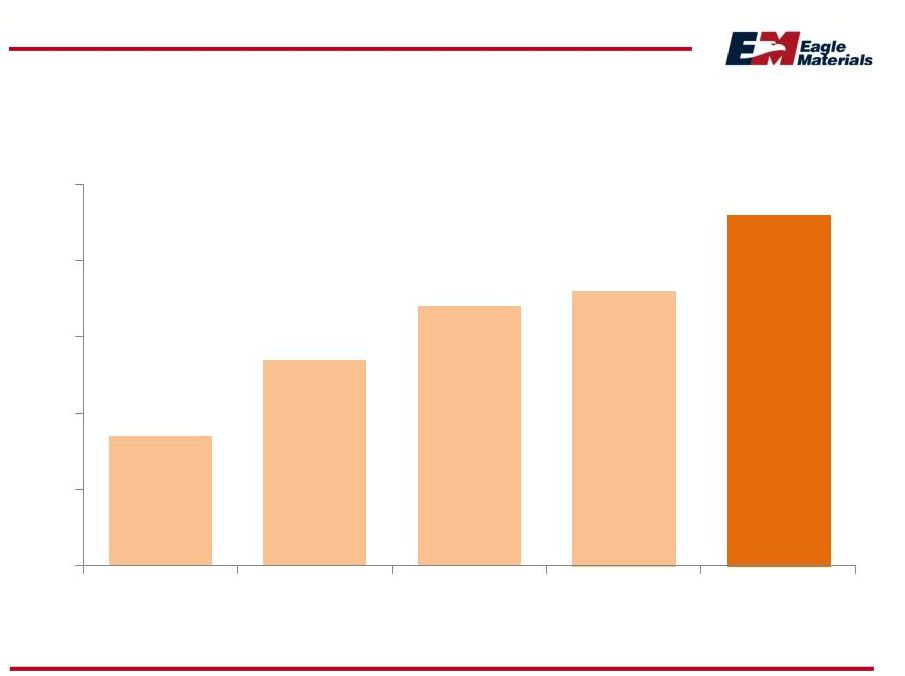 North American Proppant Annual Consumption
Annual million tons, estimated
36
17
27
34
36
46
0
10
20
30
40
50
2009
2010
2011
2012
2013 |
 Estimated Available Supply and Demand
Million Tons
High Quality
White Sand
Inferior Sand
Types
2011 Tons
Industry
Capacity
2012 Tons
“Probable”
Year End Capacity
2013
Demand
Forecast
High
quality
northern
white
sand
is
increasingly
the
proppant
of
choice,
especially in oily plays. The industry is relying on lower quality but more
proximate sand types (as well as ceramics) to meet total demand.
37
0
10
20
30
40
50 |
 Demand growth
over the next two
years is expected to
approximate our
newly installed
drying capacity at
Corpus Christi
Demand estimates
for 2013 range from
8 to 13 million tons
Eagle Ford –
Proppant Demand
Growth is Expected
38
2011
2012
2013
2014
2015
Annual
Proppant
Demand
Outlook |
 Eagle Materials Business Definition
Minerals-Based Commodity Products
Infrastructure and
Related
Construction
Materials Residential and
Commercial
Construction Materials
Strategy Emphasis Now
Key Demand Drivers
Competitive Advantage
Innovation Focus
Asset Optimization
Cyclical Recovery
Cost Position
Profitable, High-Returning Growth
Secular and Cyclical Growth
Extension of Low Cost Producer Positions
Oil Well
Cement
Frac
Sand
Construction
Cement
Aggregates and
Concrete
Gypsum
Wallboard
Gypsum
Paperboard
Cost Position
Scarcity
39
Energy
Industry
Materials |
 Eagle’s US Market and Production Locations
Wallboard
Paperboard
Gypsum, CO
700 MMSF
Albuquerque, NM
425 MMSF
Duke, OK
1,300 MMSF
Georgetown, SC
900 MMSF
Lawton, OK
350,000 tons
Bernalillo, NM
550 MMSF
Currently idled
Note: Design capacities here do not necessarily represent current operating rates
(“effective capacity”). 40
Total Wallboard
4,425 MMSF |
 US
Demand for Gypsum Wallboard Closely Linked with Housing
41
0
5
10
15
20
25
30
35
40
0
200
400
600
800
1,000
1,200
New Home Sales (000)
BSF Gypsum Wallboard Shipments |
 Single-Family Housing Starts Outlook
Moody’s economy.com, SAAR in Millions
2005
2007
2009
2011
2013
2006
2008
2010
2012
2014
2015
Harvard Joint Center for Housing Studies “conservative”
case:
16 million housing units needed 2010-20 (implies an average of
1.6 million/year --
household formations alone are 1.3 million)
Household Formations 2010-20
Gap
42
0.0
0.5
1.0
1.5
2.0 |
 Latest
Regional
Recovery
Outlooks
--
Wallboard
Single Family Housing Starts, 2012Q4=1
2012 Relative
MSA Scale in
Starts
Source: Moody’s Economy.com, July 2013, Company analysis
Phoenix is expected to drive higher than
average growth ahead in this region
Areas like DFW and
Denver
have already been
on
the mend and
are
starting
from
“up the
curve” 43
0
1
2
3
4
2013Q1
2014Q1
2015Q1
2016Q1
Duke, OK
Eagle, CO
Albuquerque
Georgetown
(Charleston, SC, Columbia, SC, Wilmington,
NC, Raleigh, NC, Charlotte, NC, Atlanta,
Jacksonville, FL, Savannah, GA MSA’s)
(Albuquerque, NM, Santa Fe, NM, Phoenix,
AZ MSAs)
(DFW-Arlington, Oklahoma City, OK, Little
Rock, AR, Wichita Falls, TX, Wichita, KS MSA’s)
(Denver, Co, Boulder, Co, Cheyenne, WY, Salt
Lake, UT MSA’s) |
 Repair and Remodeling Outlook
Harvard’s Outlook Suggests Growing Strength
44 |
 Financial Discipline is a Key Enabler of Success
An Eagle Hallmark
Capital Structure
Funding Strategy
Use of Cash
45 |
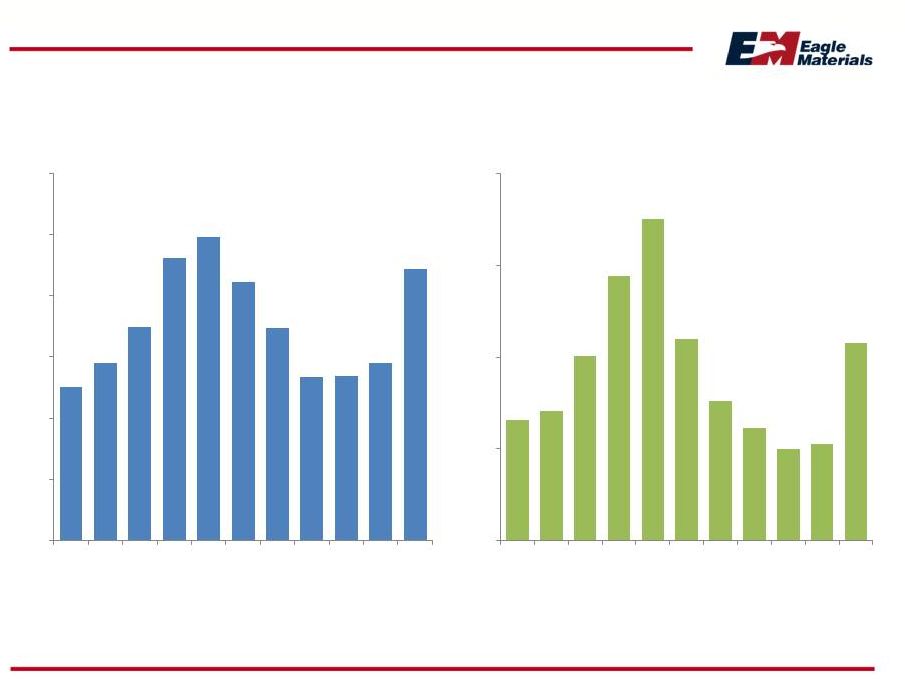 Financial Summary
Profitable Performance Throughout the Cycle
Note: Dollars in millions. For fiscal years ending March 31. Pro forma LTM
periods include Acquired Assets. (1)
(2)
Adjusted Revenues
(1)
Adjusted EBITDA
(2)
46
$501
$579
$699
$925
$994
$845
$695
$533
$537
$581
$889
$0
$200
$400
$600
$800
$1,000
$1,200
2003
2004
2005
2006
2007
2008
2009
2010
2011
2012
2013
PF
$131
$141
$201
$289
$351
$220
$152
$123
$100
$105
$216
$0
$100
$200
$300
$400
2003
2004
2005
2006
2007
2008
2009
2010
2011
2012
2013
PF
Includes
our
proportionate
share
of
our
JV’s
revenues.
Adjusted
Revenues
is
a
non-GAAP
measure.
See
slides
titled
“Non-GAAP
Reconciliation”
in
the
Appendix.
PF
Adjusted
Revenues
includes
revenues
for
the
Acquired
Assets
from
April
1,
2012
through
November
30,
2012
(Acquisition
Date).
Adjusted EBITDA represents earnings before: (i) interest, taxes,
depreciation and amortization; (ii) certain other non-cash or non-routine
items; and (iii) acquisition costs and other
overhead
costs
allocated
to
the
Acquired
Assets.
Adjusted
EBITDA
is
a
non-GAAP
measure.
See
slides
titled
“Non-GAAP
Reconciliation”
in
the
Appendix.
PF
Adjusted
EBITDA includes EBITDA for the Acquired Assets from April 1, 2012 through November
30, 2012 (Acquisition Date). |
 Eagle Evolution Since Peak of Last Cycle
Long-Standing Goal of Doubling Peak-to-Peak Earnings Power
1.
One-third more productive capacity in place
Cement: Illinois expansion (additional 470,000 tons)
Wallboard: Ultra-efficient plant built in Georgetown
Paper: 350,000 ton capacity today (220,000 tons last peak)
2.
Cement acquisitions increased capacity by 60% November 30, 2012
Two cement plants and related assets
3.
Shift of cement product mix toward oil well and other specialties
Class H at Texas Lehigh was ~25% now over 50%
4.
We believe that over time our frac sand opportunity has as much
earnings contribution potential as does cement or wallboard
47 |
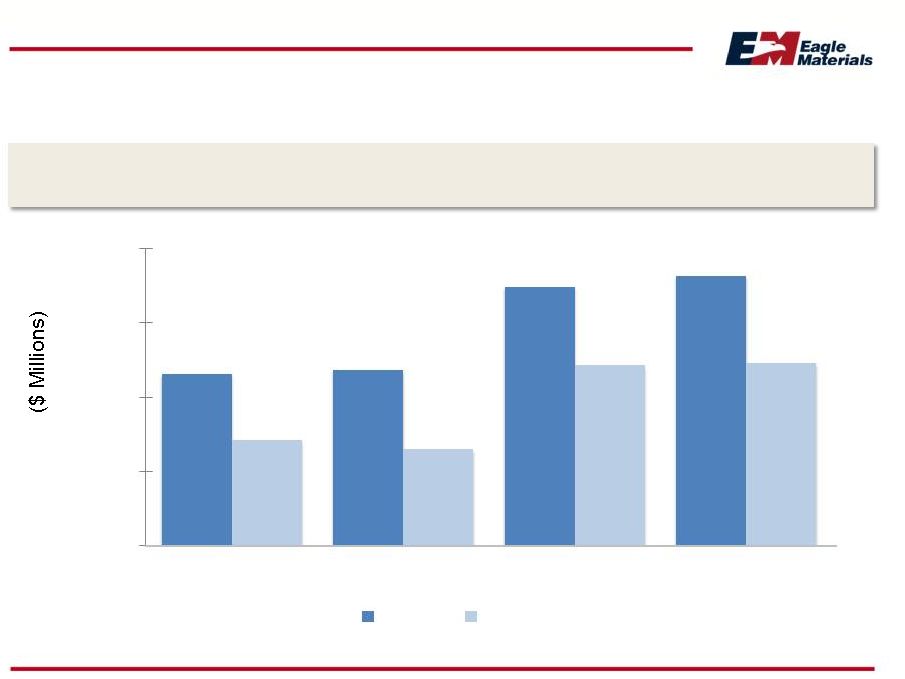 Capital Structure
Net Debt-to-Cap
38%
35%
41%
40%
Net Debt-to-Equity
62%
55%
70%
68%
3/31/11
3/31/12
3/31/13
6/30/13
48
$462
$473
$696
$725
$285
$260
$485
$491
$-
$200
$400
$600
$800
Equity
Net Debt |
 Debt Maturity Profile
$9.5
$57.0
$8.0
$81.2
$36.5
Fiscal Years
49
$0.0
$20.0
$40.0
$60.0
$80.0
$100.0
2014
2015
2016
2017
2018
2019
2020
2005 Senior Notes
2007 Senior Notes |
 Disciplined Use of Cash
$ Millions
Maintenance
Dividends
Growth and
Improvement
Share
Repurchases
Note:
Issued
3.5
million
shares
in
FY
13
pursuant
to
the
Lafarge
Acquisition
Assets.
50
$0
$100
$200
$300
$400
$500
$600
FY02
FY03
FY04
FY05
FY06
FY07
FY08
FY09
FY10
FY11
FY12
FY13 |
 Investment Summary
Eagle Materials
•
Low cost producer
•
Leading positions in attractive markets
•
Now in early innings of the up-cycle
•
Favorable secular demand trends, especially for cement and frac-sand
•
Recently acquired assets have increased Eagle’s cement capacity by 60%
•
Track record of sound strategic choices and superior operational
execution
•
Healthy capital structure and increasing capacity to fund growth
51 |
 Non-GAAP Reconciliation
52 |
 Non-GAAP Reconciliation
Adjusted EBITDA
$ million
3/31/03
3/31/04
3/31/05
3/31/06
3/31/07
3/31/08
3/31/09
3/31/10
3/31/11
3/31/12
PF
3/31/13
Net Income
$ 57.6
$ 66.9
$ 106.7
$ 161.0
$ 202.7
$ 97.8
$ 41.8
$ 29.0
$ 14.8
$ 18.7
$ 57.7
Plus:
Taxes
29.0
35.2
51.4
80.1
101.6
46.6
20.4
10.3
1.9
3.2
26.4
Interest
9.6
3.8
3.3
6.3
5.4
21.1
28.9
21.5
16.5
16.6
15.8
DD&A
33.2
33.0
34.5
38.6
40.0
44.9
51.2
50.8
49.2
50.1
56.9
Other
Charges
1.4
2.2
5.5
3.2
1.8
9.7
9.8
11.0
17.9
15.9
14.9
Adjusted
EBITDA
$ 131
$ 141
$ 201
$ 289
$ 351
$ 220
$ 152
$ 123
$ 100
$ 105
$ 171
Acquired Assets EBITDA for the eight months ended 11/30/12 (see attached)
$ 45
FY 2013 Pro Forma Total Adjusted EBITDA
$ 216
Adjusted EBITDA represents earnings before (i) interest, taxes, depreciation and
amortization, (ii) certain other non-cash or non-routine items, and
(iii) acquisition costs and other overhead costs allocated to the Lafarge Target Business. Adjusted
EBITDA is a non-GAAP measure that provides supplemental information regarding
the operating performance of our business
without
regard
to
financing
methods,
capital
structures
or
historical
cost
bases
and
is
used
as
a
benchmark
for
evaluating
the
creditworthiness
of
particular
issuers.
Adjusted
EBITDA
should
not,
however,
be
considered
as
an
alternative
to net income, operating income, cash flow from operations or any other measure of
financial performance in accordance with GAAP.
53 |
 Non-GAAP Reconciliation
Adjusted EBITDA
$ million
6 months ended
9/30/12
2 months ended
11/30/12
8 months
Acquired Assets Net Earnings
$ 5
$ 4
Plus:
Taxes
3
3
Interest
1
1
DD&A
11
3
Overhead
Allocation
Adjustment
12
2
Acquired Assets EBITDA
$ 32
$ 13
$ 45
The following provides a reconciliation of the Acquired Assets EBITDA for the 8
months ended 11/30/12: 54 |
 Non-GAAP Reconciliation
Adjusted Revenue
$ million
3/31/03
3/31/04
3/31/05
3/31/06
3/31/07
3/31/08
3/31/09
3/31/10
3/31/11
3/31/12
PF
3/31/13
Eagle
$ 429
$ 503
$ 617
$ 860
$ 918
$ 748
$ 599
$ 468
$ 462
$ 495
$ 643
Joint
Venture
(50%)
72
76
82
65
76
97
96
65
75
86
96
Total
$ 501
$ 579
$ 699
$ 925
$ 994
$ 845
$ 695
$ 533
$ 537
$ 581
$ 739
Acquired Assets Revenue for 8 months ended 11/30/12 (see attached)
$ 150
Pro Forma Total
$ 889
55 |
 Non-GAAP Reconciliation
Adjusted Revenue
$ million
9 months ended
9/30/12
2 months ended
11/30/12
8 months
Acquired Assets Revenue
$ 112
$ 38
$ 150
56
The following provides a reconciliation of the Acquired Assets revenue for the 8 months ended 11/30/12: |
 MAJOR FACILITIES
GYPSUM WALLBOARD PLANTS
AMERICAN GYPSUM COMPANY
Albuquerque, New Mexico
Bernalillo, New Mexico
Gypsum, Colorado
Duke, Oklahoma
Georgetown, South Carolina
PAPERBOARD MILL
REPUBLIC PAPERBOARD
COMPANY LLC
Lawton, Oklahoma
LEGEND
CEMENT PLANTS
CEMENT TERMINALS
WALLBOARD PLANTS
WALLBOARD DISTRIBUTION YARDS
CONCRETE OPERATIONS
AGGREGATES OPERATIONS
PAPERBOARD MILL
DALLAS HEADQUARTERS
MARYSVILLE
RENO (FERNLEY)
ALBUQUERQUE
BERNALILLO
AUSTIN (BUDA)
DALLAS
DUKE
LAWTON
LASALLE
GEORGETOWN
LARAMIE
GYPSUM
TULSA
KANSAS CITY, KS & MO
CONCRETE, AGGREGATES, SAND PLANTS
CENTEX MATERIALS LLC
Austin and Buda, Texas
MATHEWS READYMIX LLC
Marysville, California
TALON CONCRETE AND AGGREGATES LLC
Kansas
&
Missouri
–
10
locations
WESTERN AGGREGATES LLC
Marysville, California
NORTHERN WHITE SAND COMPANY LLC
Corpus Christi, Texas
CEMENT PLANTS
CENTRAL PLAINS CEMENT
COMPANY LLC
Sugar Creek, Missouri
Tulsa, Oklahoma
ILLINOIS CEMENT COMPANY LLC
LaSalle, Illinois
MOUNTAIN CEMENT COMPANY
Laramie, Wyoming
NEVADA CEMENT COMPANY
Fernley, Nevada
TEXAS LEHIGH CEMENT
COMPANY LP
Buda, Texas
(50% joint venture)
SAND PLANT |
 Contact Information
Steve Rowley
President and CEO
(214) 432-2020
srowley@eaglematerials.com
Craig Kesler
Executive Vice President and CFO
(214) 432-2013
ckesler@eaglematerials.com
Bob Stewart
Executive Vice President, Strategy, Corporate Development and Communications
(214) 432-2040
bstewart@eaglematerials.com
Eagle Materials
Inc. NYSE: EXP
www.eaglematerials.com
58 |