Attached files
| file | filename |
|---|---|
| 8-K - FORM 8-K - UNITED COMMUNITY FINANCIAL CORP | d590363d8k.htm |
 2013 Annual Meeting
August 2013
Exhibit 99 |
 Patrick W. Bevack
President and Chief Executive Officer |
 Forward-Looking Statement Disclosure
3
When used in this presentation the words or phrases “will likely
result,” “are expected to,” “will
continue,” “is anticipated,” “estimate,” “project” or
similar expressions are intended to identify “forward-looking
statements” within the meaning of the Private Securities
Litigation Reform Act of 1995. Such statements are subject to
certain risks and uncertainties, including changes in economic
conditions in United Community’s market area, changes in
policies by regulatory agencies, fluctuations in interest rates, demand for
loans in Home Savings’ market area, and competition, that could
cause actual results to differ materially from results
presently anticipated or projected. United Community cautions
readers not to place undue reliance on any such
forward-looking statements, which speak only as of the date made.
United Community advises readers that the factors listed above
could affect United Community’s financial performance and
could cause United Community’s actual results for future
periods to differ materially from any opinions or statements
expressed with respect to future periods in any current statements.
United Community undertakes no obligation to update any
forward-looking statement to reflect events or
circumstances after the date on which the statement is made.
Actual results may differ materially from our statements due to
a number of risks and uncertainties, including those described in the
Company’s Form 10-K for the year ended December 31, 2012 and
subsequent filings. Please refer to these SEC documents
for a complete list of risk factors.
|
 Non-GAAP Financial Measures
4
This presentation contains financial information determined by methods
other than those prescribed by accounting principles generally
accepted in the United States of America ("GAAP").
Management uses these non-GAAP financial measures because
it believes that they are useful for evaluating our operations
and performance over periods of time, as well as in managing
and evaluating our business and in discussions about our
operations and performance. Management believes these
non-GAAP financial measures provide users of our financial
information
with
meaningful
measures
for
assessing
our
financial
results,
as
well as a comparison to financial results for prior periods.
These non-GAAP financial measures should not be considered
as a substitute for financial measures determined in accordance
with GAAP and may not be comparable to other similarly titled
financial measures used by other companies. A reconciliation of
the differences between our non-GAAP financial measures and
the most comparable GAAP measures accompanies the use of such non-
GAAP financial measures within the body of this presentation.
|
 Major Goals
5
Achieve termination of the Regulatory Orders at the Bank
and Holding Company
Establish a strong management team that works well together
Improve asset quality and establish a strong credit culture
Raise a sufficient amount of capital to strengthen the
financials of the Company and to position us to take
advantage of future opportunities
Established upon being named CEO |
 Review of Financial Performance
Asset Quality
$0
$50,000
$100,000
$150,000
$200,000
$250,000
$300,000
1Q
'11
2Q
'11
3Q
'11
4Q
'11
1Q
'12
2Q
'12
3Q
'12
4Q
'12
1Q
'13
2Q
'13
Classified Assets
($000’s)
6
We reduced classified assets from
$253.9 million to $44.9 million, a
reduction of $209.0 million over
the last eighteen months
–
Classified Assets is comprised
of Classified Loans plus Real
Estate Owned (REO) and
repossessed assets
–
Classified Loans are loans
that have a well-defined
weakness |
 Review of Financial Performance (cont.)
Asset Quality
$0
$50,000
$100,000
$150,000
$200,000
1Q
'11
2Q
'11
3Q
'11
4Q
'11
1Q
'12
2Q
'12
3Q
'12
4Q
'12
1Q
'13
2Q
'13
Nonperforming Assets
($000’s)
7
We reduced nonperforming assets
from $156.6 million to $40.5
million, a $116.1 million
improvement over the last
eighteen months
–
Nonperforming Assets
includes Nonperforming
Loans plus REO and
repossessed assets
–
Nonperforming Loans include
loans that are 90 days past
due and nonaccrual loans |
 Review of Financial Performance (cont.)
Stock Price
Stock Price
January 1, 2011 through June 30, 2013
8
The stock price improved from
$1.27 per share at the end of the
fourth quarter of 2011 to $4.65 at
the end of the second quarter of
2013
UCFC’s market capitalization at
the end of the fourth quarter of
2011 was $41.4 million, compared
to $233.4 million at the end of the
second quarter of 2013
$0.00
$0.50
$1.00
$1.50
$2.00
$2.50
$3.00
$3.50
$4.00
$4.50
$5.00
1Q
'11
2Q
'11
3Q
'11
4Q
'11
1Q
'12
2Q
'12
3Q
'12
4Q
'12
1Q
'13
2Q
'13 |
 Review of Financial Performance (cont.)
Stock Price
% Price Change Compared to SNL U.S. Bank and Thrift
January 1, 2011 through June 30, 2013
UCFC’s stock price performance
was significantly better than the
average of other banks and thrifts
over the past two years |
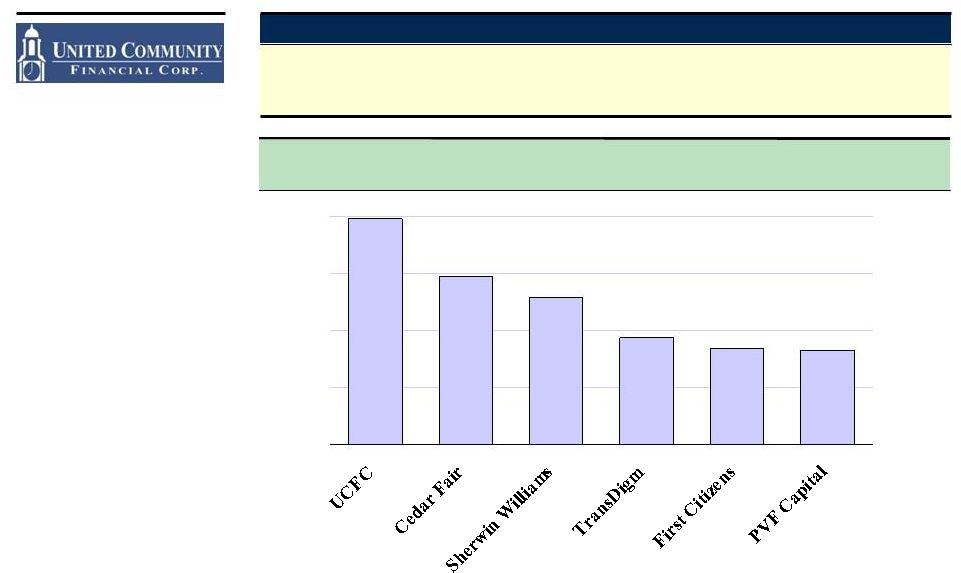 Top Performing Ohio Businesses
Top Two-Year Returns
Two-Year Return as of April 30, 2013
Source: S&P Capital IQ
0%
50%
100%
150%
200% |
 James R. Reske
Chief Financial Officer and Treasurer |
 Operations
33 Branches and 9 Loan Production Offices
Headquartered in Youngstown, Ohio, but its market area extends across
northern Ohio and into western Pennsylvania
Overview
12 |
 Major Accomplishments
2012 and 2013 YTD
13
Bulk sale of troubled assets
–
Home Savings successfully completed a bulk sale of a substantial
amount of the Bank’s troubled loans, along with other assets, to
an unrelated party on September 21, 2012
•
The bulk sale lifted $92.7 million of classified assets off of the
Bank’s books
Completion of the capital raise
–
In the first half of 2013, the Company completed a $47.0 million
capital raise
Lifting of regulatory orders
–
The Bank’s Consent Order was lifted in January 2013
–
The Holding Company’s Cease and Desist Order was lifted in July
2013
•
Both the Bank and the Holding Company remain under informal
memorandums of understanding with the regulators
Overview |
 Capital Ratios
Capital Adequacy at Home Savings
C & D
8.0%
“Well-
Capitalized”
5.0%
Tier 1 Leverage Ratio (Core Capital / Average Assets)
Home Savings
Notes:
1.
The Bank C&D was issued in August 2008, and its capital
requirements went into effect as of 12/31/08
2. On
March
30,
2012,
the
C&D
was
terminated
and
the
Bank
was
issued
a
Consent
Order
3.
On January 31, 2013, the Consent Order was lifted and the Bank entered
into an MOU Total Risk-Based Capital to Risk-Weighted
Assets Home Savings
C & D /
Consent
Order/MOU
12.0%
“Well-
Capitalized”
10.0%
14
Capital
Consent
Order
9.0%
MOU
8.5%
Home Savings is now considered
well-capitalized
0.0%
1.0%
2.0%
3.0%
4.0%
5.0%
6.0%
7.0%
8.0%
9.0%
10.0%
11.0%
7.49%
8.20%
8.33%
8.50%
8.68%
8.22%
8.47%
8.71%
8.23%
7.84%
8.44%
8.40%
8.13%
8.16%
8.96%
9.32%
8.37%
8.70%
9.84%
10.03%
C&D
(1)
Consent
Order
(2)
MOU
(3)
0.0%
2.0%
4.0%
6.0%
8.0%
10.0%
12.0%
14.0%
16.0%
18.0%
20.0%
11.8%
12.1%
12.5%
12.8%
13.0%
12.8%
12.7%
13.2%
13.1%
12.5%
13.0%
13.5%
13.3%
14.6%
15.2%
16.4%
16.0%
16.2%
18.3%
19.4%
C&D
(1)
Consent
Order
(2)
MOU
(3) |
 Review of Financial Performance
UCFC
Earnings
Analysis
(1)
Earnings prior to tax, loan
loss provision and other
items
Provision expense
Goodwill charge
Key
Income tax
UCFC’s ability to generate pre-
tax, pre-provision earnings has
helped to offset the effect of loan
loss provision expense over the
course of this credit cycle
The wave of the credit cycle is
demonstrated in UCFC’s
provision expense
Butler Wick
Earnings
Notes:
1.
The table above contains certain financial information determined to
be a presentation not in accordance with GAAP. We have
provided information about significant events that occurred
during the period because we believe this information is useful to
both investors and management and aids in the overall
understanding of their impact on the Company’s overall performance. Users
should consider this financial information a supplementary tool for
analysis purposes and not substitute it for GAAP net
income 2.
Total reflects $150,000 of AMT tax
15
($MM):
$24.1
$4.1 ($35.3) ($16.8)
($37.3)
$0.2 ($20.4) $6.2
(2)
2006
2007
2008
Net Income
2009
2010
2011
2012
Bulk Sale Provision
(25.3)
(62.4)
(9.9)
(33.6)
(29.4)
(4.3)
39.7
31.4
26.2
24.9
9.5
(3.2)
(24.7)
(49.1)
(28.8)
18.0
24.9
18.4
$0.9
$0.2
3.2
(0.9)
(12.4)
1.2
$1.1
$2.4
$2.0
$4.9
($70)
($60)
($50)
($40)
($30)
($20)
($10)
$0
$10
$20
$30
$40
$50
2006
2007
2008
2009
2010
2011
2012
1H 2013
1H 2013 |
 Reductions in Real Estate Owned (REO)
Real Estate Acquired through Foreclosure
REO Inflows/Outflows: through June 30, 2013
($MM)
REO Inflows/Outflows: 2012
($MM)
16
80 Properties
19 Properties
105 Properties
166 Properties
256 Properties
77 Properties
167 Properties
166 Properties
$18.1
$0.9
($7.8)
$11.2
($20)
$0
$20
12/31/12 Balance
Inflows
Outflows
6/30/13 Balance
$32.9
$6.0
($20.8)
$18.1
($40)
($20)
$0
$20
$40
12/31/11 Balance
Inflows
Outflows
12/31/12 Balance
UCFC’s REO portfolio shrank
from 256 properties worth $32.9
million at the end of 2011 to 166
properties worth $18.1 million at
December 31, 2012
Since December 31, 2011, the
Company took in 77 properties
worth $6.0 million, but sold 167
properties worth $20.8 million
As of December 31, 2012 ($MM):
Bal.
No.
–
Residential
$6.3
75
–
Construction
10.0
79
–
Commercial
1.8
12
$18.1
166
UCFC’s REO portfolio shrank
from 166 properties worth $18.1
million at the end of 2012 to 105
properties worth $11.2 million at
June 30, 2013
Since December 31, 2012, the
Company took in 19 properties
worth $0.9 million, but sold 80
properties worth $7.8 million
As of June 30, 2013 ($MM):
Bal.
No.
–
Residential
$3.4
56
–
Construction
6.9
41
–
Commercial
0.9
8
$11.2
105 |
 Interest Rate Risk
The Benefits of a Rising Rate Environment
Impact of Immediate 200 bp Rate Increase on Next 12 Months Net Interest
Income UCFC’s goal is to effectively
manage interest rate risk
Interest rate risk can be measured
in many different ways, including
the effect on net interest income
due to a rise in interest rates
UCFC is currently asset-sensitive
As of June 30, 2013, if interest
rates should suddenly rise (here, a
hypothetical instantaneous 200
basis point positive parallel yield
curve shift), UCFC’s projected net
interest income would increase by
approximately $3.2 million
17
($000) |
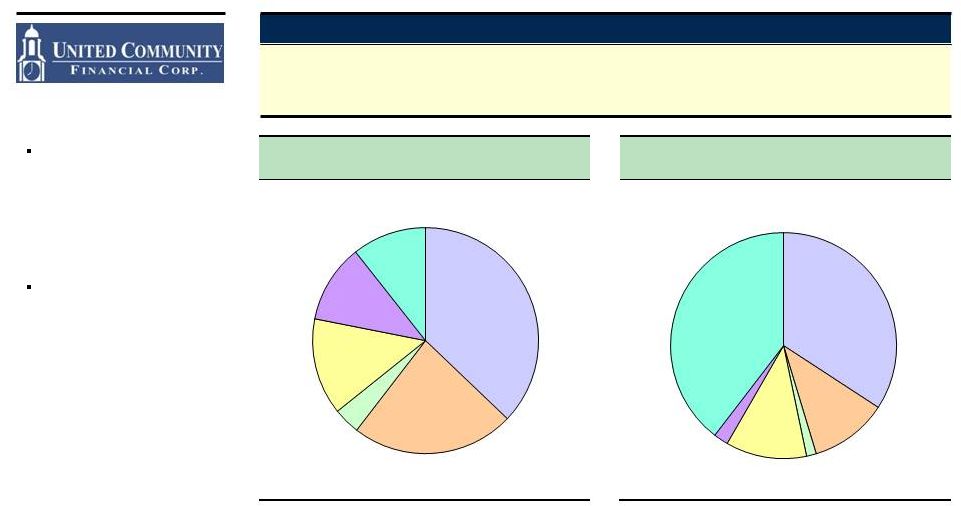 Earning Assets
Reduction of Higher-Risk Asset Classes
UCFC’s mix of earning assets has
changed significantly over the
course of the economic crisis
–
Higher-risk lending categories
have declined
–
Securities make up a larger
portion of earning assets
UCFC’s Deferred Tax Asset
(DTA) was $28.8 million at
December 31, 2012
–
The DTA is revalued annually
–
Updated valuations would
take into account the tax
effect of any unrealized loss
in the securities portfolio
18
1-4 Family
$922.3, 37%
Consumer
$343.9, 14%
Comm’l RE
$578.9, 23%
Construction
$279.9, 11%
Commercial
$94.5, 4%
1-4 Family
$576.3, 34%
Commercial
$23.6, 1%
Construction
$35.3, 2%
Consumer
$195.4, 12%
Comm’l RE
$187.6, 11%
Notes:
1.
The loan segments are presented net of the allowance for loan
losses. Loans available for sale are included
in
the
1-4
family
segment
along
with
all
deferred
fees
2.
The
securities
segment
is
inclusive
of
AFS
securities
along
with
fed
funds
sold
and
FHLB
stock
Securities and Other
(2)
$666.8, 40%
Securities and Other
(2)
$263.9, 11%
Interest-earning Assets
Total Earning Assets as of 12/31/2008
(1)
Total: $2.5 billion
Total Earning Assets as of 6/30/2013
(1)
Total: $1.7 billion |
 UCFC has shifted its funding mix
away from higher-cost time
deposits in favor of lower-cost
core deposits
Total cost of deposits was 0.51%
at June 30, 2013
Deposits & Borrowings as of 12/31/2008
Total Deposits: $1.9 billion
Total Borrowings: $462.9 million
Deposits & Borrowings as of 6/30/13
Total Deposits: $1.5 billion
Total Borrowings: $140.6 million
Interest-bearing Liabilities
Note:
1.
Includes term FHLB borrowings and term repos
19
Deposits and Borrowings
Reduced Reliance on Time Deposits while Increasing Core Deposits
Total Checking
$205.7, 9%
Money Market
$273.4, 11%
Savings
$181.6, 8%
CDs
$1,225.3, 52%
Term Borrowings
(1)
$281.2, 12%
Overnight Borrowings
$181.7, 8%
Term Borrowings
(1)
$140.6, 9%
CDs
$526.1, 34%
Savings
$273.0, 17%
Money Market
$334.2, 21%
Total Checking
$300.5, 19%
Rate Schedule
Total Checking
0.39% Term
Borrowings 4.28%
Money Market
2.76%
Overnight Borrowings 2.07%
Savings
0.45%
CDs
4.29%
Cost of Deposits: 3.19%
Cost of Funds: 3.27%
Rate Schedule
Cost of Deposits: 0.51%
Cost of Funds: 0.86%
Total Checking
0.05% Term
Borrowings 4.28%
Money Market
0.27%
Savings
0.11%
CDs
1.23% |
 United Community Financial Corp.
NASDAQ: UCFC
www.UCFCONLINE.com
www.HOMESAVINGS.com
Headquarters
275 West Federal Street
Youngstown, Ohio 44503
20
Questions |