Attached files
| file | filename |
|---|---|
| 8-K - 8-K - PACWEST BANCORP | a13-19328_18k.htm |
Exhibit 99.1
|
|
PRESENTATION TO INVESTORS AND ANALYSTS Second Quarter 2013 August and September 2013 |
|
|
FORWARD-LOOKING STATEMENTS This communication contains certain forward-looking information about PacWest, CapitalSource, and the combined company after the close of the transaction that is intended to be covered by the safe harbor for “forward-looking statements” provided by the Private Securities Litigation Reform Act of 1995. All references herein to PacWest are intended to refer to PacWest and its predecessor First Community Bancorp. All statements other than statements of historical fact are forward-looking statements. Such statements involve inherent risks and uncertainties, many of which are difficult to predict and are generally beyond the control of PacWest, CapitalSource and the combined company. Forward-looking statements speak only as of the date they are made and we assume no duty to update such statements. We caution readers that a number of important factors could cause actual results to differ materially from those expressed in, or implied or projected by, such forward-looking statements. In addition to factors previously disclosed in reports filed by PacWest and CapitalSource with the SEC, risks and uncertainties for each institution and the combined institution include, but are not limited to: lower than expected revenues; credit quality deterioration or a reduction in real estate values could cause an increase in the allowance for credit losses and a reduction in net earnings; increased competitive pressure among depository institutions; the ability to complete the proposed transaction, including obtaining regulatory approvals and approval by the stockholders of PacWest and CapitalSource, or any future transaction, successfully integrate such acquired entities, or achieve expected beneficial synergies and/or operating efficiencies, in each case within expected time-frames or at all; regulatory approvals may not be received on expected timeframes or at all; settlements with the FDIC related to loss-sharing arrangements; the possibility that personnel changes will not proceed as planned; the possibility that the cost of additional capital may be more than expected; the possibility that a change in the interest rate environment may reduce net interest margins; asset/liability re-pricing risks and liquidity risks; pending legal matters may take longer or cost more to resolve or may be resolved adversely; general economic conditions, either nationally or in the market areas in which the entities operate or anticipate doing business, are less favorable than expected; and environmental conditions, including natural disasters, may disrupt business, impede operations, or negatively impact the values of collateral securing loans. For a more complete discussion of risks and uncertainties, investors and security holders are urged to read PacWest’s and CapitalSource’s respective reports filed with or furnished to the SEC. Please see the following slide for where those reports may be obtained. Pro forma, projected and estimated numbers are used for illustrative purposes only and are not forecasts, and actual results may differ materially. August and September 2013 2 |

|
|
ADDITIONAL INFORMATION ABOUT THE PROPOSED TRANSACTION AND WHERE TO FIND IT Investors and security holders are urged to carefully review and consider each of PacWest Bancorp’s and CapitalSource Inc.’s public filings with the SEC, including but not limited to their Annual Reports on Form 10-K, their proxy statements, their current reports on form 8-K, and their Quarterly Reports on Form 10-Q. The documents filed by PacWest with the SEC may be obtained free of charge at PacWest’s website at www.pacwestbancorp.com or at the SEC’s website at www.sec.gov. These documents may also be obtained free of charge from PacWest by requesting them in writing to PacWest Bancorp, c/o Pacific Western Bank, 275 North Brea Boulevard, Brea, CA 92821; Attention: Investor Relations, or by telephone at (714) 671-6800. The documents filed by CapitalSource with the SEC may be obtained free of charge at CapitalSource’s website at www.capitalsource.com or at the SEC’s website at www.sec.gov. These documents may also be obtained free of charge from CapitalSource by requesting them in writing to CapitalSource Inc., 633 West 5th Street, 33rd Floor, Los Angeles, CA 90071, Attention: Investor Relations, or by telephone at Phone: (866) 876-8723. This communication does not constitute an offer to sell or the solicitation of an offer to buy any securities or a solicitation of any vote or approval. PacWest Bancorp intends to file a registration statement with the SEC which will include a joint proxy statement of PacWest and CapitalSource and a prospectus of PacWest, and each party will file other documents regarding the proposed transaction with the SEC. Before making any voting or investment decision, investors and security holders of CapitalSource and PacWest Bancorp are urged to carefully read the entire registration statement and joint proxy statement/prospectus, when they become available, as well as any amendments or supplements to these documents, because they will contain important information about the proposed transaction. A definitive joint proxy statement/prospectus will be sent to the stockholders of each institution seeking any required stockholder approvals. Investors and security holders will be able to obtain the registration statement and the joint proxy statement/prospectus free of charge from PacWest or CapitalSource by writing to the addresses provided for each company set forth in the paragraphs above. PacWest, CapitalSource, their directors, executive officers and certain other persons may be deemed to be soliciting proxies from PacWest Bancorp and CapitalSource stockholders in favor of the approval of the transaction. Information about the directors and executive officers of PacWest and their ownership of PacWest common stock is set forth in the proxy statement for PacWest’s 2013 annual meeting of stockholders, as previously filed with the SEC. CapitalSource, its directors, executive officers and certain other persons may be soliciting proxies from CapitalSource stockholders in favor of the approval of the acquisition. Information about the directors and executive officers of CapitalSource and their ownership of CapitalSource common stock is set forth in the proxy statement for CapitalSource’s 2013 annual meeting of stockholders, as previously filed with the SEC. Stockholders may obtain additional information regarding the interests of such participants by reading the registration statement and the joint proxy statement/prospectus when they become available. August and September 2013 3 |

|
|
PACWEST BANCORP NASDAQ Symbol Fully Diluted Shares Market Capitalization Average Volume Dividends Per Share (Annualized) Analyst Coverage PACW 46.081 Million* $1.5 Billion** 387,000 shares per day ** $1.00 per year (2.90%** yield) D.A. Davidson & Co. FIG Partners Friedman Billings Ramsey Keefe, Bruyette & Woods, Inc. RBC Capital Markets Sandler O’Neill + Partners Sterne Agee & Leach, Inc. Wunderlich Securities August and September 2013 Stock Summary * Common and unvested restricted shares less treasury shares as of 6/30/13 ** As of 8/22/2013 4 |

|
|
PACWEST BANCORP August and September 2013 Presentation Index Overview 6 Operating Principles 7 2Q13 Review Highlights. 8 Credit 10 NIM and Investments. 23 Expense Control. 28 Performance Charts 29 Strong Franchise Value. 31 California Public Banks and Thrifts 33 Acquisition Activity. 35 First California Financial Group (FCAL) 36 CapitalSource, Inc. (CSE). 37 Non-GAAP Measurements 51 5 |

|
|
PACW OVERVIEW $6.7 Billion in Assets at June 30, 2013 75 Full-Service Offices: 72 in Southern California and 3 in the Bay Area August and September 2013 Commercial Banking Focus in Southern California Source: Company Filings * See “Non-GAAP Measurements” slide. Strong Capital Levels* Proven Operating Model Generates Earnings For the Second Quarter of 2013 NIM 5.22% Loan Yield 6.73% All-in Deposit Cost 0.17% Adjusted Efficiency Ratio 62.4%* Adjusted Earnings From Continuing Operations Before Income Taxes $27.9 Million* Strong Credit Quality at June 30, 2013 Non-Purchased Credit Impaired NPA Ratio 2.91% Credit Loss Allowance to Net Non-Purchased Credit Impaired (Non-PCI) Loans and Leases 1.78% Credit Loss Allowance to Non-Purchased Credit Impaired (Non-PCI) Nonaccruals 135% Low Risk Profile Experienced Acquirer 26 Bank and Finance Company Acquisitions, Including 3 FDIC-Assisted Deals 6 as of 6/30/13 Equity ($ millions) Equity/Assets Per Share Company - Tangible* $572.3 8.83% $12.42 Company - GAAP $801.7 11.95% $17.40 Bank - Tangible* $661.1 10.22% n/a Bank - GAAP $890.5 13.29% n/a |

|
|
PACW Manage for Profitability, Not Growth Strategic Focus on Low-Cost Deposits Strong Expense Management Focus on Credit Quality Results Include: Strong Net Interest Margin Controlled Operating Expenses Sustained Profitability August and September 2013 Operating Principles 7 |

|
|
HIGHLIGHTS Patient approach to loan growth - Strong pipeline Asset financing loan growth: $7.1 million Strong on-balance sheet liquidity August and September 2013 2nd Quarter 2013 Credit loss reserve coverage ratios on non-purchased credit impaired loans are strong ACL to loans: 1.78% ACL to nonaccruals: 135% Net earnings of $4.3 million, or $0.11 per share Adjusted earnings from continuing operations before income taxes at $27.9 million * Tangible capital at $572.3 million, or $12.42 per share * DDAs to total deposits: 41% Core deposits to total deposits: 85% * See “Non-GAAP Measurements” slide. 8 |

|
|
HIGHLIGHTS August and September 2013 Solid Earnings Track Record * See “Non-GAAP Measurements” slide. 9 |

|
|
CREDIT August and September 2013 Credit Quality is Stable (1) Classified loans and leases are those with a credit risk rating of substandard or doubtful. 10 June 30, March 31, December 31, September 30, June 30, 2013 2013 2012 2012 2012 (Dollars in thousands) Non-PCI Credit Quality Metrics: Allowance for credit losses 69,926 $ 71,896 $ 72,119 $ 75,012 $ 78,031 $ Nonaccrual loans and leases 51,689 43,127 41,762 39,185 55,894 Classified loans and leases (1) 128,181 107,178 104,054 100,308 144,075 Performing restructured loans 83,543 80,501 106,288 112,834 103,815 Net charge-offs 1,970 223 2,893 1,019 3,706 Provision for credit losses - - - (2,000) - Allowance for credit losses to loans and leases 1.78% 2.41% 2.35% 2.44% 2.71% Allowance for credit losses to nonaccrual loans and leases 135.3% 166.7% 172.7% 191.4% 139.6% Nonperforming assets to loans and leases and other real estate owned 2.91% 3.17% 3.14% 3.27% 4.37% |

|
|
CREDIT August and September 2013 Strong Credit Coverage Ratios Non-PCI loans and leases only ACL to Loans 11 |

|
|
CREDIT August and September 2013 Nonaccrual Loans & Leases at Low Levels Non-PCI loans and leases only 12 |

|
|
CREDIT August and September 2013 Classified Loans & Leases at Historically Low Levels Excludes covered loans and leases Classified Loan Sales 13 Classified Loans & Leases ($ in Millions) 1Q10 2Q10 3Q10 4Q10 1Q11 2Q11 3Q11 4Q11 1Q12 2Q12 3Q12 4Q12 1Q13 2Q13 Pacific Western Bank $198.5 $226.4 $297.0 $214.0 $207.0 $215.4 $177.7 $185.6 $145.9 $139.9 $ 96.9 $101.0 $105.2 $116.0 |

|
|
CREDIT August and September 2013 Nonperforming Assets at Historically Low Levels Excludes covered assets Classified Loan Sales 14 |

|
|
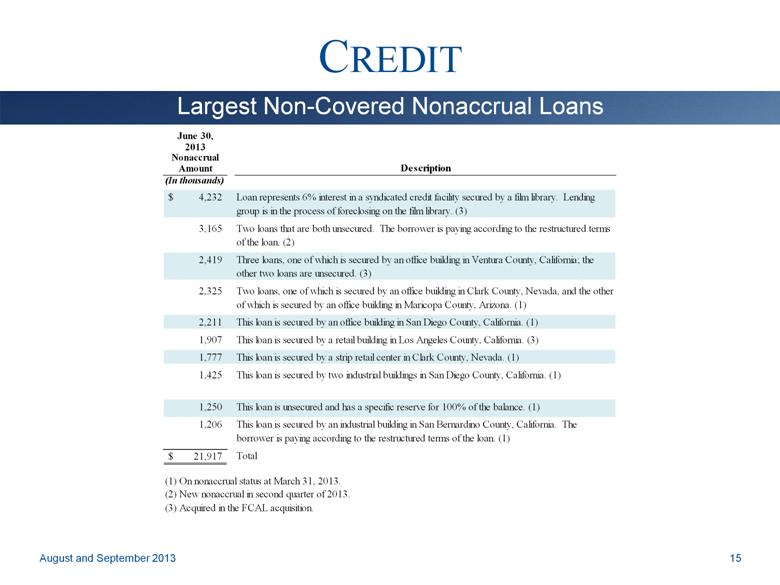
CREDIT August and September 2013 Largest Non-Covered Nonaccrual Loans 15 June 30, 2013 Nonaccrual Amount Description (In thousands) 4,232 $ Loan represents 6% interest in a syndicated credit facility secured by a film library. Lending group is in the process of foreclosing on the film library. (3) 3,165 Two loans that are both unsecured. The borrower is paying according to the restructured terms of the loan. (2) 2,419 Three loans, one of which is secured by an office building in Ventura County, California; the other two loans are unsecured. (3) 2,325 Two loans, one of which is secured by an office building in Clark County, Nevada, and the other of which is secured by an office building in Maricopa County, Arizona. (1) 2,211 This loan is secured by an office building in San Diego County, California. (1) 1,907 This loan is secured by a retail building in Los Angeles County, California. (3) 1,777 This loan is secured by a strip retail center in Clark County, Nevada. (1) 1,425 This loan is secured by two industrial buildings in San Diego County, California. (1) 1,250 This loan is unsecured and has a specific reserve for 100% of the balance. (1) 1,206 This loan is secured by an industrial building in San Bernardino County, California. The borrower is paying according to the restructured terms of the loan. (1) 21,917 $ Total (1) On nonaccrual status at March 31, 2013. (2) New nonaccrual in second quarter of 2013. (3) Acquired in the FCAL acquisition. |
|
|
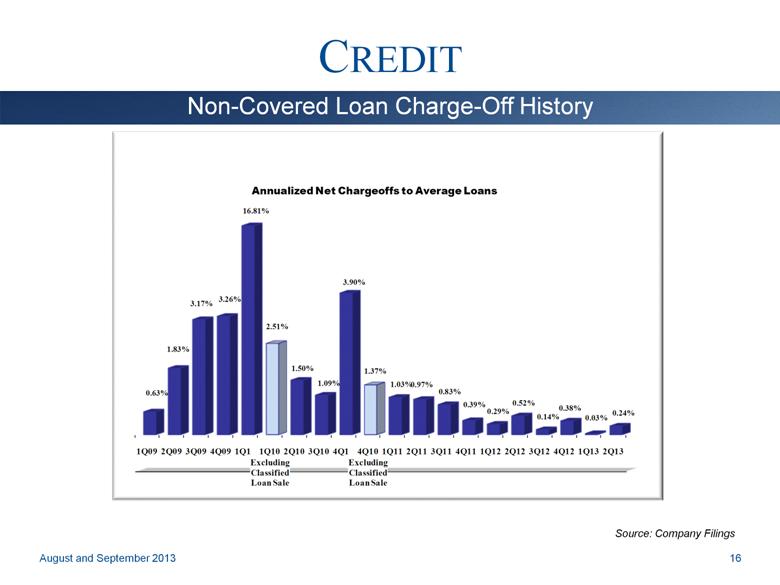
CREDIT August and September 2013 Non-Covered Loan Charge-Off History Source: Company Filings 16 1Q09 2Q09 3Q09 4Q09 1Q10 1Q10 Excluding Classified Loan Sale 2Q10 3Q10 4Q10 4Q10 Excluding Classified Loan Sale 1Q11 2Q11 3Q11 4Q11 1Q12 2Q12 3Q12 4Q12 1Q13 2Q13 0.63% 1.83% 3.17% 3.26% 16.81% 2.51% 1.50% 1.09% 3.90% 1.37% 1.03% 0.97% 0.83% 0.39% 0.29% 0.52% 0.14% 0.38% 0.03% 0.24% Annualized Net Chargeoffs to Average Loans |
|
|
CREDIT August and September 2013 Net Credit Costs - Components 17 Three Months Ended June 30, March 31, December 31, September 30, June 30, March 31, December 31, September 30, June 30, 2013 2013 2012 2012 2012 2012 2011 2011 2011 (In thousands) Provision (negative provision) for credit losses on non-PCI loans and leases - $ - $ - $ (2,000) $ - $ (10,000) $ - $ - $ 5,500 $ Non-covered OREO expense, net 80 313 316 1,883 130 1,821 1,714 2,293 2,300 Total non-covered net credit costs 80 313 316 (117) 130 (8,179) 1,714 2,293 7,800 Provision (negative provision) for credit losses on PCI loans (1,842) 3,137 (4,333) (141) (271) 3,926 4,122 348 5,890 Covered OREO expense (income), net (94) (813) (461) 4,290 2,130 822 226 4,813 1,205 (1,936) 2,324 (4,794) 4,149 1,859 4,748 4,348 5,161 7,095 Less: FDIC loss sharing (income) expense, net, excluding FDIC share of OTTI loss 5,410 3,137 6,022 367 994 3,579 (2,667) (963) (5,316) Total covered net credit costs 3,474 5,461 1,228 4,516 2,853 8,327 1,681 4,198 1,779 Total net credit costs 3,554 $ 5,774 $ 1,544 $ 4,399 $ 2,983 $ 148 $ 3,395 $ 6,491 $ 9,579 $ |

|
|
CREDIT August and September 2013 Net Credit Cost Component - FDIC Loss Sharing Income (Expense) 18 Three Months Ended June 30, March 31, Increase 2013 2013 (Decrease) (In thousands) FDIC Loss Sharing Income (Expense), Net: Gain on FDIC loss sharing asset (1) 494 $ 4,057 $ (3,563) $ FDIC loss sharing asset amortization, net (5,756) (5,991) 235 Loan recoveries shared with FDIC (2) - (591) 591 Net reimbursement (to) from FDIC for covered OREO activity (3) (149) (614) 465 Other 1 2 (1) FDIC loss sharing income (expense), net (5,410) $ (3,137) $ (2,273) $ (1) Includes increases related to covered loan loss provisions and decreases for write-offs for covered loans expected to be resolved at amounts higher than their carrying value. (2) Represents amounts to be reimbursed to the FDIC for covered loans resolved at amounts higher than their carrying values. (3) Represents amounts to be reimbursed to the FDIC for gains on covered OREO sales and due from the FDIC for covered OREO write-downs. |

|
|
CREDIT August and September 2013 Loan Portfolio Concentrations Excludes leases in process of $3.1 million. 19 June 30, 2013 Non-Covered Loans Total Loans Unrounded %'s and Leases Covered Loans and Leases % of % of % of Amount Total Amount Total Amount Total (Dollars in thousands) Real estate mortgage: Hospitality 191,167 $ 5% 2,445 $ - 193,612 $ 4% SBA 504 55,591 1% - - 55,591 1% Other 2,248,606 59% 534,793 92% 2,783,399 63% Total real estate mortgage 2,495,364 65% 537,238 92% 3,032,602 68% Real estate construction: Residential 57,936 2% 2,491 0% 60,427 1% Commercial 129,257 3% 24,051 4% 153,308 4% Total real estate construction 187,193 5% 26,542 4% 213,735 5% Total real estate loans 2,682,557 70% 563,780 96% 3,246,337 73% Commercial: Collateralized 517,422 13% 10,948 2% 528,370 12% Unsecured 98,703 2% 3,123 0 101,826 2% Asset-based 254,081 7% - - 254,081 6% SBA 7(a) 28,767 1% 25 - 28,792 1% Total commercial 898,973 23% 14,096 3% 913,069 21% Leases (1) 216,089 6% - - 216,089 5% Consumer 25,523 1% 3,528 0 29,051 1% Foreign 16,073 0% - - 16,073 - Total gross loans and leases 3,839,215 $ 100% 581,404 $ 100% 4,420,619 $ 100% |

|
|
CREDIT August and September 2013 Non-Covered Real Estate Mortgage Exposure 20 June 30, 2013 March 31, 2013 Rounding %'s % of % of Loan Category Amount Total Amount Total (Dollars in thousands) Commercial real estate mortgage: Industrial/warehouse $ 375,932 15% $ 286,911 16% Retail 291,259 12% 228,665 13% Office buildings 390,518 16% 290,399 16% Owner-occupied 173,855 7% 179,827 10% Hotel 191,167 8% 172,472 10% Healthcare 150,704 6% 108,693 6% Mixed use 77,609 3% 50,243 3% Gas station 27,861 1% 28,558 1% Self storage 47,441 2% 32,662 2% Restaurant 25,447 1% 16,480 1% Land acquisition/development 13,625 1% 21,851 1% Unimproved land 14,254 1% 11,778 1% Other 210,937 8% 165,809 9% Total commercial real estate mortgage 1,990,609 81% 1,594,348 89% Residential real estate mortgage: Multi-family 254,165 10% 100,666 5% Single family owner-occupied 171,801 7% 38,710 2% Single family nonowner-occupied 8,588 - 11,896 1% HELOCs 59,866 2% 49,560 3% Mixed use 10,335 - 1,304 - Total residential real estate mortgage 504,755 19% 202,136 11% Total gross non-covered real estate mortgage loans $ 2,495,364 100% $ 1,796,484 100% |

|
|
CREDIT August and September 2013 Covered Real Estate Loan Exposure 21 June 30, 2013 March 31, 2013 Rounding %'s % of % of Loan Category Amount Total Amount Total (Dollars in thousands) Commercial real estate mortgage: Industrial/warehouse $ 33,516 6% $ 25,369 5% Retail 89,983 17% 89,166 19% Office buildings 44,910 8% 45,930 9% Owner-occupied 14,373 3% 14,570 3% Hotel 2,445 1% 1,207 - Healthcare 12,911 2% 11,047 2% Mixed use 8,857 2% 2,723 1% Gas station 6,116 1% 6,180 1% Self storage 44,175 8% 38,175 8% Restaurant 905 - 1,563 - Unimproved land 132 - 150 - Other 15,142 3% 13,490 3% Total commercial real estate mortgage 273,465 51% 249,570 51% Residential real estate mortgage: Multi-family 148,855 28% 150,743 31% Single family owner-occupied 92,833 17% 69,044 14% Single family nonowner-occupied 15,889 3% 16,009 3% HELOCs 6,196 1% 2,093 1% Mixed use - - 2,047 - Total residential real estate mortgage 263,773 49% 239,936 49% Total gross covered real estate mortgage loans $ 537,238 100% $ 489,506 100% |

|
|
CREDIT August and September 2013 Other Real Estate Owned 22 June 30, 2013 March 31, 2013 Non-Covered Covered Non-Covered Covered Property Type OREO OREO OREO OREO (In thousands) Commercial real estate 9,743 $ 8,679 $ 791 $ 7,292 $ Construction and land development 33,050 6,306 31,670 6,475 Multi-family - 3,807 - 3,301 Single family residences 2,639 322 3,500 243 Total OREO 45,432 $ 19,114 $ 35,961 $ 17,311 $ |

|
|
NET INTEREST MARGIN August and September 2013 Strong Net Interest Margin Versus Peers Source: Company Filings and SNL Data Source Peers: NYSE, AMEX, NASDAQ Banks with $5B to $10B in assets as of period end 23 6.67% 6.34% 5.30% 4.79% 5.02% 5.26% 5.52% 5.22% 3.77% 3.62% 3.71% 3.63% 3.88% 3.86% 3.77% 3.68% 2006 2007 2008 2009 2010 2011 2012 2Q13 PACW Peers |

|
|
NET INTEREST MARGIN August and September 2013 Noninterest-Bearing Deposits Support NIM * 2004 excludes a $365.0 million short-term interest bearing deposit received on December 31, 2004 Source: Company Filings and SNL Data Source Noninterest-bearing deposits to total 24 35% 38% 42% 46% 49% 43% 37% 34% 32% 32% 37% 41% 41% 22% 23% 24% 24% 23% 22% 22% 22% 23% 23% 25% 30% 32% 2001 2002 2003 2004* 2005 2006 2007 2008 2009 2010 2011 2012 2Q13 PACW CA Peers |

|
|
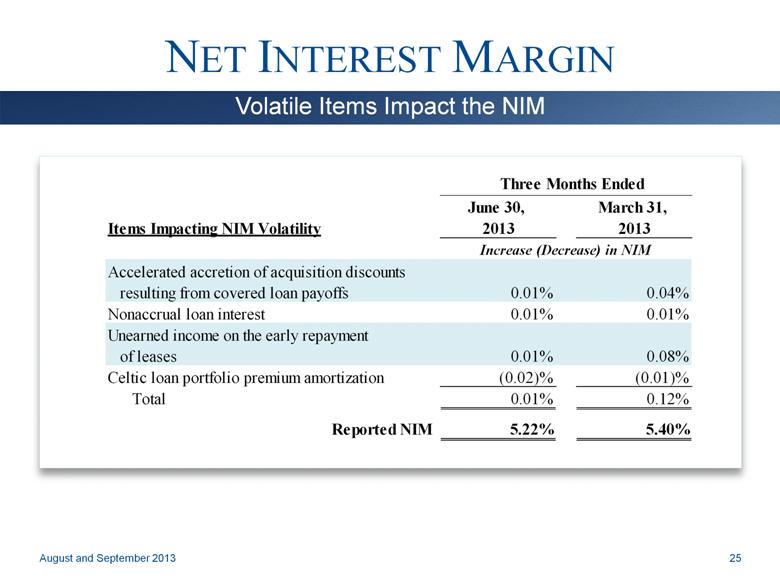
NET INTEREST MARGIN August and September 2013 Volatile Items Impact the NIM 25 Three Months Ended June 30, March 31, Items Impacting NIM Volatility 2013 2013 Increase (Decrease) in NIM Accelerated accretion of acquisition discounts resulting from covered loan payoffs 0.01% 0.04% Nonaccrual loan interest 0.01% 0.01% Unearned income on the early repayment of leases 0.01% 0.08% Celtic loan portfolio premium amortization (0.02)% (0.01)% Total 0.01% 0.12% Reported NIM 5.22% 5.40% |
|
|
INVESTMENT YIELDS AND DURATIONS August and September 2013 26 Carrying Tax Equivalent Duration Value Yield for Month at at of June 6/30/13 Security Type 6/30/13 2013 (in years) (In thousands) Residential mortgage-backed securities: Government agency and government- sponsored enterprise pass through securities 742,417 $ 1.70% 4.0 Government agency and government- sponsored enterprise collateralized mortgage obligations 145,320 1.40% 4.2 Covered private label collateralized mortgage obligations 40,917 13.86% 4.0 Municipal securities 424,174 4.47% 6.3 Corporate debt securities 83,132 2.66% 2.6 Other securities 37,618 1.03% 0.3 Total securities available-for-sale 1,473,578 $ 3.04% 4.5 |

|
|
MUNICIPAL BOND PORTFOLIO August and September 2013 27 June 30, 2013 Carrying % of Value Total (In thousands) Municipal Securities by State: Texas 79,599 $ 18% Washington 40,002 9% New York 32,360 8% Illinois 22,831 5% Colorado 19,856 5% Ohio 20,213 5% California 16,758 4% Hawaii 15,279 4% Florida 15,165 4% Massachusetts 15,153 4% Total of 10 largest states 277,216 66% All other states 146,958 34% Total municipal securities 424,174 $ 100% |

|
|
Efficiency Ratios Average Branch Size ($-M) EXPENSE CONTROL August and September 2013 Focus and Execution Drive Efficiency * The 2008 efficiency ratio excludes the goodwill write-off. When the goodwill write-off is included in non-interest expense, the efficiency ratio is 371.7%. ** Adjusted efficiency ratio – see Non-GAAP Measurements slide Source: Company Filings and SNL Data Source 28 Average Branch Size ($ - M) Efficiency Ratios |

|
|
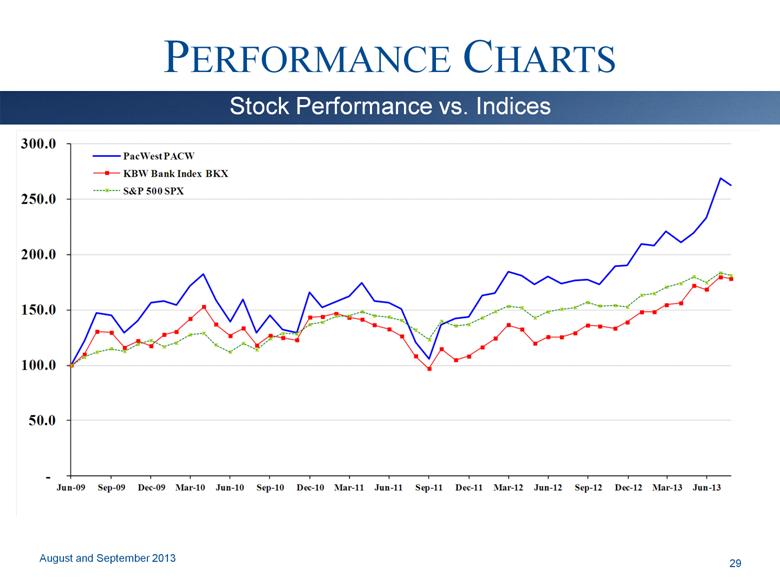
PERFORMANCE CHARTS August and September 2013 Stock Performance vs. Indices 29 - 50.0 100.0 150.0 200.0 250.0 300.0 Jun - 09 Sep - 09 Dec - 09 Mar - 10 Jun - 10 Sep - 10 Dec - 10 Mar - 11 Jun - 11 Sep - 11 Dec - 11 Mar - 12 Jun - 12 Sep - 12 Dec - 12 Mar - 13 Jun - 13 PacWest PACW KBW Bank Index BKX S&P 500 SPX |
|
|
PERFORMANCE CHARTS August and September 2013 Strong Capital Base * See “Non-GAAP Measurements” slide. 30 June 30, 2013 Well Pacific PacWest Capitalized Western Bancorp Requirement Bank Consolidated Regulatory capital ratios: Tier 1 leverage capital ratio 5.00% 12.05% 12.75% Tier 1 risk-based capital ratio 6.00% 14.16% 15.04% Total risk-based capital ratio 10.00% 15.42% 16.30% Tangible common equity ratio * N/A 10.22% 8.83% * See "Non-GAAP Measurements" slide. |

|
|
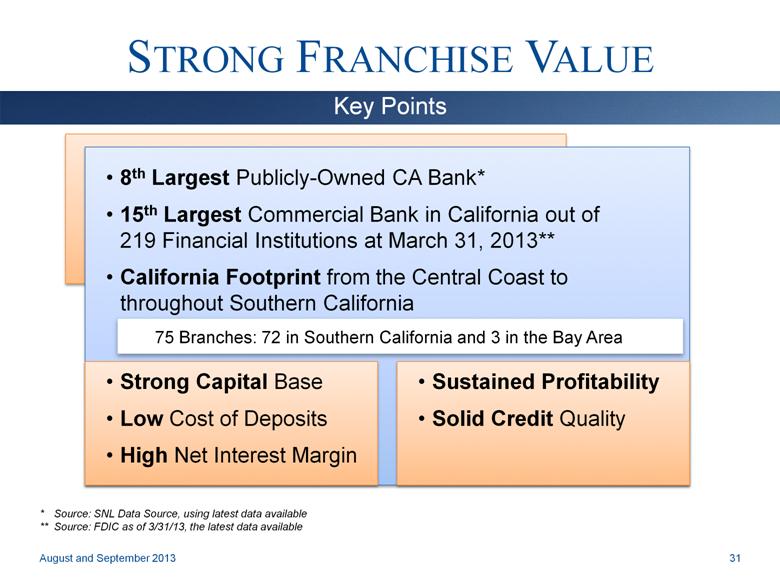
STRONG FRANCHISE VALUE 8th Largest Publicly-Owned CA Bank* 15th Largest Commercial Bank in California out of 219 Financial Institutions at March 31, 2013** California Footprint from the Central Coast to throughout Southern California 75 Branches: 72 in Southern California and 3 in the Bay Area August and September 2013 Key Points * Source: SNL Data Source, using latest data available ** Source: FDIC as of 3/31/13, the latest data available Strong Capital Base Low Cost of Deposits High Net Interest Margin Sustained Profitability Solid Credit Quality 31 |
|
|
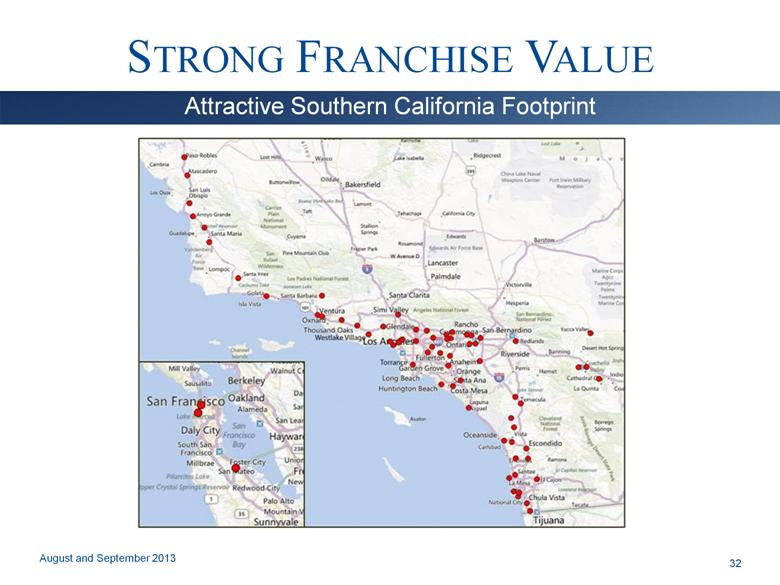
STRONG FRANCHISE VALUE August and September 2013 Attractive Southern California Footprint 32 |
|
|
PACW August and September 2013 California Public Banks & Thrifts –6/30/2013 Source: SNL Continued on next slide 33 Company Name Ticker Assets 1 Wells Fargo & Company WFC $1,440,563,000 2 First Republic Bank FRC 37,312,741 3 City National Corporation CYN 27,379,502 4 East West Bancorp, Inc. EWBC 23,308,406 5 SVB Financial Group SIVB 22,153,901 6 Cathay General Bancorp CATY 10,603,235 7 CapitalSource Inc. CSE 8,678,706 8 PacWest Bancorp PACW $6,709,102 9 CVB Financial Corp. CVBF 6,425,556 10 BBCN Bancorp, Inc. BBCN 5,863,014 11 Farmers & Merchants Bank of Long Beach FMBL 5,146,143 12 Westamerica Bancorporation WABC 4,813,908 13 Mechanics Bank MCHB 3,269,632 14 Community Bank CYHT 3,172,519 15 Wilshire Bancorp, Inc. WIBC 2,787,401 16 Hanmi Financial Corporation HAFC 2,773,414 17 TriCo Bancshares TCBK 2,587,931 18 Farmers & Merchants Bancorp FMCB 2,006,094 19 Exchange Bank EXSR 1,685,854 20 Preferred Bank PFBC 1,657,313 21 Pacific Premier Bancorp, Inc. PPBI 1,558,458 22 Bridge Capital Holdings BBNK 1,463,322 23 Bank of Marin Bancorp BMRC 1,428,518 24 Heritage Commerce Corp HTBK 1,399,506 25 Sierra Bancorp BSRR 1,378,424 26 American Business Bank AMBZ 1,298,343 27 CU Bancorp CUNB 1,278,661 28 Heritage Oaks Bancorp HEOP 1,096,882 29 Bank of Commerce Holdings BOCH 956,612 30 Pacific Mercantile Bancorp PMBC 952,113 |
|
|
PACW August and September 2013 California Public Banks & Thrifts, continued – 6/30/2013 Source: SNL Company Ticker Assets 34 31 North Valley Bancorp NOVB 917,758 32 FNB Bancorp FNBG 901,488 33 Central Valley Community Bancorp CVCY 871,372 34 First Northern Community Bancorp FNRN 844,664 35 California Republic Bancorp CRPB 737,120 36 1st Enterprise Bank FENB 716,111 37 Sunwest Bank SWBC 679,570 38 Pacific City Financial Corporation PFCF 652,511 39 Oak Valley Bancorp OVLY 644,230 40 United Security Bancshares UBFO 635,662 41 American River Bankshares AMRB 577,545 42 RBB Bancorp RBBO 575,853 43 Premier Valley Bank PVLY 553,445 44 Saehan Bancorp SAEB 542,366 45 Community West Bancshares CWBC 536,098 46 Commonwealth Business Bank CWBB 519,679 47 Security California Bancorp SCAF 497,734 48 Plumas Bancorp PLBC 493,106 49 1st Century Bancshares, Inc. FCTY 489,331 50 Manhattan Bancorp MNHN 481,813 51 Greater Sacramento Bancorp GSCB 466,839 52 Plaza Bank PLZB 463,926 53 Mission Community Bancorp MISN 446,956 54 Presidio Bank PDOB 433,186 55 Avidbank Holdings, Inc AVBH 432,515 56 Summit State Bank SSBI 432,067 57 Santa Cruz County Bank SCZC 381,152 58 Mission Bancorp MSBC 380,960 59 NCAL Bancorp NCAL 377,977 60 1st Capital Bank FISB 369,528 |
|
|
ACQUISITION ACTIVITY Similar Strategic Focus Asset generation capability Market Expansion In-Market Consolidation Key Drivers of Accretion: Cost Savings Customer Retention Margin Improvement August and September 2013 Acquisition Strategy 35 |

|
|
THE FCAL ACQUISITION The First California Financial Group, Inc. (FCAL) acquisition closed on May 31, 2013 – systems were converted on June 15, 2013 The acquisition is an attractive in-market consolidation of meaningful size and will drive significant consolidated earnings accretion Both banks possess complementary business banking models with strong core deposit bases The resulting banking franchise possesses the capital resources, scale, management team and financial strength necessary to thrive in the current competitive environment August and September 2013 36 |
|
|
Consideration Fixed exchange ratio consisting of 0.2837 of a share of PACW and $2.47 in cash $11.64 in value per CSE share (based on PACW closing price on July 19 of $32.32) Transaction Value $2.3 billion Ownership Post Deal 45% PacWest – 55% CapitalSource Termination PACW and CSE have granted each other customary reciprocal 19.9% stock options Board Composition PacWest to appoint 8; CapitalSource to appoint 5; John Eggemeyer to be Chairman Management Matt Wagner to be CEO; Jim Pieczynski to be President of the new CapitalSource division of Pacific Western Bank Anticipated Merger Related Charge to Equity After Tax $80 million Targeted Cost Savings $47 million pre-tax in 2015: 23% of CapitalSource’s non-interest expense and 12% of combined non-interest expense(1) Compelling Returns TBV Accretion at Close 2015 EPS Accretion Estimated IRR Dividend Transaction is financially compelling. For illustrative purposes, based on IBES consensus estimates:(2) ~ 10% ~ 18% ~ 20% Maintain current PacWest’s quarterly cash dividend of $0.25 per share Approvals Regulators and stockholders of each Company Targeted Closing First Quarter 2014 PROPOSED MERGER WITH CAPITALSOURCE August and September 2013 Note: Market data as of July 19, 2013. Percentages are based on 2Q’ 13 non-interest expense annualized. Estimated financial impact is presented solely for illustrative purposes using IBES consensus estimates. Neither PACW nor CSE endorse the IBES consensus estimates or publish financial guidance. Actual results may differ materially. Deal Summary 37 |

|
|
Financially Compelling Risk Management Factors Continuity and Growth For illustrative purposes, based on IBES consensus estimates:(3) 2015 estimated GAAP EPS accretion of ~18% 2015 estimated ROAA of ~1.65% and ROATCE of ~17% ~10% accretive to TBV per share Strong pro forma capital ratios(3) (4) ~10.5% TCE / TA ~11.7% Tier 1 Common ~15.7% Total RBC PROPOSED MERGER WITH CAPITALSOURCE Continues PACW’s growth as a highly profitable business-focused bank Creates the 6th largest publicly-owned bank headquartered in California(1) Top decile(2) NIM from strong asset yields and low cost funding Improved loan diversification with broadened middle-market reach Outstanding profitability with excellent asset quality Track record of 26 successfully integrated acquisitions since 2000 Top funding and lending teams drawn from each firm Excellent pro forma credit metrics(3) (4) - ~29% Classified / (Tier 1+ALLL)(3) (5) - ~74% ALLL/Non-Accrual Loans(3) (5) Ranking is based on total assets as of 1Q’ 13. Peers include U.S. banks traded on the NYSE or NASDAQ with assets between $10bn and $50bn. Estimated financial impact is presented solely for illustrative purposes using IBES consensus estimates. Neither PACW nor CSE endorse the IBES consensus estimates or publish financial guidance. Actual results may differ materially. As of December 31, 2013. Consolidated level. Assumes 90% of the credit mark is applied to classified assets and 75% to nonaccrual loans at the consolidated level. August and September 2013 Transaction Highlights 38 |

|
|
Prudent Pricing PACW-CSE Recent Transactions(2) Price / Book Value: 1.47x(1) 1.45x Price / Tangible Book Value: 1.66x(1) 1.64x Price / LTM Earnings: 17.8x(3) 18.8x PROPOSED MERGER WITH CAPITALSOURCE Compelling Returns For illustrative purposes, based on IBES consensus estimates:(4) 2015E estimated EPS accretion: ~18% TBV accretion at 12/31/13: ~10% Estimated IRR: ~20% Note: Market data as of July 19, 2013. Book value per share and tangible book value per share as of 2Q’ 13. Reflects median for non-assisted whole bank transactions announced since December 31, 2011 for targets with assets between $1.0 billion and $10.0 billion and < 4.0% NPAs to Assets. Reflects earnings per share for the period 3Q’ 12 – 2Q ‘13. Estimated financial impact is presented solely for illustrative purposes using IBES consensus estimates. Neither PACW nor CSE endorse the IBES consensus estimates or publish financial guidance. Actual results may differ materially. August and September 2013 Transaction Financial Rationale 39 |

|
|
PROPOSED MERGER WITH CAPITALSOURCE CAPITALSOURCE OVERVIEW Strong Loan Growth with Attractive Credit Quality and NIM Recognized leader in middle-market lending with an emphasis on specialization A diverse national lending platform positions the Company to grow consistently and capitalize on market opportunities As of June 30, 2013, $8.7 billion in assets, $6.5 billion in loans and $5.9 billion in deposits Bank-level non-accrual balance declined 66% since 1Q’11 Parent Company loan balance projected to be <$150mm by transaction close (~1% of combined total loans) (1) Gross Loans and Leases, HFI (1) Actual 2013 loan growth through June 30 of 10% Source: Company documents, SNL Financial. Note: Peers include US banks traded on the NYSE or NASDAQ with assets between $5bn and $10bn. Bank level. Net Interest Margin Nonaccrual Loans (1) (1) August and September 2013 CAGR = 21% 40 $4,020 $4,100 $4,580 $4,900 $5,088 $5,339 $5,363 $5,804 $6,007 $6,410 $3,000 $3,500 $4,000 $4,500 $5,000 $5,500 $6,000 $6,500 $7,000 1Q'11 2Q'11 3Q'11 4Q'11 1Q'12 2Q'12 3Q'12 4Q'12 1Q'13 2Q'13 5.43% 5.07% 4.94% 4.95% 5.12% 4.95% 4.97% 4.84% 5.08% 4.79% 3.71% 3.75% 3.84% 3.78% 3.73% 3.72% 3.71% 3.69% 3.66% 3.60% 3.00% 3.50% 4.00% 4.50% 5.00% 5.50% 6.00% 1Q'11 2Q'11 Q'11 4Q'11 1Q'12 2Q'12 Q'12 4Q'12 1Q'13 2Q'13 CapitalSource Bank Peer Median $172 $219 $107 $118 $81 $99 $64 $42 $30 $58 $133 $109 $119 $95 $97 $102 $98 $99 $100 $105 $0 $50 $100 $150 $200 $250 1Q'11 2Q'11 3Q'11 4Q'11 1Q'12 2Q'12 3Q'12 4Q'12 1Q'13 2Q'13 Nonaccrual Loans Loan Loss Reserve |

|
|
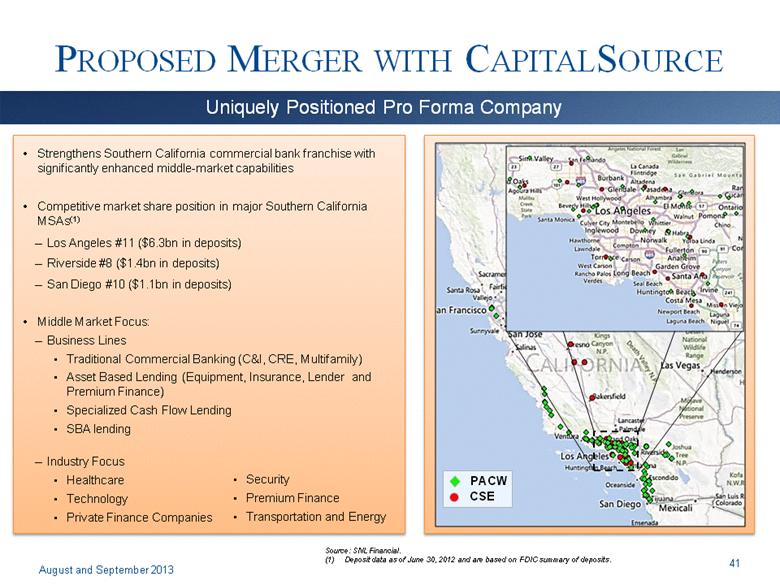
Strengthens Southern California commercial bank franchise with significantly enhanced middle-market capabilities Competitive market share position in major Southern California MSAs(1) Los Angeles #11 ($6.3bn in deposits) Riverside #8 ($1.4bn in deposits) San Diego #10 ($1.1bn in deposits) Middle Market Focus: Business Lines Traditional Commercial Banking (C&I, CRE, Multifamily) Asset Based Lending (Equipment, Insurance, Lender and Premium Finance) Specialized Cash Flow Lending SBA lending Industry Focus Healthcare Technology Private Finance Companies PROPOSED MERGER WITH CAPITALSOURCE Source: SNL Financial. (1) Deposit data as of June 30, 2012 and are based on FDIC summary of deposits. Security Premium Finance Transportation and Energy August and September 2013 Uniquely Positioned Pro Forma Company 41 |
|
|
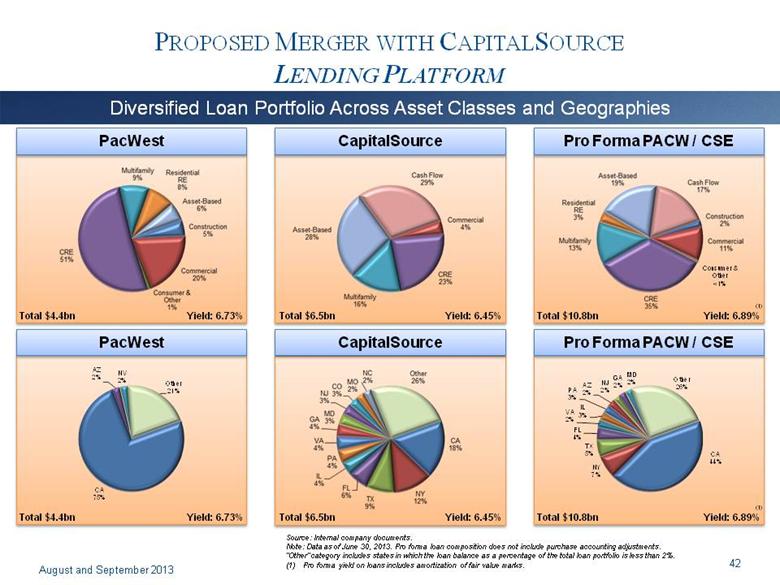
PROPOSED MERGER WITH CAPITALSOURCE LENDING PLATFORM Diversified Loan Portfolio Across Asset Classes and Geographies Source: Internal company documents. Note: Data as of June 30, 2013. Pro forma loan composition does not include purchase accounting adjustments. “Other” category includes states in which the loan balance as a percentage of the total loan portfolio is less than 2%. (1) Pro forma yield on loans includes amortization of fair value marks. August and September 2013 TBU PacWest PacWest CapitalSource CapitalSource Pro Forma PACW / CSE Pro Forma PACW / CSE Total $6.5bn Total $10.8bn Total $4.4bn Yield: 6.45% Yield: 6.89% Yield: 6.73% Total $6.5bn Total $10.8bn Total $4.4bn Yield: 6.45% Yield: 6.89% Yield: 6.73% Consumer & Other <1% (1) (1) 42 CA 44% NY 7% TX 5% FL 4% VA 2% IL 3% PA 3% AZ 2% NJ 2% GA 2% MD 2% Other 26% CA 75% AZ 2% NV 2% Other 21% |
|
|
PROPOSED MERGER WITH CAPITALSOURCE DEPOSIT PLATFORM Significant Opportunity to Improve Deposit Base Key Points Meaningful improvement in legacy CapitalSource deposit base can be achieved following the combination of the two companies Under its current charter, CapitalSource is not permitted to offer demand deposit accounts - Significant opportunity to attract CapitalSource loan customers as depositors PacWest has a strong deposit franchise with 85% of its deposits in non-CD accounts and has successfully integrated a number of acquisitions with a high proportion of time deposits Over time, the combined company expects to replace rate sensitive CD customers with core commercial banking clients Source: Internal company documents. Note: Data as of June 30, 2013. Pro forma deposit composition does not include purchase accounting adjustments. (1) Pro forma cost of deposits includes amortization of fair value marks and $25mm in pre-tax funding improvements. August and September 2013 PacWest CapitalSource Pro Forma PACW / CSE Total $5.9bn Total $11.4bn Total $5.5bn Cost: 88 bps Cost: 31 bps Cost: 17 bps (1) 43 |

|
|
PROPOSED MERGER WITH CAPITALSOURCE August and September 2013 Estimated financial impact is presented solely for illustrative purposes using IBES consensus estimates. Neither PACW nor CSE endorse the IBES consensus estimates or publish financial guidance. Actual results may differ materially. The CapitalSource Merger Generates Significant EPS Accretion 44 ($ in millions) 2014 2015 Standalone Earnings (1) $99.2 $109.1 Standalone EPS (1) $2.17 $2.39 Pro Forma GAAP Earnings $244.2 $289.7 Pro Forma Avg. Diluted Shares Outstanding 102.882 102.882 Pro Forma EPS $2.37 $2.82 EPS Accretion (%) (1) 9.4% 18.0% |

|
|
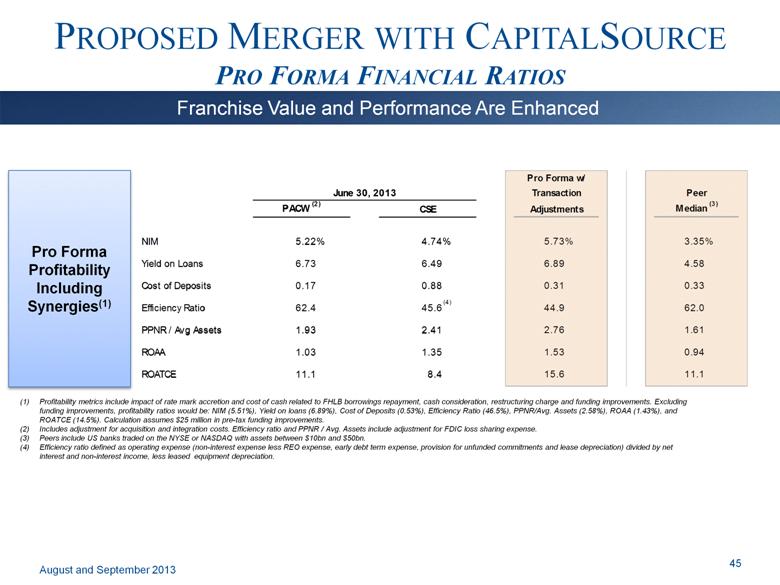
PROPOSED MERGER WITH CAPITALSOURCE PRO FORMA FINANCIAL RATIOS Franchise Value and Performance Are Enhanced (1) Profitability metrics include impact of rate mark accretion and cost of cash related to FHLB borrowings repayment, cash consideration, restructuring charge and funding improvements. Excluding funding improvements, profitability ratios would be: NIM (5.51%), Yield on loans (6.89%), Cost of Deposits (0.53%), Efficiency Ratio (46.5%), PPNR/Avg. Assets (2.58%), ROAA (1.43%), and ROATCE (14.5%). Calculation assumes $25 million in pre-tax funding improvements (2). Includes adjustment for acquisition and integration costs. Efficiency ratio and PPNR / Avg. Assets include adjustment for FDIC loss sharing expense (3). Peers include US banks traded on the NYSE or NASDAQ with assets between $10bn and $50bn. (4) Efficiency ratio defined as operating expense (non-interest expense less REO expense, early debt term expense, provision for unfunded commitments and lease depreciation) divided by net interest and non-interest income, less leased equipment depreciation. Pro Forma Profitability Including Synergies(1) August and September 2013 45 Pro Forma w/ June 30, 2013 Transaction PACW (2) CSE Adjustments NIM 5.22% 4.74% 5.73% Yield on Loans 6.73 6.49 6.89 Cost of Deposits 0.17 0.88 0.31 Efficiency Ratio 62.4 45.6 44.9 PPNR / Avg Assets 1.93 2.41 2.76 ROAA 1.03 1.35 1.53 ROATCE 11.1 8.4 15.6 (4) Pro Forma w/ June 30, 2013 Transaction Peer PACW (2) CSE Adjustments Median (3) NIM 5.22% 4.74% 5.73% 3.35% Yield on Loans 6.73 6.49 6.89 4.58 Cost of Deposits 0.17 0.88 0.31 0.33 Efficiency Ratio 62.4 45.6 44.9 62.0 PPNR / Avg Assets 1.93 2.41 2.76 1.61 ROAA 1.03 1.35 1.53 0.94 ROATCE 11.1 8.4 15.6 11.1 (4) |
|
|
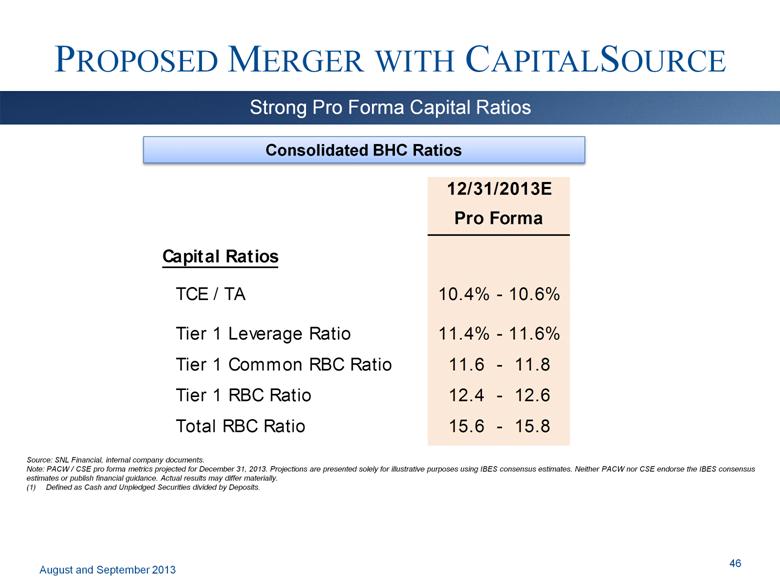
PROPOSED MERGER WITH CAPITALSOURCE Source: SNL Financial, internal company documents. Note: PACW / CSE pro forma metrics projected for December 31, 2013. Projections are presented solely for illustrative purposes using IBES consensus estimates. Neither PACW nor CSE endorse the IBES consensus estimates or publish financial guidance. Actual results may differ materially. Defined as Cash and Unpledged Securities divided by Deposits. (1) Consolidated BHC Ratios August and September 2013 Strong Pro Forma Capital Ratios 46 12/31/2013E Pro Forma Capital Ratios TCE / TA 10.4% - 10.6% Tier 1 Leverage Ratio 11.4% - 11.6% Tier 1 Common RBC Ratio 11.6 - 11.8 Tier 1 RBC Ratio 12.4 - 12.6 Total RBC Ratio 15.6 - 15.8 |
|
|
California(2) PROPOSED MERGER WITH CAPITALSOURCE Source: SNL Financial. Note: PACW / CSE pro forma metrics projected for December 31, 2013. Projections are based on consensus analyst estimates. PacWest and CapitalSource do not provide guidance and is not adopting or endorsing such estimates. Other financial data as of or for the most recent quarter available. Ranked by TCE / TA. Data as of March 31, 2013. Data set includes publicly traded banks headquartered in California with assets greater than $10bn. Excludes announced merger targets. Data as of March 31, 2013. Data set includes publicly traded nationwide banks with assets between $10bn and $50bn. Excludes announced merger targets. Top 10 nationwide BHCs ranked by TCE / TA. Top 10 Nationwide(3) August and September 2013 Peer Capitalization Metrics 47 Bank (1) City State Assets TCE / TA Leverage Tier 1 Common RBC Tier 1 RBC Total RBC Cathay General Bancorp El Monte CA $10,521 10.7% 13.1% 13.2% 16.4% 18.2% PACW / CSE Pro Forma Los Angeles CA 15,430 10.5 11.5 11.7 12.5 15.7 Wells Fargo & Company San Francisco CA 1,436,634 8.3 9.5 10.4 11.8 14.8 SVB Financial Group Santa Clara CA 22,796 8.3 8.4 12.9 13.3 14.6 East West Bancorp, Inc. Pasadena CA 23,102 8.2 9.2 12.9 14.1 15.6 First Republic Bank San Francisco CA 35,083 7.9 9.4 11.4 13.5 14.1 City National Corporation Los Angeles CA 27,434 6.3 6.7 8.7 9.6 12.7 Median 8.2 9.3 12.1 13.4 14.7 Top 10 Nationwide Banks (1) City State Assets TCE / TA Leverage Tier 1 Common RBC Tier 1 RBC Total RBC BankUnited Miami Lakes FL $12,746 14.0% 13.6% 31.1% 31.1% 32.4% Cathay General Bancorp El Monte CA 10,521 10.7 13.1 13.2 16.4 18.2 PACW / CSE Pro Forma Los Angeles CA 15,430 10.5 11.5 11.7 12.5 15.7 International Bancshares Laredo TX 11,520 10.2 11.4 17.3 20.3 21.4 First BanCorp San Juan PR 13,006 10.1 12.1 13.2 16.2 17.4 Synovus Financial Columbus GA 26,213 9.9 11.3 8.9 13.5 16.5 Umpqua Holdings Corporation Portland OR 11,491 9.7 11.6 12.9 15.7 16.9 BOK Financial Corporation Tulsa OK 27,447 9.7 9.3 13.2 13.4 15.7 Fulton Financial Corporation Lancaster PA 16,683 9.5 10.6 11.7 13.0 15.2 Signature Bank New York NY 18,267 9.4 9.3 15.2 15.2 16.3 Commerce Bancshares Kansas City MO 22,227 9.3 8.9 13.6 13.6 14.9 Median 8.3 9.3 11.7 13.3 15.1 (3) |

|
|
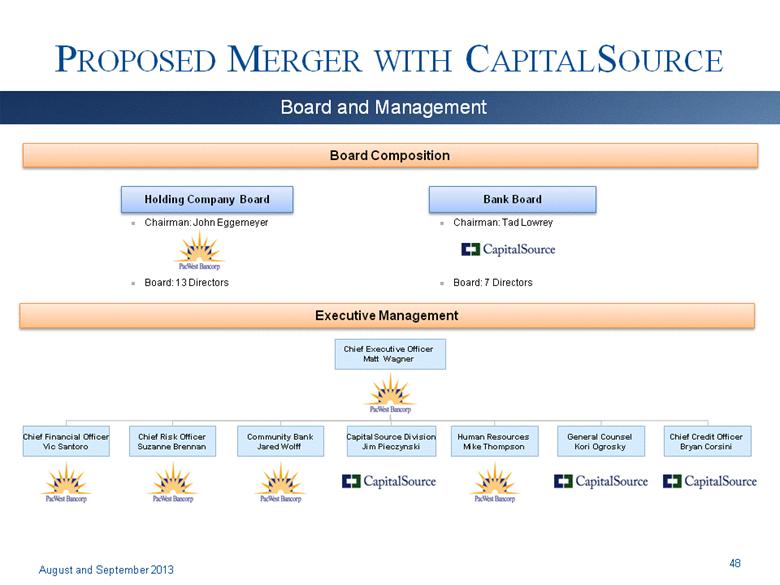
Chairman: John Eggemeyer Board: 13 Directors Chairman: Tad Lowrey Board: 7 Directors PROPOSED MERGER WITH CAPITALSOURCE Chief Executive Officer Matt Wagner CapitalSource Division Jim Pieczynski General Counsel Kori Ogrosky Chief Financial Officer Vic Santoro Chief Credit Officer Bryan Corsini Human Resources Mike Thompson Chief Risk Officer Suzanne Brennan Community Bank Jared Wolff Executive Management Board Composition Holding Company Board Bank Board August and September 2013 Board and Management 48 |
|
|
DTA Parties have taken steps designed to preserve NOL utilization without limitation Aggregate Other Assets Mark $28 million rate mark-up in securities Aggregate Other Liabilities Mark $7 million rate mark-up in deposits $15 million FHLB pre-payment fee Fair Value Marks Trust Preferred Securities: $138 million marked down Gross Loans: $206 million marked down Core Deposit Intangibles: $9 million(2) PROPOSED MERGER WITH CAPITALSOURCE All credit and fair value marks are estimates and subject to change. 1% of Core Deposits. Core Deposits defined as total deposits minus CDs. August and September 2013 Credit and Fair Value Marks(1) 49 |

|
|
PROPOSED MERGER WITH CAPITALSOURCE Superior middle-market lender and leading Southern California core-deposit-funded bank Reasonably priced merger creates financial benefits for both sets of shareholders Easy to understand transaction assumptions and integration plan Winning financial model of superior commercial asset generation with low cost deposit funding Combined company shareholder returns and capital ratios among the highest in the country August and September 2013 Conclusion 50 |

|
|
NON-GAAP MEASUREMENTS The Company uses certain non-GAAP financial measures to provide meaningful supplemental information regarding the Company’s operational performance and to enhance investors’ overall understanding of such financial performance. These non-GAAP financial measures are presented for supplemental informational purposes only for understanding the Company’s operating results and should not be considered a substitute for financial information presented in accordance with GAAP. These non-GAAP financial measures presented by the Company may be different from non-GAAP financial measures used by other companies. The table on the following slide presents a reconciliation of the non-GAAP financial measurements to the GAAP financial measurements and certain key performance ratios. August and September 2013 Overview 51 |

|
|
NON-GAAP MEASUREMENTS August and September 2013 Adjusted Earnings From Continuing Operations Before Income Taxes 52 Adjusted Earnings From Continuing June 30, December 31, June 30, Operations Before Income Taxes 2013 2012 2012 (In thousands) Earnings from continuing operations before income taxes 6,302 $ 21,213 $ 25,970 $ Plus: Total provision (negative provision) for credit losses (1,842) 3,137 (271) Non-covered OREO expense, net 80 313 130 Covered OREO (income) expense, net (94) (813) 2,130 Other-than-temporary impairment loss on covered security - - 1,115 Acquisition and integration costs 17,997 692 871 Less: FDIC loss sharing income (expense), net (5,410) (3,137) (102) Gain on sale of securities - 409 - Adjusted earnings from continuing operations before income taxes 27,853 $ 27,270 $ 30,047 $ Three Months Ended |

|
|
NON-GAAP MEASUREMENTS August and September 2013 (1) Tangible Equity (2) Calculated as tangible common equity divided by tangible assets. Calculated as tangible common equity divided by shares outstanding. 53 June 30, March 31, Tangible Common Equity 2013 2013 (Dollars in thousands) PacWest Bancorp Consolidated: Stockholders' equity 801,699 $ 589,796 $ Less: Intangible assets 229,380 93,220 Tangible common equity 572,319 $ 496,576 $ Total assets 6,709,102 $ 5,299,905 $ Less: Intangible assets 229,380 93,220 Tangible assets 6,479,722 $ 5,206,685 $ Equity to assets ratio 11.95% 11.13% Tangible common equity ratio (1) 8.83% 9.54% Book value per share 17.40 $ 15.91 $ Tangible book value per share (2) 12.42 $ 13.40 $ Shares outstanding 46,080,731 37,071,357 Pacific Western Bank: Stockholders' equity 890,477 $ 650,258 $ Less: Intangible assets 229,380 93,220 Tangible common equity 661,097 $ 557,038 $ Total assets 6,699,832 $ 5,278,470 $ Less: Intangible assets 229,380 93,220 Tangible assets 6,470,452 $ 5,185,250 $ Equity to assets ratio 13.29% 12.32% Tangible common equity ratio (1) 10.22% 10.74% June 30, March 31, June 30, Return on Average Tangible Equity 2013 2013 2012 (Dollars in thousands) PacWest Bancorp Consolidated: Net earnings 4,349 $ 13,494 $ 15,557 $ Average stockholders' equity 666,425 $ 589,207 $ 557,180 $ Less: Average intangible assets 129,863 93,786 81,184 Average tangible common equity 536,562 $ 495,421 $ 475,996 $ Annualized return on average equity 2.62% 9.29% 11.23% Annualized return on average tangible equity 3.25% 11.05% 13.15% Three Months Ended |

|
|
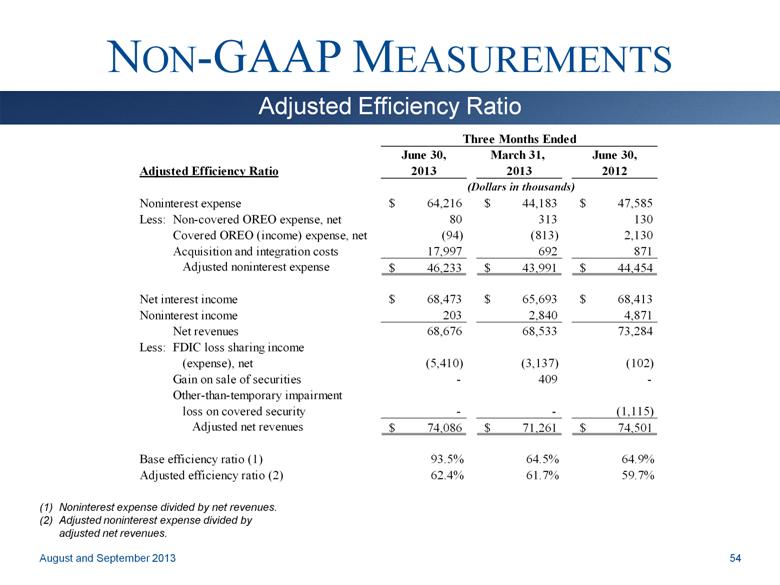
NON-GAAP MEASUREMENTS August and September 2013 Adjusted Efficiency Ratio (1) Noninterest expense divided by net revenues. (2) Adjusted noninterest expense divided by adjusted net revenues. 54 June 30, March 31, June 30, Adjusted Efficiency Ratio 2013 2013 2012 (Dollars in thousands) Noninterest expense $ 64,216 $ 44,183 $ 47,585 Less: Non-covered OREO expense, net 80 313 130 Covered OREO (income) expense, net (94) (813) 2,130 Acquisition and integration costs 17,997 692 871 Adjusted noninterest expense $ 46,233 $ 43,991 $ 44,454 Net interest income $ 68,473 $ 65,693 $ 68,413 Noninterest income 203 2,840 4,871 Net revenues 68,676 68,533 73,284 Less: FDIC loss sharing income (expense), net (5,410) (3,137) (102) Gain on sale of securities - 409 - Other-than-temporary impairment loss on covered security - - (1,115) Adjusted net revenues $ 74,086 $ 71,261 $ 74,501 Base efficiency ratio (1) 93.5% 64.5% 64.9% Adjusted efficiency ratio (2) 62.4% 61.7% 59.7% Three Months Ended |
|
|
10250 Constellation Boulevard, Suite 1640 Los Angeles, California 90067 Matt Wagner, CEO Vic Santoro, CFO (310) 728-1020 (310) 728-1021 |