Attached files
| file | filename |
|---|---|
| 8-K - 8-K - FIRST COMMUNITY CORP /SC/ | a13-18692_28k.htm |
Exhibit 99.1
|
|
Mike Crapps President and CEO 2013 U.S. BANK CONFERENCE August 22, 2013 Joe Sawyer Executive Vice President and CFO |
|
|
2 FIRST COMMUNITY BANK OUTLINE I. Background II. 2013 Performance III. Savannah River Financial Corporation Acquisition IV. Summary V. Addenda |
|
|
3 BACKGROUND |
|
|
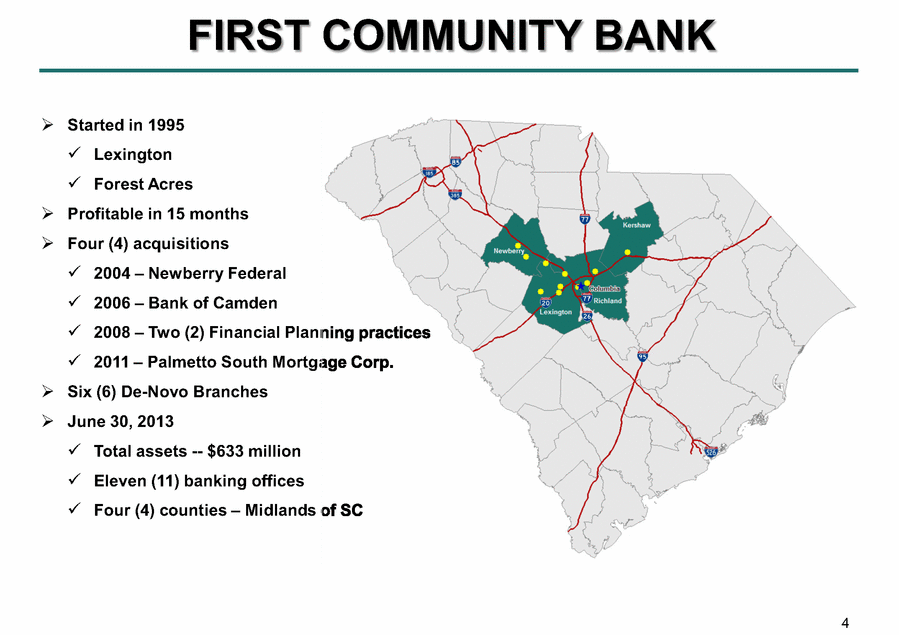
4 Started in 1995 Lexington Forest Acres Profitable in 15 months Four (4) acquisitions 2004 – Newberry Federal 2006 – Bank of Camden 2008 – Two (2) Financial Planning practices 2011 – Palmetto South Mortgage Corp. Six (6) De-Novo Branches June 30, 2013 Total assets -- $633 million Eleven (11) banking offices Four (4) counties – Midlands of SC FIRST COMMUNITY BANK |
|
|
5 VISION As the provider of choice of financial solutions to local businesses and professionals in the markets we serve, we optimize the long-term return to our shareholders, while providing a safe and sound investment. |
|
|
6 LINES OF BUSINESS Commercial and Retail Banking Residential Mortgage Banking Financial Planning and Investment Advisory Services |
|
|
7 CORE VALUES All of the above is accomplished, while the company and its employees remain grounded in its core values: Quality and integrity in all endeavors Passionate focus on the customer experience Mutual respect for colleagues and their unique role in the Bank’s success |
|
|
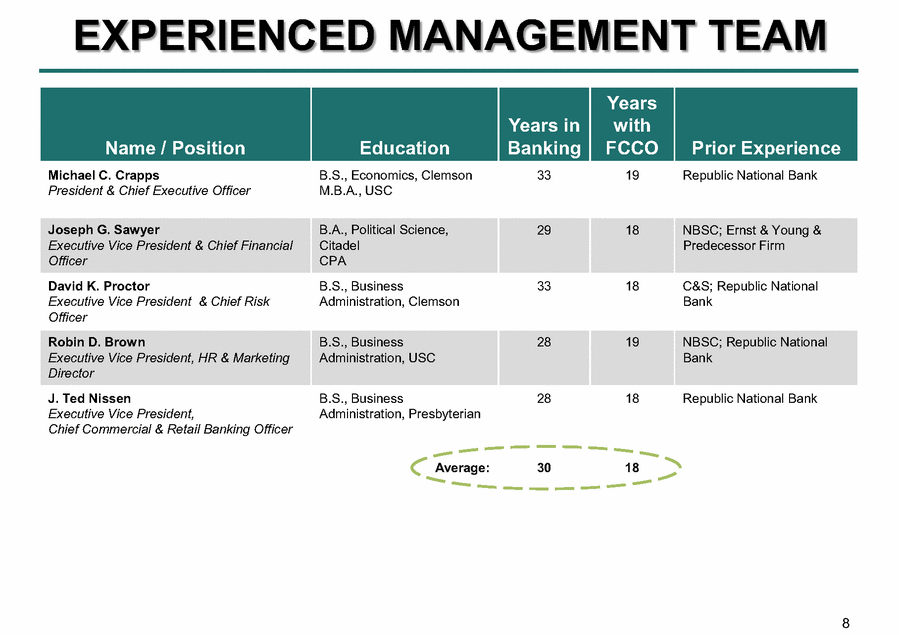
8 Name / Position Education Years in Banking Years with FCCO Prior Experience Michael C. Crapps President & Chief Executive Officer B.S., Economics, Clemson M.B.A., USC 33 19 Republic National Bank Joseph G. Sawyer Executive Vice President & Chief Financial Officer B.A., Political Science, Citadel CPA 29 18 NBSC; Ernst & Young & Predecessor Firm David K. Proctor Executive Vice President & Chief Risk Officer B.S., Business Administration, Clemson 33 18 C&S; Republic National Bank Robin D. Brown Executive Vice President, HR & Marketing Director B.S., Business Administration, USC 28 19 NBSC; Republic National Bank J. Ted Nissen Executive Vice President, Chief Commercial & Retail Banking Officer B.S., Business Administration, Presbyterian 28 18 Republic National Bank Average: 30 18 EXPERIENCED MANAGEMENT TEAM |
|
|
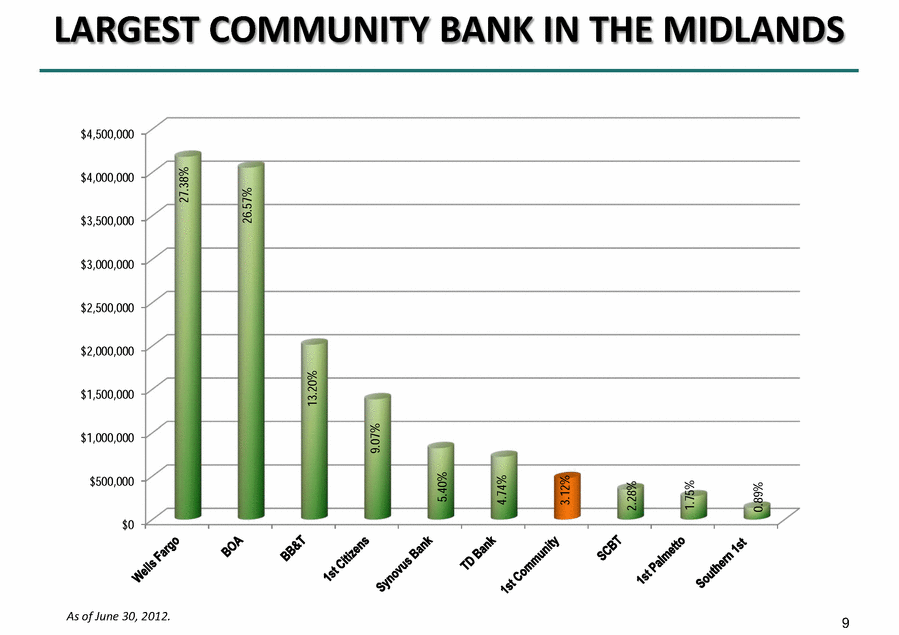
9 As of June 30, 2012. $0 $500,000 $1,000,000 $1,500,000 $2,000,000 $2,500,000 $3,000,000 $3,500,000 $4,000,000 $4,500,000 27.38% 26.57% 13.20% 9.07% 5.40% 4.74% 3.12% 2.28% 1.75% 0.89% LARGEST COMMUNITY BANK IN THE MIDLANDS |
|
|
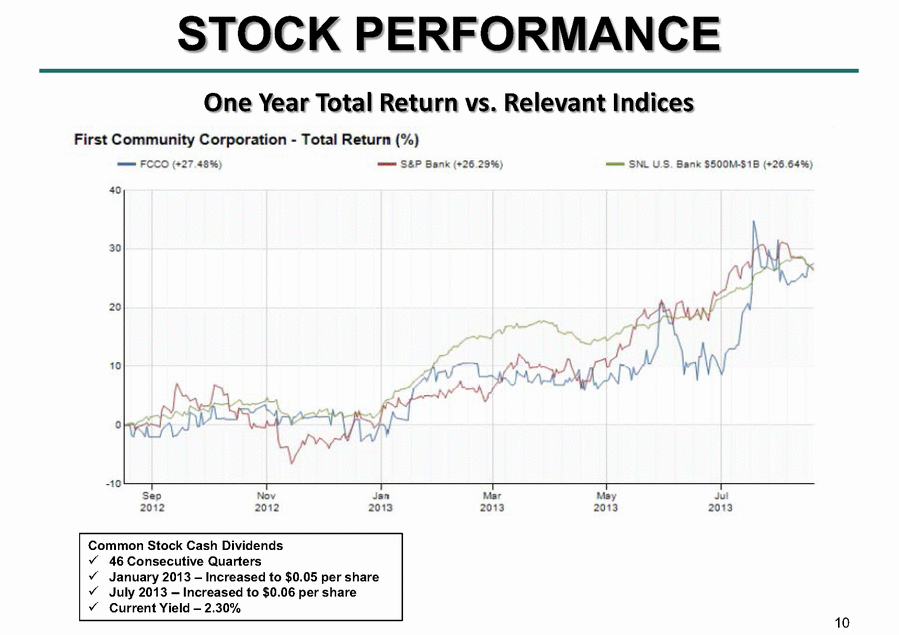
10 STOCK PERFORMANCE One Year Total Return vs. Relevant Indices Common Stock Cash Dividends 46 Consecutive Quarters January 2013 – Increased to $0.05 per share July 2013 -- Increased to $0.06 per share Current Yield – 2.30% |
|
|
11 2013 PERFORMANCE |
|
|
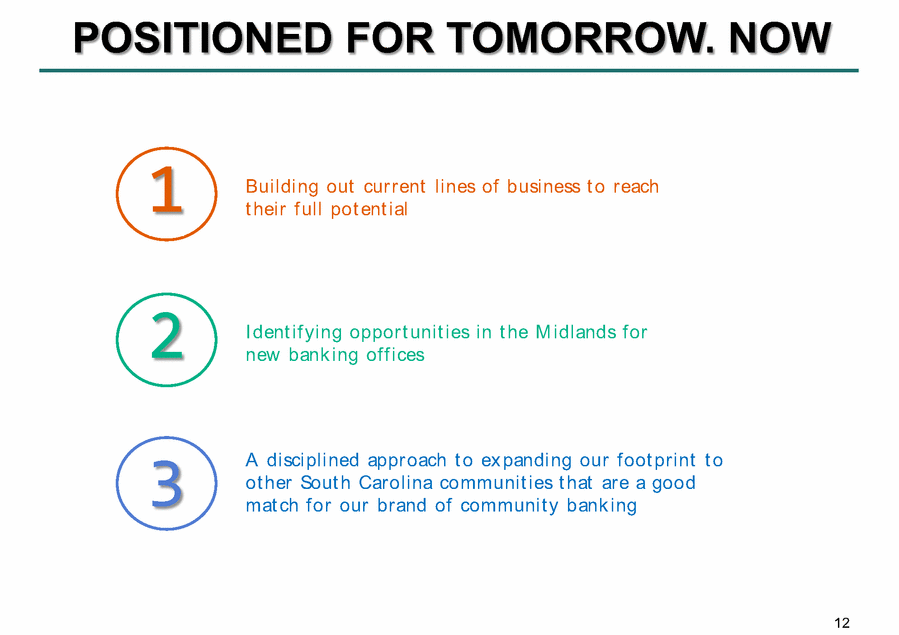
12 POSITIONED FOR TOMORROW. NOW 1 Building out current lines of business to reach their full potential 2 Identifying opportunities in the Midlands for new banking offices 3 A disciplined approach to expanding our foot print to other South Carolina communities that are a good match for our brand of community banking |
|
|
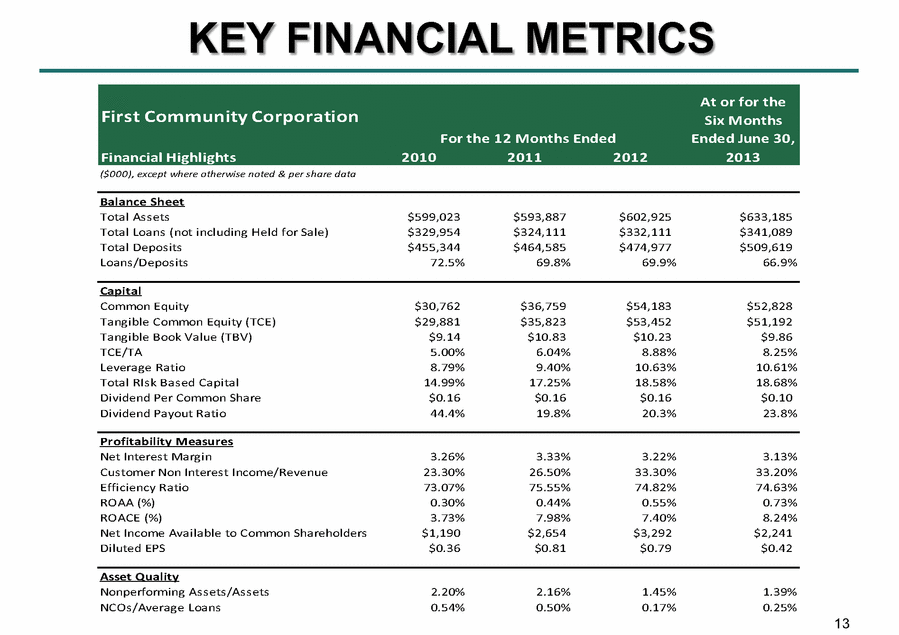
13 KEY FINANCIAL METRICS First Community Corporation For the 12 Months Ended At or for the Six Months Ended June 30, Financial Highlights 2010 2011 2012 2013 ($000), except where otherwise noted & per share data Balance Sheet Total Assets $599,023 $593,887 $602,925 $633,185 Total Loans (not including Held for Sale) $329,954 $324,111 $332,111 $341,089 Total Deposits $455,344 $464,585 $474,977 $509,619 Loans/Deposits 72.5% 69.8% 69.9% 66.9% Capital Common Equity $30,762 $36,759 $54,183 $52,828 Tangible Common Equity (TCE) $29,881 $35,823 $53,452 $51,192 Tangible Book Value (TBV) $9.14 $10.83 $10.23 $9.86 TCE/TA 5.00% 6.04% 8.88% 8.25% Leverage Ratio 8.79% 9.40% 10.63% 10.61% Total RIsk Based Capital 14.99% 17.25% 18.58% 18.68% Dividend Per Common Share $0.16 $0.16 $0.16 $0.10 Dividend Payout Ratio 44.4% 19.8% 20.3% 23.8% Profitability Measures Net Interest Margin 3.26% 3.33% 3.22% 3.13% Customer Non Interest Income/Revenue 23.30% 26.50% 33.30% 33.20% Efficiency Ratio 73.07% 75.55% 74.82% 74.63% ROAA (%) 0.30% 0.44% 0.55% 0.73% ROACE (%) 3.73% 7.98% 7.40% 8.24% Net Income Available to Common Shareholders $1,190 $2,654 $3,292 $2,241 Diluted EPS $0.36 $0.81 $0.79 $0.42 Asset Quality Nonperforming Assets/Assets 2.20% 2.16% 1.45% 1.39% NCOs/Average Loans 0.54% 0.50% 0.17% 0.25% |
|
|
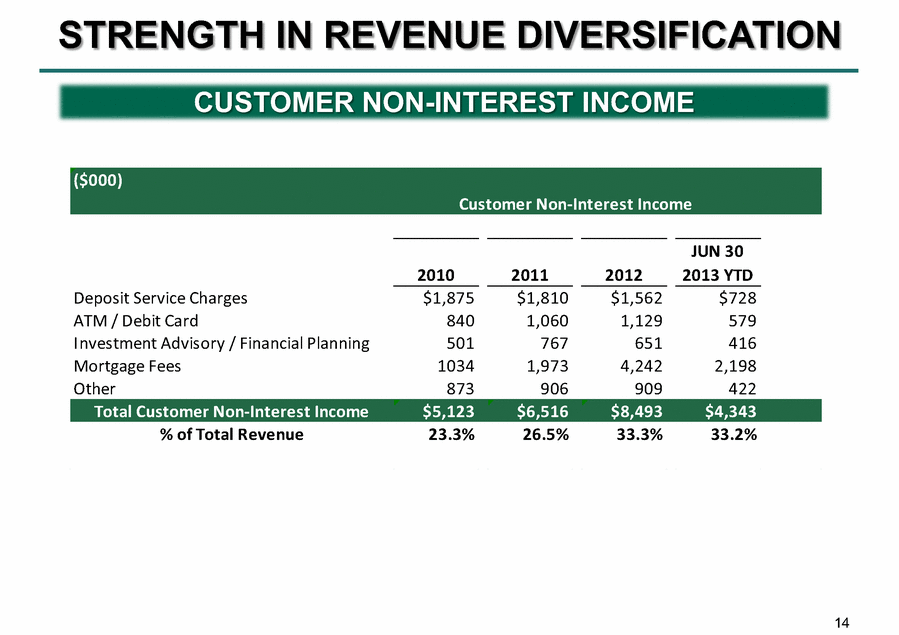
14 STRENGTH IN REVENUE DIVERSIFICATION CUSTOMER NON-INTEREST INCOME ($000) Customer Non-Interest Income 2010 2011 2012 JUN 30 2013 YTD Deposit Service Charges $1,875 $1,810 $1,562 $728 ATM / Debit Card 840 1,060 1,129 579 Investment Advisory / Financial Planning 501 767 651 416 Mortgage Fees 1034 1,973 4,242 2,198 Other 873 906 909 422 Total Customer Non-Interest Income $5,123 $6,516 $8,493 $4,343 % of Total Revenue 23.3% 26.5% 33.3% 33.2% |
|
|
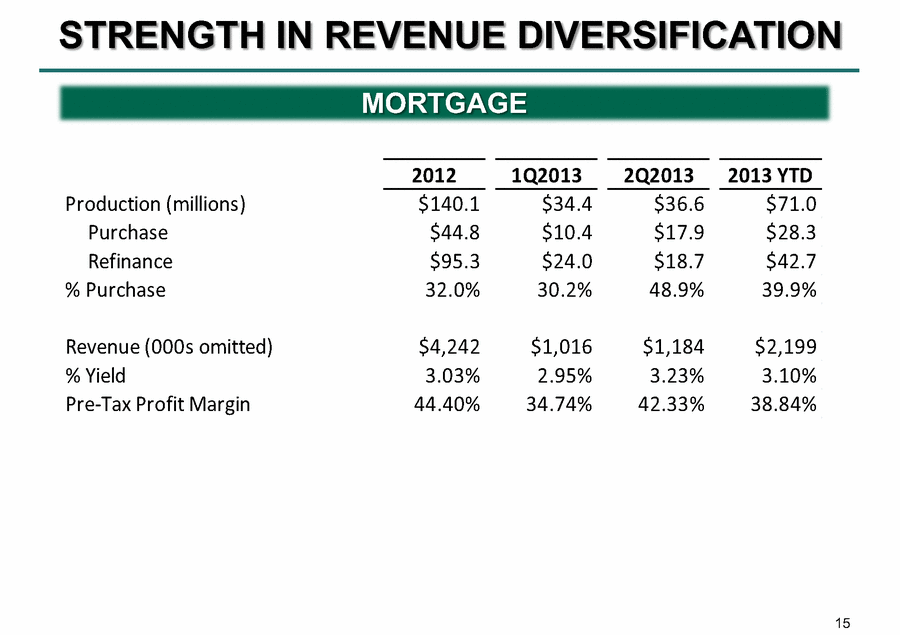
15 STRENGTH IN REVENUE DIVERSIFICATION MORTGAGE 2012 1Q2013 2Q2013 2013 YTD Production (millions) $140.1 $34.4 $36.6 $71.0 Purchase $44.8 $10.4 $17.9 $28.3 Refinance $95.3 $24.0 $18.7 $42.7 % Purchase 32.0% 30.2% 48.9% 39.9% Revenue (000s omitted) $4,242 $1,016 $1,184 $2,199 % Yield 3.03% 2.95% 3.23% 3.10% Pre-Tax Profit Margin 44.40% 34.74% 42.33% 38.84% |
|
|
16 |
|
|
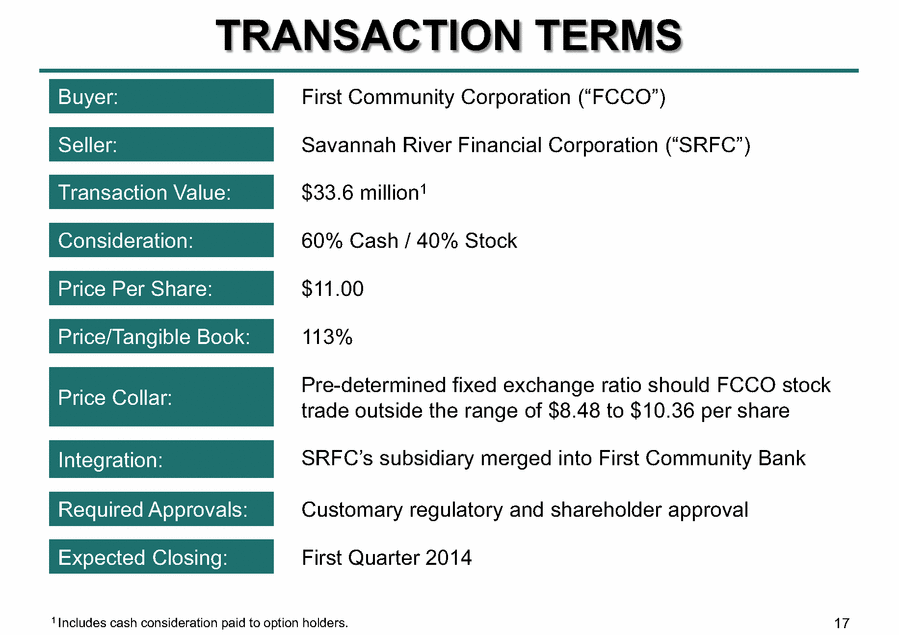
17 TRANSACTION TERMS Buyer: First Community Corporation (“FCCO”) Seller: Savannah River Financial Corporation (“SRFC”) Transaction Value: $33.6 million1 Consideration: 60% Cash / 40% Stock Price Per Share: $11.00 Price/Tangible Book: 113% Price Collar: Pre-determined fixed exchange ratio should FCCO stock trade outside the range of $8.48 to $10.36 per share Integration: SRFC’s subsidiary merged into First Community Bank Required Approvals: Customary regulatory and shareholder approval Expected Closing: First Quarter 2014 1 Includes cash consideration paid to option holders. |
|
|
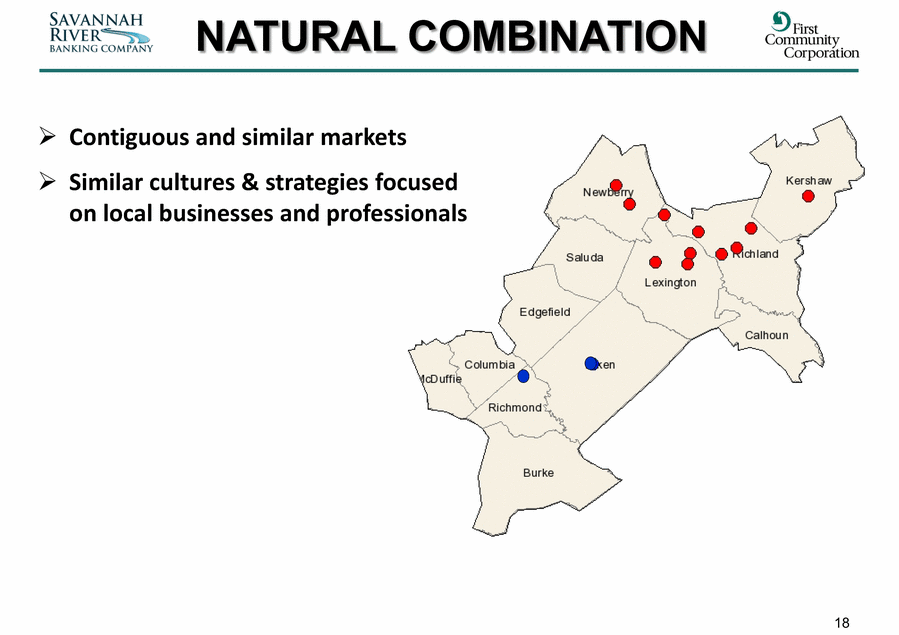
18 NATURAL COMBINATION Contiguous and similar markets Similar cultures & strategies focused on local businesses and professionals |
|
|
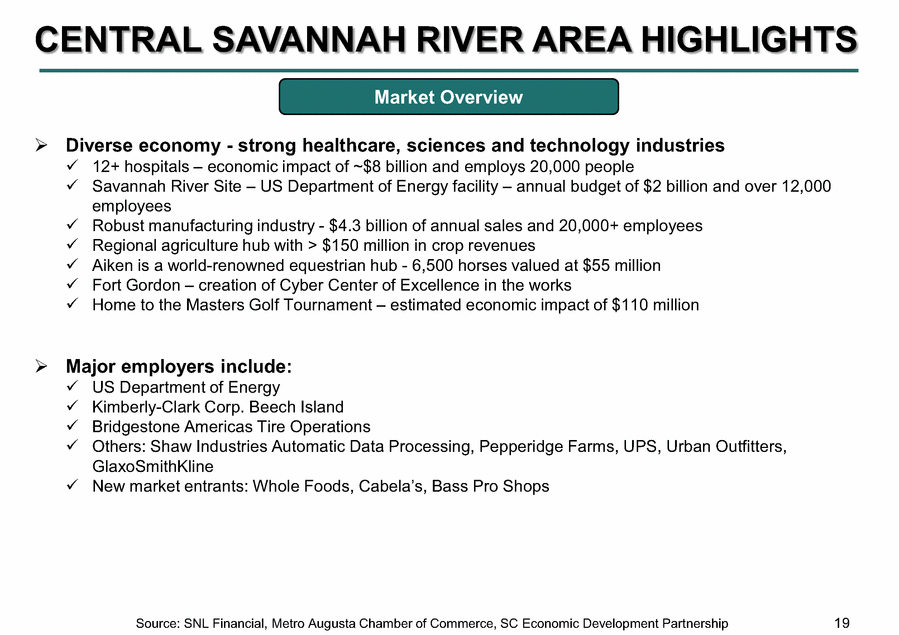
19 CENTRAL SAVANNAH RIVER AREA HIGHLIGHTS Diverse economy - strong healthcare, sciences and technology industries 12+ hospitals – economic impact of ~$8 billion and employs 20,000 people Savannah River Site – US Department of Energy facility – annual budget of $2 billion and over 12,000 employees Robust manufacturing industry - $4.3 billion of annual sales and 20,000+ employees Regional agriculture hub with > $150 million in crop revenues Aiken is a world-renowned equestrian hub - 6,500 horses valued at $55 million Fort Gordon – creation of Cyber Center of Excellence in the works Home to the Masters Golf Tournament – estimated economic impact of $110 million Major employers include: US Department of Energy Kimberly-Clark Corp. Beech Island Bridgestone Americas Tire Operations Others: Shaw Industries Automatic Data Processing, Pepperidge Farms, UPS, Urban Outfitters, GlaxoSmithKline New market entrants: Whole Foods, Cabela’s, Bass Pro Shops Market Overview Source: SNL Financial, Metro Augusta Chamber of Commerce, SC Economic Development Partnership |
|
|
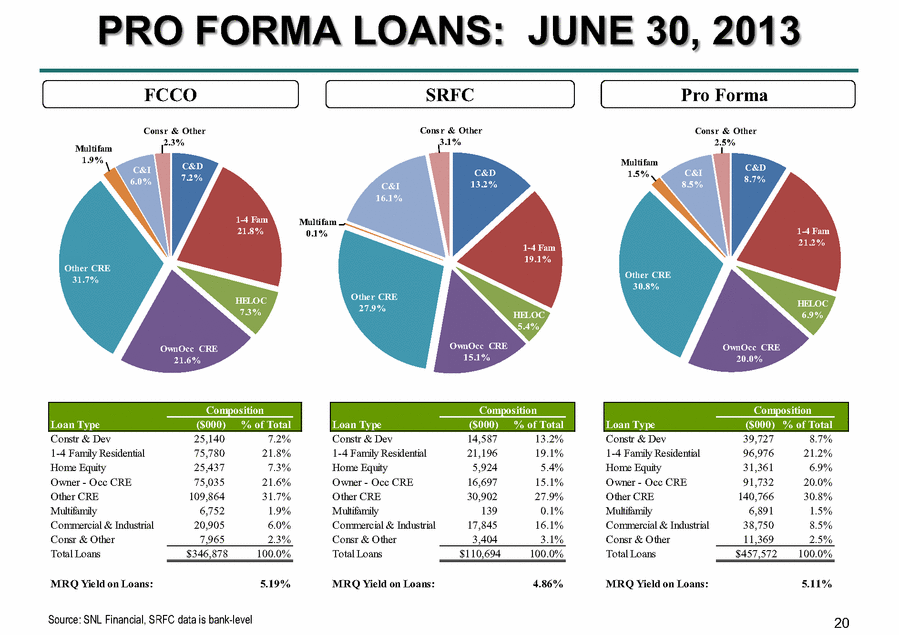
20 Source: SNL Financial, SRFC data is bank-level PRO FORMA LOANS: JUNE 30, 2013 FCCO Pro Forma SRFC C&D 7.2% 1-4 Fam 21.8% HELOC 7.3% OwnOcc CRE 21.6% Other CRE 31.7% Multifam 1.9% C&I 6.0% Consr & Other 2.3% C&D 13.2% 1-4 Fam 19.1% HELOC 5.4% OwnOcc CRE 15.1% Other CRE 27.9% Multifam 0.1% C&I 16.1% Consr & Other 3.1% C&D 8.7% 1-4 Fam 21.2% HELOC 6.9% OwnOcc CRE 20.0% Other CRE 30.8% Multifam 1.5% C&I 8.5% Consr & Other 2.5% Composition Composition Composition Loan Type ($000) % of Total Loan Type ($000) % of Total Loan Type ($000) % of Total Constr & Dev 25,140 7.2% Constr & Dev 14,587 13.2% Constr & Dev 39,727 8.7% 1-4 Family Residential 75,780 21.8% 1-4 Family Residential 21,196 19.1% 1-4 Family Residential 96,976 21.2% Home Equity 25,437 7.3% Home Equity 5,924 5.4% Home Equity 31,361 6.9% Owner - Occ CRE 75,035 21.6% Owner - Occ CRE 16,697 15.1% Owner - Occ CRE 91,732 20.0% Other CRE 109,864 31.7% Other CRE 30,902 27.9% Other CRE 140,766 30.8% Multifamily 6,752 1.9% Multifamily 139 0.1% Multifamily 6,891 1.5% Commercial & Industrial 20,905 6.0% Commercial & Industrial 17,845 16.1% Commercial & Industrial 38,750 8.5% Consr & Other 7,965 2.3% Consr & Other 3,404 3.1% Consr & Other 11,369 2.5% Total Loans $346,878 100.0% Total Loans $110,694 100.0% Total Loans $457,572 100.0% MRQ Yield on Loans: 5.19% MRQ Yield on Loans: 4.86% MRQ Yield on Loans: 5.11% |
|
|
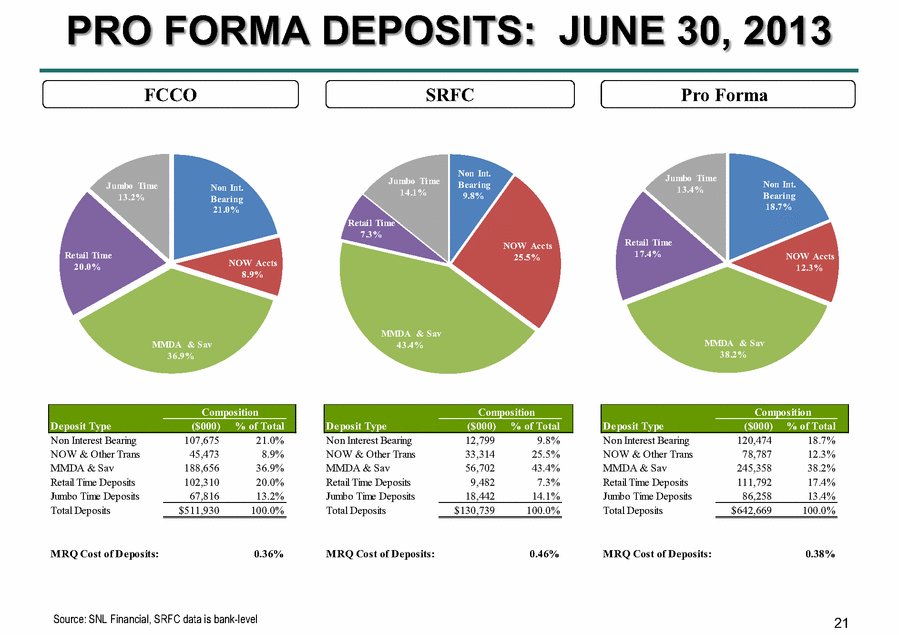
21 PRO FORMA DEPOSITS: JUNE 30, 2013 Non Int. Bearing 21.0% NOW Accts 8.9% MMDA & Sav 36.9% Retail Time 20.0% Jumbo Time 13.2% Non Int. Bearing 9.8% NOW Accts 25.5% MMDA & Sav 43.4% Retail Time 7.3% Jumbo Time 14.1% Non Int. Bearing 18.7% NOW Accts 12.3% MMDA & Sav 38.2% Retail Time 17.4% Jumbo Time 13.4% Composition Composition Composition Deposit Type ($000) % of Total Deposit Type ($000) % of Total Deposit Type ($000) % of Total Non Interest Bearing 107,675 21.0% Non Interest Bearing 12,799 9.8% Non Interest Bearing 120,474 18.7% NOW & Other Trans 45,473 8.9% NOW & Other Trans 33,314 25.5% NOW & Other Trans 78,787 12.3% MMDA & Sav 188,656 36.9% MMDA & Sav 56,702 43.4% MMDA & Sav 245,358 38.2% Retail Time Deposits 102,310 20.0% Retail Time Deposits 9,482 7.3% Retail Time Deposits 111,792 17.4% Jumbo Time Deposits 67,816 13.2% Jumbo Time Deposits 18,442 14.1% Jumbo Time Deposits 86,258 13.4% Total Deposits $511,930 100.0% Total Deposits $130,739 100.0% Total Deposits $642,669 100.0% MRQ Cost of Deposits: 0.36% MRQ Cost of Deposits: 0.46% MRQ Cost of Deposits: 0.38% FCCO Pro Forma SRFC Source: SNL Financial, SRFC data is bank-level |
|
|
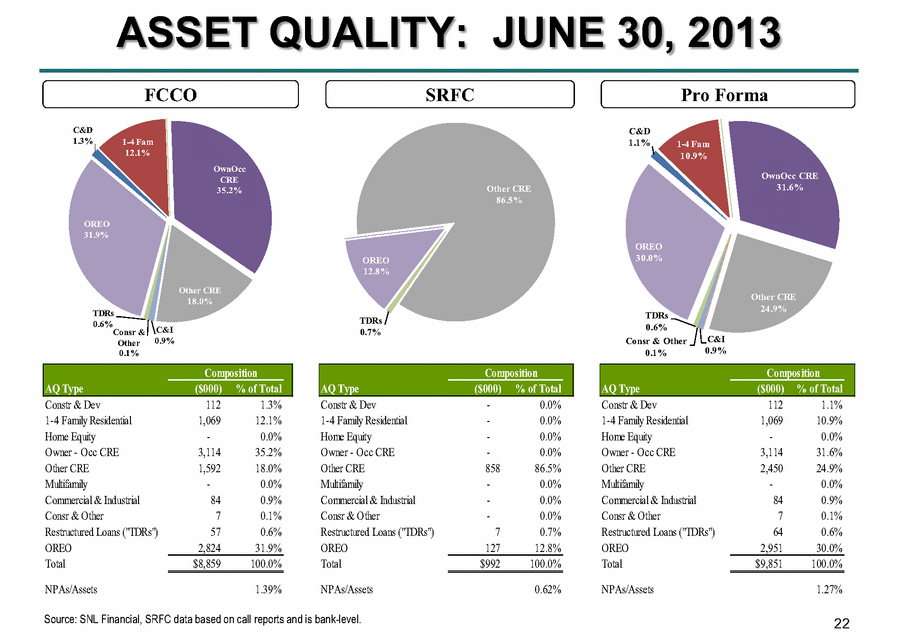
22 ASSET QUALITY: JUNE 30, 2013 FCCO Pro Forma SRFC Source: SNL Financial, SRFC data based on call reports and is bank-level. C&D 1.3% 1-4 Fam 12.1% OwnOcc CRE 35.2% Other CRE 18.0% C&I 0.9% Consr & Other 0.1% TDRs 0.6% OREO 31.9% Other CRE 86.5% TDRs 0.7% OREO 12.8% C&D 1.1% 1-4 Fam 10.9% OwnOcc CRE 31.6% Other CRE 24.9% C&I 0.9% Consr & Other 0.1% TDRs 0.6% OREO 30.0% Composition Composition Composition AQ Type ($000) % of Total AQ Type ($000) % of Total AQ Type ($000) % of Total Constr & Dev 112 1.3% Constr & Dev - 0.0% Constr & Dev 112 1.1% 1-4 Family Residential 1,069 12.1% 1-4 Family Residential - 0.0% 1-4 Family Residential 1,069 10.9% Home Equity - 0.0% Home Equity - 0.0% Home Equity - 0.0% Owner - Occ CRE 3,114 35.2% Owner - Occ CRE - 0.0% Owner - Occ CRE 3,114 31.6% Other CRE 1,592 18.0% Other CRE 858 86.5% Other CRE 2,450 24.9% Multifamily - 0.0% Multifamily - 0.0% Multifamily - 0.0% Commercial & Industrial 84 0.9% Commercial & Industrial - 0.0% Commercial & Industrial 84 0.9% Consr & Other 7 0.1% Consr & Other - 0.0% Consr & Other 7 0.1% Restructured Loans ("TDRs") 57 0.6% Restructured Loans ("TDRs") 7 0.7% Restructured Loans ("TDRs") 64 0.6% OREO 2,824 31.9% OREO 127 12.8% OREO 2,951 30.0% Total $8,859 100.0% Total $992 100.0% Total $9,851 100.0% NPAs/Assets 1.39% NPAs/Assets 0.62% NPAs/Assets 1.27% |
|
|
23 |
|
|
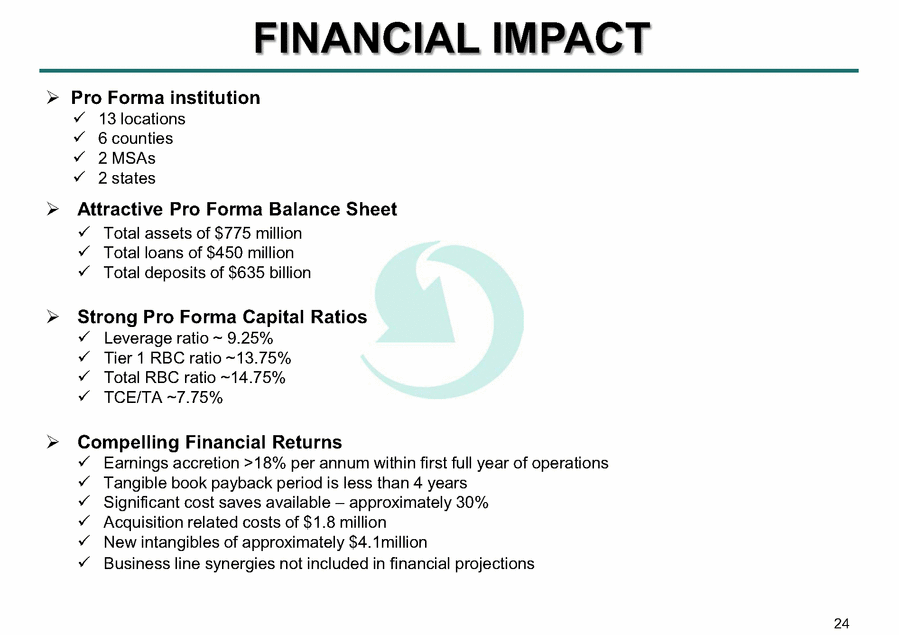
24 FINANCIAL IMPACT Pro Forma institution 13 locations 6 counties 2 MSAs 2 states Attractive Pro Forma Balance Sheet Total assets of $775 million Total loans of $450 million Total deposits of $635 billion Strong Pro Forma Capital Ratios Leverage ratio ~ 9.25% Tier 1 RBC ratio ~13.75% Total RBC ratio ~14.75% TCE/TA ~7.75% Compelling Financial Returns Earnings accretion >18% per annum within first full year of operations Tangible book payback period is less than 4 years Significant cost saves available – approximately 30% Acquisition related costs of $1.8 million New intangibles of approximately $4.1million Business line synergies not included in financial projections |
|
|
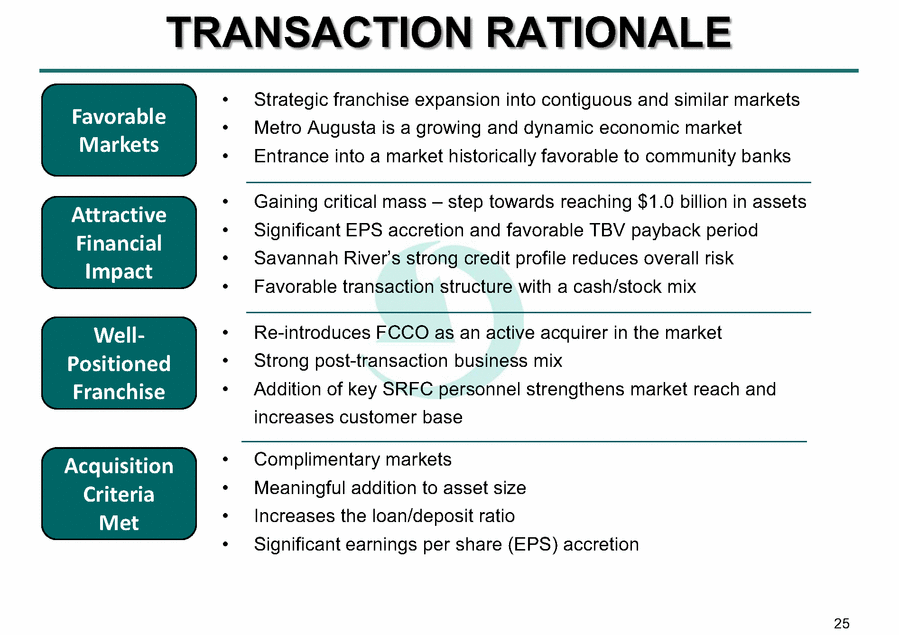
25 TRANSACTION RATIONALE • Strategic franchise expansion into contiguous and similar markets • Metro Augusta is a growing and dynamic economic market • Entrance into a market historically favorable to community banks • Gaining critical mass – step towards reaching $1.0 billion in assets • Significant EPS accretion and favorable TBV payback period • Savannah River’s strong credit profile reduces overall risk • Favorable transaction structure with a cash/stock mix • Re-introduces FCCO as an active acquirer in the market • Strong post-transaction business mix • Addition of key SRFC personnel strengthens market reach and increases customer base • Complimentary markets • Meaningful addition to asset size • Increases the loan/deposit ratio • Significant earnings per share (EPS) accretion Attractive Financial Impact Favorable Markets Well- Positioned Franchise Acquisition Criteria Met |
|
|
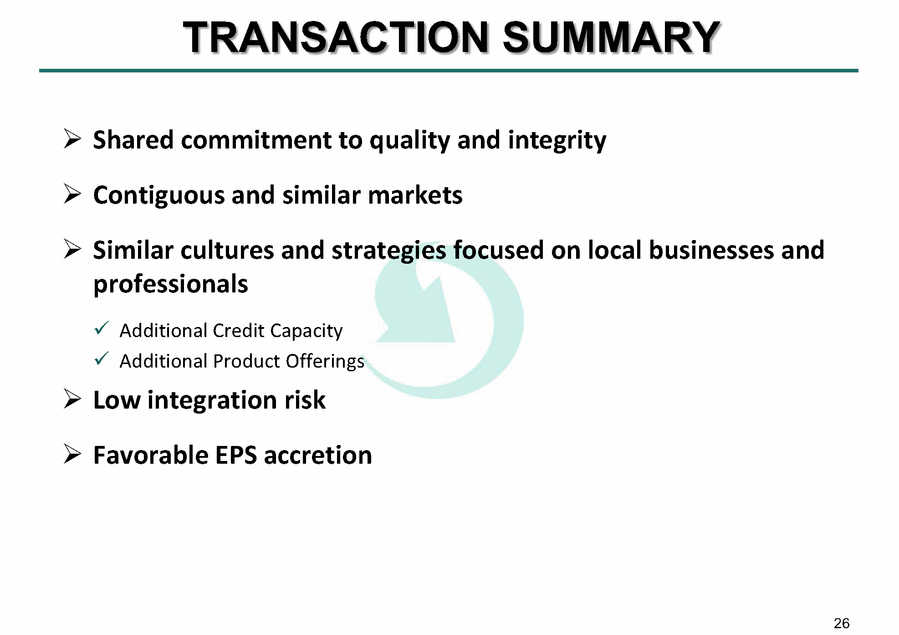
26 TRANSACTION SUMMARY Shared commitment to quality and integrity Contiguous and similar markets Similar cultures and strategies focused on local businesses and professionals Additional Credit Capacity Additional Product Offerings Low integration risk Favorable EPS accretion |
|
|
27 SUMMARY |
|
|
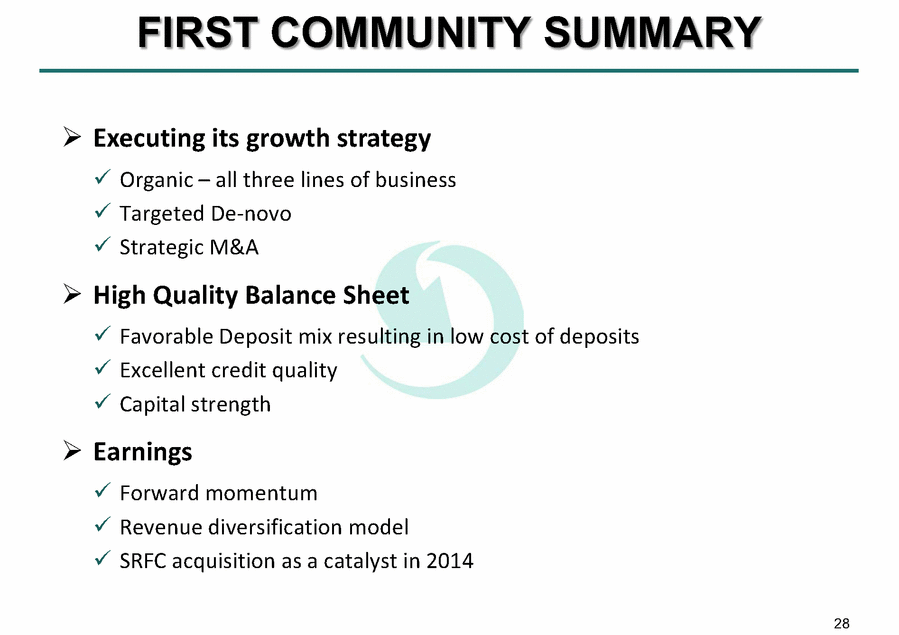
28 FIRST COMMUNITY SUMMARY Executing its growth strategy Organic – all three lines of business Targeted De-novo Strategic M&A High Quality Balance Sheet Favorable Deposit mix resulting in low cost of deposits Excellent credit quality Capital strength Earnings Forward momentum Revenue diversification model SRFC acquisition as a catalyst in 2014 |
|
|
29 ADDENDA |
|
|
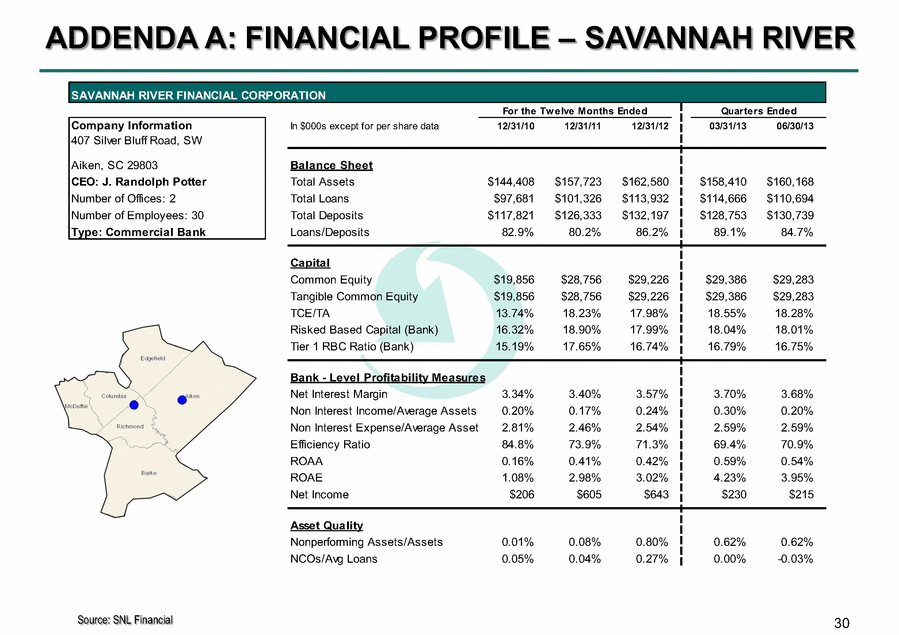
30 ADDENDA A: FINANCIAL PROFILE – SAVANNAH RIVER SAVANNAH RIVER FINANCIAL CORPORATION For the Twelve Months Ended Company Information In $000s except for per share data 12/31/10 12/31/11 12/31/12 03/31/13 06/30/13 407 Silver Bluff Road, SW Aiken, SC 29803 Balance Sheet CEO: J. Randolph Potter Total Assets $144,408 $157,723 $162,580 $158,410 $160,168 Number of Offices: 2 Total Loans $97,681 $101,326 $113,932 $114,666 $110,694 Number of Employees: 30 Total Deposits $117,821 $126,333 $132,197 $128,753 $130,739 Type: Commercial Bank Loans/Deposits 82.9% 80.2% 86.2% 89.1% 84.7% Capital Common Equity $19,856 $28,756 $29,226 $29,386 $29,283 Tangible Common Equity $19,856 $28,756 $29,226 $29,386 $29,283 TCE/TA 13.74% 18.23% 17.98% 18.55% 18.28% Risked Based Capital (Bank) 16.32% 18.90% 17.99% 18.04% 18.01% Tier 1 RBC Ratio (Bank) 15.19% 17.65% 16.74% 16.79% 16.75% Bank - Level Profitability Measures Net Interest Margin 3.34% 3.40% 3.57% 3.70% 3.68% Non Interest Income/Average Assets 0.20% 0.17% 0.24% 0.30% 0.20% Non Interest Expense/Average Asset 2.81% 2.46% 2.54% 2.59% 2.59% Efficiency Ratio 84.8% 73.9% 71.3% 69.4% 70.9% ROAA 0.16% 0.41% 0.42% 0.59% 0.54% ROAE 1.08% 2.98% 3.02% 4.23% 3.95% Net Income $206 $605 $643 $230 $215 Asset Quality Nonperforming Assets/Assets 0.01% 0.08% 0.80% 0.62% 0.62% NCOs/Avg Loans 0.05% 0.04% 0.27% 0.00% -0.03% Quarters Ended Source: SNL Financial |
|
|
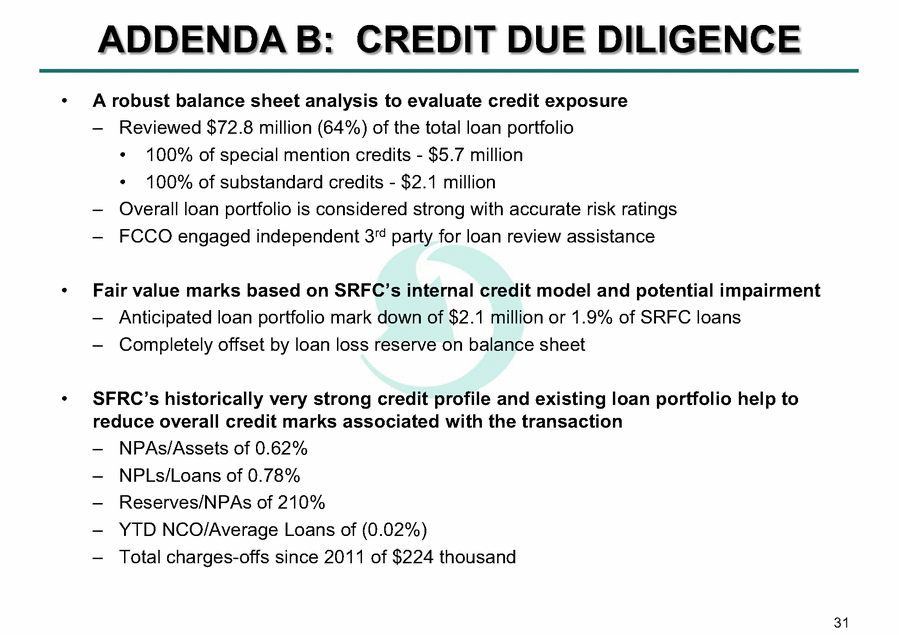
31 ADDENDA B: CREDIT DUE DILIGENCE • A robust balance sheet analysis to evaluate credit exposure – Reviewed $72.8 million (64%) of the total loan portfolio • 100% of special mention credits - $5.7 million • 100% of substandard credits - $2.1 million – Overall loan portfolio is considered strong with accurate risk ratings – FCCO engaged independent 3rd party for loan review assistance • Fair value marks based on SRFC’s internal credit model and potential impairment – Anticipated loan portfolio mark down of $2.1 million or 1.9% of SRFC loans – Completely offset by loan loss reserve on balance sheet • SFRC’s historically very strong credit profile and existing loan portfolio help to reduce overall credit marks associated with the transaction – NPAs/Assets of 0.62% – NPLs/Loans of 0.78% – Reserves/NPAs of 210% – YTD NCO/Average Loans of (0.02%) – Total charges-offs since 2011 of $224 thousand |
|
|
32 FORWARD-LOOKING STATEMENTS This presentation contains forward-looking statements relating to the financial condition, results of operations and business of First Community Corporation and its subsidiary First Community Bank. These forward looking statements involve risks and uncertainties and are based on the beliefs and assumptions of the management of First Community Corporation, and the information available to management at the time that this presentation was prepared. Factors that could cause actual results to differ materially from those contemplated by such forward-looking statements include, among others, the following: the businesses of First Community and Savannah River Financial Corporation may not be integrated successfully or such integration may take longer to accomplish than expected; the expected cost savings and any revenue synergies from the merger may not be fully realized within the expected timeframes; disruption from the merger may make it more difficult to maintain relationships with clients, associates, or suppliers; the required governmental approvals of the merger may not be obtained on the proposed terms and schedule; Savannah River Financial Corporation shareholders may not approve the merger and/or First Community shareholders may not approve the issuance of First Community shares in pursuant to the merger agreement; changes in economic conditions; movements in interest rates; competitive pressures on product pricing and services; success and timing of other business strategies; the nature, extent, and timing of governmental actions and reforms; extended disruption of vital infrastructure; and other factors described in First Community’s Annual Report on Form 10-K and documents subsequently filed by First Community with the Securities and Exchange Commission. Please refer to the Securities and Exchange Commission's website at www.sec.gov to review such documents. First Community Corporation does not undertake a duty to update any forward-looking statements made in this presentation. First Community Corporation intends to file relevant documents concerning the transaction with the Securities and Exchange Commission, including a registration statement on Form S-4 which will include a proxy statement/prospectus. Shareholders will be able to obtain a free copy of the proxy statement/prospectus, as well as other filings by First Community, at the Securities and Exchange Commission's internet site (http://www.sec.gov). Copies of the proxy statement/prospectus and the filings with the Securities and Exchange Commission that will be incorporated by reference in the proxy statement/ prospectus can also be obtained, without charge, by directing a request to First Community Corporation, 5455 Sunset Blvd., Lexington, SC 29072, Attention: Michael Crapps. SHAREHOLDERS ARE URGED TO READ THE PROXY STATEMENT/PROSPECTUS, AND OTHER RELEVANT DOCUMENTS WHEN THEY ARE FILED WITH THE SECURITIES AND EXCHANGE COMMISSION REGARDING THE PROPOSED TRANSACTION WHEN THEY BECOME AVAILABLE, AS THEYWILL CONTAIN IMPORTANT INFORMATION. The directors and executive officers of First Community Corporation and other persons may be deemed to be participants in the solicitation of proxies from First Community shareholders in connection with the proposed merger. Information regarding First Community’s directors and executive officers is available in its definitive proxy statement and additional definitive proxy soliciting materials filed with the SEC for First Community's 2013 annual shareholder meeting. Other information regarding the participants in the First Community proxy solicitation and a description of their direct and indirect interests, by security holdings or otherwise, will be contained in the proxy statement/prospectus and other relevant materials to be filed with the SEC when they become available. |
|
|
Come See the Difference |

