Attached files
| file | filename |
|---|---|
| 8-K - CURRENT REPORT OF MATERIAL EVENTS OR CORPORATE CHANGES - Southcross Energy Partners, L.P. | a13-19013_18k.htm |
Exhibit 99.1
|
|
Citi One-On-One MLP and Midstream Infrastructure Conference August 2013 |

|
|
Cautionary Statements This presentation contains forward-looking statements and information. These forward-looking statements, which in many instances can be identified by words such as “could,” “will,” “may,” “assume,” “forecast,” “position,” “predict,” “strategy,” “expect,” “intend,” “plan,” “estimate,” “anticipate,” “believe,” “project,” “budget,” “potential,” or “proposed,” give current expectations or forecasts of future events or contain projections of results of operations or financial condition. Examples include discussion of our strategies, financing plans and growth opportunities. These forward-looking statements are based on our current information, expectations and beliefs; they are not a guarantee of future results, and you should not place undue reliance on such statements. Forward-looking statements are subject to many risks, uncertainties and other variable circumstances including those discussed in filings we make with the Securities and Exchange Commission, particularly in our 2012 Annual Report on Form 10-K under the headings “Risk Factors” and “Management’s Discussion and Analysis of Financial Condition and Results of Operations.” Many of these risks are outside of our control and could cause our actual results and experience to differ materially from those we anticipated would occur. Key uncertainties and risks that may directly affect our performance, future growth, results of operations, and financial condition, include, but are not limited to: the volatility of natural gas, crude oil and NGL prices and the price and demand of products derived from these commodities; competitive conditions in our industry and the extent and success of producers replacing declining production and our success in obtaining new sources of supply; industry conditions and supply of pipelines, processing and fractionation capacity relative to available natural gas from producers; our dependence upon a relatively limited number of customers for a significant portion of our revenues; actions or inactions taken or non-performance by third parties, including suppliers, contractors, operators, processors, transporters and customers; our ability to effectively recover NGLs at a rate equal to or greater than our contracted rates with customers; our ability to produce and market NGLs at the anticipated differential to NGL index pricing; our access to markets enabling us to match pricing indices for purchases and sales of natural gas and NGLs; our ability to complete projects within budget and on schedule, including but not limited to, timely receipt of necessary government approvals and permits, our ability to control the costs of construction and other factors that may impact projects; our ability to consummate acquisitions, integrate the acquired businesses successfully, realize anticipated cost savings and other synergies from any such acquisitions; our ability to manage over time changing exposure to commodity price risk; the effectiveness of our hedging activities or our decisions not to undertake hedging activities; our access to financing and ability to remain in compliance with our financing covenants; our ability to generate sufficient operating cash flow to fund our minimum quarterly distribution; changes in general economic conditions; the effects of downtime associated with our assets or the assets of third parties interconnected with our systems; operating hazards, fires, natural disasters, weather-related delays, casualty losses and other matters beyond our control; the failure of our processing plants to perform as expected, including outages for unscheduled maintenance or repair; the effects of laws and governmental regulations and policies; the effects of existing and future litigation; and other financial, operational and legal risks and uncertainties detailed from time to time in our filings with the U.S. Securities and Exchange Commission. The forward-looking statements included in this presentation are made only as of the date hereof. Except as required by law, we do not undertake, and specifically decline, any obligation to update any such statements or to publicly announce the results of any revisions to any of such statements to reflect future events or developments. |

|
|
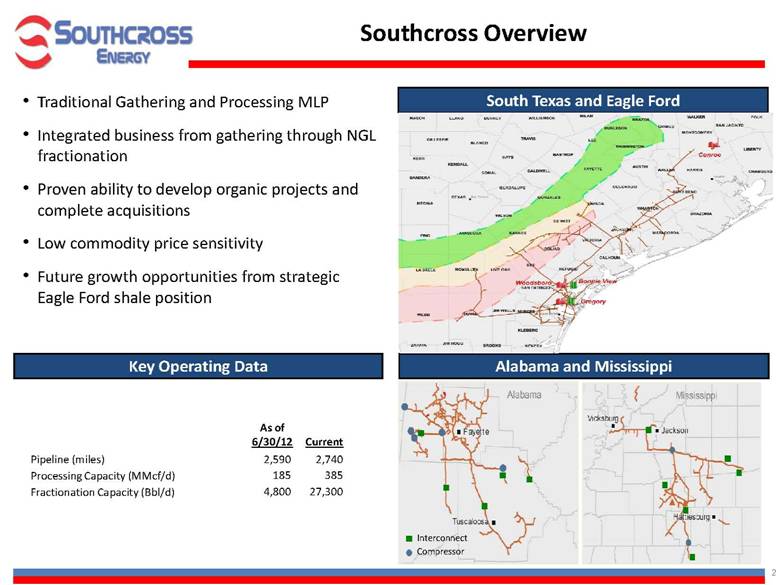
Southcross Overview Alabama and Mississippi South Texas and Eagle Ford Traditional Gathering and Processing MLP Integrated business from gathering through NGL fractionation Proven ability to develop organic projects and complete acquisitions Low commodity price sensitivity Future growth opportunities from strategic Eagle Ford shale position Key Operating Data As of 6/30/12 Current Pipeline (miles) 2,590 2,740 Processing Capacity (MMcf/d) 185 385 Fractionation Capacity (Bbl/d) 4,800 27,300 Compressor Interconnect |
|
|
Investment Highlights |
|
|
Track Record of Growth Pipeline Additions Plant Additions Acquisitions McMullen Pipeline (2011) Moselle Pipeline (2011) Bee Line Pipeline (2012) Karnes Extension (2013) McMullen Lateral (Current) Woodsboro Processing Plant (2012) Bonnie View Fractionator (2013) Enterprise Alabama (2011) Tennessee Pipeline Assets (2011) Monco Pipeline System (2012) Proven Record of Organic and Acquisition Growth |
|
|
Integrated Business with Scale and Scope Southcross Competitive Advantages in Integrated Business Gathering and Transportation Access to prolific rich gas production in Eagle Ford shale Processing 385 MMcf/d of cryogenic gas processing capacity in Texas including 200 MMcfd/d Woodsboro facility constructed in 2012 with state-of-the-art technology and NGL recovery rates Fractionation 27,300 BBls/d of fractionation capacity including 22,500 Bbls/d Bonnie View facility constructed in 2013 Location proximate to Corpus Christi ship channel and export markets, refinery facilities and expanding petrochemical infrastructure Gas Marketing Existing end-use contracts and connections with industrial end-use gas markets in Corpus Christi area and along Texas Gulf Coast Access to multiple major gas pipelines Proximate to prospective Mexico and waterborne gas export facilities NGL Marketing Location with fractionation facilities proximate to Corpus Christi and Gulf Coast markets Long term NGL purity product sales contracts Growth opportunities of expanding export markets and growing ethane feedstock requirements Premier asset locations, access to prolific rich gas production, NGL end-use and export markets, and end-use dry gas outlets combine to form an attractive integrated Southcross business. |
|
|
Equity Barrels Commodity Sensitive Typical Southcross Gas Supply Contract Attractive Fees Throughout the Integrated Value Stream Fixed-fees on services Fixed spreads on purchases and sales of NGLs and residue gas Approximately 80% of gross margin is non-commodity price sensitive (1) (1) Based on 4Q 2013 financial guidance. Processing Uplift Gathering Transportation Processing Fractionation Equity NGL barrels from processing recoveries in excess of fixed producer payments Fixed-Fee or Equivalent Contract Structure Gathering and Transportation Processing Fractionation Gas Marketing NGL Marketing |
|
|
Attractive Contract Structure and Customer Base Captive Volumes 22% Other 12% Minimum volume commitments, acreage dedications and captive volumes provide a solid base of gas supply for Southcross’ South Texas processing volumes Southcross South Texas gas supply as of 2Q 2013 |
|
|
Source: Railroad Commission of Texas Production Query System (PDQ) Texas Eagle Ford Shale Drilling Permits Issued Snapshot of the Eagle Ford Top liquids producing shale in world Capital spending in the Eagle Ford could surpass $120 billion in four years Source: Wood Mackenzie Eagle Ford Shale Expected to Comprise Over One-Quarter of 2013 Spending in US Lower 48 Eagle Ford Production Forecast |
|
|
Southcross in the Eagle Ford Processing Plant Fractionator Pipeline System Source: Railroad Commission of Texas Production Query System (PDQ) Approximately 1,595 miles of pipeline in Texas 27,300 barrels per day of fractionation capacity (2 NGL fractionators) 385 MMcf/d of gas processing capacity (3 gas processing plants) |
|
|
Source: Wells Fargo Securities Southcross Link from Eagle Ford Production to Gulf Coast |
|
|
Southcross has advantaged footprint in expanding Gulf Coast petrochemical infrastructure and NGL markets Southcross presence in end-use NGL markets provides attractive pricing and market outlets Vast majority of North American ethane cracking is on the Gulf Coast and is expanding NGL export terminals near Corpus Christi are in progress Growing gas markets including export opportunities to Mexico Growing Downstream Business Expanding Petrochemical Facilities Formosa Dow Freeport CP Chem OxyChem Lyondell Basell Woodsboro Bonnie View Gregory Conroe Corpus Christi |
|
|
Growing NGL Markets United States NGL Growth (Thousand of Bbls/d) Source: Wells Fargo NGL Snapshot – July 2013 Differential Between Price of Propane in Asia and Europe versus the United States Source: BofA Merrill Lynch Global Research, HIS Chemicals, Bloomberg Ethane Demand NGL Export Demand 13% CAGR 22% CAGR 1,148 1,893 321 720 |
|
|
Multiple gas sale outlets, including Southcross’ direct connections to industrial markets Diverse market outlets are an advantage in attracting producer contracts Local markets provide incremental downstream margins Significant new dry and residue gas availability for expansions Well positioned to transport future Eagle Ford dry gas development to markets Residue and Dry Gas Downstream Competitive Advantages of Dry Gas System Agua Dulce Hub Woodsboro Corpus Christi Processing Plant Fractionator Southcross Dry Gas System Southcross Wet Gas System Bonnie View Gregory Higher Profitability from End-Use Markets Q2 2013 Southcross South Texas Gas Sales by Market 82% |

|
|
Recent Expansion of Southcross Eagle Ford Footprint PROPANE CONNECTION New propane pipeline connecting Bonnie View fractionator to additional pipeline. NEW GAS SUPPLY Commenced construction of a 3.5-mile pipeline addition to Southcross’ McMullen County system to access new gas supply. PIPELINE COMPLETON New 9.5-mile,16-inch pipeline that extends Bee Line pipeline further into Karnes County. |
|
|
Alabama Primarily fixed-fee compression and transportation services 100% non-commodity price sensitive margins Deliveries to end-users and interstate pipelines Acquired Enterprise Alabama in September 2011 519 miles of pipeline Approximate average throughput of 100 MMcf/d (1) Alabama & Mississippi Mississippi Alabama Mississippi Primarily end-use customer margins from gas deliveries to on-system users and transportation fees 100% non-commodity price sensitive margins Largest intrastate pipeline system in the state 626 miles of pipeline Approximate average throughput of 91 MMcf/d(1) (1) Three month period ended 6/30/13. Compressor Compressor |
|
|
Positioned For Future Opportunity Focus on increasing profits and distributable cash flow Expand downstream business Filling current processing capacity Building new capacity as Eagle Ford grows Strengthen foundation for future growth |
|
|
Addition of rich gas volume under current contracts 63% - 75% Utilization Range (210-250 MMcf/d) 47% Utilization (158 MMcf/d) 335 MMcf/d (1) South Texas Processing Capacity Available processing capacity enables near-term Adjusted EBITDA growth with limited capital investment 85 - 125 MMcf/d Additional Opportunity South Texas Gas Processing (1) Excludes Conroe processing facility |
|
|
Southcross Investment Summary Strategically located asset base leveraged to Eagle Ford shale growth Proven ability to develop projects and complete acquisitions Integrated midstream assets from gathering through NGLs in South Texas Significant and highly visible growth opportunities in Eagle Ford shale Leveraged to increasing opportunities in downstream NGL and residue natural gas business in lower Gulf Coast Filling existing capacity of assets provides near-term growth opportunity |
|
|
Southcross’ Fact Sheet NYSE Ticker SXE Total Units 24.4 million units(1) Unit Price $19.20(2) Market Capitalization $468 million(2) Debt at June 30, 2013 $237 million Quarterly Distribution $0.40 per unit ($1.60 per unit on an annualized basis) Current Yield 8.3%(2) (2) As of 8/16/13. (1) Excludes 1.715 million convertible preferred units issued in April 2013 and GP units. |
|
|
Non-GAAP Measures SXE has used the non-GAAP financial measures of Adjusted EBITDA and distributable cash flow. SXE provides reconciliations of these non-GAAP financial measures to their most directly comparable financial measures as calculated and presented in accordance with GAAP. SXE defines Adjusted EBITDA as net income, plus interest expense, income tax expense, depreciation and amortization expense, certain non-cash charges such as non-cash equity compensation, unrealized losses on commodity derivative contracts, and selected charges / transaction costs that are unusual or non-recurring, less interest income, income tax benefit, unrealized gains on commodity derivative contracts, and selected gains that are unusual or non-recurring. Adjusted EBITDA is used as a supplemental financial measure by management and by external users of SXE’s financial statements, such as investors and lenders, to assess: the financial performance of SXE’s assets without regard to financing methods, capital structure or historical cost basis; the ability of SXE’s assets to generate cash sufficient to support its indebtedness and make cash distributions to its unitholders and general partner; its operating performance and return on capital as compared to those of other companies in the midstream energy sector, without regard to financing or capital structure; and the attractiveness of capital projects and acquisitions and the overall rates of return on alternative investment opportunities. SXE defines distributable cash flow as Adjusted EBITDA plus interest income, less cash interest expense (net of capitalized costs), income tax expense and maintenance capital expenditures, and uses distributable cash flow to analyze its performance. Distributable cash flow does not reflect changes in working capital balances. Distributable cash flow is used as a supplemental financial measure by management and by external users of SXE’s financial statements, such as investors, to assess: (i) the ability of SXE’s assets to generate cash sufficient to support its indebtedness and make future cash distributions to its unitholders; and (ii) the attractiveness of capital projects and acquisitions and the overall rates of return on alternative investment opportunities. The economic rationale behind management's use of Adjusted EBITDA and distributable cash flow is to measure SXE’s (i) operational performance, (ii) ability to incur and service debt, (iii) ability to fund capital expenditures and (iv) ability to make distributions to SXE’s investors. Adjusted EBITDA and distributable cash flow have limitations as analytical tools and should not be considered as alternatives to, or more meaningful than, performance measures calculated in accordance with GAAP. For example, certain items excluded from Adjusted EBITDA and distributable cash flow are significant components in understanding and assessing a company’s financial performance, including deductions for items such as depreciation, amortization, interest and income taxes. SXE’s computations of Adjusted EBITDA and distributable cash flow may not be comparable to other similarly titled measures of other companies. |

|
|
Reconciliation to Adjusted EBITDA and Distributable Cash Flow Three Months Ended June 30, 2013 Reconciliation of net loss to Adjusted EBITDA and distributable cash flow: Net loss $ (6,192) Add: Depreciation and amortization expense 8,261 Interest expense, net 3,101 Unrealized losses - Unit-based compensation 685 Income tax expense 260 Other, net 19 Expenses associated with significant items 113 Adjusted EBITDA $ 6,247 (Deduct): Cash interest, net of capitalized costs (2,745) Income tax expense (260) Maintenance capital expenditures (635) Distributable cash flow $ 2,607 |