Attached files
| file | filename |
|---|---|
| 8-K - FORM 8-K - FIRST MIDWEST BANCORP INC | aug218k.htm |

Raymond James & Associates, Inc. U.S. Bank Conference Chicago, IL August 22, 2013 ®

Agenda Overview of First Midwest Performance Highlights Strategic Priorities Why Invest in FMBI?

$8.3 Billion Assets $6.9 Billion Deposits 81% Low Cost Core Deposits $5.5 Billion Loans IL’s Largest Ag Lender $6.3 Billion Trust Assets IL’s 4th Largest Bank Asset Manager Full Retail and Commercial Product Line Organized around Clients and Markets 240,000 Retail and 26,000 Commercial Relationships Information as of 6/30/13. A Premier Community Bank

2 As of 6/30/13. A Premier Community Bank Operating in Premier Markets 70 Plus Years of Community Banking Headquartered in Suburban Chicago #8 Suburban Market Share ¹ Retail Banking Platform ² Approximately 90 Locations $75 Million Average Deposits/Branch Over 1,000 Employees 1 Based on deposits balances as of 6/30/12 adjusted for subsequent M&A activity.


Remediate Liquidate & Originate Originate Positioning Execution FDIC FDIC & M&A M&A Defensive Deployment Credit Growth Capital 2008 - 2011 2012 2013 2014
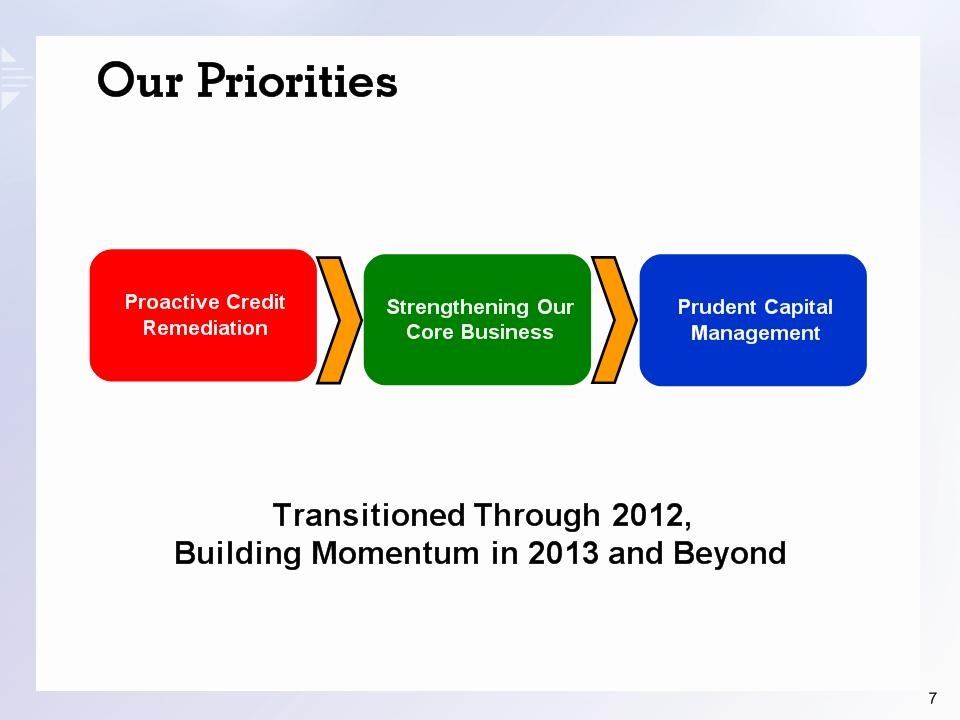
Our Priorities Proactive Credit Remediation Strengthening Our Core Business Prudent Capital Management Transitioned Through 2012, Building Momentum in 2013 and Beyond

Strengthening Income Selected Financial Data Three Months Ended Three Months Ended Three Months Ended June 2013 vs. June 2013 vs. Dec 2012 Mar 2013 Jun 2013 Dec 2012 Mar 2013 Net Income $13.2 $14.6 $16.2 23% 11% Loan Loss Provision $5.6 $5.7 $5.8 4% 2% Net Interest Margin 3.84% 3.77% 3.70% (4%) (2%) Efficiency Ratio 74% 67% 64% (14%) (4%) Earnings Grow Stronger Through Improved Risk Profile $s in millions.

Proactive Remediation Significantly Improved Risk Profile Down 52% $s in millions. Non-Performing Assets Performing Potential Problem Loans Down 43%
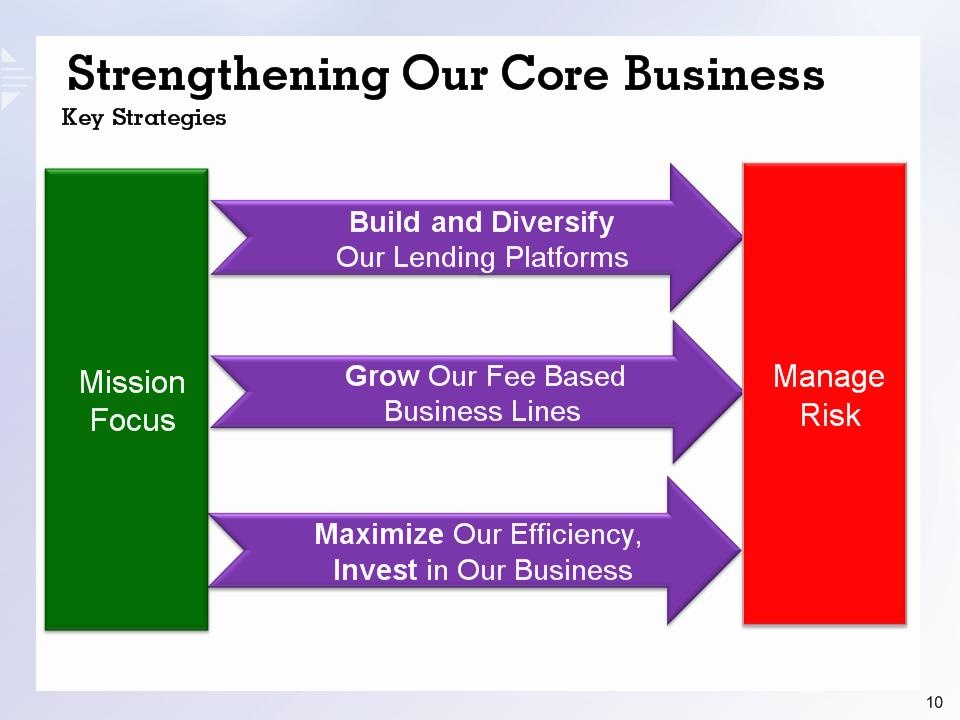
Build and Diversify Our Lending Platforms Maximize Our Efficiency, Invest in Our Business Grow Our Fee Based Business Lines Mission Focus Manage Risk Strengthening Our Core Business Key Strategies

Loan Portfolio Build and Diversify Our Platforms $s in billions. Total Loans Up 6% from 2011 ¹ Corporate Lending Strengthened C&I Team Added Specialty Niches Asset Based Lending Agri-Business Healthcare Improved Distribution Residential Mortgage 1 Originator: 3 Branches Originations Up 80% YOY ¹ Adjusted for credit remediation actions during 3Q2012 and 4Q2012. $5.3 $5.4 $5.5

Leverage Our Strengths Mortgage Platform 2Q13 Sales Effected by Market Instability Expanded Team Levering Branches Wealth Management Up 10% vs. 2012 Commercial Synergy Deposit Platform Product Alignment Expanded Offerings Fee-Based Revenues Grow Our Business Lines, Build Momentum 2011 2012 $s in millions. June 2013 YTD Annualized

Core Aligning Our Business Investment Growing the Business Efficiently, Continuing Focus Efficiency Ratio Non-Core Efficiency Distorted Extended Low Rates Credit Remediation Elevated Non-Core Expenses Elevated Non-Core Acquisition Related Asset Sale, Severance Impact Core Spending Stable, Balanced Resource Realignment Retail, Support, Remediation Business Investment Sales Team Internet and Mobile Banking 2011 2012 June YTD 2013

Invest in Our Business Mobile Banking Launched Successfully Strengthen Loyalty Greater Client Interaction Making Us More Competitive Drive Account Utilization and Engagement Colleague and Client Engagement Positioning and Adapting to Client Preferences

Invest in Our Business Brand Initiative Internally and Externally Focused Reinforce Our Culture and Drive Colleague Behaviors Create Brand Familiarity and Consideration Take Advantage of Our Increasing Momentum Drive Acquisition and Revenue Growth Controlled Marketing and Promotional Spend In Line with Peers, Historical Spend Reallocation of Marketing Dollars

Looking Forward Operating Environment Remains Difficult Low Interest Rates, Highly Competitive Growing Regulatory Compliance Evolving Fiscal and Regulatory Changing Consumer Preferences, Technology Adding Strategic Complexity Altering Product and Distribution Usage Dynamics Will Likely Drive Further Consolidation Building Momentum, Well Positioned

Market Opportunities Ability to Leverage Infrastructure Environment will Create Opportunities Low Rate, Loan Growth and Compliance Pressure Earnings Fewer FDIC, Shifting to Healthier Transactions Consolidation Likely Across Footprint 48 Banks: $350 million to $3 billion in Assets Representing Approximately $48 billion in Assets Most have: Sufficient Capital Elevated Credit Risk Profile Lower Returns Excess Deposits Well Positioned to Benefit Solid Reputation, Culture Strong Capital Experienced, Core Competency 5 Acquisitions Since 4Q09 Requires Patience and Discipline

Maximizing Shareholder Value Our 2013 Priorities Building on a Stronger Foundation Asset Formation Revenue Growth Drive Greater Efficiency Stabilize Earnings Normalize Capital Align with Opportunities Sustain Credit Risk Profile Lower Credit Costs

Managing Our Capital Well Capitalized, Normalizing Usage 13.7% 12.1% 11.9% Basel III ¹ Enabled By Stronger Earnings, Improved Risk Profile and Regulatory Clarity ¹ Fully phased in Basel III minimum regulatory capital ratios effective January 1, 2019.

In Closing – Why Invest? Well Positioned To Build Stronger Performance, Greater Returns Premier Metro Chicago Banking Franchise A Much Stronger Company in 2013 We Have Advantages That Create Opportunities Solid Core Business Strong Core Deposits Engaged, Enhanced Workforce Premier Markets, Growing Opportunities Significant Capital and Liquidity Execution on Our Priorities Will Enhance Value

Appendix

Certain Terms Used in this Presentation Chicago Peers – Means collectively the companies with the ticker symbol MBFI, WTFC, PVTB, and TAYC. Core Deposit – Includes demand, NOW, money market and savings accounts. Core Efficiency Ratio – Excludes the effects of unusual, infrequent, or non-recurring revenues and expenses. Covered Loans or Assets – Means loans or assets which the Company acquired via an FDIC-assisted transaction. National Peers – Means collectively the companies with the ticker symbol SRCE, CHFC, CRBC, FCF, FMER, MBFI, ONB, PNFP, PVTB, PFS, STSA, SUSQ, UMBF, UMPQ, VLY, TAYC, TCBI, TRMK, WSBC, WTFC. Net Interest Income – Means the difference between interest income and fees earned on interest-earning assets and interest expense incurred on interest-bearing liabilities, presented on a tax-equivalent basis, assuming a federal income tax rate of 35%. Net Interest Margin – Means net interest income divided by total average interest-earning assets. Non-Performing Assets – Means non-accrual loans (the majority of which are past due), loans 90 days or more past due and still accruing interest and OREO. Performing Potential Problem Loans – These loans are performing in accordance with contractual terms, but management has concerns about the ability of the borrower to continue to comply with loan terms due to the borrower’s potential operating or financial difficulties. SNL Midwestern Banks – Means 72 Midwest based banks Tier 1 Common Capital – Means tier 1 capital, less trust preferred securities, divided by risk based assets. Note: Unless otherwise indicated, all dollar amounts used in this presentation are in millions except per share information. Unless otherwise indicated, all loan information includes Covered Loans. Peer information source for this presentation from SNL. Forward Looking Statements This presentation may contain, and during this presentation our management may make, statements that may constitute “forward-looking statements” within the meaning of the safe harbor provisions of the Private Securities Litigation Reform Act of 1995. Forward-looking statements are not historical facts but instead represent only our beliefs regarding future events, many of which, by their nature, are inherently uncertain and outside our control. Forward-looking statements include, among other things, statements regarding our financial performance, business prospects, future growth and operating strategies, objectives and results. Actual results, performance or developments could differ materially from those expressed or implied by these forward-looking statements. Important factors that could cause actual results to differ from those in the forward-looking statements include, among others, those discussed in our Annual Report on Form 10-K and other reports filed with the Securities and Exchange Commission, copies of which will be made available upon request. With the exception of fiscal year end information previously included in our Annual Report on Form 10-K, the information contained herein is unaudited. Except as required by law, we undertake no duty to update the contents of this presentation after the date of this presentation. Non-GAAP Disclaimer This presentation contains GAAP financial measures and, where management believes it to be helpful in understanding the Company’s results of operations or financial position, non GAAP financial measures. Where non-GAAP financial measures are used, the most directly comparable GAAP financial measure, as well as the reconciliation to the most directly comparable GAAP financial measure can be found in the Company’s current quarter earnings release or Quarterly Report on Form 10-Q, which can be found on the Company’s website at www.firstmidwest.com/secfilings. Non-GAAP financial measures in this presentation include core operating earnings and pre-tax, pre-provision return on risk weighted average assets. Both of these measures are useful in understanding the performance and trends of the Company’s core franchise over time without respect to investment securities gains/losses, taxes, provisions expense and OREO losses, each of which can significantly vary from quarter to quarter, and therefore may distort the Company’s underlying performance.
First Midwest Bancorp, Inc. Contact Information Paul F. Clemens Executive Vice President & Chief Financial Officer Paul.clemens@firstmidwest.com 630-875-7347 James M. Roolf Senior Vice President & Corporate Relations Officer Jim.roolf@firstmidwest.com 630-875-7533