Attached files
| file | filename |
|---|---|
| 8-K - FORM 8-K - TRANS ENERGY INC | d585654d8k.htm |
| EX-99.2 - EX-99.2 - TRANS ENERGY INC | d585654dex992.htm |
 Exhibit 99.1
Whipkey
Drilling
Pad,
Marshall
County,
West
Virginia
THE
OIL
& GAS
CONFERENCE
–
AUGUST
13, 2013 |
 Disclaimer
This
presentation
contains
“forward-looking
statements”
within
the
meaning
of
section
21E
of
the
United
States
Securities
Exchange
Act
of
1934,
as
amended
(the
“Exchange
Act”)
which
represent
our
expectations
or
beliefs
about
future
events.
These
statements
can
be
identified
generally
by
forward-looking
words
such
as
“expect”,
“believe”,
“anticipate”,
“plan”,
“intend”,
“estimate”,
“may”,
“will”
or
similar
words.
Forward-looking
statements
are
statements
about
the
future
and
are
inherently
uncertain,
and
our
actual
achievements
or
other
future
events
or
conditions
may
differ
materially
from
those
reflected
in
the
forward-looking
statements
due
to
a
variety
of
risks,
uncertainties
and
other
factors,
including,
without
limitation,
those
described
in
Item
1A
of
the
company’s
annual
report
on
form
10-K
for
the
year
ended
December
31,
2012
under
the
heading,
“Risk
Factors”,
and
elsewhere
in
the
annual
report
and
our
filings
with
the
Securities
and
Exchange
Commission.
These
risks
and
uncertainties
include,
but
are
not
limited
to:
1.
The
risks
of
the
oil
and
gas
industry,
such
as
operational
risks
in
exploring
for,
developing
and
producing
crude
oil
and
natural
gas;
2. market
demand;
3.
risks
and
uncertainties
involving
geology
of
oil
and
gas
deposits;
4.
the
uncertainty
of
reserves
estimates
and
reserves
life;
5.
the
uncertainty
of
estimates
and
projections
relating
to
production,
costs
and
expenses;
potential
delays
or
changes
in
plans
with
respect
to
exploration
or
development
projects
or
capital
expenditures;
6.
fluctuations
in
oil
and
gas
prices,
foreign
currency
exchange
rates
and
interest
rates;
7.
health,
safety
and
environmental
risks;
8.
uncertainties
as
to
the
availability
and
cost
of
financing;
9.
the
possibility
that
government
policies
or
laws
may
change
or
governmental
approvals
may
be
delayed
or
withheld;
10.
other
sections
of
this
presentation
may
include
additional
factors
that
could
adversely
affect
our
business
and
financial
performance.
Moreover,
we
operate
in
a
very
competitive
and
rapidly
changing
environment.
New
risk
factors
emerge
from
time
to
time
and
it
is
not
possible
for
our
management
to
predict
all
risk
factors,
nor
can
we
assess
the
impact
of
all
factors
on
our
business
or
the
extent
to
which
any
factor,
or
combination
of
factors,
may
cause
actual
results
to
differ
materially
from
those
contained
in
any
forward-looking
statements.
Our
forward-looking
statements
contained
in
this
presentation
are
made
as
of
the
respective
dates
set
forth
in
this
presentation.
Such
forward-looking
statements
are
based
on
the
beliefs,
expectations
and
opinions
of
management
as
of
the
date
the
statements
are
made.
We
do
not
intend
to
update
these
forward-looking
statements.
For
the
reasons
set
forth
above,
investors
should
not
place
undue
reliance
on
forward-looking
statements.
Readers
are
encouraged
to
read
our
December
31,
2012
Annual
Report
on
Form
10-K
and
any
and
all
of
our
other
documents
filed
with
the
SEC
regarding
information
about
Trans
Energy,
Inc.
for
meaningful
cautionary
language
in
respect
of
the
forward-looking
statements
herein.
Interested
persons
are
able
to
obtain
copies
of
filings
containing
information
about
Trans
Energy,
Inc.,
without
charge,
at
the
SEC’s
internet
site
(http://www.sec.gov).
2 |
 About Trans Energy
Company Overview
6/30/2013
LTM Revenue
$14.2 million
Net Debt (as of 6/30/2013)
$56.8 million
Recent Stock Price (TENG)
$2.99
Shares Outstanding (8/13/2013)
13.3 million
Market Capitalization
$39.8 million
Enterprise Value
$96.6 million
Trans Energy: (OTCQB: TENG)
Pure Play Marcellus Shale
Proved Reserves: 52.4 Bcfe
(12/31/2012
Wright
&
Co.
Estimates
-
Marcellus
only)
Recent Daily Production: 10,000 Mcfe
52-Week Range: $1.55 -
$5.01
3-Month Avg. Daily Volume –
1,805 Shares
Shares Outstanding: 13.3 Million
Market Capitalization: $39.8 million
Experienced Management Team
Selected Financial Information
3
Area of Operation |
 Why
Invest in Trans Energy? 4
Marcellus Shale Pure Play
Over 58,000 gross acres in core of the Marcellus Shale
Utica Shale potential
Upper Devonian upside potential
High-BTU, liquid-rich focus
<$1.50 per MMBtu breakeven gas price on recent wells
Extensive Organic Drilling Inventory
400/500 + potential drilling locations (196/304 drillable today)
(1)
3+ Tcfe gross upside potential (including JV & royalty partners)
Significant portion of acreage HBP (approx. 2/3)
Off-take agreements totaling more than 45,000 MMBtu per day
Improved Financials
$75 million credit facility funding near term drilling program
Experienced Management w/ Technical Expertise
More than 200 years combined management experience
Well-funded joint development partner has geologic /
engineering team
Marcellus Shale pure play
Predictable and repeatable inventory
Prominent land position with strong
upside potential
Trades at a significant discount to
NAV
Experienced Management Team
(1) At 750 ft / 500 ft spacing |
 Corporate Strategy -
Prove Acreage / Add Drillable Locations
Consolidate acreage surrounding legacy positions in the core
of the Marcellus
Marshall, Wetzel, Marion and Tyler counties
Building
upon
local
presence
–
a
West
Virginia
company
Drill to turn highly prospective acreage into 3P reserves
Secure and maintain land position via leasehold rights
Grow production and reserves / monetize assets
5 |
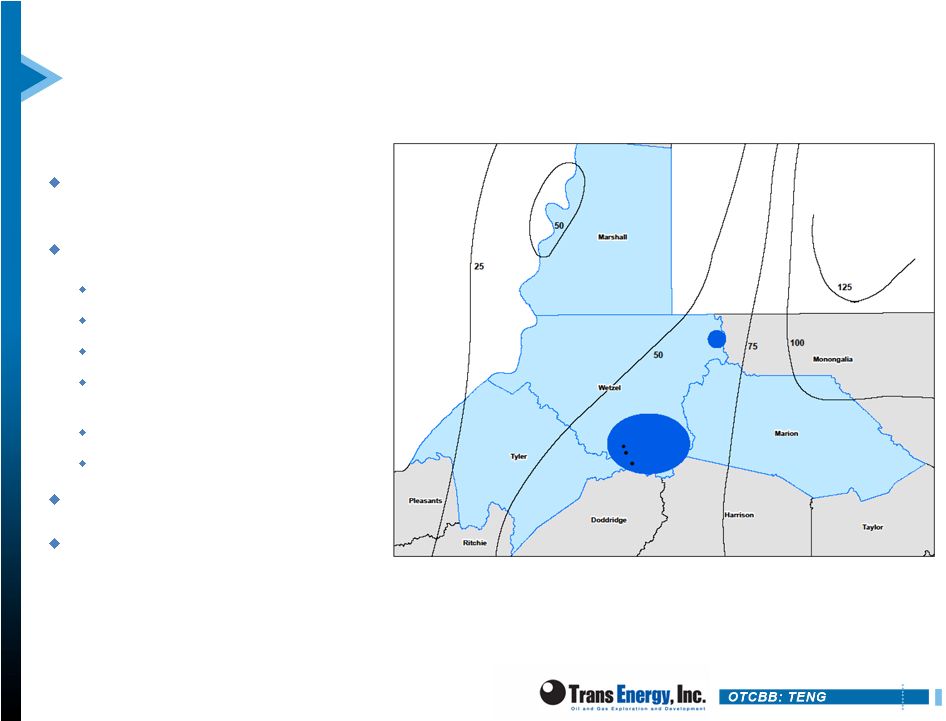
 Marcellus Overview
Majority of Company acreage
located in wet gas window
NGL
yields
in
the
1.4
–
1.9
gallons
per
mcf
range
Ft. Beeler processing plants provide 320
MMcf/day throughput capacity
Williams is adding another 640 MMcf/day
of processing to this system
Condensate and NGLs provide
$1.00 -
$2.00 pricing uplift
vs. dry gas
Breakeven natural gas price on
new
wells
<$1.50
per
MMBtu
(with
NGLs @ 40% WTI price)
Low-cost, highly predictable and
repeatable play
In Trans Energy’s area of
operation, the Marcellus shale is
approximately 50 –
100 feet thick
6 |
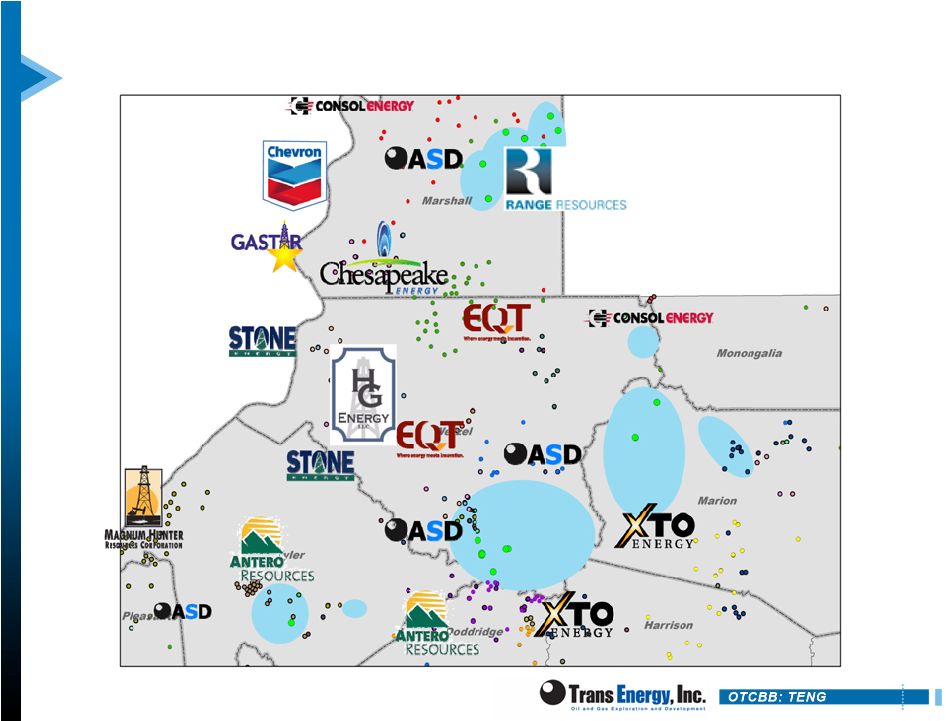 7
Competitive Market Position |
 Current Marcellus Acreage
Significant Marcellus acreage that
is held by shallow well production
Approximately 350 horizontal well
locations from HBP acreage alone
Primary term leased acreage can
generally be held by production
from shallow vertical or Marcellus
horizontal wells
Current drilling program
supplemented with selective
shallow drilling will HBP all strategic
acreage with near term lease
expirations over the next two years
Significant amount of acreage is
also prospective for the Utica shale
8
Acreage Breakdown –
18,789 Net acres |
 Reserves and Resources (SEC 12/31/12 Est.)
Trans Energy has exposure to more than 3 Tcfe of Marcellus resource potential
More
than
400/500
potential
drilling
locations
(186/304
ready
to
drill
today)
(3)
EUR per well of 1.4 –
2.9 Bcfe /1000’
of lateral (Est. Reserves as of 12/31/12)
9
12/31/12 SEC Reserve Summary Est.
(1)
(1)
Based on reserve estimates for ASD from the 12/31/2012 SEC reserve report
prepared by independent reserve engineer Wright & Company, Inc.
(2012 SEC pricing) Trans Energy recently sold 2.53 Bcfe of PDP reserves
associated with shallow assets that are not included in the above
figures. Proved Reserve Mix
(1)
Proved Reserve Category Mix
(1)
(2)
Approximately 1/3 of the Non-proved Reserves shown above have been designated as
“Probable” due to funding limitations.
(3)
At 750 ft / 500 ft spacing
Oil
Gas
NGL
Total
% of
(MMBbl)
(Bcf)
(MMBbl)
(Bcfe)
Total
PDP/PDNP
0.012
26.566
1.038
32.862
62.74%
$76.9
$34.6
PUD
0.004
15.827
0.611
19.517
37.26%
$26.7
$2.8
Total Proved
0.016
42.393
1.648
52.379
$103.6
$37.4
PROBABLE
(2)
0.078
244.752
8.020
293.338
$310.0
($22.5)
PV10%
Total |
 Proved Reserves (Internal 6/30/13 Roll Forward Est.)
Trans Energy has exposure to more than 3 Tcfe of Marcellus resource potential
More
than
400/500
potential
drilling
locations
(186/304
ready
to
drill
today)
(2)
EUR per well of 1.4 –
2.9 Bcfe /1000’
of lateral (Est. Reserves as of 12/31/12)
10
6/30/13 Internal Reserve Roll Forward Summary Est.
(1)
(1)
Based on reserve estimates for ASD from the 6/30/13 reserve report prepared
by independent reserve engineer Wright & Company, Inc. (7/1/13
NYMEX strip pricing, with hedges in place) Trans Energy recently sold 2.53
Bcfe of PDP reserves associated with shallow assets that are not included in
the above figures. Proved Reserve Mix
(1)
Proved Reserve Category Mix
(1)
(2)
At 740 ft / 500 ft spacing
Oil
Gas
NGL
Total
% of
(MMBbl)
(Bcf)
(MMBbl)
(Bcfe)
Total
PDP/PDNP
0.015
30.253
1.218
37.651
69.20%
$131.0
$57.0
PUD
0.003
13.674
0.511
16.761
30.80%
$45.5
$13.7
Total Proved
0.018
43.927
1.729
54.412
$176.5
$70.8
Total
PV10% |
 Wet
Gas Provides Positive Economics $3.50 NYMEX Equals $4.83/MCF Wellhead
Price •
$3.50 / MMBTU NYMEX Henry Hub
•
$100 NYMEX WTI
11
Natural Gas
Natural Gas Liquids
Condensate
Production Breakdown
.84
MCF
1.6 Gallons/MCF
.00212 BBLS/MCF
Gross Realized Price by Product
$3.30 net
(1)(2)
$1.37 net
(3)(4)(5)
$0.16 net
(6)
Total Realized Price per 1 MCF
$4.83/MCF
Gathering, Transportation and
Processing
($0.75/MCF)
Net Realized Price per 1 MCF
$4.08/MCF
1.
$0.02 premium to NYMEX Henry Hub
2.
1.116 MMBTU/mcf residue BTU factor
3.
40% NYMEX WTI per NGLs
4.
42 gal/bbl conversion factor
5.
90% NGLs
6.
WTI less $26.00 for Appalachian Light Sweet
One mcf Natural Gas via Wellhead Production |
 Experienced Management Team
12
Steve Lucado
Chairman of the Board
Director since 2011
More than 19 years professional financial experience, including E&P CFO experience
Bachelor of Arts Degree Harvard University, MBA, University of Chicago
John Corp
President & Director
Director since 2005 and President since June 2010
More than 25 years drilling, production and operations experience
Received a Bachelor of Science Degree in Petroleum Engineering from Marietta
College
John Tumis
Chief Financial Officer
Chief Financial Officer of Trans Energy since April 2011
More than 25 years experience in financial and strategic business planning in the oil
and natural gas industry
Received a Bachelor of Science Degree from Ohio Northern University and is a
certified public accountant
Leslie Gearhart
Vice President of Operations
& General Secretary
Vice President of Operations and General Secretary
Has more than 25 years of experience in the oil and gas industry
in the Appalachian
Basin
Graduated with a Bachelor of Science Degree in Petroleum Engineering from
Marietta College |
 Joint Development Partner: Republic Energy
Republic is a privately held Dallas-based E&P company
Technical team has 200+ years combined industry
experience
Former VP Geology and Head of Completion Operations for North Texas
from Mitchell Energy Corporation
Mitchell
was
the
cutting
edge
Barnett
player
–
wrote
the
book
on
shale
fracing
Republic focused on assets in the JV with Trans Energy
100% of Trans Energy’s Marcellus assets in the JV
JV agreement requires mutual consent to drill >6 wells/year
Equity financing from Energy Trust Partners (an affiliate of
Energy Spectrum) and Wells Fargo
13 |
 Type Curve IRR Sensitivities –
Recent Wells
14 |
 Marshall County
JV has 13,019 gross acres of leased and owned minerals
12 wells online, 1 well drilled and completed
Average 30-day IP of 4.4 MMcfe/d
(1)
/ 6.0 MMcfe/d
(2)
20% Oil/NGLs
Average
lateral
length
4,100’
(1)
/
3,420’
(2)
Average EUR / 1000’
lateral
of
1.90
Bcfe
(1)
/
2.22
Bcfe
(2)
4.5 Frac Stages/1000' lateral
Drill time of 35 days spud
to rig release
Total Potential Wells: > 175
Wells Drillable Today: 48 / 79
(3)
2013 Drilling Program: 2 wells
15
(1)
Excludes Whipkey 1H, Doman 1H and Doman 2H
(2)
Includes Doman 1H and Doman 2H
(3)
At 750 ft / 500 ft spacing |
 Wetzel County
JV has 14,606 gross acres of
leased and owned minerals
5 wells online
Average 30-day IP of 8.1 MMcfe/d
(1)
20% Oil/NGLs
5,000’
Average lateral length
(1)
Average EUR / 1000’
lateral
(1)
of 2.27 Bcfe
4.5 Frac Stages/1000' lateral
Drill time of 35 days spud to rig release
Total Potential Wells: > 200
Wells Drillable Today: 85 / 128
(2)
(1)
Excludes Hart 28H
(2)
At 750 ft / 500 ft spacing
16 |
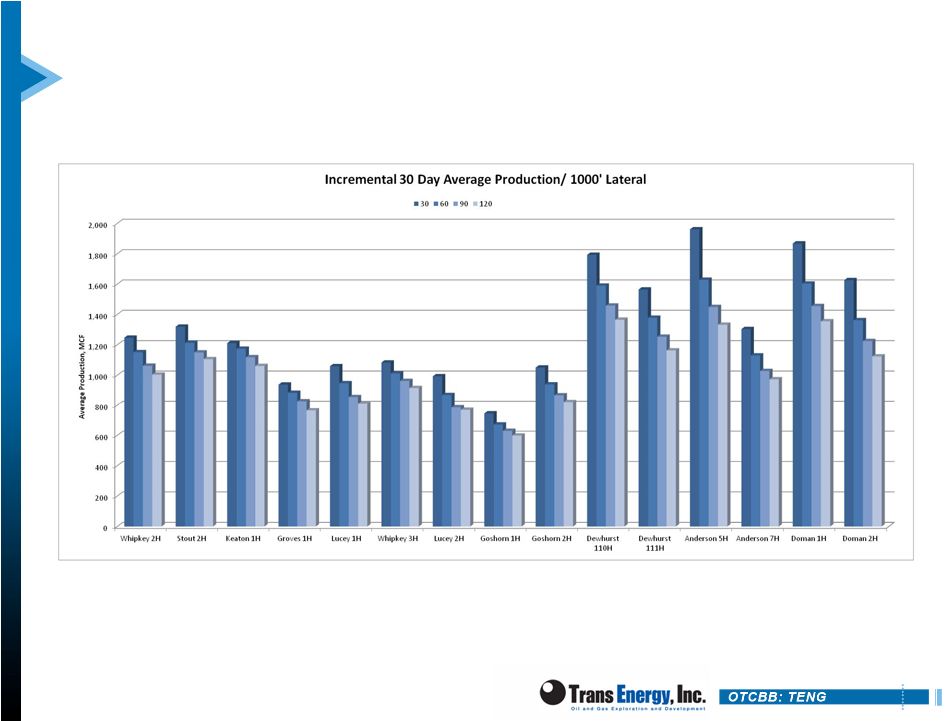 IP
Rates - Recent Marcellus Completions
17 |
 Drilling Program –
Recap
17 Hz wells online
2 Doman wells turned
online January 2013
Martinez well drilled and
completed; online in late
August
Goshorn wells drilled
and completed; online in
October
Graff and Freeland wells
drilled; fracking
underway
2013 Drilling Program
Marion
(4)
Tyler
(1)
Marshall (2)
18 |
 Marion County
JV has 22,755 gross acres of leased and
owned minerals
Marcellus gains thickness relative to
Wetzel
BTU expected between 1050 and 1100
Total Potential Wells: ~200
Total Wells Drillable Today: 25 / 42
(1)
2013 Drilling Program: 4 wells
(1)
At 750 ft / 500 ft spacing
19
Marion County |
 Tyler County
JV has 4,050 gross acres of leased
and owned minerals
Total Potential Wells: >45
Total Wells Drillable Today: 36 / 55
(1)
2013 Drilling Program: 1 well
(1)
At 750 ft / 500 ft spacing
20
Tyler County |
 Gas
Off-Take
(Williams
&
Momentum
3)
20-year gas gathering agreement
with Williams for up to 45,000
MMBTU / day
90,000 MMBTU / day including
Republic capacity
Williams committed to provide off-
take for all wells to be drilled
(1)
Access to the TETCO, Columbia and
Dominion lines
Marshall and Wetzel County wells feed
into TETCO
Ft. Beeler cryogenic processing
facility started up in 2Q 2011
NGL yields up to 1.4 –
1.9 gal/mcf
Second facility started
Moundsville fractionation plant online
since November 2012
Momentum 3 will provide
transportation in Marion County
(1)
Based on acreage dedication; Excludes Marion
County
21 |
 Net
Asset Value 22
Trading at significant discount to net asset value (NAV)
Trans Energy
(1)
Sum-of-Parts NAV
Category
Low
High
Low
High
Low
High
6/30/13 Proved Reserves (Internal, Strip Price Deck)
54.41
Bcfe
$1.00
$3.00
$54,410,000
$163,230,000
$4.09
$12.26
45 Other Current drilling locations from existing pads
(2, 3)
132
Bcfe
$1.00
$3.00
$131,625,000
$394,875,000
$9.88
$29.65
146 Current drilling locations from new pads
(2, 3)
427
Bcfe
$0.15
$0.75
$64,057,500
$320,287,500
$4.81
$24.05
Undeveloped Acreage:
Marcellus
4,000
Net acres
$1,000
$5,000
$4,000,000
$20,000,000
$0.30
$1.50
Utica
14,000
Net acres
$0
$0
$0
$0
$0.00
$0.00
Upper Devonian
14,000
Net acres
$0
$0
$0
$0
$0.00
$0.00
Less:
Net debt as of 6/30/13
($56,770,330)
($56,770,330)
($4.26)
($4.26)
Total (pre ASD warrants)
$197,322,170
$841,622,170
$14.82
$63.19
Total (post ASD warrants)
$163,981,427
$682,642,927
$12.31
$51.26
9.73
$
40.49
$
Shares outstanding
(4)
13,317,978
13,317,978
16,858,402
16,858,402
Notes
(1)
Figures below include only the assets in Trans Energy's 100% wholly-owned
subsidiary, ASD; Figures do not reflect shallow well assets. (2)
Assumes an average EUR of 7.8 Bcfe per well and an average NRI
of 37.5%.
(3)
Current drilling locations defined as wells where:
(a)
ASD currently controls 100% of the acreage required to drill each well
(b)
The average lateral length on each pad site is at least 3,000 feet,
(c)
Each well is on a pad site from which ASD can currently drill at least two such
wells, and (d)
Each pad site has been surveyed, and a judgment has been made that the topography
will support the pad site (4)
Does not reflect potential dilution due to outstanding options.
Value Per Share
Total Value
Unit Value |
 Why
Invest in Trans Energy? 23
Marcellus Shale Pure Play
Over 58,000 gross acres in core of the Marcellus Shale
Utica Shale potential
Upper Devonian upside potential
High-BTU, liquid-rich focus
<$1.50 per MMBtu breakeven natural gas price on recent wells
Extensive Organic Drilling
Inventory
w/ Large Acreage
Position
400/500 + potential drilling locations
(1)
3+ Tcfe upside potential (including JV and royalty partners)
Significant portion of acreage HBP (approx. 2/3)
Off-take agreements totaling up to 45,000 MMBtu per day
Improved Financials
$75 million credit facility funding near term drilling program
Experienced Management w/
Technical Expertise
More than 200 years combined management experience
Well-funded joint development partner has geologic / engineering team
(1) At 750 ft / 500 ft spacing |
 APPENDIX
Doman Drilling Pad, Marshall County, West Virginia
|