Attached files
| file | filename |
|---|---|
| 8-K - FORM 8-K - MRC GLOBAL INC. | d584868d8k.htm |
 Barclays
Energy Distribution Day August 15, 2013
1
MRC Global Inc. // Barclays Energy Distribution Day
August 15, 2013
Exhibit 99.1 |
 Barclays Energy
Distribution Day August 15, 2013
2
2
This presentation contains forward-looking statements within the meaning of Section 21E of the
Securities Exchange Act of 1934, as amended, and Section 27A of the Securities Act, as amended,
including, for example, statements about the Company’s business strategy, its industry,
its future profitability, growth in the Company’s various markets, and the Company’s expectations, beliefs, plans, strategies,
objectives, prospects and assumptions. These forward-looking statements are not guarantees
of future performance. These statements involve
known
and
unknown
risks,
uncertainties
and
other
factors
that
may
cause
the
Company’s
actual
results
and
performance
to
be
materially different from any future results or performance expressed or implied by these
forward-looking statements. For a discussion of key risk factors, please see the risk
factors disclosed in the Company’s annual report on Form 10-K for the year ended December 31, 2012 and
the registration statement (including a prospectus and prospectus supplement) for the offering to
which this communication relates, which are available
on
the
SEC’s
website
at
www.sec.gov
and
on
the
Company’s
website,
www.mrcglobal.com.
Undue reliance should not be placed on the Company’s forward-looking statements.
Although forward-looking statements reflect the Company’s good faith beliefs, reliance
should not be placed on forward-looking statements because they involve known and unknown risks,
uncertainties and other factors, which may cause our actual results, performance or achievements to
differ materially from anticipated future results, performance or achievements expressed or
implied by such forward-looking statements. The Company undertakes no obligation to
publicly update or revise any forward-looking statement, whether as a result of new information,
future events, changed circumstances or otherwise.
Statement Regarding Use of Non-GAAP Measures:
The Non-GAAP financial measures contained in this presentation (EBITDA, Adjusted EBITDA, Adjusted
Gross Profit and variations thereof) are
not
measures
of
financial
performance
calculated
in
accordance
with
GAAP
and
should
not
be
considered
as
alternatives
to
net
income
(loss) or any other performance measure derived in accordance with GAAP or as alternatives to cash
flows from operating activities as a measure
of
our
liquidity.
They
should
be
viewed
in
addition
to,
and
not
as
a
substitute
for,
analysis
of
our
results
reported
in
accordance
with
GAAP, or as alternative measures of liquidity. Management believes that certain non-GAAP
financial measures provide a view to measures similar to those used in evaluating our
compliance with certain financial covenants under our credit facilities and provide financial statement
users meaningful comparisons between current and prior year period results. They are also used
as a metric to determine certain components of performance-based compensation. The
adjustments and Adjusted EBITDA are based on currently available information and certain
adjustments that we believe are reasonable and are presented as an aid in understanding our operating results. They are not
necessarily indicative of future results of operations that may be obtained by the Company.
Forward Looking Statements and Non-GAAP Disclaimer |
 Barclays Energy
Distribution Day August 15, 2013
3
By the Numbers
Industry Sectors
Product Categories
Business Model
2013E
Sales
Guidance
Midpoint
$5.2 B
Upstream
Line Pipe / OCTG
Locations
400+
Countries
44+
Midstream
Valves
Customers
18,000+
Suppliers
18,000+
Downstream/
Industrial
Fittings / Flanges
SKU’s
175,000+
Company Snapshot
MRO
72%
Projects
28%
U.S.
75%
Canada
14%
Europe / Asia Pacific
11%
MRC is the largest global distributor of pipe, valves and fittings (PVF) to the energy industry
1.
Percentage of sales for the six months ended June 30, 2013
2.
MRO revenue generated from broad based contracts covering both ongoing capital and operating needs of
customers. 1
2 |
 Barclays Energy
Distribution Day August 15, 2013
4
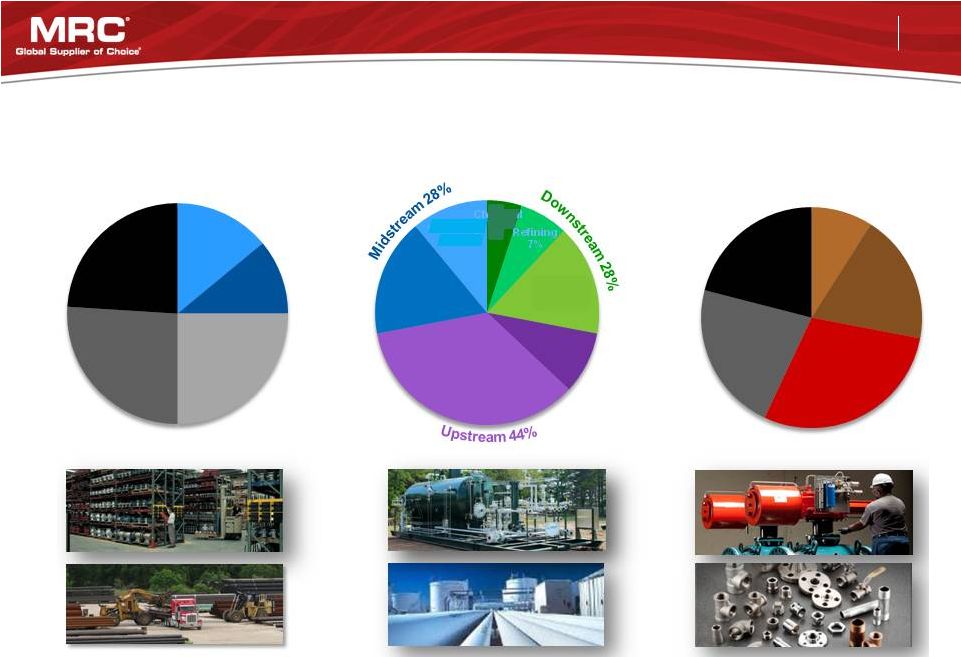
By Geography
By Product Line
Transmission
17%
By Industry Sector
MRC Revenue Diversification
Production
Infrastructure,
Materials &
Supplies
35%
Note: Percentage of sales for the six months ended June 30, 2013.
Drilling &
Completion
Tubulars
9%
Chemical
5%
Refining
7%
Other/
Industrial
16%
Gas Utility
11%
Canada
14%
Europe/
Asia
Pacific
11%
Western
US
25%
Gulf Coast
26%
Eastern
US
24%
OCTG
9%
Line Pipe
19%
Valves
29%
Fittings &
Flanges
22%
Other
21% |
 Barclays Energy
Distribution Day August 15, 2013
5
Benefits of MRC
•
Supplier Registration / Preferred Supplier List
•
Global footprint
•
Integrated IT procurement systems
Integrated Supply Chain Services
•
Inventory Consignment / Just-in-Time Delivery
•
Customized IT Solutions
•
Warehouse Management
•
Technical Assistance / Product Recommendation
•
Cost Savings and Efficiencies
•
Logistics Management
Why Customers Choose Distribution & MRC
Generating savings and efficiencies for our customers
while enabling them to focus on their core competencies
PVF is low cost
relative to overall
cost of maintenance
or project spend so
service is integral |
 Barclays Energy
Distribution Day August 15, 2013
6
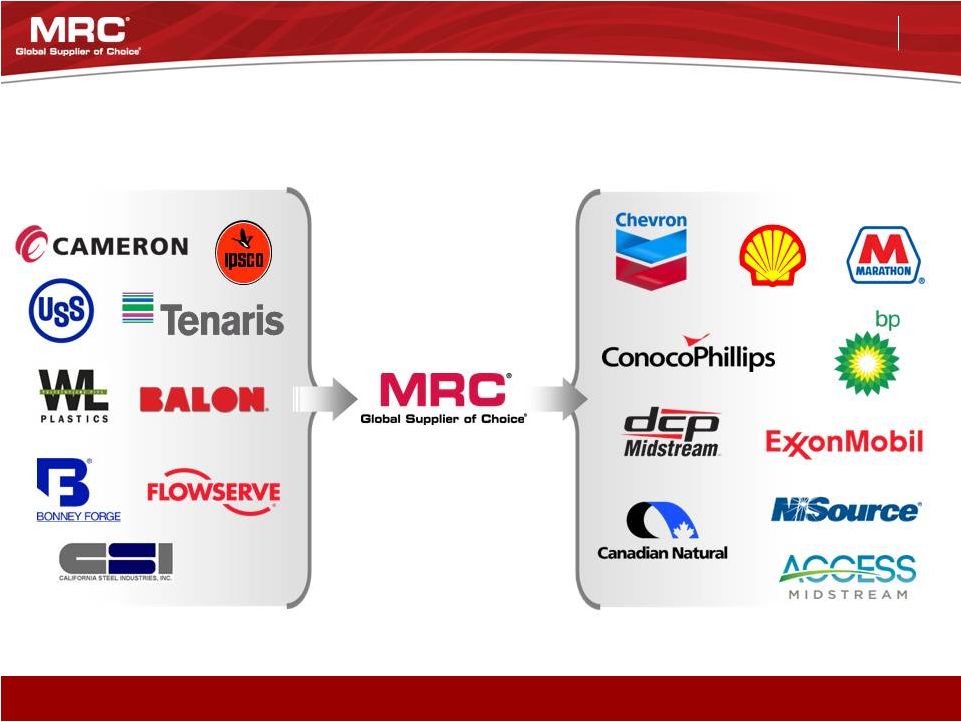
MRC plays a critical role in the complex, technical, global energy supply chain
Long-Term Customer & Supplier Relationships
CUSTOMERS
SUPPLIERS |
 Barclays Energy
Distribution Day August 15, 2013
7
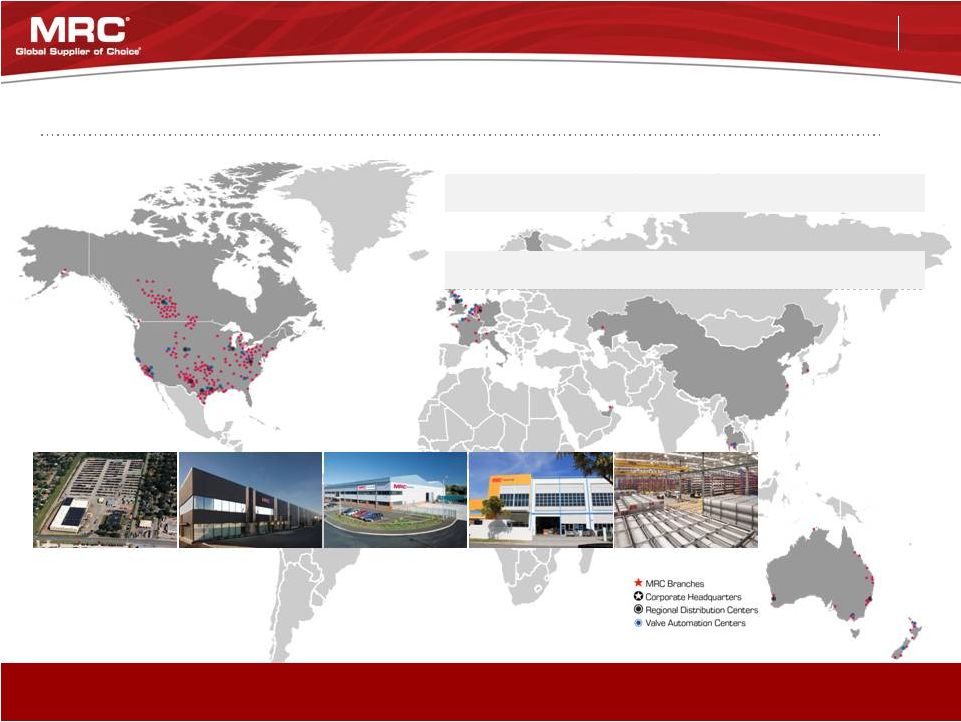
Where Our Customers Need Us To Be
Leading
industrial
distributor
of
PVF
globally
to
the
energy
and
industrials
sectors
Houston, TX
Edmonton, AB
Bradford, UK
Singapore
Perth, AU
North America
International
Branches
U.S. = 145+
Canada = 45+
50+
Distribution Centers
U.S.= 8
Canada = 1
U.K. = 1
Singapore = 1
Australia = 2
Netherlands = 1
Valve Automation Centers
U.S. =12
Canada = 1
12
Pipe Yards
U.S. = 95+
Canada = 25+
10 |
 Barclays Energy
Distribution Day August 15, 2013
8
Strategic Objectives
•
2012: Global Shell valve contract
•
2013: Global Celanese PVF contract
•
More expected
•
Lowered OCTG as a percentage of
inventory / sales
•
Focus on valve and valve automation
•
Strengthen offerings in stainless and
alloy PFF
•
Add product lines to complete global PVF offerings
•
2012: Production Specialty Services
•
2013: Flow Control Products, Permian Basin –
Valve & valve automation
•
NAWAH –
Iraqi alliance
•
Service
customers
where
they
spend
–
currently
an
international focus
•
Target
Accounts:
develop
the
“next
75”
customers
•
Top
25
customers
represent
49%
of
revenue
1
All
Other
-
18,000+
customers
Targeted Growth Accounts
Top 1 -
25
Customer Mix
-
Revenue
~2/3 of sales are under contract
95% renewal rate since 2000
1. Percentage of sales for the six months ended June 30, 2013
.
27%
24%
49%
Organic Growth
Growth from Mergers & Acquisitions
Execute Global Preferred
Supplier Contracts
Rebalance Product Mix to
Higher Margin Items |
 Barclays Energy
Distribution Day August 15, 2013
9
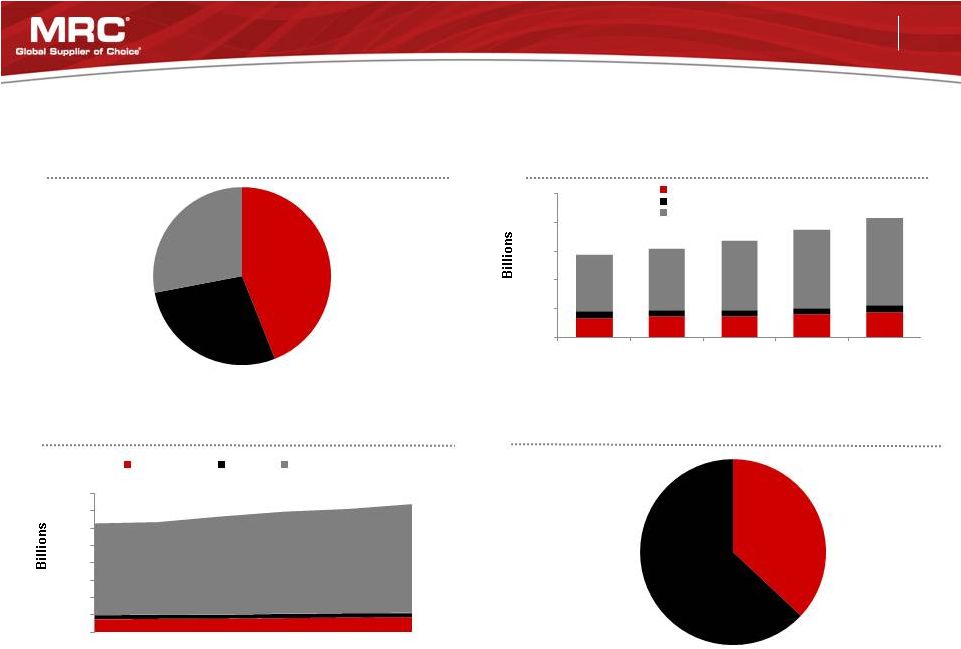
End Market Opportunities
Aging Infrastructure & New Legislation
Driving Pipeline Replacement
4
Global E&P Spending
1.
Percentage of sales for the six months ended June 30, 2013
2.
Source: Barclays 2013 E&P Spending Outlook Mid Year Update.
3.
Source: Industrial Info Resources: June 2013
4.
Source: Pipeline Safety and Hazardous Materials Administration, Wall Street Journal, for Top 10 states
by pipeline mileage Global Petroleum Refining &
Chemical Processing Spend
MRC Revenue Mix by End Market
$-
$200
$400
$600
$800
$1,000
2011A
2012A
2013E
2014E
2015E
United States
Canada
Outside North America
$-
$50
$100
$150
$200
$250
$300
$350
$400
2010A
2011A
2012A
2013E
2014E
2015E
United States
Canada
Outside North America
Upstream
44%
Downstream
28%
Midstream
28%
Built after
1970
37%
Built
before
1970
63%
2
3
1 |
 Barclays Energy
Distribution Day August 15, 2013
10
Today
10 –
15 Years Ago
Next 1 to 5 Years
Changing PVF Energy Distribution Landscape
Consolidating energy industry benefits global players
Decentralized
Procurement
•
PVF purchasing
handled locally
•
Separate contracts by
product class
Centralized
Procurement
•
Purchasing more
consolidated
•
Contracts by end segment
•
Contracts cover PVF
•
Customers align with
suppliers with size/scale Global
Procurement
•
Global upstream /
midstream / downstream
PVF contracts |
 Barclays Energy
Distribution Day August 15, 2013
11
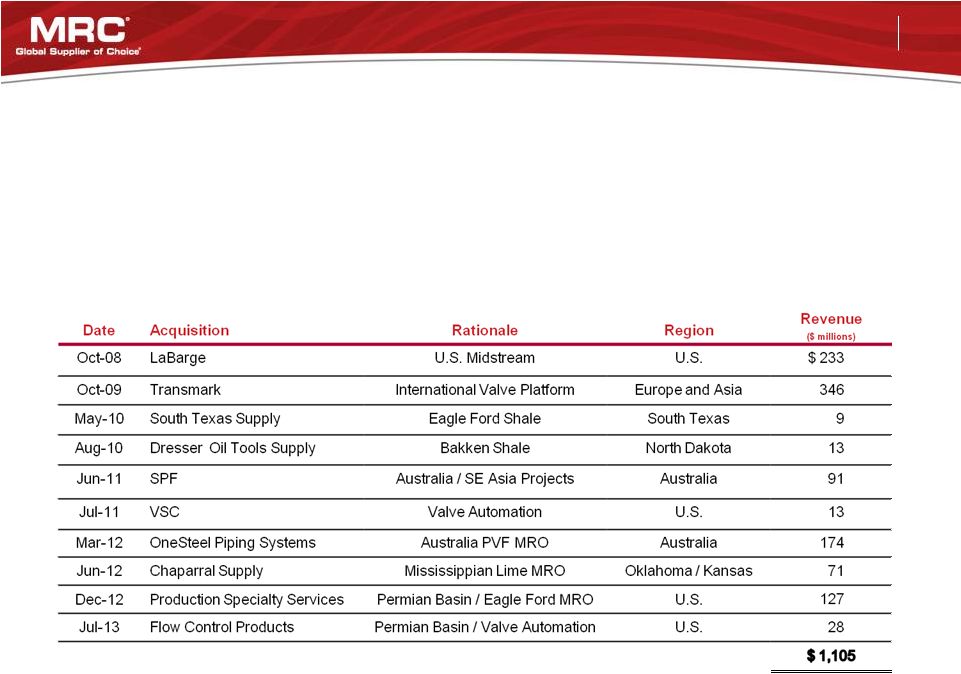
Note: Reflects reported revenues for the year of acquisition
M&A -
Track Record of Strategic Acquisitions
Acquisition Priorities
•
Branch platforms/infrastructure for North American shale plays
•
Global valve and valve automation
•
Global stainless/alloys
•
International
branch
platform
for
“super
majors”
E&P
spend |
 Barclays Energy
Distribution Day August 15, 2013
12
Financial Overview |
 Barclays Energy
Distribution Day August 15, 2013
13
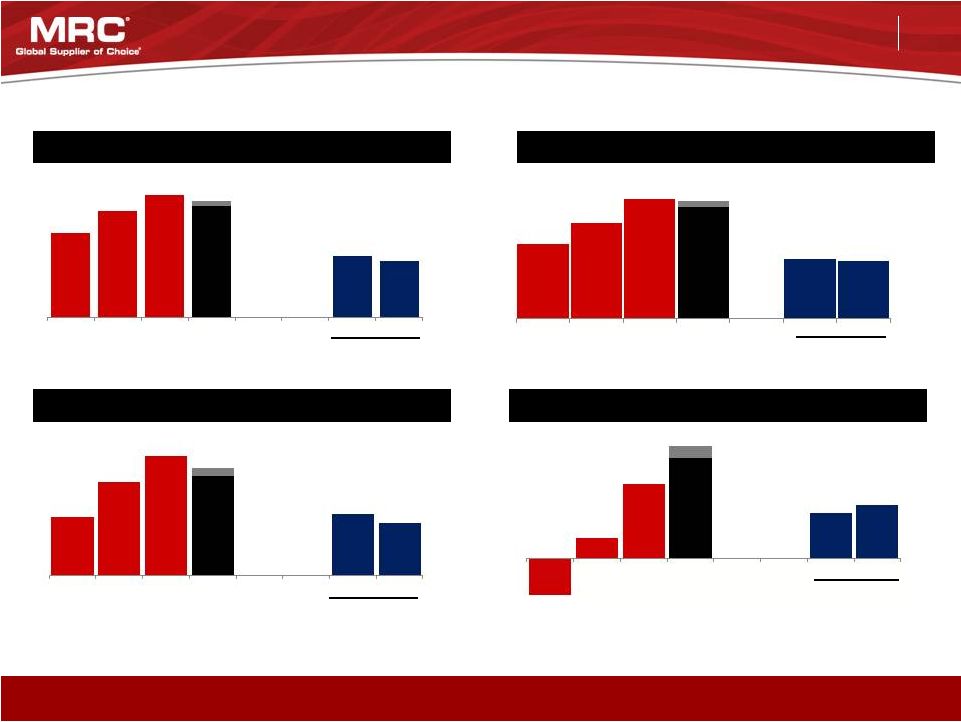
Financial Metrics
Sales
Adjusted Gross Profit and % Margin
Adjusted EBITDA and % Margin
8.5%
($ in millions, except per share data)
Y-o-Y
Growth
28%
24%
(4%)
Y-o-Y
Growth
61%
29%
(14%)
Longer term revenue growth and improving profitability
Y-o-Y
Growth
27%
15%
(7%)
Diluted EPS
Y-o-Y
Growth
NM
259%
43%
Six months
ended June 30
17.2%
17.6%
19.0%
20%
19%
18.8%
19.9%
$1,040
$3,846
$4,832
$5,571
$5,100
$2,813
$2,573
2010
2011
2012
2013
Guidance
2012
2013
Six months
ended June 30
$5,300
$663
$850
$1,058
$988
$530
$512
2010
2011
2012
2013
Guidance
2012
2013
Six months
ended June 30
$224
$360
$463
$385
$239
$203
2010
2011
2012
2013
Guidance
2012
2013
$415
$(0.61)
$0.34
$1.22
$1.65
$0.75
$0.88
2010
2011
2012
2013
Guidance
2012
2013
$ 1.85
Six months
ended June 30
5.8%
7.5%
8.3%
7.8%
7.5%
8.5%
7.9%
5.8%
7.5%
8.3%
7.8%
7.5%
8.5%
7.9% |
 Barclays Energy
Distribution Day August 15, 2013
14
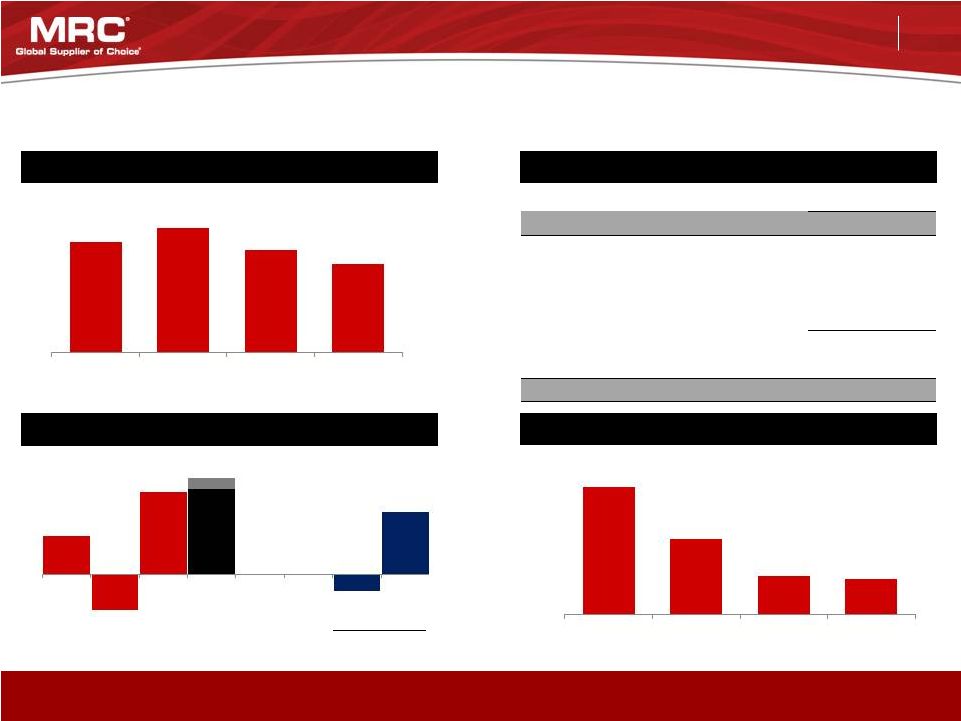
Balance Sheet Metrics
Total Debt
Capital Structure
Cash Flow from Operations
Net Leverage
($ in millions)
Strong balance sheet and cash flow
June 30, 2013
Cash and Cash Equivalents
$ 38
Total Debt (including current portion):
Term Loan B due 2019, net of discount
640
Global ABL Facility due 2017
439
Other
6
Total Debt
$ 1,084
Total Equity
1,261
Total Capitalization
$ 2,345
Six months
ended June 30
$1,360
$1,527
$1,257
$1,084
2010
2011
2012
June
-13
$113
$(103)
$240
$250
$(47)
$182
2010
2011
2012
2013
Guidance
2012
2013
$280
8.7 x
5.2 x
2.6x
2.45x
2010
2011
2012
June
-13 |
 Barclays Energy
Distribution Day August 15, 2013
15
Drivers
•
Growth in global energy
consumption drives capital
investment
•
Infrastructure to support
transmission and distribution of
energy
•
Increase in downstream energy
conversion businesses to produce
end products
Revenue Growth
10-12%
Adjusted Gross Profit Margin
20%
Adjusted EBITDA Margin
10%
Leverage
2.0 –
3.0x
Targets (through cycle)
Investment Thesis Summary
•
Organic
•
Acquisitions
2-3%
8-9% |
 Barclays Energy
Distribution Day August 15, 2013
16
Appendix |
 Barclays Energy
Distribution Day August 15, 2013
17
Six months ended
June 30
December 31
($ in millions)
2013
2012
2012
2011
2010
Net income (loss)
$ 90.0
$ 68.9
$ 118.0
$ 29.0
$ (51.8)
Income tax expense (benefit)
44.2
37.5
63.7
26.8
(23.4)
Interest expense
30.5
64.4
112.5
136.8
139.6
(Decrease) increase in LIFO reserve
(15.6)
18.5
(24.1)
73.7
74.6
Write off of debt issuance costs
-
1.7
1.7
9.5
-
Loss (gain) on early extinguishment of debt
-
11.4
114.0
-
-
Depreciation and amortization
11.2
8.6
18.6
17.0
16.6
Amortization of intangibles
26.0
24.8
49.5
50.7
53.9
Change in fair value of derivative instruments
(2.4)
(0.9)
(2.2)
(7.0)
4.9
Equity based compensation expense
4.6
3.6
8.5
8.4
3.7
Foreign currency losses (gains)
13.4
1.5
(0.8)
(0.6)
0.3
Inventory write-down
-
-
-
-
0.4
M&A transaction & integration expenses
-
-
-
0.5
1.4
Pension settlement
-
-
4.4
-
-
Legal and consulting expenses
-
-
(1.2)
9.9
4.2
Joint venture termination
-
-
-
1.7
-
Provision for uncollectible accounts
-
-
-
0.4
(2.0)
Severance and related costs
-
-
-
1.1
3.2
Franchise taxes
-
-
-
0.4
0.7
Closed locations
-
-
-
-
(0.7)
Other expenses
0.8
(1.2)
0.6
2.2
(1.4)
Adjusted EBITDA
$ 202.7
$ 238.8
$ 463.2
$ 360.5
$ 224.2
Adjusted EBITDA Reconciliation |
 Barclays Energy
Distribution Day August 15, 2013
18
Six months
ended
June
30
December 31
($ in millions)
2013
2012
2012
2011
2010
Gross Profit
$ 490.5
$ 478.2
$ 1,013.7
$ 708.2
$ 518.1
Depreciation and amortization
11.2
8.6
18.6
17.0
16.6
Amortization of intangibles
26.0
24.8
49.5
50.7
53.9
(Decrease) increase in LIFO reserve
(15.6)
18.5
(24.1)
73.7
74.6
Adjusted Gross Profit
$ 512.1
$ 530.1
$ 1,057.7
$ 849.6
$ 663.2
Adjusted Gross Profit GAAP Reconciliation |