Attached files
| file | filename |
|---|---|
| 8-K - FORM 8-K - MERCANTILE BANK CORP | d584453d8k.htm |
| EX-2.1 - EX-2.1 - MERCANTILE BANK CORP | d584453dex21.htm |
| EX-10.2 - EX-10.2 - MERCANTILE BANK CORP | d584453dex102.htm |
| EX-10.1 - EX-10.1 - MERCANTILE BANK CORP | d584453dex101.htm |
| EX-10.3 - EX-10.3 - MERCANTILE BANK CORP | d584453dex103.htm |
| EX-99.1 - EX-99.1 - MERCANTILE BANK CORP | d584453dex991.htm |
 Michigan’s
Community Bank August 15, 2013 | Investor Presentation
Exhibit 99.2 |
 Forward-Looking Statement Disclosure
2
This presentation contains comments or information that constitute forward-looking
statements (within the meaning of the Private Securities Litigation Reform Act of
1995) that are based on current expectations that involve a number of risks and
uncertainties. These forward looking statements are subject to a number of factors and
uncertainties which could cause Mercantile Bank Corporation’s
(“MBWM”), Firstbank Corporation’s (“FBMI”) or the combined company’s actual results and
experience to differ from the anticipated results and expectations expressed in such
forward looking statements. Forward looking statements speak only as of the date
they are made and neither MBWM nor FBMI assumes any duty to update forward looking
statements. These forward-looking statements include, but are not limited to, statements about (i) the
expected benefits of the transaction between MBWM and FBMI, including future financial and
operating results, accretion and earn-back, cost savings, enhanced revenues,
long term growth, and the expected market position of the combined company that may
be realized from the transaction, and (ii) MBWM and FBMI’s plans, objectives, expectations and
intentions and other statements contained in this presentation that are not historical
facts. Other statements identified by words such as “expects,”
“anticipates,” “will,” “intends,” “plans,” “believes,” “seeks,” “estimates,” “targets,” “positioned,”
“projects” or words of similar meaning generally are intended to identify
forward-looking statements. Management's determination of the provision and
allowance for loan losses, the carrying value of acquired loans, goodwill, and the fair
value of investment securities involve judgments that are inherently
forward-looking. These statements are based upon the current beliefs and
expectations of MBWM’s and FBMI’s management and are inherently subject to significant business,
economic and competitive risks and uncertainties, many of which are beyond their respective
control. In addition, these forward-looking statements are subject to
assumptions with respect to future business strategies and decisions that are
subject to change. Actual results may differ materially from those indicated or implied in
the forward-looking statements. There is no assurance that the due
diligence process would identify all risks associated with the transaction and no
assurance that the conditions to closing will be satisfied. Additional information
concerning risks is contained in MBWM’s and FBMI’s most recently filed
Annual Reports on Form 10-K, subsequent Quarterly Reports on Form 10-Q, recent Current
Reports on Form 8-K and other SEC filings. |
 Strategically
Compelling
Creates the 3
rd
largest Michigan-based bank by pro forma market capitalization and pro forma
deposit market share
Effective use of excess capital, expected to enhance profitability and shareholder
value Combined franchise is positioned for long term growth, with the size
and scale to compete more effectively in the current market
Geographically diverse and attractively mixed loan portfolio, coupled with stable
and valuable core funding
Enhances breadth of banking products for all customers
Strengthens competitive positioning throughout Michigan and enhances ability to
serve clients Complementary cultures and strong ties to community
~20%
core
EPS
accretion
projected
in
2014
(excluding
transaction
expenses)
~20% EPS accretion projected in 2015
Conservative and achievable cost savings
Manageable tangible book value dilution with an earn-back of approximately 4.5
years Internal rate of return of approximately 15%
Pro
forma
capital
ratios
above
“well
capitalized”
guidelines
and
strong
pro
forma
TCE
/
TA
ratio
of
greater than 8.0% at closing
Financially
Attractive
Transaction Highlights
3 |
 Combined Franchise
4
Balance
Sheet
Franchise
Deposit &
Loan
Composition
Market
Statistics
Pro Forma
($ in 000s)
Assets
1,343,750
$
1,457,046
$
2,800,796
$
Deposits
1,061,315
1,208,302
2,269,617
Gross Loans, including held for sale
1,058,662
975,796
2,034,458
Branches
7
46
53
Deposits / Branch
151,616
$
26,267
$
42,823
$
Core Deposits / Total Deposits
(1)
76.7%
86.8%
81.7%
Cost of Deposits
(2)
0.83%
0.39%
0.59%
Commercial & Industrial Loans (%)
(2)
24.8%
15.1%
20.1%
Closed End 1-4 Family (%)
(2)
4.8%
26.8%
15.3%
Commercial Real Estate Loans (%)
(2)
54.8%
35.7%
45.7%
Yield on Loans
(2)
4.86%
5.58%
5.21%
Market Capitalization
(3)
163,430
$
134,489
$
314,953
$
Dividend Yield
(4)
2.6%
1.4%
2.6%
52-week Average Daily Trading Volume (shares)
17,690
7,114
24,804
Source: SNL Financial and Company filings. Note: GAAP financial data as of
6/30/2013 except where noted. Pro forma column represents combined financial data, before
purchase accounting adjustments.
(1)
Core deposits defined as total deposits less time deposits > $100k. Based upon regulatory
financials. (2)
Based upon regulatory financials. Pro forma yield and cost based upon weighted average. (3)
As of 8/14/13. Pro forma assumes shares issued at transaction price. (4)
As of 8/14/13. Assumes pro forma dividend yield remains constant from MBWM standalone. |
 Pro
Forma Highlights (6/30/2013) Branches
53
Assets
$2.8 B
Loans
$2.0 B
Deposits
$2.3 B
Michigan’s Community Bank
MBWM (7)
FBMI (46)
A strong, western and central Michigan
franchise
# 3 pro forma deposit market share
ranking among institutions
headquartered in Michigan
Increased revenue generation
opportunities
Increased
scale
–
serving
a
larger,
diversified client base
Added convenience and wider product
and service offering for customers
Increased market visibility
5 |
 Transaction Terms
Board Composition
Transaction Value
Ownership Split
Name &
Headquarters
Executives
MBWM Special
Dividend
$18.77 per share or $151.5 million
(1)
52% MBWM / 48% FBMI
Mercantile expects to declare and pay a special dividend of $2.00 per share to
Mercantile shareholders prior to the closing of the merger, subject to the
satisfaction of the closing conditions set forth in the merger
agreement Mercantile Bank Corporation / Grand Rapids, Michigan
EVP: Robert Kaminski (MBWM)
Equal representation at the bank and holding company from each of MBWM and FBMI,
respectively •
Thomas Sullivan (FBMI) to be chairman through December 31, 2014
•
Michael Price (MBWM) to be chairman beginning January 1, 2015
Required Approvals
Customary regulatory and shareholder approvals of both MBWM and FBMI shareholders
Consideration
100% stock
Fixed exchange ratio of 1.000x share of MBWM common stock for each share of FBMI
common stock Targeted Closing
December 31, 2013
EVP:
Samuel Stone (FBMI)
CFO:
Charles Christmas (MBWM)
(1)
Based on MBWM closing price of $18.77 on 8/14/13. Does not give effect
to $2.00 per share dividend paid to MBWM
shareholders. 6
Board Chair: Thomas Sullivan (FBMI)
President & CEO: Michael Price (MBWM) |
 Firstbank Corporation
Core Deposits
(1)
Net Interest Margin (%)
Nonaccrual Loans ($M)
A Low Cost, High Quality Core Deposit Franchise…
7
% Core
$B
4.05
4.08
4.03
4.07
4.03
4.05
3.99
3.91
3.83
3.89
3.25%
3.50%
3.75%
4.00%
4.25%
4.50%
Q1
'11
Q2
'11
Q3
'11
Q4
'11
Q1
'12
Q2
'12
Q3
'12
Q4
'12
Q1
'13
Q2
'13
25
20
21
23
22
18
16
16
13
12
21
21
21
21
21
22
21
21
21
20
$0
$10
$20
$30
$40
$50
$60
Q1
'11
Q2
'11
Q3
'11
Q4
'11
Q1
'12
Q2
'12
Q3
'12
Q4
'12
Q1
'13
Q2
'13
Nonaccrual Loans ($M)
Reserves ($M)
$1.02
$1.02
$1.05
$1.04
$1.07
$1.04
$1.05
$1.07
$1.09
$1.05
83.3%
83.5%
84.1%
84.9%
85.6%
85.6%
85.9%
86.0%
87.0%
86.8%
$0.20
$0.40
$0.60
$0.80
$1.00
$1.20
80.0%
82.0%
84.0%
86.0%
88.0%
90.0%
Q1
'11
Q2
'11
Q3
'11
Q4
'11
Q1
'12
Q2
'12
Q3
'12
Q4
'12
Q1
'13
Q2
'13
Core Deposits ($B)
Core Deposits (% of Total Deposits)
Overview
Over $1 billion in low cost core deposits
Strong net interest margin and mortgage business
supporting stable and growing pre-tax, pre-provision
earnings
Asset quality metrics have continued to improve, with
strong reserve coverage of nonperforming loans
Strong capital position, having recently exited preferred
stock issued under TARP
Source: SNL Financial. Deposit composition is per regulatory filings. (1)
Core deposits defined as total deposits less time deposits great than $100,000. |
 Mercantile Bank Corporation
Source: SNL Financial and internal Company documents.
A Leading Western Michigan Commercial Lender…
Overview
Wholesale Funding
Net Interest Margin (%)
A leading and disciplined commercial lender in western
Michigan
Demonstrating strong organic loan growth, with $126M in
new originations in the first six months of 2013
Significant improvements in asset quality
Strong profitability with a stable margin and significantly
reduced reliance on wholesale funding
World class banking technology
8
Nonaccrual Loans ($M)
55
43
40
45
39
29
25
19
12
11
42
39
39
37
31
30
28
29
26
25
$0
$10
$20
$30
$40
$50
$60
Q1
'11
Q2
'11
Q3
'11
Q4
'11
Q1
'12
Q2
'12
Q3
'12
Q4
'12
Q1
'13
Q2
'13
Nonaccrual Loans ($M)
Reserves ($M)
3.64
3.61
3.50
3.65
3.73
3.63
3.67
3.62
3.68
3.66
3.25%
3.50%
3.75%
4.00%
4.25%
4.50%
Q1
'11
Q2
'11
Q3
'11
Q4
'11
Q1
'12
Q2
'12
Q3
'12
Q4
'12
Q1
'13
Q2
'13
839
842
851
855
845
851
888
931
932
910
572
523
452
376
352
343
315
305
268
246
$0
$200
$400
$600
$800
$1,000
$1,200
$1,400
$1,600
0.0%
10.0%
20.0%
30.0%
40.0%
50.0%
Q1
'11
Q2
'11
Q3
'11
Q4
'11
Q1
'12
Q2
'12
Q3
'12
Q4
'12
Q1
'13
Q2
'13
Local Funds
Wholesale Funds
Wholesale Funds as % of Total Funds
% of Total
$M |
 #3 Ranked Bank
Headquartered in Michigan Total
Number of
Deposits
Market
Rank
Institution
Branches
($M)
Share
1
Flagstar Bancorp Inc.
111
$9,096
5.46%
2
Chemical Financial Corp.
157
4,804
2.88
3
Pro Forma
53
2,349
1.41
3
Talmer Bancorp Inc.
41
2,023
1.21
4
Independent Bank Corp.
72
1,775
1.07
5
Macatawa Bank Corp.
27
1,246
0.75
6
Firstbank Corp.
46
1,243
0.75
7
Mercantile Bank Corp.
7
1,106
0.66
8
MBT Financial Corp.
24
1,018
0.61
9
Isabella Bank Corporation
28
981
0.59
10
Lake Michigan Financial Corp.
5
808
0.48
11
Northwestern Bancorp
27
785
0.47
12
United Bancorp Inc.
18
766
0.46
13
Arbor Bancorp Inc.
7
712
0.43
14
Capitol Bancorp Ltd.
10
679
0.41
15
First State Financial Corp.
11
501
0.30
16
First National Bancshares Inc.
3
472
0.28
17
Keweenaw Financial Corporation
10
457
0.27
18
Mackinac Financial Corp
12
430
0.26
19
Southern Michigan Bancorp Inc.
17
418
0.25
20
ChoiceOne Financial Services
12
403
0.24
Total (1-10 MI-Based)
518
$24,100
14.46%
Total (All Michigan)
(1)
2,915
$166,627
100.00%
Growing Market Share
9
Top 10 Ranking in Key Markets
Grand Rapids-Wyoming, MI MSA
5
Pro Forma
5
Mercantile Bank Corp. (MI)
18
Firstbank Corp. (MI)
Lansing-East Lansing, MI MSA
8
Pro Forma
12
Mercantile Bank Corp. (MI)
15
Firstbank Corp. (MI)
Kalamazoo-Portage, MI MSA
6
Pro Forma
6
Firstbank Corp. (MI)
NA
Mercantile Bank Corp. (MI)
Mount Pleasant, MI MSA
2
Pro Forma
2
Firstbank Corp. (MI)
NA
Mercantile Bank Corp. (MI)
Alma, MI MSA
2
Pro Forma
2
Firstbank Corp. (MI)
NA
Mercantile Bank Corp. (MI)
Note: Deposit data as of 6/30/2012; pro forma for pending acquisitions to the extent
discernible.
(1)
Includes all institutions with deposits in Michigan, regardless of headquarters.
Source: SNL Financial. Table above reflects deposit market share rankings for Michigan based
institutions only. |
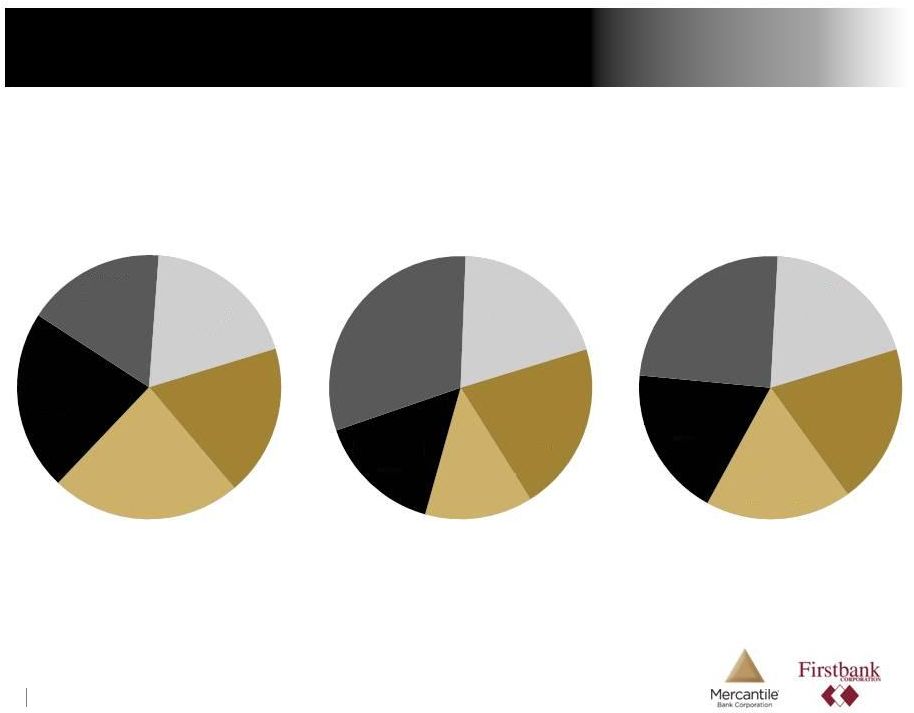 Total Deposits: $1.1B
MRQ Cost: 0.83%
Total Deposits: $1.2B
MRQ Cost: 0.39%
Total Deposits: $2.3B
MRQ Cost: 0.59%
Strong Core Funding
Pro Forma
10
Source: SNL Financial
Note: Based on bank holding company regulatory data as of 6/30/2013. Pro forma cost
of deposits calculated as a weighted average.
Firstbank
Mercantile
Noninterest
Bearing
21%
Time >$100K
13%
Time <$100K
15%
Money
Market
31%
Other
Interest
Bearing
20%
Noninterest
Bearing
20%
Time >$100K
18%
Time <$100K
19%
Money
Market
24%
Other
Interest
Bearing
19%
Noninterest
Bearing
19%
Time >$100K
23%
Time <$100K
22%
Money
Market
17%
Other
Interest
Bearing
19% |
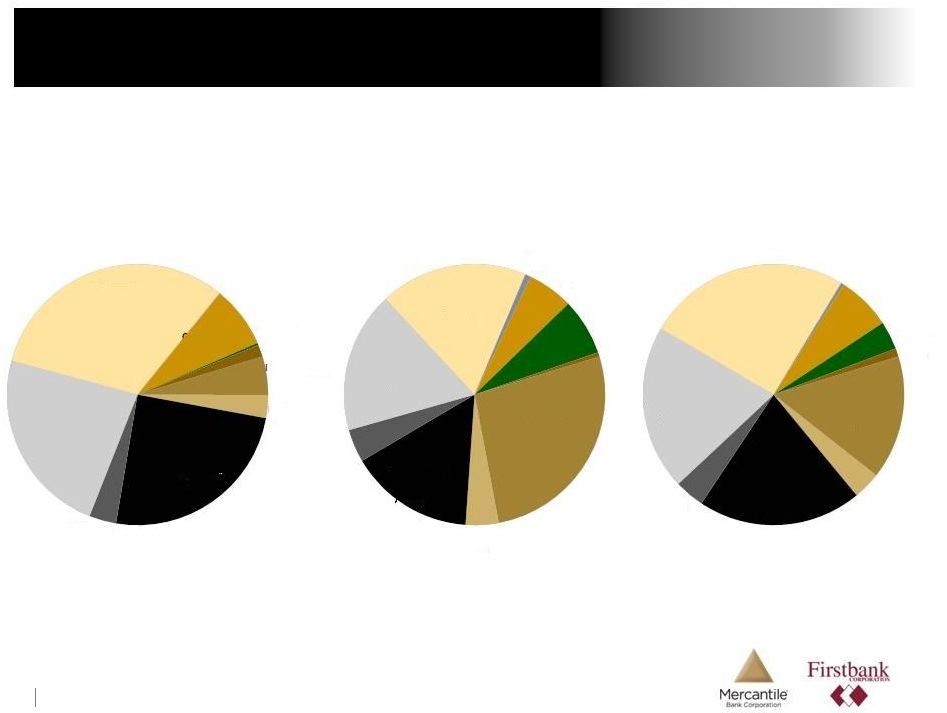 Total Loans: $1.1B
Yield: 4.86%
Total Loans: $1.0B
Yield: 5.58%
Total Loans: $2.0B
Yield: 5.21%
Diversified Loan Portfolio Positioned for Growth
11
Pro Forma
Firstbank
Mercantile
Source: SNL Financial
Note: Based on bank holding company regulatory data as of 6/30/2013. Pro forma
yield on loans calculated as a weighted average.
Closed End 1
-
4
Family
5%
HELOC
3%
Commercial &
Industrial
25%
Multifamily
3%
Owner-Occ.
CRE
23%
Non Owner-
Occ.
CRE
32%
Farm Loans
<1%
Construction
8%
Consumer
<1%
Other
1%
Closed End 1-4
Family
27%
HELOC
4%
Commercial &
Industrial
15%
Multifamily
4%
Owner-Occ.
CRE
17%
Non Owner-
Occ.
CRE
18%
Farm Loans
1%
Construction
6%
Consumer
7%
Other
<1%
Closed End 1-4
Family
15%
HELOC
3%
Commercial &
Industrial
20%
Multifamily
4%
Owner-Occ.
CRE
21%
Non Owner-
Occ.
CRE
25%
Farm Loans
<1%
Construction
7%
Consumer
4%
Other
1% |
 Comprehensive due diligence process including core
systems, legal and credit
•
Both organizations use the same core processing
software
Two tiered credit due diligence process completed by
senior management and 3rd party loan review team for
both banks
Analyzed credit files, underwriting methodology and policy
and portfolio management processes
MBWM’s extensive credit reviews focused on the largest
relationships, adversely classified assets and watch list
loans
•
Individually reviewed 100% of relationships with a
balance greater than $4 million
•
Individually reviewed more than 50% of all
commercial loans
•
Individually reviewed all adversely classified assets
with a balance greater than $600,000
FBMI completed comparable diligence on MBWM
Due Diligence Highlights
Credit Mark
Estimated loan mark of $24.5 million, or 2.5% of FBMI’s
portfolio
•
2.1x coverage of NPLs (excluding TDRs)
•
0.7x coverage of NPLs (including TDRs)
Validated by an experienced 3rd party vendor
Due Diligence
Other Estimated Fair Value Adjustments
Loan interest rate mark-up of $6 million (net asset value
write-up)
Trust preferred securities mark-down of $15 million (net
asset value write-up)
Deposit mark-up of $2 million (net asset value write-down)
Borrowings mark-up of $1 million (net asset value write-
down)
12 |
 EPS
Capital
IRR
Internal rate of return of approximately 15%
TCE / TA > 8% at closing
Total RBC ratio > 13.5% at closing
~11% dilution estimated at closing
Accretive to stand-alone tangible book
value in approximately 4.5 years
(2)
~20% core
(1)
EPS accretion in 2014
~20%+ EPS accretion in 2015
Pro Forma Financial Impact
Attractive Returns
Earnings are based on internal management estimates
•
$1.40 and $1.45 for MBWM in 2014 and 2015,
respectively
•
$1.79 and $1.74 for FBMI in 2014 and 2015,
respectively
No
revenue enhancements or cross-sell opportunities have
been assumed
Conservative and achievable cost savings of approximately
$5.5 million pre-tax. 60% phased in 2014, and 100%
thereafter
Gross loan mark of $24.5 million, or 2.5% of loans, validated
by an experienced 3 party vendor
One-time merger related expenses of $7.2 million after-tax
Core deposit intangible of 1.5%, amortized sum-of-the-years
digits over 10 years
Special cash dividend of $2.00 per share to MBWM
shareholders expected to be paid prior to closing (and
reflected in relative tangible book value dilution)
December 31, 2013 estimated closing
(1)
Core EPS excludes the impact of the restructuring expenses.
(2)
Earn-back period is defined as the number of years for pro forma tangible
book value per share to exceed stand-alone projected tangible book value
per share. 13
Key Assumptions
rd
Tangible
Book
Value |
 Combined franchise is positioned for long term growth with the scale, management
team and financial strength to compete effectively in the current market
Attractive financial returns for all shareholders
Significantly accretive to EPS and maintains strong capital position
Geographically diverse and attractively mixed loan portfolio, coupled with stable
and valuable core funding
Creates Michigan’s premier community bank
Enhances competitive positioning across Michigan, creating an institution with the
financial capacity and experience to be a leading consolidator of community
banks Summary
14 |
 Additional Information
15
Communications in this presentation do not constitute an offer to sell or the solicitation of an offer
to buy any securities or a solicitation of any vote or approval. The proposed merger and
issuance of MBWM common stock in connection with the proposed merger will be submitted to
MBWM’s shareholders for their consideration, and the proposed merger will be submitted to
FBMI’s shareholders for their consideration. MBWM will file with the Securities and Exchange Commission
(“SEC”) a registration statement on Form S-4 that will include a joint proxy statement
to be used by MBWM and FBMI to solicit the required approval of their respective shareholders
in connection with the proposed merger and will constitute a prospectus of MBWM. MBWM and FBMI
may also file other documents with the SEC concerning the proposed merger. INVESTORS AND
SECURITY HOLDERS OF MBWM AND FBMI ARE URGED TO READ THE JOINT PROXY STATEMENT AND PROSPECTUS
REGARDING THE PROPOSED MERGER AND OTHER RELEVANT DOCUMENTS THAT WILL BE FILED WITH THE SEC
CAREFULLY AND IN THEIR ENTIRETY WHEN THEY BECOME AVAILABLE BECAUSE THEY WILL CONTAIN IMPORTANT
INFORMATION ABOUT THE PROPOSED MERGER. Investors and security holders may obtain a free
copy of the joint proxy statement and prospectus and other documents containing important
information about MBWM and FBMI, once such documents are filed with the SEC, through the website
maintained by the SEC at www.sec.gov. Copies of the documents filed with the SEC by MBWM will be
available free of charge on MBWM’s website at www.mercbank.com under the tab
“Investor Relations.” Copies of documents filed with the SEC by FBMI will be
available free of charge on FBMI’s website at www.firstbankmi.com under the tab “Investor
Relations.”
MBWM, FBMI and certain of their respective directors and executive officers may be deemed to be
participants in the solicitation of proxies from the shareholders of MBWM and FBMI in
connection with the proposed transaction. Information about the directors and executive
officers of MBWM is set forth in its proxy statement for its 2013 annual meeting of
shareholders, which was filed with the SEC on March 15, 2013. Information about the directors
and executive officers of FBMI is set forth in its proxy statement for its 2013 annual meeting
of shareholders, which was filed with the SEC on March 15, 2013. These documents can be
obtained free of charge from the sources indicated above. Other information regarding the
participants in the proxy solicitation and a description of their direct and indirect interests, by security
holdings or otherwise, will be contained in the joint proxy statement and prospectus and other
relevant materials to be filed with the SEC when they become available. |