Attached files
| file | filename |
|---|---|
| 8-K - 8-K - Zep Inc. | a13-18604_18k.htm |
| EX-99.1 - EX-99.1 - Zep Inc. | a13-18604_1ex99d1.htm |
Exhibit 99.2
|
|
Zep Inc. Jefferies 2013 Global Industrials Conference August 14, 2013 John Morgan – Chairman, President & CEO Mark Bachmann - CFO Don De Laria – VP Investor Relations & Communications |
|
|
Safe Harbor This release contains, and other written or oral statements made by or on behalf of Zep may include, forward-looking statements, within the meaning of the Private Securities Litigation Reform Act of 1995. In addition, our executive officers may from time to time make forward-looking statements in reports and other documents that are filed with the SEC or in connection with oral statements made to the press, potential investors or others. Forward-looking statements generally are statements preceded by, followed by, or that include the words “expects,” “believes,” “intends,” “will,” “anticipates,” and similar terms that relate to future events, performance, or our results. Specifically, the forward-looking statements in this investor presentation include, but are not limited to, statements related to our intention to consolidate certain facilities this year and to reduce our non-sales work force; statements regarding our expectations about the amount of, and timing for realizing, cost savings from our complexity-reduction activities; statements regarding our expectations about the accounting treatment of the cost savings; statements regarding the amount of and timing for recognizing the costs associated with our complexity-reduction activities; statements regarding our expectations for fiscal 2013 revenue and the reasons for such expectations; statements regarding the impact of the contribution of Zep Vehicle Care to our fiscal 2013 revenue; statements regarding year-over-year comparisons with respect to our sales and service business; statements regarding our expectations about the impact of our complexity-reduction measures on retention of certain customers; statements regarding our revenue expectations from our sales pipeline; statements regarding our expected interest expense in fiscal 2013; and statements regarding our expectation that we will reduce our indebtedness and improve our leverage ratio. Our forward-looking statements are subject to certain risks and uncertainties that could cause actual results, expectations, or outcomes to differ materially from our historical experience as well as our expectations. The risks and uncertainties include, but are not limited to: economic conditions in general; customer and supplier relationships and prices; competition; our ability to realize anticipated benefits from complexity-reduction initiatives and the timing of the benefits of such actions; the demand for our products; and litigation and other contingent liabilities, such as environmental matters. A variety of other risks and uncertainties could cause our actual results to differ materially from the anticipated results or other expectations expressed in our forward-looking statements. A number of those risks are discussed in Part I, “Item 1A. Risk Factors” of our Annual Report on Form 10-K for the fiscal year ended August 31, 2012. We believe these forward-looking statements are reasonable; however, undue reliance should not be placed on any forward-looking statements, which are based on current expectations. Further, forward-looking statements speak only as of the date they are made, and we undertake no obligation to update publicly any of them in light of new information or future events. 2 © 2013 Zep Inc. - All rights reserved. |
|
|
Zep Inc. Market Alignment 3 © 2013 Zep Inc. - All rights reserved. Total Market $75B $18B Target Strategic Markets Transportation Auto Aftermarket Vehicle Wash Industrial / MRO Food Processing Oil & Gas Jan / San Government Europe China Value Proposition Zep Inc. sells a wide-variety of highly-effective, consumable packaged chemicals utilizing a channel-agnostic approach, that help our customers maintain, clean & protect their assets, facilities and environment. Transportation, Industrial/MRO & Food Processing = 61% of Revenue |
|
|
Zep’s Product Offering Jan San Transportation Maintenance © 2013 Zep Inc. - All rights reserved. Air care, Cleaners, Hand Cleaners, Degreasers, Floor Care, Carpet Care, Disinfectants, Sanitizers, Laundry, Dispensing Systems, and more Exterior/interior Cleaning, Vehicle Maintenance, Protectants & Polishes, Parts Cleaners, Degreasers, Lubricants, Automatic Fleet Wash Equipment and Pressure Washers, and more Lubricants, Penetrants, Greases, Parts Washers, Food Processing Cleaners/Sanitizers, Metal Working, Adhesives, Drain Care, Pesticides/Herbicides, Dispensing Systems, and more 4 Competitive Advantage to Serve the Market |
|
|
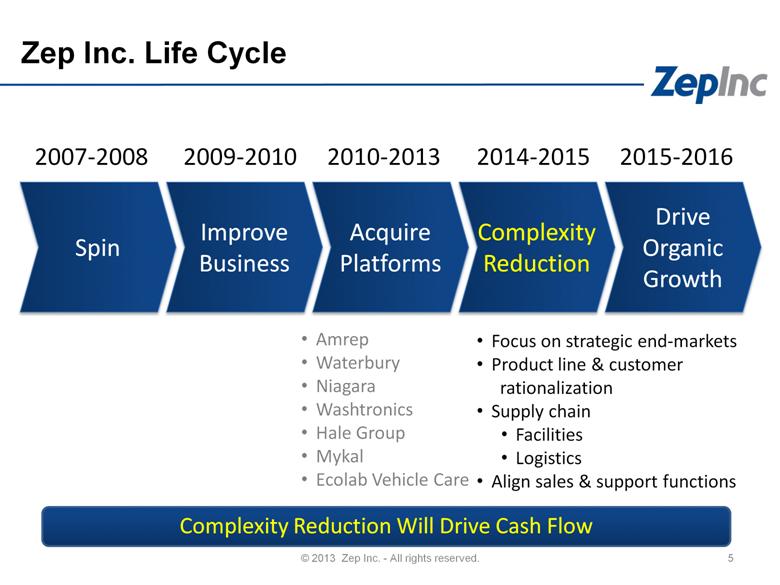
Zep Inc. Life Cycle 5 © 2013 Zep Inc. - All rights reserved. Complexity Reduction Will Drive Cash Flow 2007-2008 2009-2010 2010-2013 2014-2015 2015-2016 Amrep Waterbury Niagara Washtronics Hale Group Mykal Ecolab Vehicle Care Focus on strategic end-markets Product line & customer rationalization Supply chain Facilities Logistics Align sales & support functions Spin Improve Business Acquire Platforms Complexity Reduction Drive Organic Growth |
|
|
Complexity Reduction Activities What? Eliminated 80-100 positions No reductions in commissioned sales positions Consolidating supply chain footprint Examining logistics opportunities Approximately 80% of cost-reduction activity will impact S,D & A expenses with the remaining 20% impacting gross margins How Much? Expect annualized savings to be on the high end of $8-$12M range Expect restructuring charges to be near midpoint of $4-$7M range When? Majority of charge in Q4 F’13 (balance in Q1, Q2 & Q3 of F’14) Approx. 70% of savings in by end of Q1, 20% in Q2 and remainder in Q3 Expect to realize approximately $9M in savings in F‘14 6 © 2013 Zep Inc. - All rights reserved. |
|
|
Revenue Drivers for FQ4’13 and F’14 7 © 2013 Zep Inc. - All rights reserved. Plan to increase investment in revenue generation. Zep Vehicle Care will positively impact revenue through 1st fiscal quarter of 2014. Direct business has stabilized post-SAP but at new, lower level. Comparisons improve beginning in fiscal second quarter of 2014. Product line and customer rationalization strategies could put pressure on the retention of certain, larger customers. Robust sales pipeline was not included for purposes of sizing the cost-reduction activities but is expected to contribute to fiscal 2014 results. |
|
|
Revenue Expectations for FQ4’13 and F’14 Quarterly Revenue Expectations: Expect fiscal 2013 revenue of $685-$690 million 8 © 2013 Zep Inc. - All rights reserved. FQ4’13: 1-3% Growth Flat FQ1’14: 1-3% Growth Flat FQ2’14: 0-3% Decline 5% Decline FQ3’14: 0-3% Decline 5% Decline FQ4’14: Returning to Growth Returning to Growth Current* Previous* Confident in Ability to Drive Cost Reduction & Long-Term Strategy * Represents year-over-year comparisons. |
|
|
Updated Long-Term Financial Objectives 1. $1 billion in revenue within 5 years 2. Target of 50 bps annualized EBITDA margin improvement 3. 11-13% annualized EPS improvement 4. Return on Invested Capital (ROIC) in excess of cost of capital 9 © 2013 Zep Inc. - All rights reserved. |
|
|
10 Growing Sales, Profitably © 2013 Zep Inc. - All rights reserved. ($ Millions) Strong Revenue Growth 9.3% CAGR EBITDA Growth 31% CAGR EBITDA Margin 117 bps per year EBITDA Margin: 4.7% 6.0% 7.3% 8.2% 8.2% Effect of acquisitions* Effect of acquisitions* ($ Millions) We estimate acquisitions since 2009 will account for approximately 1/3 revenues and 1/2 of EBITDA for fiscal 2013 * Revenue and EBITDA excluding the effect of acquisitions based on company estimates. |
|
|
Growing EPS and ROIC 11 © 2013 Zep Inc. - All rights reserved. Fully diluted Earnings per Share, as reported Return on Invested Capital (ROIC) is calculated as after tax operating profit divided by Invested Capital. EPS Growth 33% CAGR ROIC Improved 80 bps |
|
|
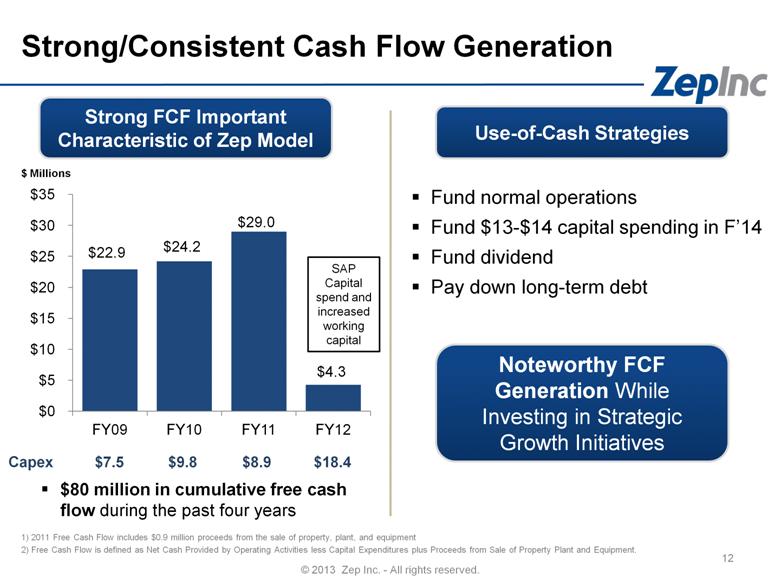
Strong/Consistent Cash Flow Generation 1) 2011 Free Cash Flow includes $0.9 million proceeds from the sale of property, plant, and equipment 2) Free Cash Flow is defined as Net Cash Provided by Operating Activities less Capital Expenditures plus Proceeds from Sale of Property Plant and Equipment. 12 © 2013 Zep Inc. - All rights reserved. $ Millions $80 million in cumulative free cash flow during the past four years Strong FCF Important Characteristic of Zep Model Capex $7.5 $9.8 $8.9 Fund normal operations Fund $13-$14 capital spending in F’14 Fund dividend Pay down long-term debt Use-of-Cash Strategies Noteworthy FCF Generation While Investing in Strategic Growth Initiatives $18.4 SAP Capital spend and increased working capital |
|
|
Fixed Charge Coverage Ratio* Debt to EBITDA* Net Debt Position ($mm) Covenants Debt Position 13 © 2013 Zep Inc. - All rights reserved. Net debt decreased $23.6 million in Q3 ‘13 Expect fiscal 2013 net interest expense to be approximately $9 million * As defined by Zep Inc.’s Credit Facility |
|
|
Zep is a Solid Investment Differentiated strategy caters to “Right to Win” in our markets Focus on key end markets Developed capabilities to serve customers in all channels Driving economies of scale in purchasing and supply chain Creating platforms for organic growth Produces consistent cash flow 14 © 2013 Zep Inc. - All rights reserved. Considerable Upside Growth Opportunities |
|
|
Appendix |

|
|
Average Daily Sales Illustration Pre/Post SAP 16 © 2013 Zep Inc. - All rights reserved. Sales were stabilizing within a controlled band prior to SAP. Sales re-stabilized post SAP, but within a new, lower control band. SAP Go-Live Average Daily Sales ($) Pre-Sap Post Sap |
|
|
EBITDA Reconciliation © 2013 Zep Inc. - All rights reserved. 17 Annual (Years Ended August 31)20082009201020112012 Net income$16.3$9.3$13.5$17.4$21.5 Interest expense2.81.72.06.65.5 Provisions for income taxes9.75.98.29.311.9 Depreciation & amortization6.97.010.314.214.3 EBITDA (unaudited)$35.7$23.8$33.9$47.5$53.7 Quarterly (unaudited) Q1 Q2 Q3 Q4 Q1 Q2 Q3 Q4 Q1 Q2 Q3 Net income 4.9 $ 2.2 $ 6.2 $ 4.1 $ 3.6 $ 2.4 $ 8.6 $ 7.3 $ 3.5 $ 2.8 $ 6.3 $ Interest expense 1.9 1.6 1.6 1.5 1.4 1.4 1.4 1.3 1.2 2.3 3.0 Provisions for income taxes 3.6 3.5 3.7 3.5 3.5 3.5 3.6 3.7 2.0 1.3 3.4 Depreciation & amortization 2.9 1.0 3.7 1.7 2.0 1.5 5.1 3.3 3.6 5.5 5.4 EBITDA 13.3 8.3 15.2 10.8 10.5 8.8 18.7 15.6 10.4 11.8 18.0 2011 2012 2013 |
|
|
Zep Inc. Non-GAAP Disclosure © 2013 Zep Inc. - All rights reserved. 18 This presentation includes the following supplemental non-GAAP financial measures: EBITDA. GAAP means generally accepted accounting principles in the United States. This presentation contains reconciliations of this non-GAAP financial measures to the most directly comparable GAAP financial measure. EBITDA is equal to net income plus (a) interest expense, net; (b) provision for income taxes; and (c) depreciation and amortization. We believe non-GAAP financial measures to be an important indicator of our operating strength and the performance of our business because they provide a link between profitability and operating cash flow, and enhance period-to-period comparability of our operations and financial performance. We believe these measures exclude or adjust certain items affecting reported operating results that were unusual and/or not comparable to the Company’s historic core operating results, and additionally adjust reported operating results for certain non-cash items. We also believe that analysts and investors use EBITDA as supplemental measure to evaluate the overall operating performance of companies in our industry. Our management uses EBITDA and other non-GAAP financial information: as measurements of operating performance because they assist us in comparing our operating performance on a consistent basis as they remove the impact of certain non-cash items as well as items not directly resulting from our core operations; to evaluate the effectiveness of our operational strategies; and to evaluate our capacity to fund capital expenditures and expand our business. EBITDA and the ratios derived from these measures as calculated by us are not necessarily comparable to similarly titled measures used by other companies. In addition, these measures: (a) do not represent net income or cash flows from operating activities as defined by GAAP; (b) are not necessarily indicative of cash available to fund our cash flow needs; and (c) should not be considered in isolation of, as alternatives to, or more meaningful measures than operating profit, net income, cash provided by operating activities, or our other financial information as determined under GAAP. |