Attached files
| file | filename |
|---|---|
| 8-K - 8-K - POWERSECURE INTERNATIONAL, INC. | d581715d8k.htm |
| EX-99.1 - EX-99.1 - POWERSECURE INTERNATIONAL, INC. | d581715dex991.htm |
Exhibit 99.2

| Canaccord Genuity 33rd Annual Growth Conference August 14, 2013 Chris Hutter, Chief Financial Officer |
| Forward Looking Statements Safe Harbor All forward-looking statements made in this presentation are made under the safe harbor provisions of the Private Securities Litigation Reform Act of 1995. Forward-looking statements, which are all statements other than statements of historical facts and include beliefs, opinions, estimates, and projections about future business developments and opportunities and financial guidance, are not guarantees of future performance or events but are subject to risks, uncertainties and other factors that could cause actual results to differ materially from those expressed, projected or implied, including risks and uncertainties set forth in the Company's SEC filings, including but not limited to the Company's most recent Form 10-K and subsequent filings on Form 8-K and 10-Q. Any forward-looking statements in this presentation speak only as of the date hereof, and the Company assumes no duty or obligation to update or revise any forward-looking statements. |
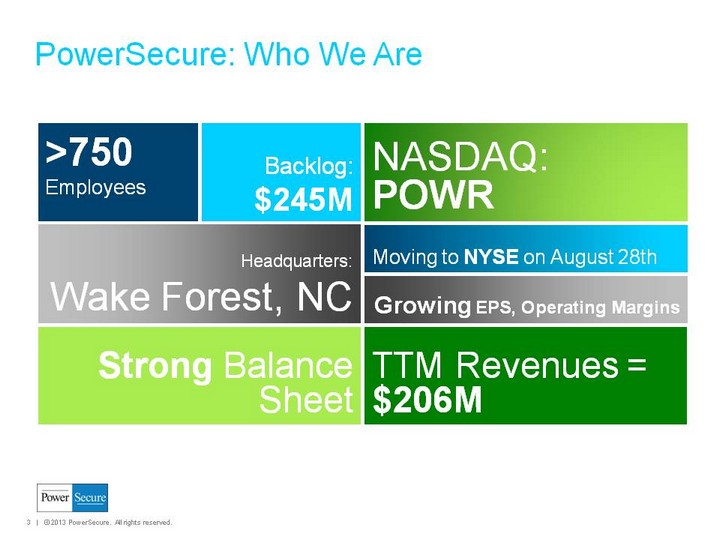
| TTM Revenues = $206M PowerSecure: Who We Are Backlog: $245M NASDAQ: POWR >750 Employees Growing EPS, Operating Margins Strong Balance Sheet Moving to NYSE on August 28th Headquarters: Wake Forest, NC |
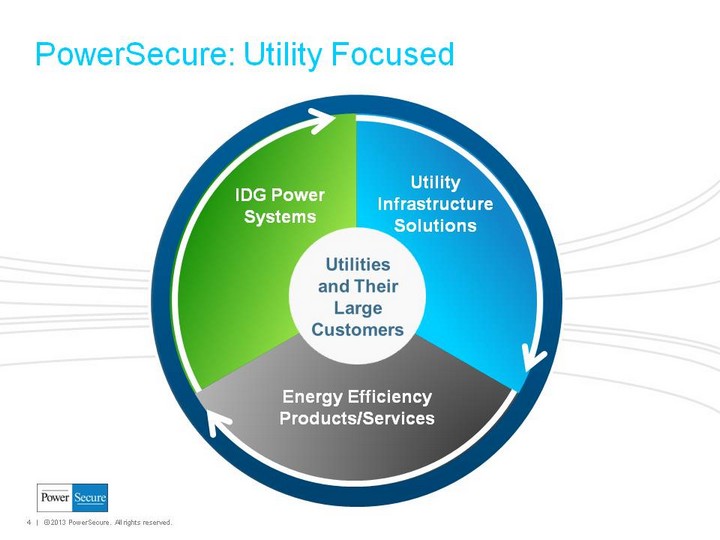
| (CHART) PowerSecure: Utility Focused Energy Efficiency Products/Services Utility Infrastructure Solutions Utilities and Their Large Customers IDG Power Systems |
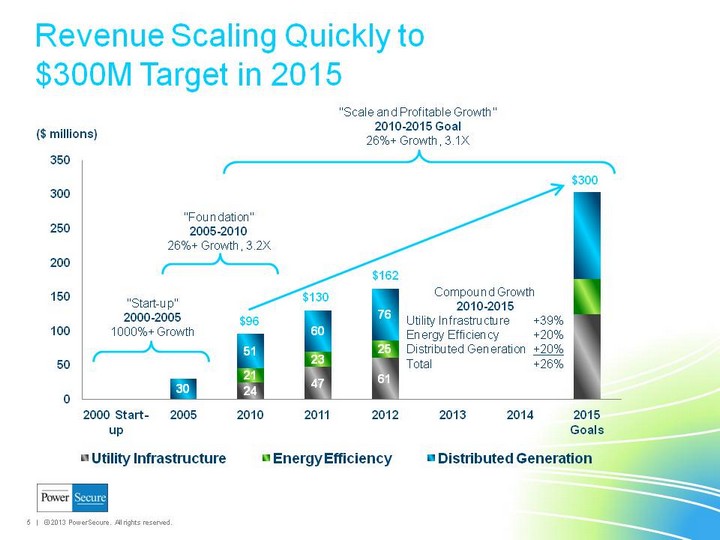
| Revenue Scaling Quickly to $300M Target in 2015 (CHART) |
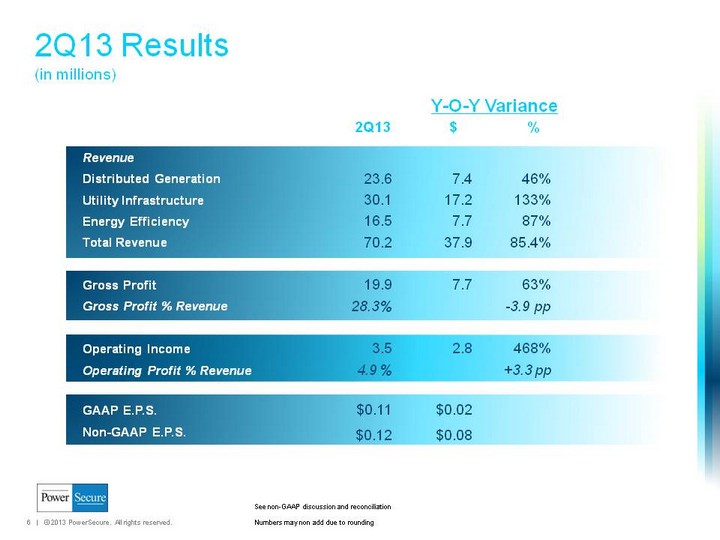
| 2Q13 Results (in millions) 2Q13 $ % Revenue Distributed Generation 23.6 7.4 46% Utility Infrastructure 30.1 17.2 133% Energy Efficiency 16.5 7.7 87% Total Revenue 70.2 37.9 85.4% Gross Profit 19.9 7.7 63% Gross Profit % Revenue 28.3% -3.9 pp Operating Income 3.5 2.8 468% Operating Profit % Revenue 4.9 % +3.3 pp GAAP E.P.S. $0.11 $0.02 Non-GAAP E.P.S. $0.12 $0.08 Numbers may non add due to rounding Y-O-Y Variance See non-GAAP discussion and reconciliation |
| Operating margins increasing Increasing scale across all business lines 2012 cost reduction program further leverages OpEx Major investment to build UI business from scratch in '07 now completed Expect decreasing OpEx as % of revenue 2013 EBITDA target: >$20M Meaningful Bottom Line Leverage See non-GAAP discussion and reconciliation |
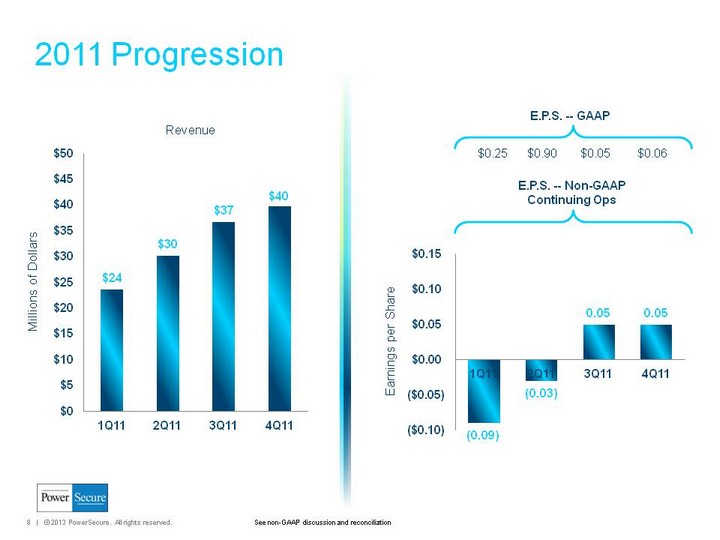
| 2011 Progression (CHART) Revenue Millions of Dollars (CHART) E.P.S. -- Non-GAAP Continuing Ops E.P.S. -- GAAP $0.25 $0.90 $0.05 $0.06 Earnings per Share See non-GAAP discussion and reconciliation |
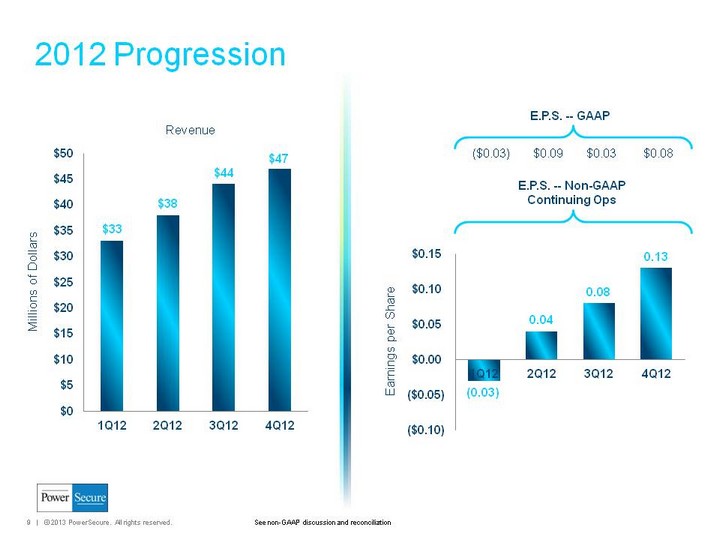
| (CHART) Revenue Millions of Dollars 2012 Progression (CHART) E.P.S. -- Non-GAAP Continuing Ops E.P.S. -- GAAP ($0.03) $0.09 $0.03 $0.08 Earnings per Share See non-GAAP discussion and reconciliation |
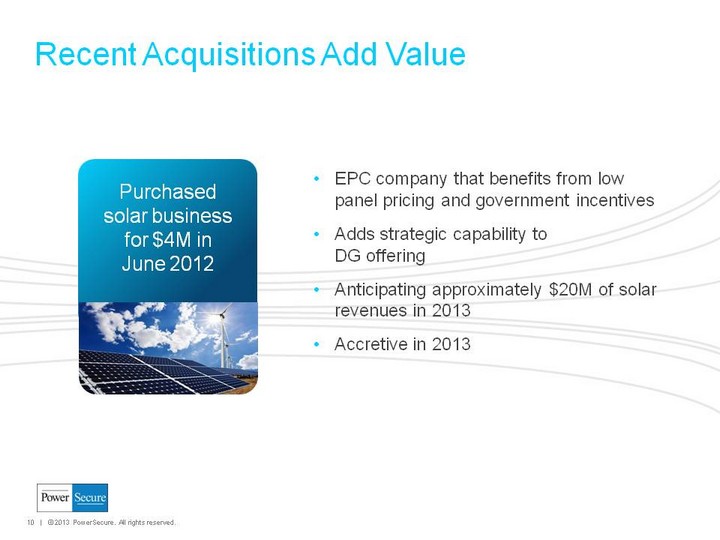
| EPC company that benefits from low panel pricing and government incentives Adds strategic capability to DG offering Anticipating approximately $20M of solar revenues in 2013 Accretive in 2013 Recent Acquisitions Add Value Purchased solar business for $4M in June 2012 |
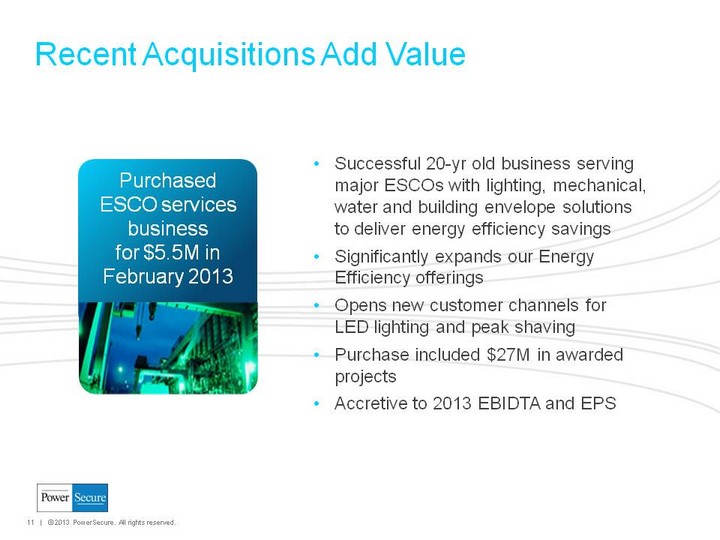
| Recent Acquisitions Add Value Successful 20-yr old business serving major ESCOs with lighting, mechanical, water and building envelope solutions to deliver energy efficiency savings Significantly expands our Energy Efficiency offerings Opens new customer channels for LED lighting and peak shaving Purchase included $27M in awarded projects Accretive to 2013 EBIDTA and EPS Purchased ESCO services business for $5.5M in February 2013 |

| Recent Acquisitions Add Value Solais has significant sourcing and manufacturing expertise Will add substantial efficiencies to manufacturing of PowerSecure's existing LED solutions Outstanding proprietary portfolio of LED lamps and fixtures for commercial and Industrial applications Superior light output, thermal management, optics, light quality and aesthetics Slightly accretive to EPS in 2013, + $0.10 in 2014 Purchased Solais lighting business for $15 M in April 2013 |
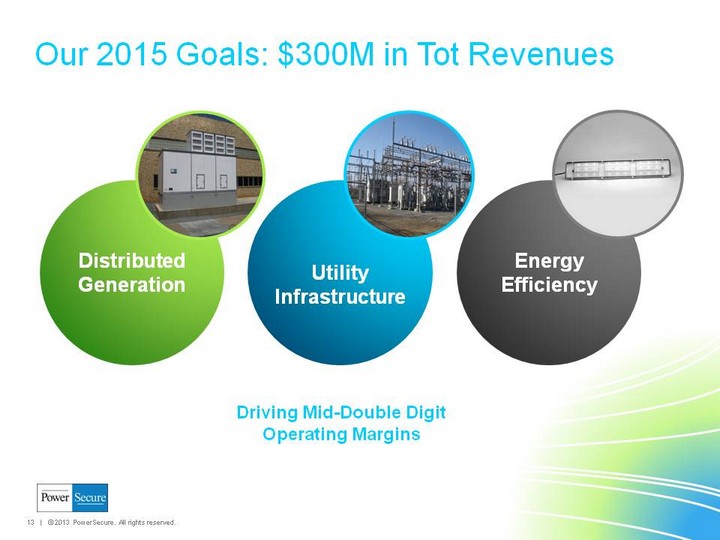
| Our 2015 Goals: $300M in Tot Revenues Distributed Generation Utility Infrastructure Energy Efficiency Driving Mid-Double Digit Operating Margins |
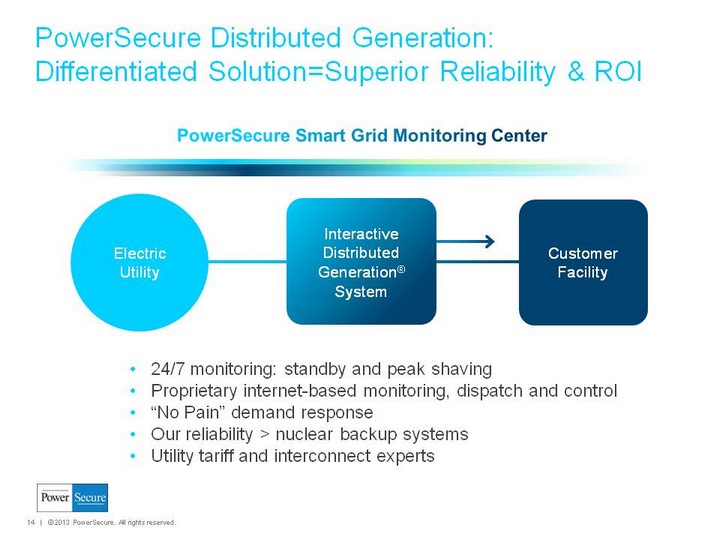
| PowerSecure Distributed Generation: Differentiated Solution=Superior Reliability & ROI Electric Utility Customer Facility 24/7 monitoring: standby and peak shaving Proprietary internet-based monitoring, dispatch and control "No Pain" demand response Our reliability > nuclear backup systems Utility tariff and interconnect experts PowerSecure Smart Grid Monitoring Center Interactive Distributed Generation(r) System |
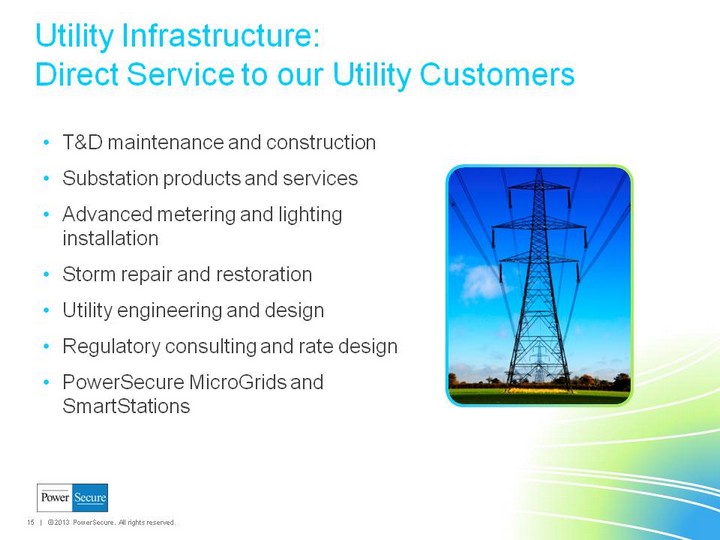
| T&D maintenance and construction Substation products and services Advanced metering and lighting installation Storm repair and restoration Utility engineering and design Regulatory consulting and rate design PowerSecure MicroGrids and SmartStations Utility Infrastructure: Direct Service to our Utility Customers |
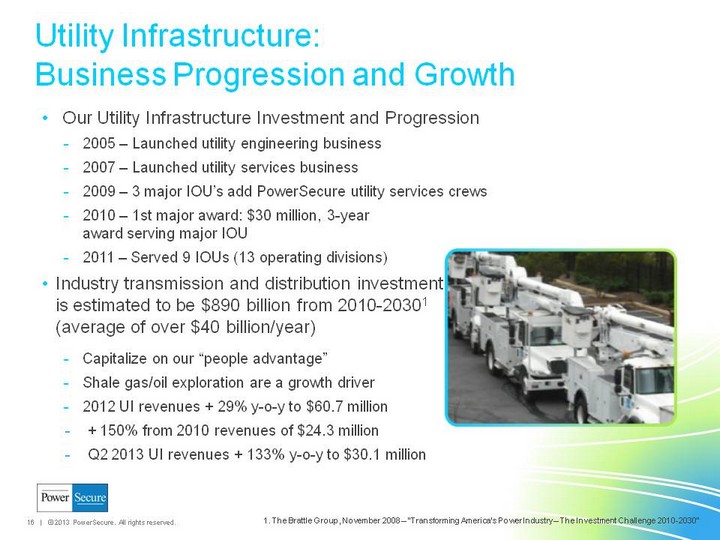
| Our Utility Infrastructure Investment and Progression 2005 - Launched utility engineering business 2007 - Launched utility services business 2009 - 3 major IOU's add PowerSecure utility services crews 2010 - 1st major award: $30 million, 3-year award serving major IOU 2011 - Served 9 IOUs (13 operating divisions) Industry transmission and distribution investment is estimated to be $890 billion from 2010-20301 (average of over $40 billion/year) Capitalize on our "people advantage" Shale gas/oil exploration are a growth driver 2012 UI revenues + 29% y-o-y to $60.7 million + 150% from 2010 revenues of $24.3 million Q2 2013 UI revenues + 133% y-o-y to $30.1 million Utility Infrastructure: Business Progression and Growth 1. The Brattle Group, November 2008 - "Transforming America's Power Industry - The Investment Challenge 2010-2030" |
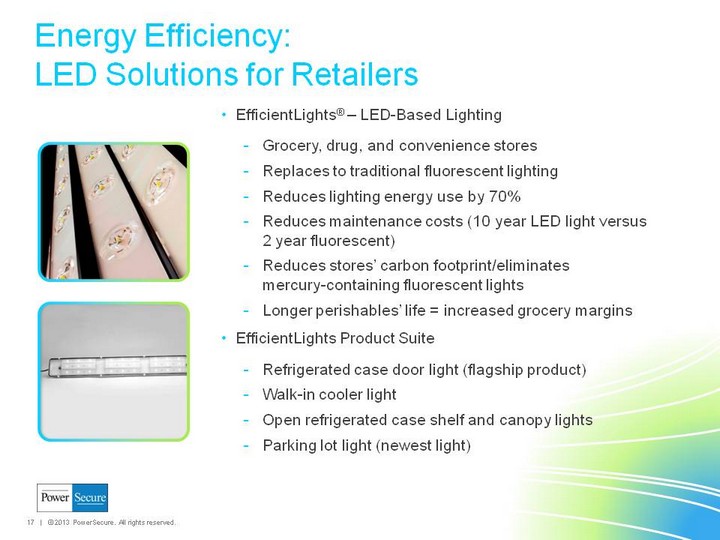
| EfficientLights(r) - LED-Based Lighting Grocery, drug, and convenience stores Replaces to traditional fluorescent lighting Reduces lighting energy use by 70% Reduces maintenance costs (10 year LED light versus 2 year fluorescent) Reduces stores' carbon footprint/eliminates mercury-containing fluorescent lights Longer perishables' life = increased grocery margins EfficientLights Product Suite Refrigerated case door light (flagship product) Walk-in cooler light Open refrigerated case shelf and canopy lights Parking lot light (newest light) Energy Efficiency: LED Solutions for Retailers |
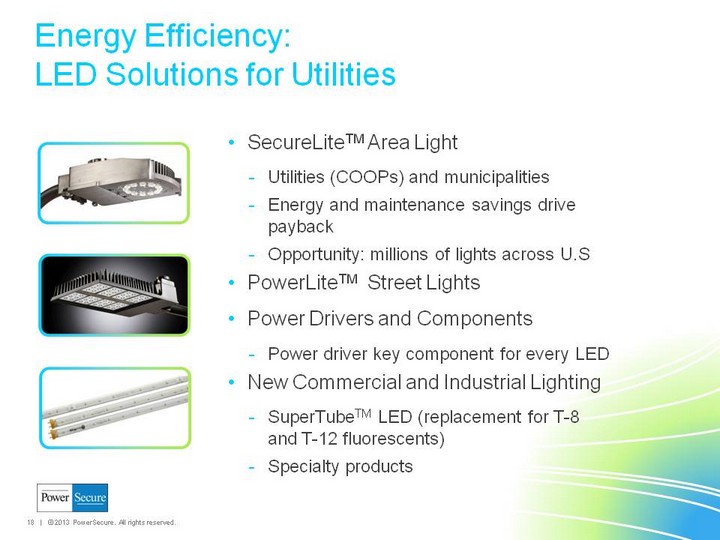
| SecureLiteTM Area Light Utilities (COOPs) and municipalities Energy and maintenance savings drive payback Opportunity: millions of lights across U.S PowerLiteTM Street Lights Power Drivers and Components Power driver key component for every LED New Commercial and Industrial Lighting SuperTubeTM LED (replacement for T-8 and T-12 fluorescents) Specialty products Energy Efficiency: LED Solutions for Utilities |
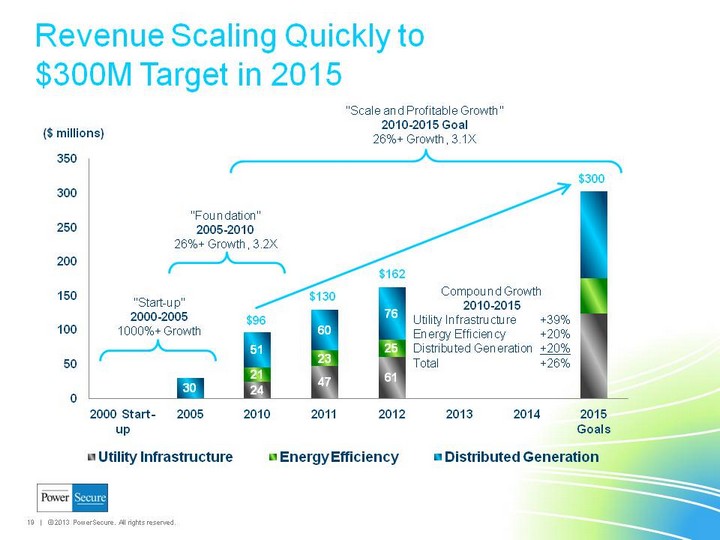
| Revenue Scaling Quickly to $300M Target in 2015 (CHART) |

| Thank you |
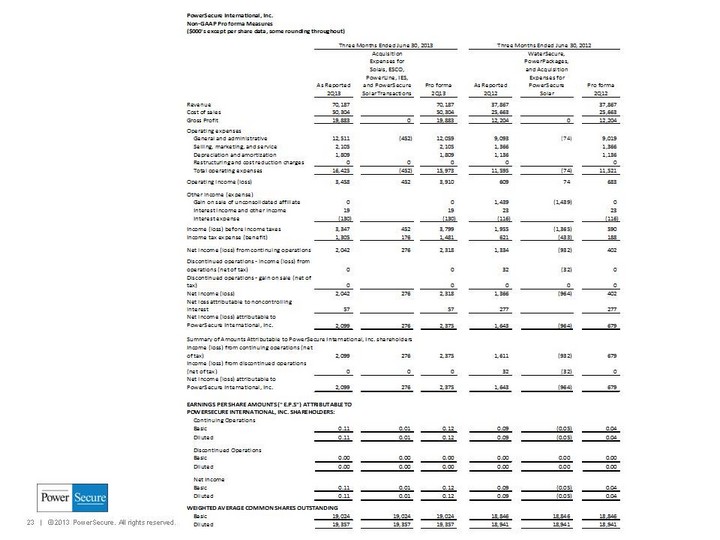
| Our references to our second quarter 2012 and 2013 "Non-GAAP Pro forma" financial measures of net income from continuing operations, net income, net income attributable to PowerSecure International, Inc., diluted E.P.S. from continuing operations, diluted E.P.S. from discontinued operations and diluted E.P.S. discussed and shown in this report constitute non-GAAP financial measures. They refer to our GAAP results, adjusted to show the results 1) without the 2Q 2012 gain on the sale of our WaterSecure investment (identified in our financial statements as our unconsolidated affiliate), 2) without the Q2 2012 results of our discontinued PowerPackages business, 3) without the Q2 2012 acquisition expenses related to PowerSecure Solar and 4) without the Q2 2013 acquisition expenses primarily related to Solais (and to a lesser extent our ESCO, PowerLine, IES, and PowerSecure Solar transactions). We believe providing non-GAAP measures which show our pro forma results with these items adjusted is valuable and useful as it allows our management and our board of directors to measure, monitor and evaluate our operating performance with the same consistent financial context. These non-GAAP pro forma measures also correspond with the way we expect Wall Street analysts to compare our results. Our non-GAAP pro forma measures should be considered only as supplements to, and not as substitutes for or in isolation from, our other measures of financial information prepared in accordance with GAAP, such as GAAP revenue, operating income, net income from continuing operations, net income, net income attributable to PowerSecure International, Inc., diluted E.P.S. from continuing operations, diluted E.P.S. from discontinued operations, and diluted E.P.S. Non-GAAP Financial Measures |
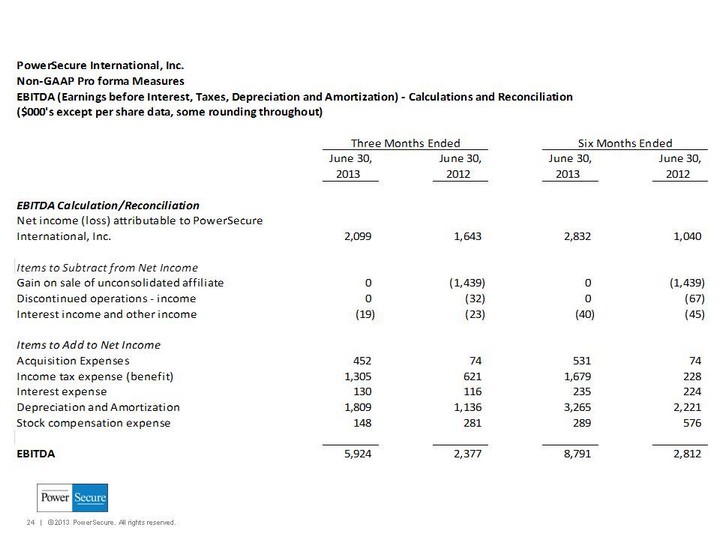
| Non-GAAP Financial Measures References to our second quarter and year-to-date 2012 and 2013 EBITDA, which we define as our earnings before interest, taxes, depreciation and amortization, as discussed and shown in this release, constitutes a non-GAAP "pro forma" financial measure. We believe that EBITDA, as a non-GAAP pro forma financial measure, provides meaningful information to investors in terms of enhancing their understanding of our operating performance and results, as it allows investors to more easily compare our financial performance on a consistent basis compared to the prior year periods. This non-GAAP financial measure also corresponds with the way we expect investment analysts to evaluate and compare our results. Any non-GAAP pro forma financial measures should be considered only as supplements to, and not as substitutes for or in isolation from, or superior to, our other measures of financial information prepared in accordance with GAAP, such as net income attributable to PowerSecure International, Inc. We define and calculate EBITDA as net income attributable to PowerSecure International, Inc., minus: 1) the gain on the sale of our unconsolidated affiliate, 2) discontinued operations and 3) interest income and other income, plus: 4) acquisition expenses, 5) income tax expense (or minus an income tax benefit), 6) interest expense, 7) depreciation and amortization and 8) stock compensation expense. We disclose EBITDA because we believe it is a useful metric by which to compare the performance of our business from period to period. We understand that measures similar to EBITDA are broadly used by analysts, rating agencies, investors and financial institutions in assessing our performance. Accordingly, we believe that the presentation of EBITDA provides useful information to investors. The table below provides a reconciliation of EBITDA to net income attributable to PowerSecure International, Inc., the most directly comparable GAAP financial measure. |
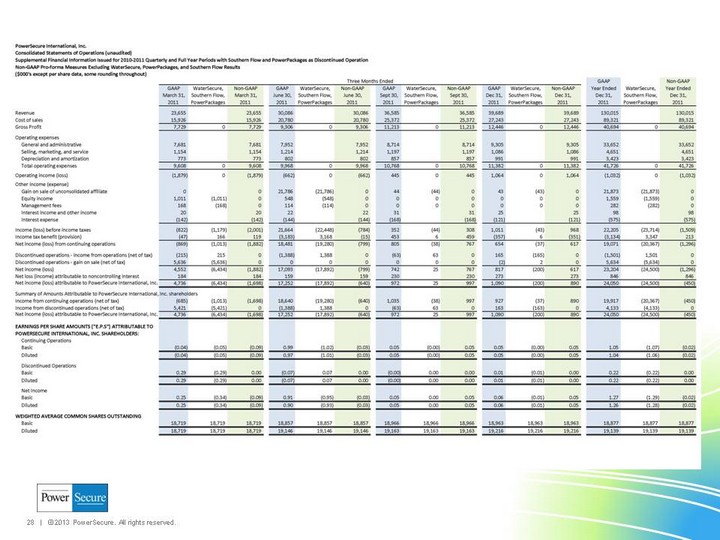
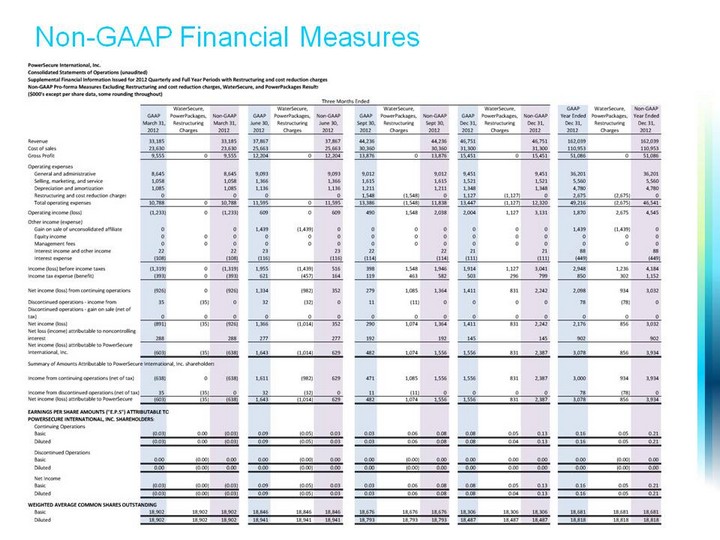
| Our references to our quarterly and full year 2012, and quarterly and full year 2011 "Non-GAAP Pro forma" financial measures of operating expenses, operating expenses as a percentage of revenue, operating income, operating income as a percentage of revenue, net income from continuing operations, net income, net income attributable to PowerSecure International, Inc., diluted E.P.S. from continuing operations, and diluted E.P.S. discussed and shown in this report constitute non- GAAP financial measures. For our quarterly and full year 2012 results, they refer to our GAAP results, adjusted to show them 1) excluding charges related to our restructuring and cost reduction initiative, 2) gains related to the 2011 sale of our WaterSecure operations, and 3) results of our discontinued PowerPackages business exited in 2011. For our fourth quarterly and full year 2011 results, they refer to our GAAP results, adjusted to show them 1) excluding gains and income related to our WaterSecure operations, 2) the results of our discontinued PowerPackages business, and 3) gains and income related to our discontinued Southern Flow business sold in 2011. We believe providing non-GAAP measures which show our pro forma results with these items adjusted is valuable and useful as it allows our management and our board of directors to measure, monitor and evaluate our operating performance in 2011, 2012, and in future periods with the same consistent financial context as the business was managed in those periods. Additionally, because these items were non-recurring, our non-GAAP pro forma measures are more comparable to our prior period and future period results. Non-GAAP Financial Measures |
| Non-GAAP Financial Measures We believe providing non-GAAP measures which show our pro forma results with these items adjusted is valuable and useful as it allows our management and our board of directors to measure, monitor and evaluate our operating performance in 2011, 2012, and in future periods with the same consistent financial context as the business was managed in those periods. Additionally, because these items were non-recurring, our non-GAAP pro forma measures are more comparable to our prior period and future period results. We believe these Non-GAAP Pro forma measures also provide meaningful information to investors in terms of enhancing their understanding of our fourth quarter and full year 2012, and fourth quarter and full year 2011 operating performance and results, as they allow investors to more easily compare our financial performance on a consistent basis compared to the prior year periods. These Non-GAAP Pro forma measures also correspond with the way we expect investment analysts to evaluate and compare our results. Our Non-GAAP Pro forma measures should be considered only as supplements to, and not as substitutes for or in isolation from, or superior to, our other measures of financial information prepared in accordance with GAAP, such as GAAP revenue, operating expenses, operating expenses as a percentage of revenue, operating income, operating income as a percentage of revenue, net income from continuing operations, net income, net income attributable to PowerSecure International, Inc., diluted E.P.S. from continuing operations, diluted E.P.S. from discontinued operations, and diluted E.P.S. The following table provides a reconciliation of these non-GAAP financial measures to the most directly comparable GAAP financial measures. |
| Non-GAAP Financial Measures |