Attached files
| file | filename |
|---|---|
| 8-K - FORM 8-K - LOCAL Corp | d584603d8k.htm |
| EX-99.1 - EX-99.1 - LOCAL Corp | d584603dex991.htm |
 CORPORATE OVERVIEW | 3Q2013
1
…………………………..…………………………………….
Local Corporation
We connect local businesses with online consumers
Corporate Overview: 3Q2013
Exhibit 99.2
CORPORATE OVERVIEW | 3Q2013
1 |
 CORPORATE OVERVIEW | 3Q2013
2
………………..…………………………………….
Forward looking statements
Certain matters being discussed by Local Corporation’s management today
include forward looking statements which are made pursuant to the Safe
Harbor provisions of section 21-E of the Securities Exchange Act of 1934.
Investors are cautioned that statements which are not strictly historical
statements, including statements concerning future expected financial
performance, management objectives and plans for future operations, our
relationships with strategic or other partners, the release of new products or
services or enhancements to existing products or services, our expectations
regarding potential acquisitions and the future performance of past
acquisitions including our ability to realize expected synergies, trends in
the market for our current or planned products or services, and market
acceptance of our products or services, constitute forward looking
statements. The forward looking statements include, but are not limited to,
any statements containing the words “expect”,
“anticipate”, “estimates”, “believes”, “should”,
“could”, “may”, “possibly”, and similar expressions
and the negatives thereof. These forward looking statements involve a number
of risks and uncertainties that could cause actual results to differ
materially from the forward looking statements. Those risks and
uncertainties are detailed in the company’s filings from time to time
with the Securities and Exchange Commission. The information contained in
the forward looking statements is provided as of the date of such oral
statements and the company disclaims any obligation to update such
statements. Adjusted EBITDA is defined as net income (loss) excluding:
provision for income taxes; interest and other income (expense), net;
depreciation; amortization; stock-based compensation charges; gain or
loss on derivatives’ revaluation; net income (loss) from discontinued
operations; impairment charges; LEC receivables reserve; finance-related
charges; accrued lease liability/asset; and severance charges.
Adjusted EBITDA, as defined above, is not a measurement under GAAP.
Adjusted EBITDA is reconciled to net loss and loss per share, which we
believe are the most comparable GAAP measures, at the end of this
presentation. Management believes that Adjusted EBITDA provides useful
information to investors about the company’s performance because it
eliminates the effects of period-to-period changes in income from interest
on the company’s cash and marketable securities, expense from the
company’s financing transactions and the costs associated with income
tax expense, capital investments, stock-based compensation expense,
warrant revaluation charges, and non-recurring charges which are not
directly attributable to the underlying performance of the company’s
business operations. Management uses Adjusted EBITDA in evaluating the
overall performance of the company’s business operations.
A limitation of non-GAAP Adjusted EBITDA is that it excludes items that often
have a material effect on the company’s net income and earnings per
common share calculated in accordance with GAAP. Therefore, management
compensates for this limitation by using Adjusted EBITDA in conjunction
with GAAP net loss and loss per share measures. The company believes that
Adjusted EBITDA provides investors with an additional tool for evaluating
the company’s core performance, which management uses in its own
evaluation of overall performance, and as a base-line for assessing the
future earnings potential of the company. While the GAAP results are more
complete, the company prefers to allow investors to have this supplemental
metric since, with reconciliation to GAAP (as noted above), it may provide
greater insight into the company’s financial results. The non-GAAP
measures should be viewed as a supplement to, and not as a substitute for,
or superior to, GAAP net income or earnings per share.
|
 CORPORATE OVERVIEW | 3Q2013
3
………………………………………………..
Local Corporation Overview
REVENUE IN MILLIONS
Founded/IPO
Ticker
Reach
Flagship Site
Network
Patents
Headquarters
Employees
1999/2004
LOCM (NASDAQ)
~1 million consumers/day
Local.com –
Top 100 US Site
Approximately 1,600 sites
12 issued + 7 pending
Irvine, CA
~90
KEY FACTS
*Midrange of guidance reported as of August 8, 2013
* |
 CORPORATE OVERVIEW | 3Q2013
4
………………………………........………………..….
Local searchers are often further along in the buying process,
so they tend to convert to buyers at a higher rate.
Higher conversion rates means businesses will often
pay
a
premium
to
advertise
to
local
searchers.
Pay-per-click rates for local versus national keyword terms…
What is ‘Local Search’?
Implicit
No location, but local
Explicit
Actual location
Local searchers are worth more!
A search for a product or service, somewhere: |
 CORPORATE OVERVIEW | 3Q2013
5
…………………………...………………………………………….
The Opportunity
Offline is going digital, and digital is going local
We have assets in all areas
Source: BIA/Kelsey, April 2013 |
 CORPORATE OVERVIEW | 3Q2013
6
……………………………………………………………….....…….……….
Our Model
We aggregate local business, product and service
content and publish it across approximately 1,600 sites.
Search engines index this content and show those sites
in their search results, driving local search traffic to us.
We monetize that traffic with various ad units from ad
partners, and we keep most of the revenue generated.
Traffic
‘Consumer Properties’
Traffic x Monetization = Revenue
|
 CORPORATE OVERVIEW | 3Q2013
7
…………………………………………………………….
Consumer Properties
Business directories powered by Local Corporation include…
A private label local business directory provided to regional
media
sites
nationwide
–
typically
local
newspapers
Network
Local.com
Our flagship
property
+
Arizona Daily Star
Boston Herald
Canton Rep
Daily
Herald
-
Utah
Daily Princetonian
Daily Tarheel
East Valley Tribune
Honolulu Star Advertiser
Journal Star
Knoxville News Sentinel
LaCrosse Tribune
Naples News
Observer-Reporter
Pittsburgh Post-Gazette
Santa Ynez Valley News
St. Louis Post-Dispatch
Star Banner
The Arizona Republic
The Commercial Appeal
The Dispatch
The Gazette
The Record Searchlight
The State Journal-Register
Treasure Coast
Triangle411
Ventura County Star
Vermont Today
Washington Post |
 CORPORATE OVERVIEW | 3Q2013
8
………………………...………………………..
Local Search is Going Mobile
And we’re ready!
•
Monetization is a big challenge in mobile, and we believe pay per call is a natural
solution. We have five pay per call patents.
First one filed in 2002
*Source: Borrell Associates 2013
•
Within 5 years, 80% of local searches will be done on a mobile device*
|
 CORPORATE OVERVIEW | 3Q2013
9
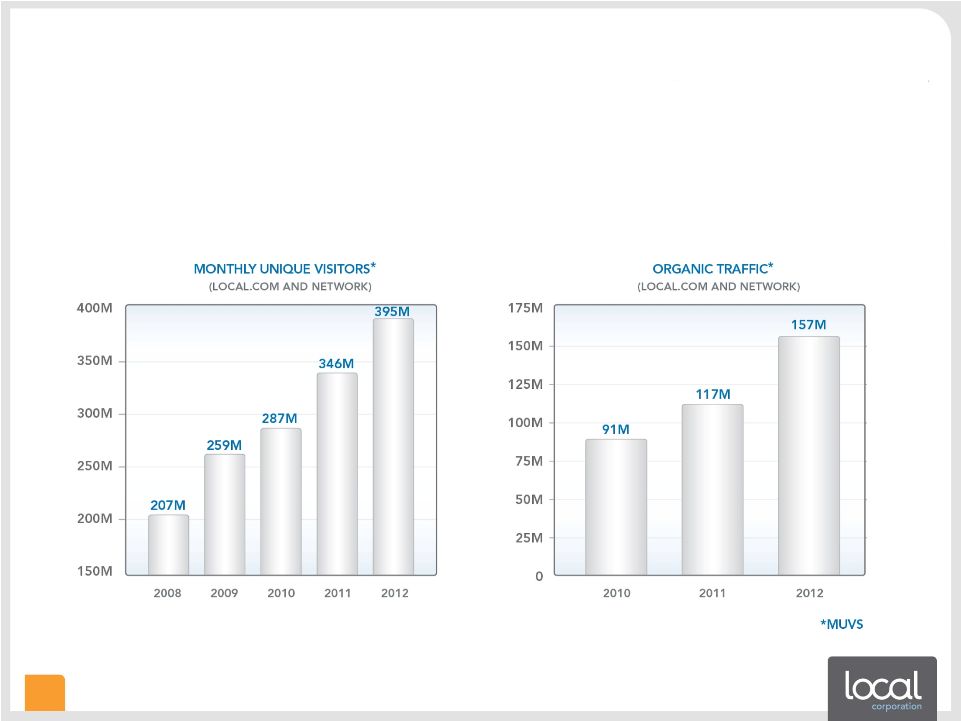
•
Multi-year traffic growth
•
Organic
traffic
is
low
cost/high
margin
–
at
record
levels
•
Mobile
traffic
at
record
levels
–
monetization
improving,
and
we
think
we
have
key
IP
………….................................……………………………….
Great Momentum |
 CORPORATE OVERVIEW | 3Q2013
10
…………………………………………...………………………..
IP & Technology
•
Proprietary platform and know-how
Real time business, product and services data integration
Large scale local/commercial content production and syndication
Very large scale CPC ad-serving and distribution
Web indexing and local search relevance
Very large scale SEO, SEM campaign expertise
Local display ad production and syndication
Web hosting and local/commercial domain name acquisition
•
12 patents issued, 7 pending
Key patents
–
Local web indexing (for indexing local web sites across the web)
–
Pay per call for local and commercial searches via a mobile device (multiple
patents) •
The
billion
dollar
industry
question:
How
do
we
monetize
mobile?
–
Dynamic
cascading
menu
search
(for
product
search
on
tablets
and
smart
phones)
–
Bulk domain registration and content management (for very large scale SEO)
|
 CORPORATE OVERVIEW | 3Q2013
11
……………………..…………...……….
Experience with Strategy Discipline
Heath Clarke
Founder, Chairman & CEO
20+ yrs exp
Founded Local in ’99
VP eCommerce LanguageForce
CEO/Founder AFP (Australia)
Ken Cragun
CFO
20+ yrs exp
CFO Modtech
SVP MIVA
CFO ImproveNet
CPA; Big 4 Exp.
Carlos Caponera
VP, Consumer Properties
Product Marketing Director,
Debtmerica LLC
Product Marketing Director,
Get Lower Inc.
Product Manager,
Experian Consumer Direct
Lori Chavez
VP, Marketing
Marketing Consultant, Westfield
Marketing, Accenture
VP, Marketing, Jones Lang LaSalle
Director, Marketing, Equity Office
Rob Luskey
VP, Business Development
Director, Business Development,
go2 Systems, Inc.
Senior Manager, Internet Products
and Services, United Yellow Pages
Owner & Publisher, Local Impact
Publishing
Eric Orrantia
VP, Sales
Director, West Coast Sales,
Advertising.com (AOL)
Director Business Development,
Mediaplex
Director, West Coast Sales, InStream
Mike Sawtell
President & COO
20+ yrs exp
Chairman & CEO, DigitalPost Interactive
Pres. & COO , Interchange Corp. (now Local
Corporation) COO & VP of Sales, Informative Research
|
 CORPORATE OVERVIEW | 3Q2013
12
..…………………………………………………..……….………….
Growth Strategy
•
Grow margins in O&O business (largest revenue stream)
Margin optimization via new SEM tools
Gradually ramping in the UK
•
Grow revenues in Network (highest gross margin revenues)
Expand number of sites via business development team (more traffic)
New products planned including world-class local shopping channel
Optimize monetization leveraging new testing platform
•
Developing opportunities
Local
display
network
–
leveraging
our
existing
Network
Microsites
(insurance,
HVAC,
alarm
systems
and
more)
–
leveraging our platform
Improved
monetization
via
lead
generation
–
monetization
improvements
Mobile –
leveraging our platform |
 CORPORATE OVERVIEW | 3Q2013
13
……………………………………..
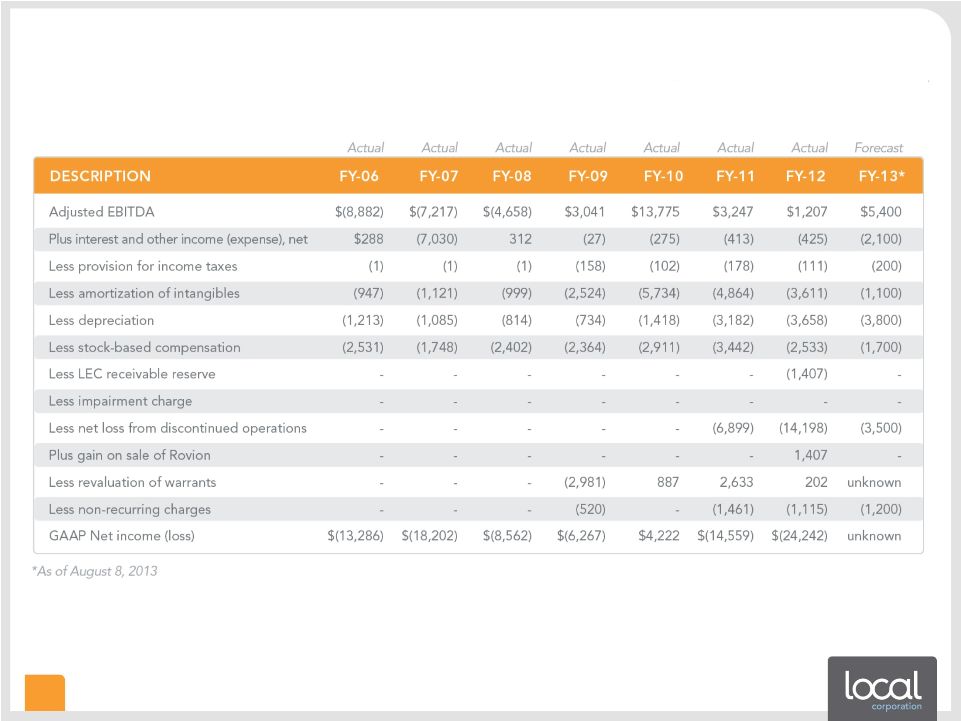
We Believe the Inflection Point is Now
Note: See reconciliation of Adjusted EBITDA to GAAP net income at presentation
end. •
Five material challenges in
24 months withstood
Significant cost to the
company in revenue and
earnings
•
Highest revenue per
employee ever
Projected growth to about
$1M per employee EOY
Running lean!
•
Returning to profit
Significant cost savings in
the first half of 2013
Positive and growing
Adjusted EBITDA 1Q13
and 2Q13
Material challenges over past 2 years
*Losses not to scale
Material challenges over past 2 years |
 CORPORATE OVERVIEW | 3Q2013
14
………………………………...……….
2Q13 Balance Sheet & Cap. Table
Additional
Data:
I.
$12 million credit facility. Interest rate approximately 5%
II.
Total authorized shares 65,000,000 common and 10,000,000 preferred
III.
In April 2013, the company closed $5 million in convertible notes. Interest rate of 7%.
Conversion price of $2.01. Included 746,000 of warrants with $2.01 exercise price. |
 CORPORATE OVERVIEW | 3Q2013
15
…………………………..…….……….
Why Invest in Local Corporation?
•
Multi-year track record of 31% CAGR
•
Management are buyers!
Senior execs have exchanged bonuses for 235,000 shares in the last 18
months! •
Proprietary platform and great IP
•
Many growth opportunities in a rapidly changing space
•
Returning
to
profitability
–
we
believe
the
inflection
point
is
NOW |
 CORPORATE OVERVIEW | 3Q2013
16
Thank You
Heath Clarke
Founder, Chairman & Chief Executive Officer
hclarke@local.com
Ken Cragun
Chief Financial Officer
kcragun@local.com
949.784.0800
http://www.localcorporation.com |
 CORPORATE OVERVIEW | 3Q2013
17
………………………………………………………
Digital Media Landscape
*Partners |
 CORPORATE OVERVIEW | 3Q2013
18
………….….
Reconciliation: Adjusted EBITDA to GAAP Net Income |
 CORPORATE OVERVIEW | 3Q2013
19
………………………………………………………………………………….….….
Video
Watch
our
video
to learn more about what we do |