Attached files
| file | filename |
|---|---|
| 8-K - 8-K - DEERE & CO | a13-18425_18k.htm |
| EX-99.1 - EX-99.1 - DEERE & CO | a13-18425_1ex99d1.htm |
| EX-99.2 - EX-99.2 - DEERE & CO | a13-18425_1ex99d2.htm |

|
|
| 3rd Quarter 2013 Earnings Conference Call 2 Safe Harbor Statement & Disclosures The earnings call and accompanying material include forward-looking comments and information concerning the company’s plans and projections for the future, including estimates and assumptions with respect to economic, political, technological, weather, market acceptance and other factors that impact our businesses and customers. They also may include financial measures that are not in conformance with accounting principles generally accepted in the United States of America (GAAP). Words such as “forecast,” “projection,” “outlook,” “prospects,” “expected,” “estimated,” “will,” “plan,” “anticipate,” “intend,” “believe,” or other similar words or phrases often identify forward-looking statements. Actual results may differ materially from those projected in these forward-looking statements based on a number of factors and uncertainties. Additional information concerning factors that could cause actual results to differ materially is contained in the company’s most recent Form 8-K and periodic report filed with the U.S. Securities and Exchange Commission, and is incorporated by reference herein. Investors should refer to and consider the incorporated information on risks and uncertainties in addition to the information presented here. Investors should consider non-GAAP financial measures in addition to, and not as a substitute for, financial measures prepared in accordance with GAAP. The company, except as required by law, undertakes no obligation to update or revise its forward-looking statements whether as a result of new developments or otherwise. The call and accompanying materials are not an offer to sell or a solicitation of offers to buy any of the company’s securities. 26 |
|
|
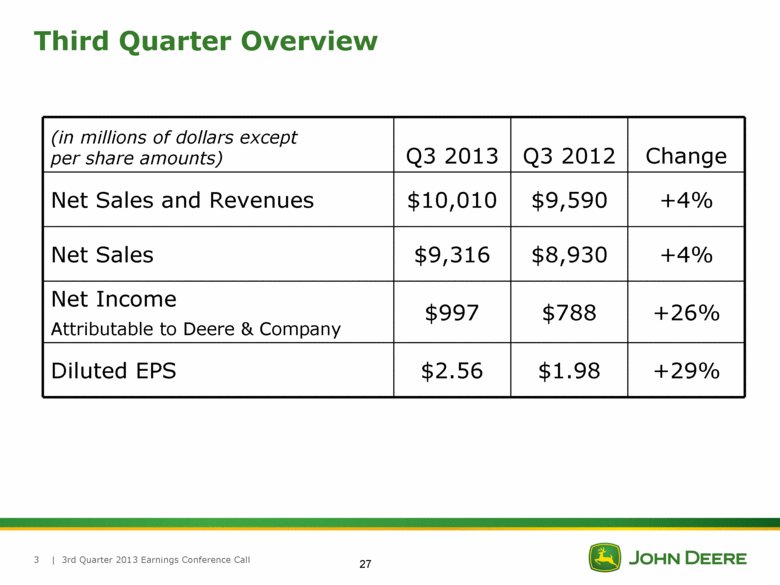
| 3rd Quarter 2013 Earnings Conference Call 3 Third Quarter Overview (in millions of dollars except per share amounts) Q3 2013 Q3 2012 Change Net Sales and Revenues $10,010 $9,590 +4% Net Sales $9,316 $8,930 +4% Net Income Attributable to Deere & Company $997 $788 +26% Diluted EPS $2.56 $1.98 +29% 27 |
|
|
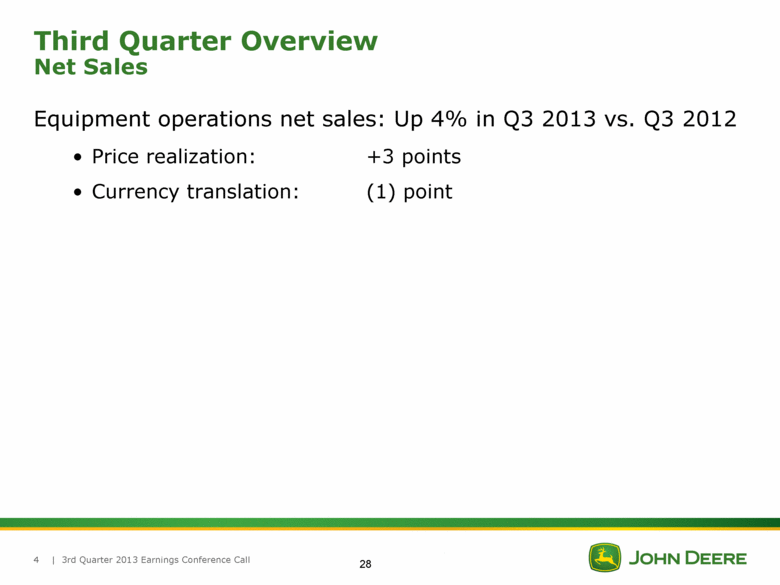
| 3rd Quarter 2013 Earnings Conference Call 4 Third Quarter Overview Net Sales Equipment operations net sales: Up 4% in Q3 2013 vs. Q3 2012 Price realization: +3 points Currency translation: (1) point 28 |
|
|
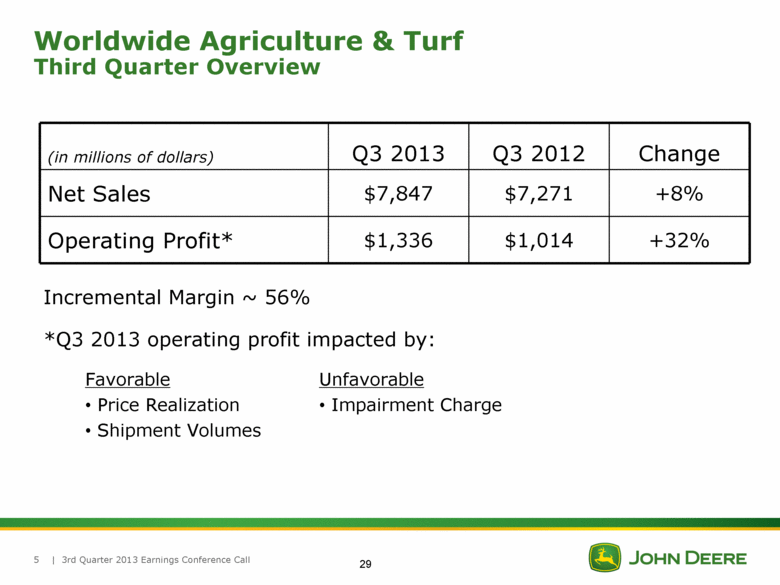
| 3rd Quarter 2013 Earnings Conference Call 5 Worldwide Agriculture & Turf Third Quarter Overview Incremental Margin ~ 56% *Q3 2013 operating profit impacted by: (in millions of dollars) Q3 2013 Q3 2012 Change Net Sales $7,847 $7,271 +8% Operating Profit* $1,336 $1,014 +32% Favorable Unfavorable Price Realization Impairment Charge Shipment Volumes 29 |
|
|
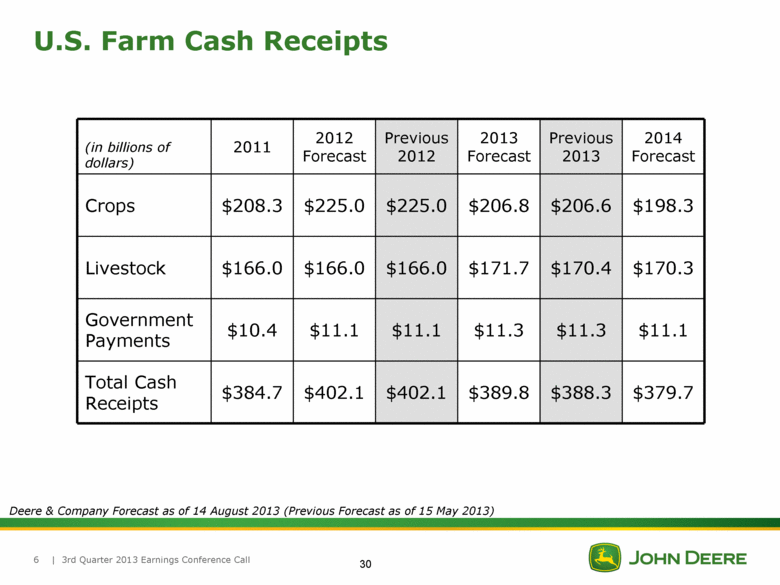
| 3rd Quarter 2013 Earnings Conference Call 6 U.S. Farm Cash Receipts Deere & Company Forecast as of 14 August 2013 (Previous Forecast as of 15 May 2013) (in billions of dollars) 2011 2012 Forecast Previous 2012 2013 Forecast Previous2013 2014 Forecast Crops $208.3 $225.0 $225.0 $206.8 $206.6 $198.3 Livestock $166.0 $166.0 $166.0 $171.7 $170.4 $170.3 Government Payments $10.4 $11.1 $11.1 $11.3 $11.3 $11.1 Total Cash Receipts $384.7 $402.1 $402.1 $389.8 $388.3 $379.7 30 |
|
|
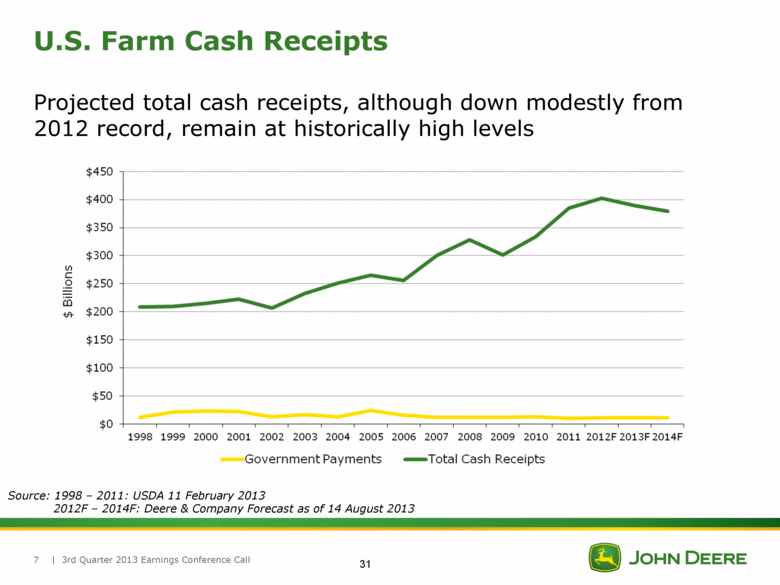
| 3rd Quarter 2013 Earnings Conference Call 7 U.S. Farm Cash Receipts Source: 1998 – 2011: USDA 11 February 2013 2012F – 2014F: Deere & Company Forecast as of 14 August 2013 Projected total cash receipts, although down modestly from 2012 record, remain at historically high levels 31 |
|
|
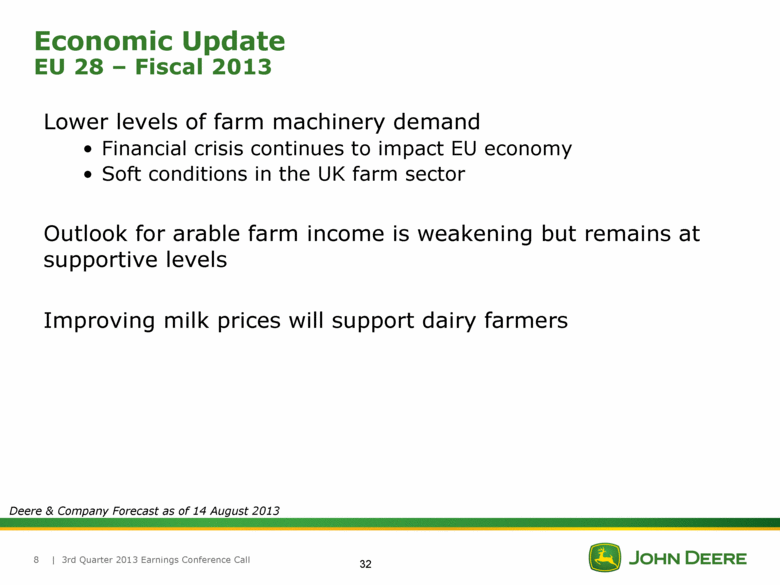
| 3rd Quarter 2013 Earnings Conference Call 8 Deere & Company Forecast as of 14 August 2013 Economic Update EU 28 – Fiscal 2013 Lower levels of farm machinery demand Financial crisis continues to impact EU economy Soft conditions in the UK farm sector Outlook for arable farm income is weakening but remains at supportive levels Improving milk prices will support dairy farmers 32 |
|
|
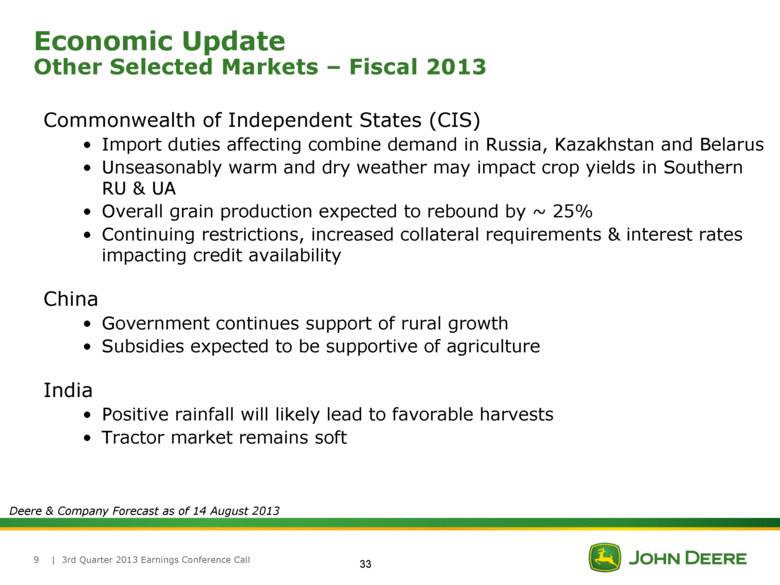
| 3rd Quarter 2013 Earnings Conference Call 9 Deere & Company Forecast as of 14 August 2013 Economic Update Other Selected Markets – Fiscal 2013 Commonwealth of Independent States (CIS) Import duties affecting combine demand in Russia, Kazakhstan and Belarus Unseasonably warm and dry weather may impact crop yields in Southern RU & UA Overall grain production expected to rebound by ~ 25% Continuing restrictions, increased collateral requirements & interest rates impacting credit availability China Government continues support of rural growth Subsidies expected to be supportive of agriculture India Positive rainfall will likely lead to favorable harvests Tractor market remains soft 33 |
|
|
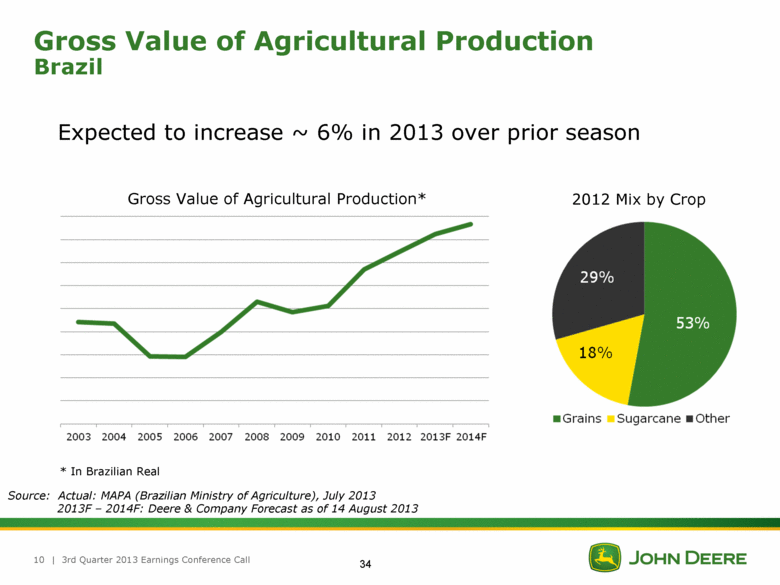
| 3rd Quarter 2013 Earnings Conference Call 10 Gross Value of Agricultural Production Brazil Source: Actual: MAPA (Brazilian Ministry of Agriculture), July 2013 2013F – 2014F: Deere & Company Forecast as of 14 August 2013 Gross Value of Agricultural Production* * In Brazilian Real Expected to increase ~ 6% in 2013 over prior season 2012 Mix by Crop 34 |
|
|
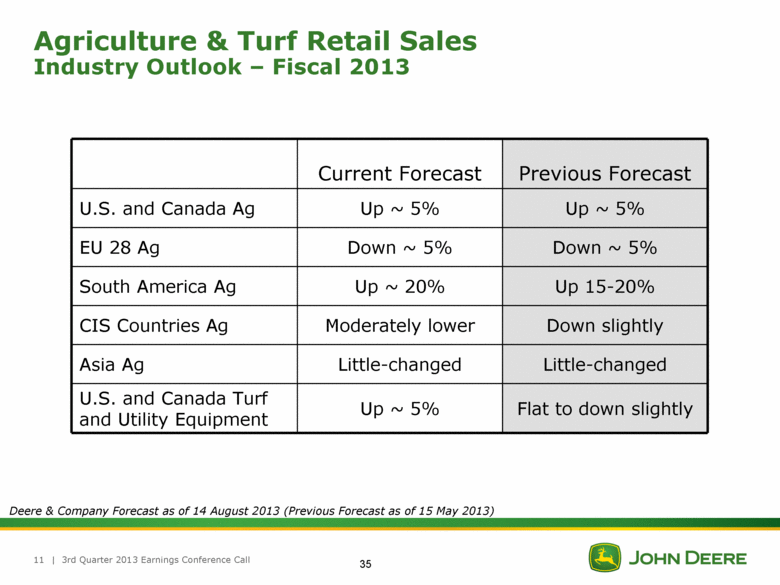
| 3rd Quarter 2013 Earnings Conference Call 11 Agriculture & Turf Retail Sales Industry Outlook – Fiscal 2013 Deere & Company Forecast as of 14 August 2013 (Previous Forecast as of 15 May 2013) Current Forecast Previous Forecast U.S. and Canada Ag Up ~ 5% Up ~ 5% EU 28 Ag Down ~ 5% Down ~ 5% South America Ag Up ~ 20% Up 15-20% CIS Countries Ag Moderately lower Down slightly Asia Ag Little-changed Little-changed U.S. and Canada Turf and Utility Equipment Up ~ 5% Flat to down slightly 35 |
|
|
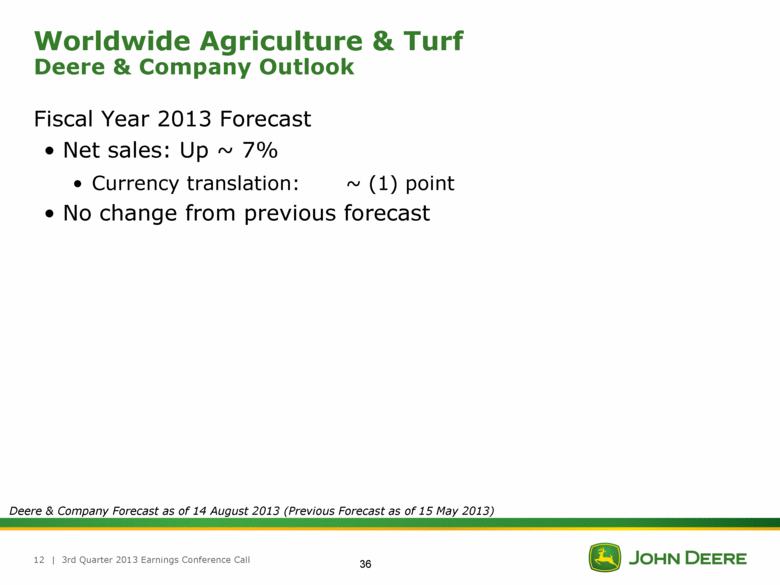
| 3rd Quarter 2013 Earnings Conference Call 12 Worldwide Agriculture & Turf Deere & Company Outlook Fiscal Year 2013 Forecast Net sales: Up ~ 7% Currency translation: ~ (1) point No change from previous forecast Deere & Company Forecast as of 14 August 2013 (Previous Forecast as of 15 May 2013) 36 |
|
|
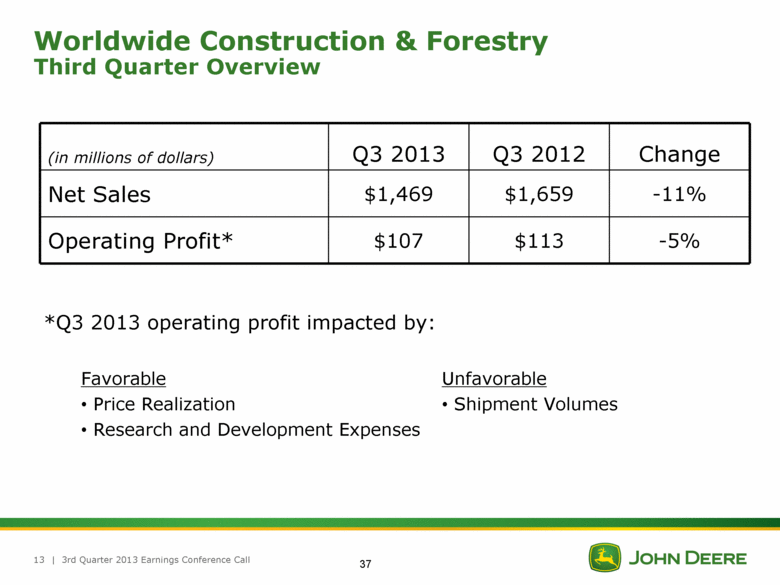
| 3rd Quarter 2013 Earnings Conference Call 13 Worldwide Construction & Forestry Third Quarter Overview (in millions of dollars) Q3 2013 Q3 2012 Change Net Sales $1,469 $1,659 -11% Operating Profit* $107 $113 -5% *Q3 2013 operating profit impacted by: Favorable Unfavorable Price Realization Shipment Volumes Research and Development Expenses 37 |
|
|
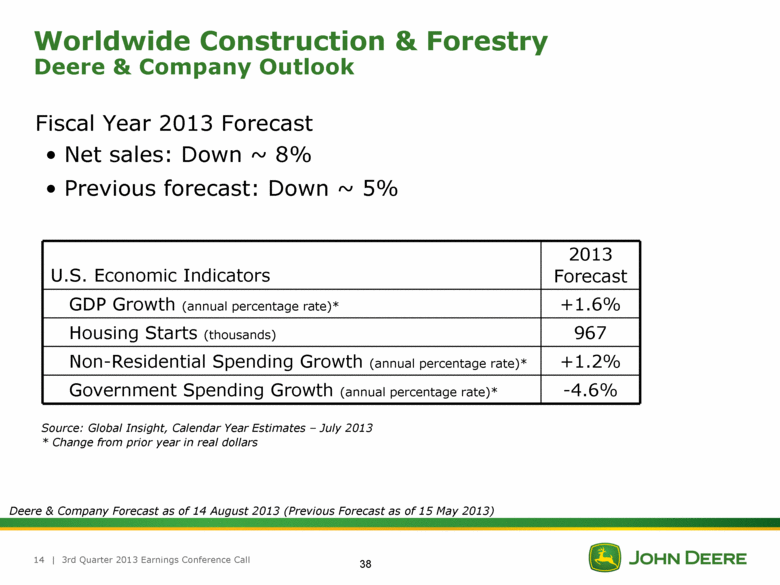
U.S. Economic Indicators 2013 Forecast GDP Growth (annual percentage rate)* +1.6% Housing Starts (thousands) 967 Non-Residential Spending Growth (annual percentage rate)* +1.2% Government Spending Growth (annual percentage rate)* -4.6% | 3rd Quarter 2013 Earnings Conference Call 14 Worldwide Construction & Forestry Deere & Company Outlook Source: Global Insight, Calendar Year Estimates – July 2013 * Change from prior year in real dollars Fiscal Year 2013 Forecast Net sales: Down ~ 8% Previous forecast: Down ~ 5% Deere & Company Forecast as of 14 August 2013 (Previous Forecast as of 15 May 2013) 38 |
|
|
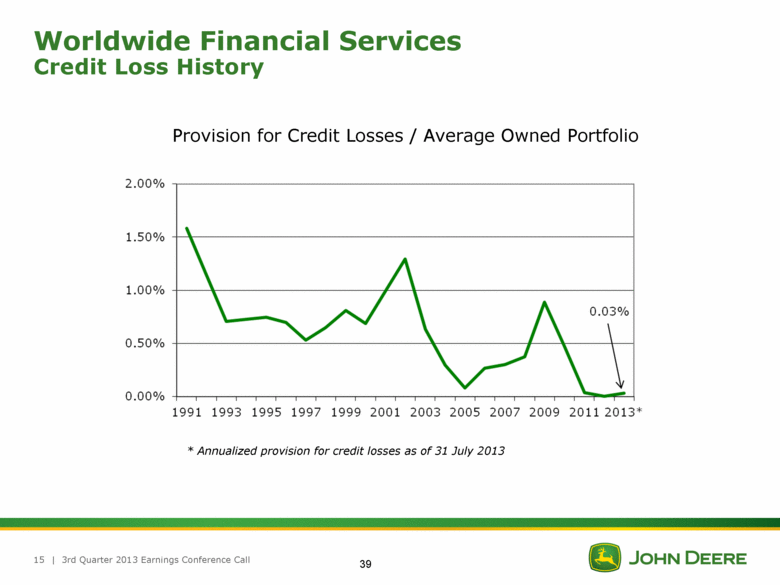
| 3rd Quarter 2013 Earnings Conference Call 15 Worldwide Financial Services Credit Loss History Provision for Credit Losses / Average Owned Portfolio * Annualized provision for credit losses as of 31 July 2013 39 |
|
|
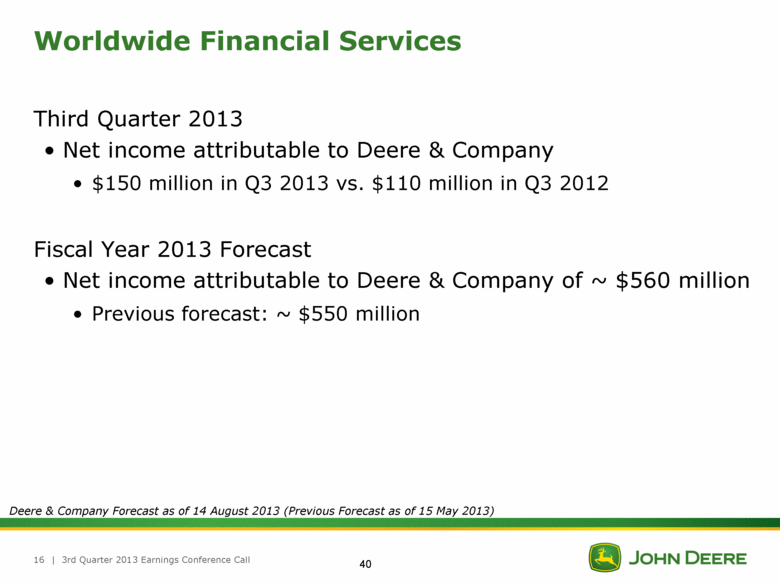
| 3rd Quarter 2013 Earnings Conference Call 16 Worldwide Financial Services Third Quarter 2013 Net income attributable to Deere & Company $150 million in Q3 2013 vs. $110 million in Q3 2012 Fiscal Year 2013 Forecast Net income attributable to Deere & Company of ~ $560 million Previous forecast: ~ $550 million Deere & Company Forecast as of 14 August 2013 (Previous Forecast as of 15 May 2013) 40 |
|
|
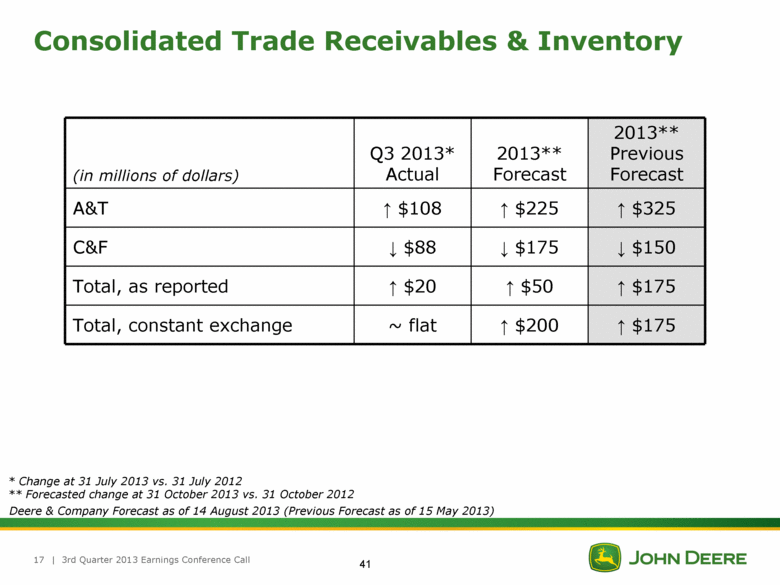
| 3rd Quarter 2013 Earnings Conference Call 17 Consolidated Trade Receivables & Inventory (in millions of dollars) Q3 2013* Actual 2013** Forecast 2013** Previous Forecast A&T $108 $225 $325 C&F $88 $175 $150 Total, as reported $20 $50 $175 Total, constant exchange ~ flat $200 $175 * Change at 31 July 2013 vs. 31 July 2012 ** Forecasted change at 31 October 2013 vs. 31 October 2012 Deere & Company Forecast as of 14 August 2013 (Previous Forecast as of 15 May 2013) 41 |
|
|
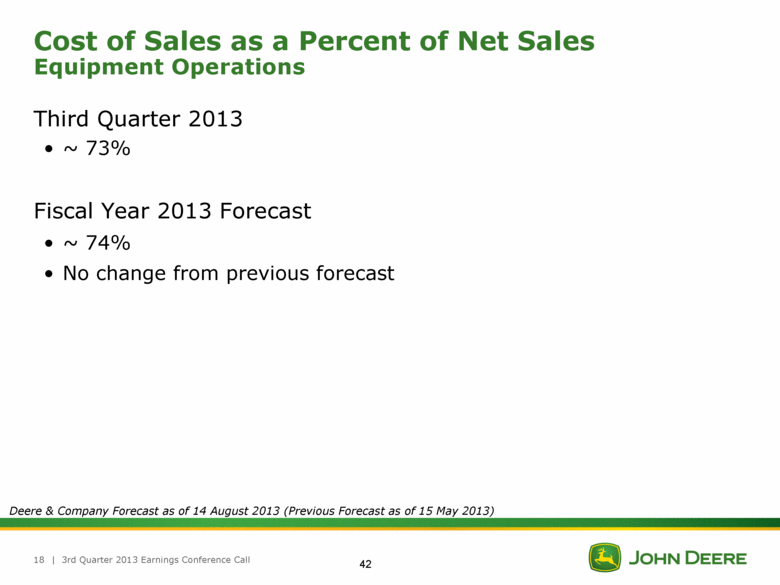
| 3rd Quarter 2013 Earnings Conference Call 18 Cost of Sales as a Percent of Net Sales Equipment Operations Deere & Company Forecast as of 14 August 2013 (Previous Forecast as of 15 May 2013) Third Quarter 2013 ~ 73% Fiscal Year 2013 Forecast ~ 74% No change from previous forecast 42 |
|
|
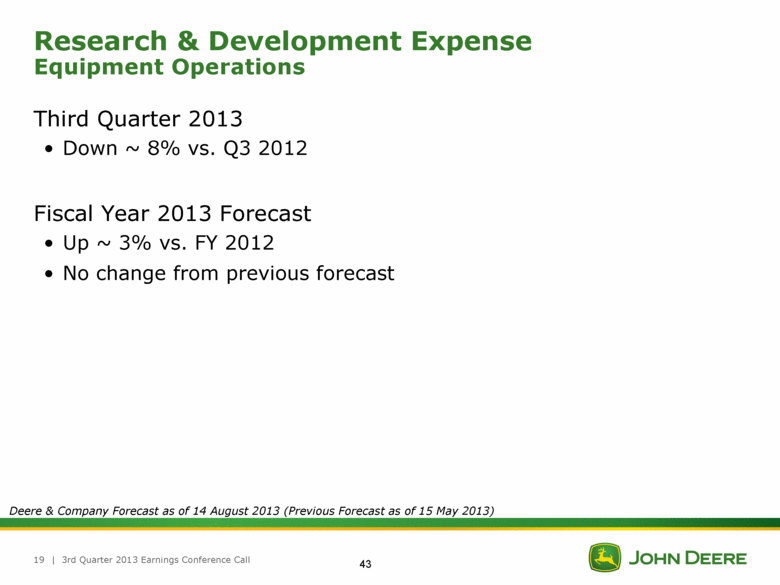
| 3rd Quarter 2013 Earnings Conference Call 19 Research & Development Expense Equipment Operations Third Quarter 2013 Down ~ 8% vs. Q3 2012 Fiscal Year 2013 Forecast Up ~ 3% vs. FY 2012 No change from previous forecast Deere & Company Forecast as of 14 August 2013 (Previous Forecast as of 15 May 2013) 43 |
|
|
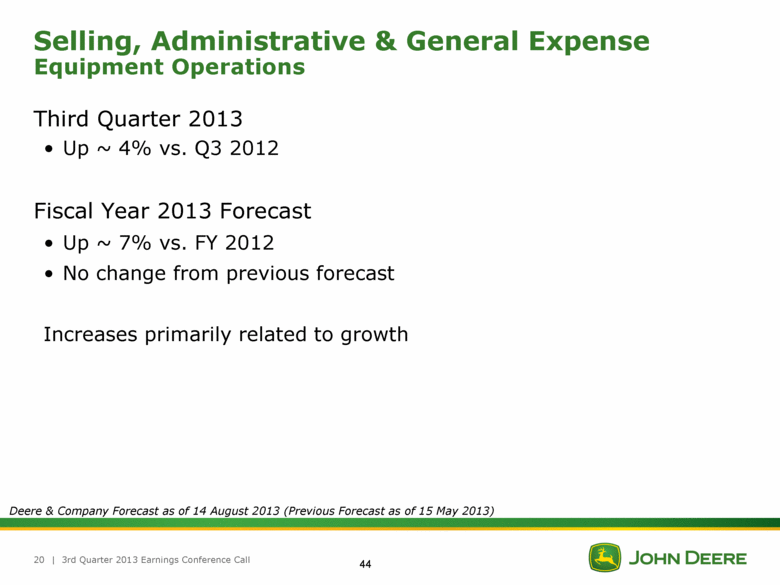
| 3rd Quarter 2013 Earnings Conference Call 20 Selling, Administrative & General Expense Equipment Operations Deere & Company Forecast as of 14 August 2013 (Previous Forecast as of 15 May 2013) Third Quarter 2013 Up ~ 4% vs. Q3 2012 Fiscal Year 2013 Forecast Up ~ 7% vs. FY 2012 No change from previous forecast Increases primarily related to growth 44 |
|
|
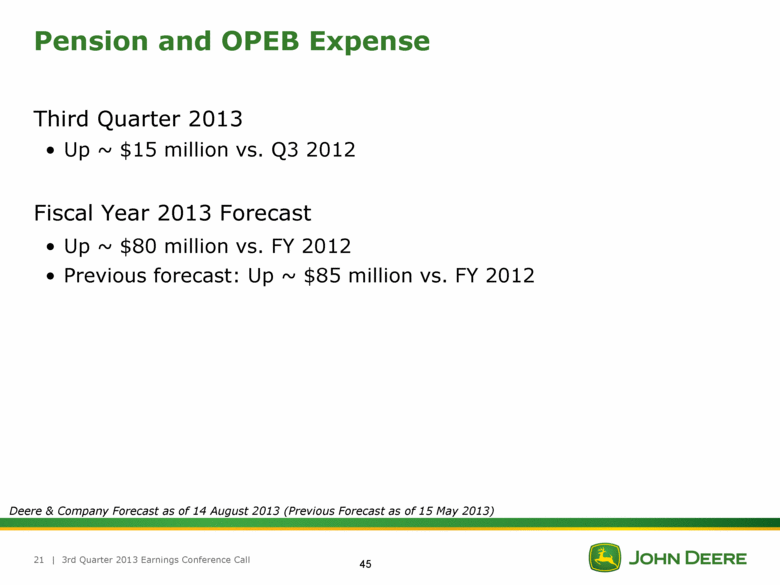
| 3rd Quarter 2013 Earnings Conference Call 21 Pension and OPEB Expense Third Quarter 2013 Up ~ $15 million vs. Q3 2012 Fiscal Year 2013 Forecast Up ~ $80 million vs. FY 2012 Previous forecast: Up ~ $85 million vs. FY 2012 Deere & Company Forecast as of 14 August 2013 (Previous Forecast as of 15 May 2013) 45 |
|
|
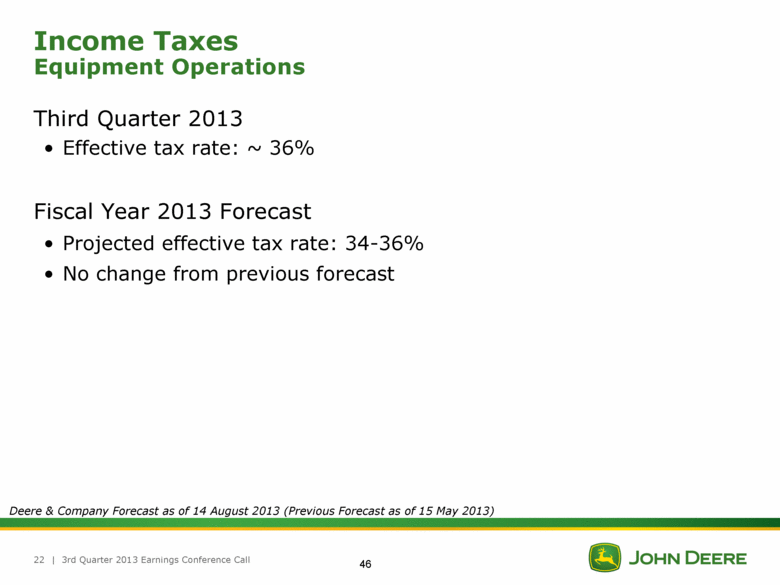
| 3rd Quarter 2013 Earnings Conference Call 22 Income Taxes Equipment Operations Third Quarter 2013 Effective tax rate: ~ 36% Fiscal Year 2013 Forecast Projected effective tax rate: 34-36% No change from previous forecast Deere & Company Forecast as of 14 August 2013 (Previous Forecast as of 15 May 2013) 46 |
|
|
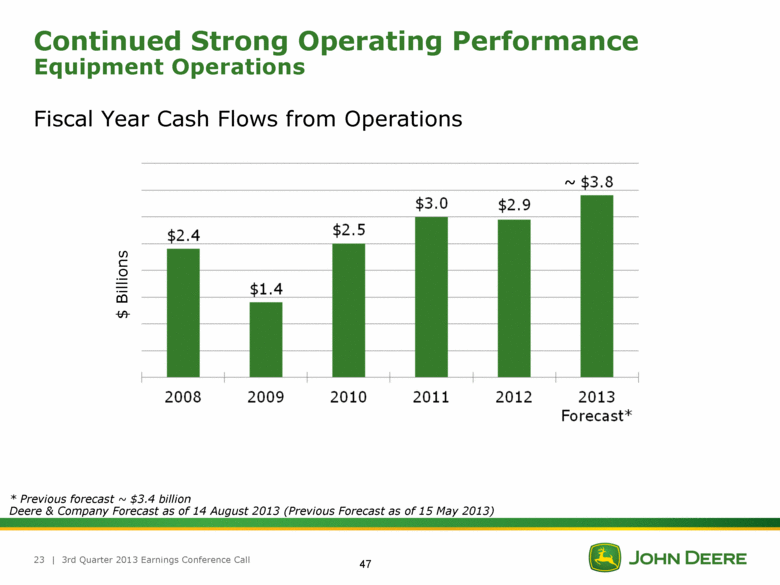
| 3rd Quarter 2013 Earnings Conference Call 23 Continued Strong Operating Performance Equipment Operations Fiscal Year Cash Flows from Operations * Previous forecast ~ $3.4 billion Deere & Company Forecast as of 14 August 2013 (Previous Forecast as of 15 May 2013) $ Billions ~ 47 |
|
|
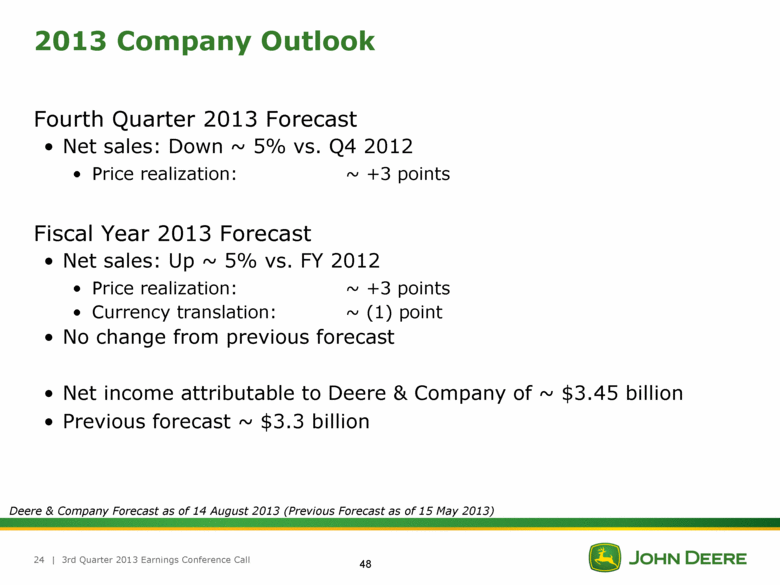
| 3rd Quarter 2013 Earnings Conference Call 24 2013 Company Outlook Fourth Quarter 2013 Forecast Net sales: Down ~ 5% vs. Q4 2012 Price realization: ~ +3 points Fiscal Year 2013 Forecast Net sales: Up ~ 5% vs. FY 2012 Price realization: ~ +3 points Currency translation: ~ (1) point No change from previous forecast Net income attributable to Deere & Company of ~ $3.45 billion Previous forecast ~ $3.3 billion Deere & Company Forecast as of 14 August 2013 (Previous Forecast as of 15 May 2013) 48 |
|
|
| 3rd Quarter 2013 Earnings Conference Call 25 Appendix 49 |
|
|
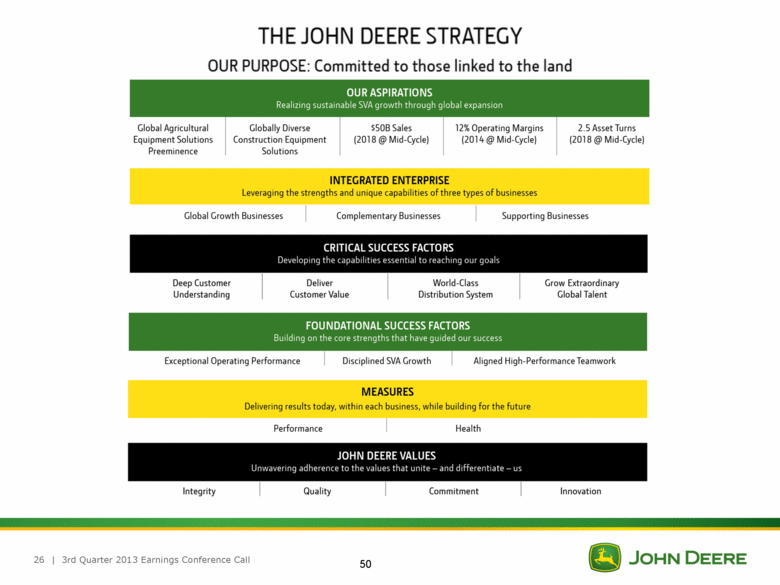
| 3rd Quarter 2013 Earnings Conference Call 26 50 THE JOHN DEERE STRATEGY OUR PURPOSE: Committed to those linked to the land |
|
|
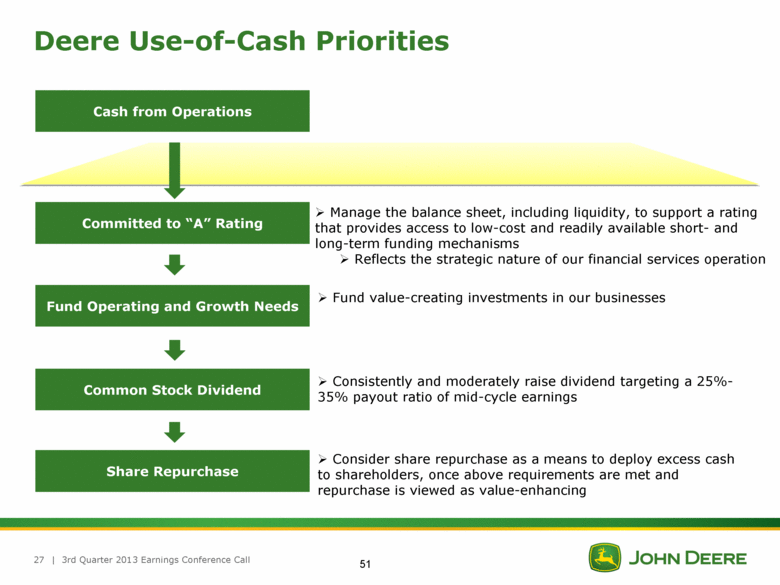
Deere Use-of-Cash Priorities | 3rd Quarter 2013 Earnings Conference Call 27 Manage the balance sheet, including liquidity, to support a rating that provides access to low-cost and readily available short- and long-term funding mechanisms Reflects the strategic nature of our financial services operation Committed to “A” Rating Cash from Operations Fund Operating and Growth Needs Common Stock Dividend Share Repurchase Fund value-creating investments in our businesses Consistently and moderately raise dividend targeting a 25%-35% payout ratio of mid-cycle earnings Consider share repurchase as a means to deploy excess cash to shareholders, once above requirements are met and repurchase is viewed as value-enhancing 51 |
|
|
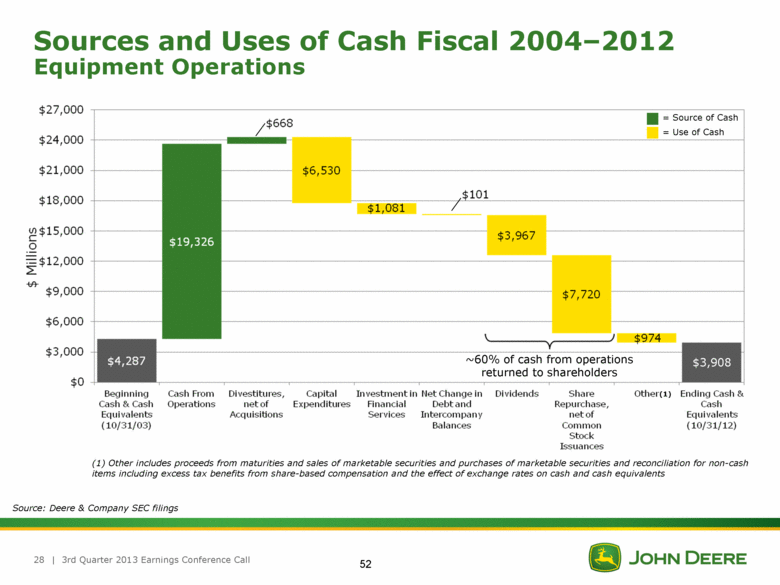
| 3rd Quarter 2013 Earnings Conference Call 28 Sources and Uses of Cash Fiscal 2004–2012 Equipment Operations Source: Deere & Company SEC filings = Source of Cash = Use of Cash ~60% of cash from operations returned to shareholders 52 |
|
|
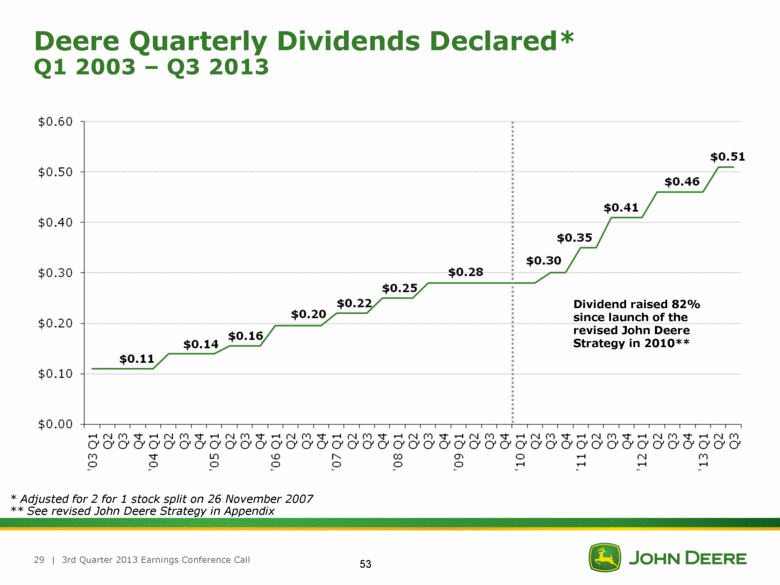
| 3rd Quarter 2013 Earnings Conference Call Deere Quarterly Dividends Declared* Q1 2003 – Q3 2013 29 Dividend raised 82% since launch of the revised John Deere Strategy in 2010** * Adjusted for 2 for 1 stock split on 26 November 2007 ** See revised John Deere Strategy in Appendix 53 |
|
|
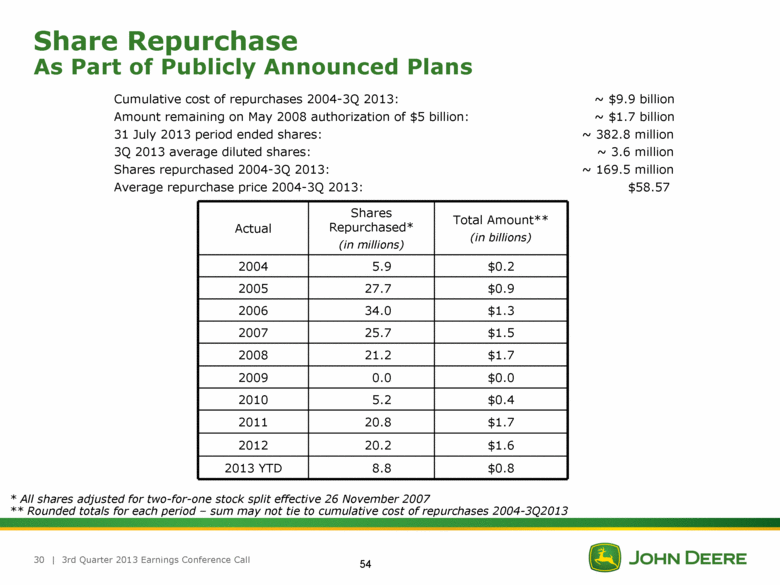
| 3rd Quarter 2013 Earnings Conference Call 30 Share Repurchase As Part of Publicly Announced Plans Cumulative cost of repurchases 2004-3Q 2013: ~ $9.9 billion Amount remaining on May 2008 authorization of $5 billion: ~ $1.7 billion 31 July 2013 period ended shares: ~ 382.8 million 3Q 2013 average diluted shares: ~ 3.6 million Shares repurchased 2004-3Q 2013: ~ 169.5 million Average repurchase price 2004-3Q 2013: $58.57 Actual Shares Repurchased* (in millions) Total Amount** (in billions) 2004 5.9 $0.2 2005 27.7 $0.9 2006 34.0 $1.3 2007 25.7 $1.5 2008 21.2 $1.7 2009 0.0 $0.0 2010 5.2 $0.4 2011 20.8 $1.7 2012 20.2 $1.6 2013 YTD 8.8 $0.8 * All shares adjusted for two-for-one stock split effective 26 November 2007 ** Rounded totals for each period – sum may not tie to cumulative cost of repurchases 2004-3Q2013 54 |
|
|
| 3rd Quarter 2013 Earnings Conference Call 31 Other Information Equipment Operations Fiscal Year 2013 Forecast Capital Expenditures: ~ $1.3 billion No change from previous forecast Depreciation and Amortization: ~ $765 million Previous forecast: ~ $725 million Pension/OPEB Contributions: ~ $315 million Previous forecast: ~ $570 million Deere & Company Forecast as of 14 August 2013 (Previous Forecast as of 15 May 2013) 55 |

|
|
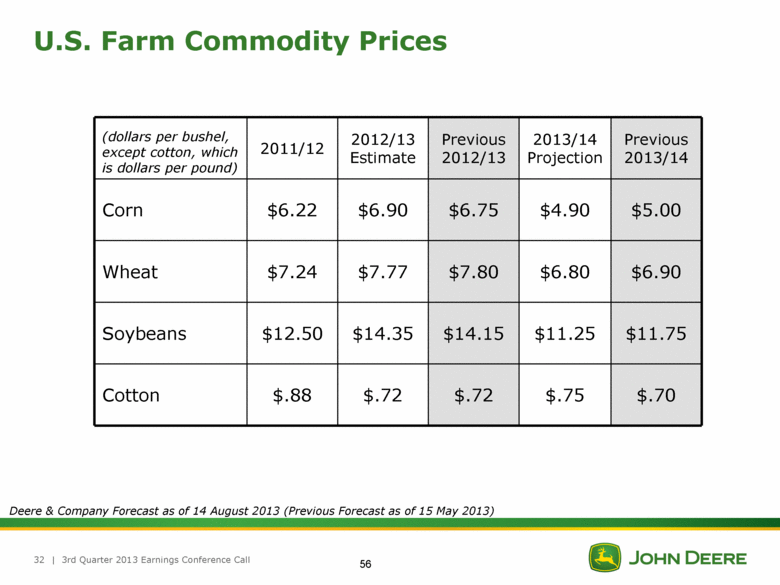
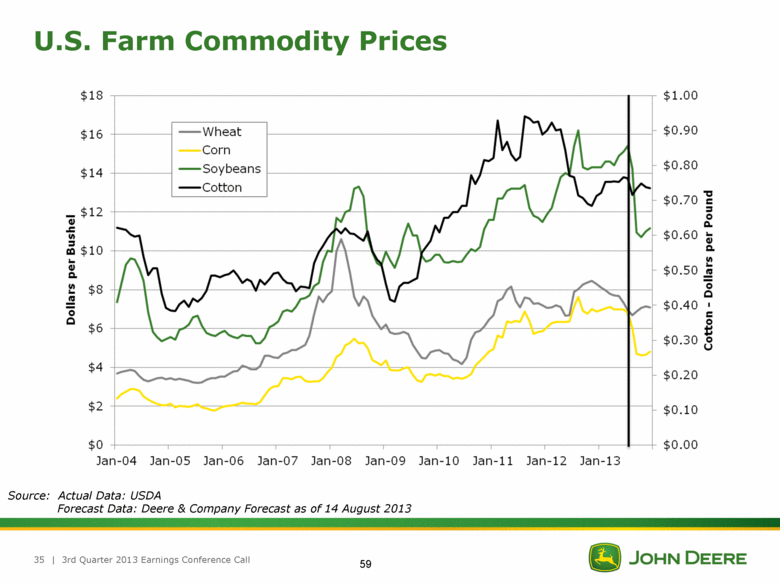
| 3rd Quarter 2013 Earnings Conference Call 32 U.S. Farm Commodity Prices Deere & Company Forecast as of 14 August 2013 (Previous Forecast as of 15 May 2013) (dollars per bushel, except cotton, which is dollars per pound) 2011/12 2012/13 Estimate Previous 2012/13 2013/14 Projection Previous 2013/14 Corn $6.22 $6.90 $6.75 $4.90 $5.00 Wheat $7.24 $7.77 $7.80 $6.80 $6.90 Soybeans $12.50 $14.35 $14.15 $11.25 $11.75 Cotton $.88 $.72 $.72 $.75 $.70 56 |
|
|
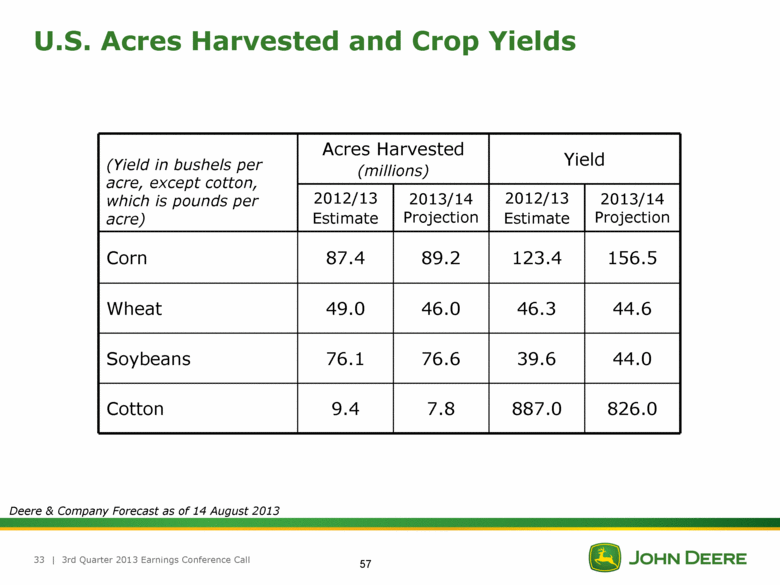
(Yield in bushels per acre, except cotton, which is pounds per acre) Acres Harvested (millions) Yield 2012/13 Estimate 2013/14 Projection 2012/13 Estimate 2013/14 Projection Corn 87.4 89.2 123.4 156.5 Wheat 49.0 46.0 46.3 44.6 Soybeans 76.1 76.6 39.6 44.0 Cotton 9.4 7.8 887.0 826.0 | 3rd Quarter 2013 Earnings Conference Call 33 U.S. Acres Harvested and Crop Yields Deere & Company Forecast as of 14 August 2013 57 |
|
|
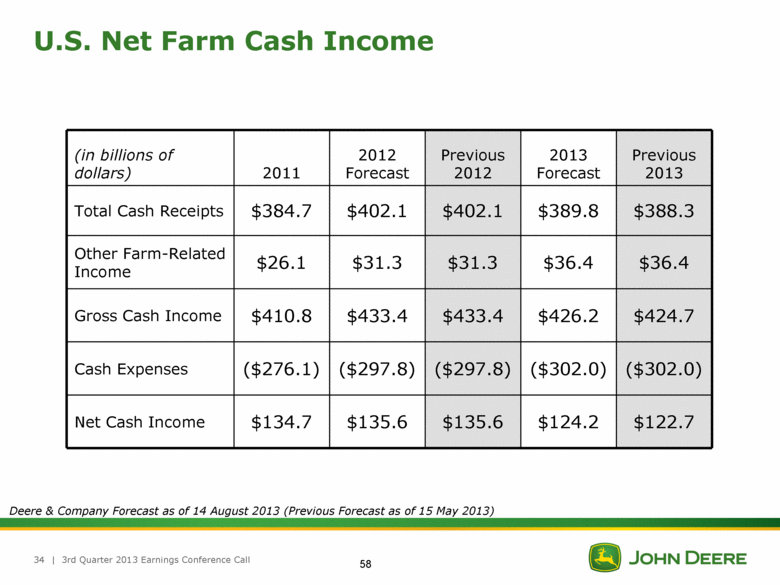
| 3rd Quarter 2013 Earnings Conference Call 34 U.S. Net Farm Cash Income Deere & Company Forecast as of 14 August 2013 (Previous Forecast as of 15 May 2013) (in billions of dollars) 2011 2012 Forecast Previous 2012 2013 Forecast Previous 2013 Total Cash Receipts $384.7 $402.1 $402.1 $389.8 $388.3 Other Farm-Related Income $26.1 $31.3 $31.3 $36.4 $36.4 Gross Cash Income $410.8 $433.4 $433.4 $426.2 $424.7 Cash Expenses ($276.1) ($297.8) ($297.8) ($302.0) ($302.0) Net Cash Income $134.7 $135.6 $135.6 $124.2 $122.7 58 |
|
|
U.S. Farm Commodity Prices | 3rd Quarter 2013 Earnings Conference Call 35 Source: Actual Data: USDA Forecast Data: Deere & Company Forecast as of 14 August 2013 59 |
|
|
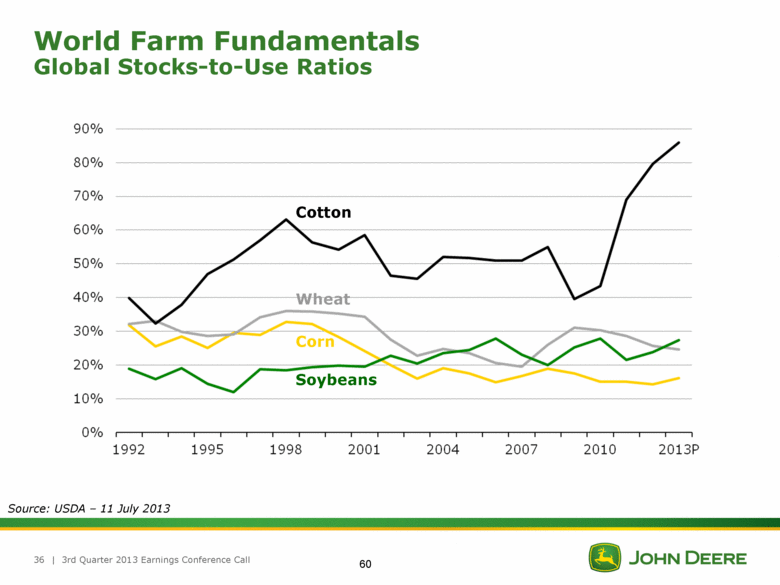
| 3rd Quarter 2013 Earnings Conference Call 36 World Farm Fundamentals Global Stocks-to-Use Ratios Source: USDA – 11 July 2013 Cotton Wheat Corn Soybeans 60 |
|
|
| 3rd Quarter 2013 Earnings Conference Call 37 Retail Sales U.S. and Canada Ag Industry* Deere** Utility Tractors 15% ~ flat Row-Crop Tractors 15% double digits, less than industry 4WD Tractors 11% single digit Combines 10% more than industry July 2013 Retail Sales and Dealer Inventories * As reported by the Association of Equipment Manufacturers ** As reported to the Association of Equipment Manufacturers *** At 31 July – in units as a % of trailing 12 months retail sales, as reported to the Association of Equipment Manufacturers Deere Dealer Inventories*** U.S. and Canada Ag 2013 2012 Row-Crop Tractors 23% 23% Combines 18% 19% 61 |

|
|
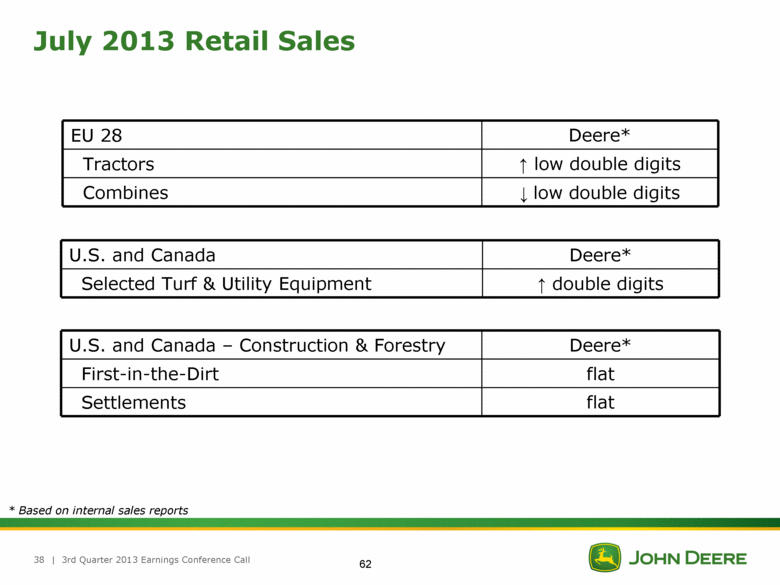
| 3rd Quarter 2013 Earnings Conference Call 38 July 2013 Retail Sales EU 28 Deere* Tractors low double digits Combines low double digits U.S. and Canada Deere* Selected Turf & Utility Equipment double digits * Based on internal sales reports U.S. and Canada – Construction & Forestry Deere* First-in-the-Dirt flat Settlements flat 62 |
|
|
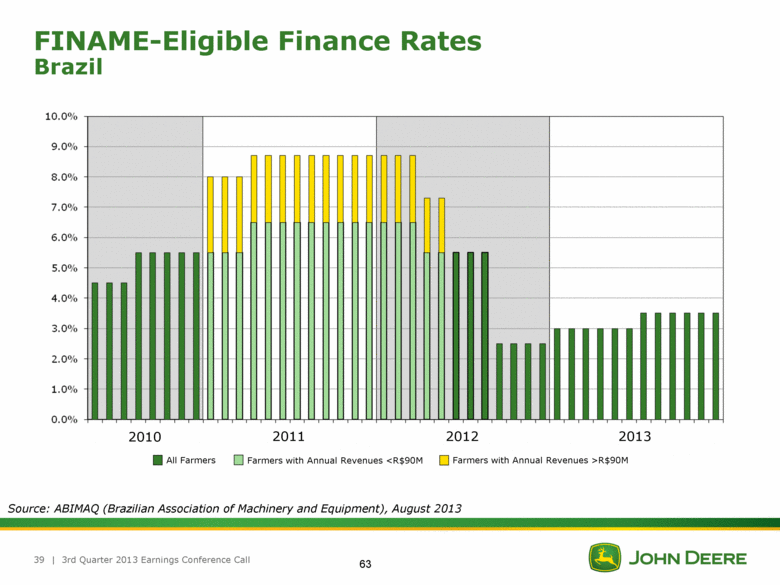
| 3rd Quarter 2013 Earnings Conference Call 39 2010 2011 2012 2013 Farmers with Annual Revenues <R$90M Farmers with Annual Revenues >R$90M FINAME-Eligible Finance Rates Brazil Source: ABIMAQ (Brazilian Association of Machinery and Equipment), August 2013 63 |
|
|
Deere’s fourth quarter 2013 conference call is scheduled for 9:00 a.m. central time on Wednesday, November 20, 2013 64 |