Attached files
| file | filename |
|---|---|
| 8-K - FORM 8-K - Armada Hoffler Properties, Inc. | d581600d8k.htm |
| EX-99.1 - EXHIBIT 99.1 - Armada Hoffler Properties, Inc. | d581600dex991.htm |
Exhibit 99.2

Armada Hoffler Properties, Inc.
Second Quarter 2013 Supplemental Information

Forward-Looking Statement
This Supplemental Information should be read in conjunction with our Quarterly Report on Form 10-Q for the quarter ended March 31, 2013 (the “10-Q”), the consolidated financial statements and notes thereto appearing in the 10-Q and our press release, dated August 13, 2013, which has been filed as Exhibit 99.1 to our Form 8-K filed on August 13, 2013. We make statements in this Supplemental Information that are forward-looking statements within the meaning of the Private Securities Litigation Reform Act of 1995 (set forth in Section 27A of the Securities Act of 1933, as amended (the “Securities Act”), and Section 21E of the Securities Exchange Act of 1934, as amended (the “Exchange Act”)). In particular, statements pertaining to our capital resources, portfolio performance and results of operations contain forward-looking statements. Likewise, all of our statements regarding anticipated growth in our core funds from operation, funds available for distribution and net operating income are forward-looking statements. You can identify forward-looking statements by the use of forward-looking terminology such as “believes,” “expects,” “may,” “will,” “should,” “seeks,” “approximately,” “intends,” “plans,” “estimates” or “anticipates” or the negative of these words and phrases or similar words or phrases which are predictions of or indicate future events or trends and which do not relate solely to historical matters. You can also identify forward-looking statements by discussions of strategy, plans or intentions. Forward-looking statements involve numerous risks and uncertainties and you should not rely on them as predictions of future events.
Forward-looking statements depend on assumptions, data or methods which may be incorrect or imprecise and we may not be able to realize them. We do not guarantee that the transactions and events described will happen as described (or that they will happen at all). For further discussion of factors that could impact our future results, please refer to our Registration Statement on Form S-11, initially filed with the Securities and Exchange Commission (the “SEC”) on March 26, 2013, as subsequently amended, our Quarterly Report on Form 10-Q for the quarter ended March 31, 2013 and the documents subsequently filed by us from time to time with the SEC.
| Second Quarter 2013 Supplemental Information | Page 2 |
Table of Contents
| Company Highlights |
4 | |||
| Summary |
5 | |||
| Balance Sheet |
6 | |||
| Income Statement |
7 | |||
| Pro Forma Core Funds From Operations |
8 | |||
| Same Store Net Operating Income |
9 | |||
| Portfolio Summary |
10 | |||
| Portfolio Summary Notes |
11 | |||
| Historical Segment Occupancy |
12 | |||
| Multifamily Occupancy Summary |
13 | |||
| Office Leasing Summary |
14 | |||
| Retail Leasing Summary |
15 | |||
| Top Tenants |
16 | |||
| Office Lease Expirations |
17 | |||
| Office Lease Expirations |
18 | |||
| Development Pipeline |
19 | |||
| Market Capitalization |
20 | |||
| Debt Summary |
21 | |||
| Definitions |
22 | |||
| Second Quarter 2013 Supplemental Information | Page 3 |
Second Quarter 2013 Highlights
| • | Generated Pro Forma Core FFO (Funds From Operations) of $6.5 Million, or $0.20 per share. |
| • | Average occupancy stable at 93.5% when compared to the prior quarter and year end 2012. |
| • | Executed new and renewal leases totaling over 80,000 square feet in the office and retail property portfolios. |
| • | Development pipeline of six properties, consisting of 384,600 square feet of office and retail property and 491 multifamily units. The Main Street Office development in Virginia Beach is 46% pre-leased. |
| • | Engaged in 17 construction contracts at an value of approximately $117.3 million, with approximately $58.2 million of work still to be completed. |
| • | Completed a successful initial public offering (IPO) raising gross proceeds of approximately $218.5 million. |
| Second Quarter 2013 Supplemental Information | Page 4 |
Summary Information
$ in thousands except per share data & rentable square feet/multifamily units
| Three months ended | ||||
| 6/30/2013 | ||||
| (Unaudited) | ||||
| Shares and Units: |
||||
| Common Shares outstanding at end of period |
19,164 | |||
| Common Units outstanding at end of period |
13,059 | |||
| Total |
32,223 | |||
| Share Price: |
||||
| At end of period |
$ | 11.78 | ||
| High during period |
$ | 11.83 | ||
| Low during period |
$ | 11.13 | ||
| Financial Information: |
||||
| Rental revenues |
$ | 14,231 | ||
| General contracting and real estate services revenue |
23,291 | |||
| Net operating income (NOI) |
10,372 | |||
| Net income |
8,404 | |||
| Funds from operations (FFO) |
2,886 | |||
| Pro forma FFO |
4,031 | |||
| Pro forma Core FFO |
6,458 | |||
| Pro forma Core FFO per share |
$ | 0.20 | ||
| Wholly - owned property information: |
||||
| Rentable square feet or number of units: |
||||
| Office |
954,458 | |||
| Retail |
1,094,663 | |||
| Multifamily |
626 | |||
| Occupancy: |
||||
| Office(1) |
93.4 | % | ||
| Retail(1) |
94.6 | % | ||
| Multifamily(2) |
91.2 | % | ||
|
|
|
|||
| Weighted Average(3) |
93.5 | % | ||
| (1) | Office and retail occupancy based on occupied square feet as a % of respective total |
| (2) | Multifamily occupancy based on weighted average of total units |
| (3) | Total occupancy weighted by annualized base rent |
| Second Quarter 2013 Supplemental Information | Page 5 |
Summary Balance Sheet
$ in thousands
| As of | ||||||||
| 6/30/2013 | 12/31/2012 | |||||||
| (Unaudited) | ||||||||
| Assets |
||||||||
| Real estate, at cost |
||||||||
| Income producing property |
$ | 403,296 | $ | 350,814 | ||||
| Held for development |
4,733 | 3,926 | ||||||
| Construction in progress |
12,258 | — | ||||||
| Accumulated depreciation |
(98,612 | ) | (92,454 | ) | ||||
| Net real estate investments |
321,675 | 262,286 | ||||||
| Cash and cash equivalents |
14,737 | 9,400 | ||||||
| Restricted cash |
3,117 | 3,725 | ||||||
| Construction assets |
18,412 | 11,696 | ||||||
| Other assets |
41,366 | 44,706 | ||||||
|
|
|
|
|
|||||
| Total Assets |
$ | 399,307 | $ | 331,813 | ||||
|
|
|
|
|
|||||
| Liabilities and Equity |
||||||||
| Indebtedness: |
||||||||
| Secured debt |
$ | 244,336 | $ | 334,438 | ||||
| Participating note |
— | 643 | ||||||
| Construction liabilities |
20,770 | 21,605 | ||||||
| Other liabilities |
22,650 | 16,468 | ||||||
|
|
|
|
|
|||||
| Total Liabilities |
$ | 287,756 | $ | 373,154 | ||||
|
|
|
|
|
|||||
| Equity |
111,551 | (41,341 | ) | |||||
|
|
|
|
|
|||||
| Total Liabilities and Equity |
$ | 399,307 | $ | 331,813 | ||||
|
|
|
|
|
|||||
| Second Quarter 2013 Supplemental Information | Page 6 |
Summary Income Statement
$ in thousands
| Three months ended | Six months ended | |||||||||||||||
| 6/30/2013 | 6/30/2012 | 6/30/2013 | 6/30/2012 | |||||||||||||
| (Unaudited) | ||||||||||||||||
| Revenues: |
||||||||||||||||
| Rental revenues |
$ | 14,231 | $ | 13,609 | $ | 27,629 | $ | 26,996 | ||||||||
| General contracting and real estate services revenues |
23,291 | 12,383 | 41,247 | 27,024 | ||||||||||||
|
|
|
|
|
|
|
|
|
|||||||||
| Total Revenues |
$ | 37,522 | $ | 25,992 | $ | 68,876 | $ | 54,020 | ||||||||
|
|
|
|
|
|
|
|
|
|||||||||
| Expenses: |
||||||||||||||||
| Rental expenses |
$ | 3,399 | $ | 2,944 | $ | 6,628 | $ | 5,808 | ||||||||
| Real estate taxes |
1,248 | 1,209 | 2,460 | 2,392 | ||||||||||||
| General contracting and real estate services expenses |
22,503 | 11,501 | 39,961 | 25,493 | ||||||||||||
| Depreciation and amortization |
4,020 | 3,232 | 7,179 | 6,579 | ||||||||||||
| General and administrative expenses |
2,857 | 954 | 3,574 | 1,788 | ||||||||||||
| Impairment charges |
533 | — | 533 | — | ||||||||||||
|
|
|
|
|
|
|
|
|
|||||||||
| Total Expenses |
34,560 | 19,840 | 60,335 | 42,060 | ||||||||||||
|
|
|
|
|
|
|
|
|
|||||||||
| Operating Income |
$ | 2,962 | $ | 6,152 | $ | 8,541 | $ | 11,960 | ||||||||
| Interest expense |
(3,289 | ) | (4,217 | ) | (7,204 | ) | (8,344 | ) | ||||||||
| Loss on extinguishment of debt |
(1,125 | ) | — | (1,125 | ) | — | ||||||||||
| Gain on acquisition |
9,460 | — | 9,460 | — | ||||||||||||
| Other income (expense) |
185 | 164 | 452 | 387 | ||||||||||||
|
|
|
|
|
|
|
|
|
|||||||||
| Income from continuing operations, before tax |
8,193 | 2,099 | 10,124 | 4,003 | ||||||||||||
| Income tax benefit |
211 | — | 211 | — | ||||||||||||
|
|
|
|
|
|
|
|
|
|||||||||
| Income from continuing operations |
8,404 | 2,099 | 10,335 | 4,003 | ||||||||||||
| Discontinued operations: |
||||||||||||||||
| Loss from discontinued operations |
— | (9 | ) | — | (35 | ) | ||||||||||
| Loss on sale of real estate |
— | 20 | — | 25 | ||||||||||||
|
|
|
|
|
|
|
|
|
|||||||||
| Results from discontinued operations |
— | 11 | — | (10 | ) | |||||||||||
|
|
|
|
|
|
|
|
|
|||||||||
| Net income |
$ | 8,404 | $ | 2,110 | $ | 10,335 | $ | 3,993 | ||||||||
|
|
|
|
|
|||||||||||||
| Net income attributable to Predecessor |
(89 | ) | (2,020 | ) | ||||||||||||
| Net income attributable to noncontrolling interests in operating partnership |
(3,429 | ) | (3,429 | ) | ||||||||||||
|
|
|
|
|
|||||||||||||
| Net income attributable to common stockholders |
$ | 4,886 | $ | 4,886 | ||||||||||||
|
|
|
|
|
|||||||||||||
| Second Quarter 2013 Supplemental Information | Page 7 |
Pro Forma Core Funds From Operations
$ in thousands, except per share
| Three months ended | ||||
| 6/30/2013 | ||||
| (Unaudited) | ||||
| Funds from Operations (FFO) |
||||
| Net income |
$ | 8,404 | ||
| Depreciation and amortization |
4,020 | |||
| Gain on acquisitions |
(9,460 | ) | ||
| Real estate joint ventures |
(78 | ) | ||
|
|
|
|||
| FFO, as defined by NAREIT |
$ | 2,886 | ||
| Pro Forma FFO |
||||
| FFO, as defined by NAREIT |
$ | 2,886 | ||
| Interest expense |
1,060 | |||
| Real estate joint ventures |
285 | |||
| General and administrative expenses |
(200 | ) | ||
|
|
|
|||
| Pro Forma FFO |
$ | 4,031 | ||
| Pro Forma Core FFO |
||||
| Pro Forma FFO |
$ | 4,031 | ||
| Loss on extinguishment of debt |
1,125 | |||
| Non-cash stock compensation |
769 | |||
| Impairment charges |
533 | |||
|
|
|
|||
| Pro Forma Core FFO |
$ | 6,458 | ||
|
|
|
|||
| Pro Forma Core FFO per share |
$ | 0.20 | ||
| Common Shares and Units Outstanding |
32,223 | |||
| Second Quarter 2013 Supplemental Information | Page 8 |
Same-Store Portfolio Net Operating Income (NOI)
$ in thousands
| Three months ended 6/30, | Six months ended 6/30, | |||||||||||||||||||||||
| 2013 | 2012 | Change | 2013 | 2012 | Change | |||||||||||||||||||
| (Unaudited) | (Unaudited) | |||||||||||||||||||||||
|
Office(1) |
||||||||||||||||||||||||
| Revenue |
$ | 6,420 | $ | 6,566 | $ | (146 | ) | $ | 12,906 | $ | 12,959 | $ | (53 | ) | ||||||||||
| Expenses |
1,940 | 1,804 | 136 | 3,886 | 3,650 | 236 | ||||||||||||||||||
|
|
|
|
|
|
|
|
|
|
|
|
|
|||||||||||||
| Net Operating Income |
4,480 | 4,762 | (282 | ) | 9,020 | 9,309 | (289 | ) | ||||||||||||||||
|
Retail(2) |
||||||||||||||||||||||||
| Revenue |
4,986 | 5,096 | (110 | ) | 9,849 | 10,196 | (347 | ) | ||||||||||||||||
| Expenses |
1,510 | 1,450 | 60 | 3,124 | 2,976 | 148 | ||||||||||||||||||
|
|
|
|
|
|
|
|
|
|
|
|
|
|||||||||||||
| Net Operating Income |
3,476 | 3,646 | (170 | ) | 6,725 | 7,220 | (495 | ) | ||||||||||||||||
| Multi Family(3) |
||||||||||||||||||||||||
| Revenue |
1,903 | 1,856 | 47 | 3,810 | 3,750 | 60 | ||||||||||||||||||
| Expenses |
875 | 839 | 36 | 1,690 | 1,507 | 183 | ||||||||||||||||||
|
|
|
|
|
|
|
|
|
|
|
|
|
|||||||||||||
| Net Operating Income |
1,028 | 1,017 | 11 | 2,120 | 2,243 | (123 | ) | |||||||||||||||||
| — | ||||||||||||||||||||||||
|
|
|
|
|
|
|
|
|
|
|
|
|
|||||||||||||
| Net Operating Income (NOI), GAAP basis |
$ | 8,984 | $ | 9,425 | $ | (441 | ) | $ | 17,865 | $ | 18,772 | $ | (907 | ) | ||||||||||
|
|
|
|
|
|
|
|
|
|
|
|
|
|||||||||||||
| Net effect of straight-line rents |
(141 | ) | (366 | ) | 225 | (353 | ) | (787 | ) | 434 | ||||||||||||||
| Amortization of lease incentives |
206 | 182 | 24 | 402 | 364 | 38 | ||||||||||||||||||
|
|
|
|
|
|
|
|
|
|
|
|
|
|||||||||||||
| Same-store portfolio NOI, cash basis |
$ | 9,049 | $ | 9,241 | $ | (192 | ) | $ | 17,914 | $ | 18,349 | $ | (435 | ) | ||||||||||
|
|
|
|
|
|
|
|
|
|
|
|
|
|||||||||||||
| Cash Basis: |
||||||||||||||||||||||||
| Office |
$ | 4,237 | $ | 4,361 | $ | (124 | ) | $ | 8,447 | $ | 8,469 | $ | (22 | ) | ||||||||||
| Retail |
3,778 | 3,859 | (81 | ) | 7,335 | 7,631 | (296 | ) | ||||||||||||||||
| Multifamily |
1,034 | 1,021 | 13 | 2,132 | 2,249 | (117 | ) | |||||||||||||||||
|
|
|
|
|
|
|
|
|
|
|
|
|
|||||||||||||
| $ | 9,049 | $ | 9,241 | $ | (192 | ) | $ | 17,914 | $ | 18,349 | $ | (435 | ) | |||||||||||
|
|
|
|
|
|
|
|
|
|
|
|
|
|||||||||||||
| GAAP Basis: |
||||||||||||||||||||||||
| Office |
$ | 4,480 | $ | 4,762 | $ | (282 | ) | $ | 9,020 | $ | 9,309 | $ | (289 | ) | ||||||||||
| Retail |
3,476 | 3,646 | (170 | ) | 6,725 | 7,220 | (495 | ) | ||||||||||||||||
| Multifamily |
1,028 | 1,017 | 11 | 2,120 | 2,243 | (123 | ) | |||||||||||||||||
|
|
|
|
|
|
|
|
|
|
|
|
|
|||||||||||||
| $ | 8,984 | $ | 9,425 | $ | (441 | ) | $ | 17,865 | $ | 18,772 | $ | (907 | ) | |||||||||||
|
|
|
|
|
|
|
|
|
|
|
|
|
|||||||||||||
| (1) | No assets excluded |
| (2) | Bermuda Crossroads and Tyre Neck Harris Teeter excluded |
| (3) | Smith’s Landing excluded |
| Second Quarter 2013 Supplemental Information | Page 9 |
Portfolio Summary as of 6/30/2013
| Property |
Location |
Year Built | Net Rentable Square Feet(1) |
% Leased(2) | Annualized Base Rent(3) |
Annualized Base Rent per Leased Sq. Ft.(3) |
Average Net Effective Annual Base Rent per Leased Sq. Ft.(4) |
|||||||||||||||||||
| Office Properties |
||||||||||||||||||||||||||
| Armada Hoffler Tower(5) |
Virginia Beach, VA | 2002 | 328,436 | 95.9 | % | $ | 8,656,685 | $ | 27.49 | $ | 26.25 | |||||||||||||||
| One Columbus |
Virginia Beach, VA | 1984 | 129,424 | 95.6 | % | 2,836,177 | 22.92 | 23.22 | ||||||||||||||||||
| Two Columbus |
Virginia Beach, VA | 2009 | 109,215 | 82.3 | % | 2,229,517 | 24.82 | 25.23 | ||||||||||||||||||
| Virginia Natural Gas(6) |
Virginia Beach, VA | 2010 | 31,000 | 100.0 | % | 568,230 | 18.33 | 20.17 | ||||||||||||||||||
| Richmond Tower |
Richmond, VA | 2010 | 206,969 | 98.0 | % | 7,274,896 | 35.87 | 41.83 | ||||||||||||||||||
| Oyster Point |
Newport News, VA | 1989 | 100,214 | 79.8 | % | 1,719,733 | 21.50 | 21.23 | ||||||||||||||||||
| Sentara Williamsburg(6) |
Williamsburg, VA | 2008 | 49,200 | 100.0 | % | 1,006,140 | 20.45 | 20.50 | ||||||||||||||||||
|
|
|
|
|
|
|
|
|
|
|
|||||||||||||||||
| Subtotal / Weighted Average Office Portfolio(7) |
954,458 | 93.4 | % | $ | 24,291,378 | $ | 27.25 | $ | 28.29 | |||||||||||||||||
|
|
|
|
|
|
|
|
|
|
|
|||||||||||||||||
| Retail Properties Not Subject to Ground Lease |
||||||||||||||||||||||||||
| Bermuda Crossroads |
Chester, VA | 2001 | 111,566 | 95.4 | % | $ | 1,439,512 | $ | 13.52 | $ | 13.97 | |||||||||||||||
| Broad Creek Shopping Center |
Norfolk, VA | 1997-2001 | 227,750 | 96.8 | % | 2,919,295 | 13.25 | 12.90 | ||||||||||||||||||
| Courthouse 7-11 |
Virginia Beach, VA | 2011 | 3,177 | 100.0 | % | 125,000 | 39.35 | 43.81 | ||||||||||||||||||
| Gainsborough Square |
Chesapeake, VA | 1999 | 88,862 | 93.0 | % | 1,291,858 | 15.64 | 15.36 | ||||||||||||||||||
| Hanbury Village |
Chesapeake, VA | 2006-2009 | 61,049 | 88.7 | % | 1,345,808 | 24.87 | 23.86 | ||||||||||||||||||
| North Point Center |
Durham, NC | 1998-2009 | 215,689 | 93.1 | % | 2,362,403 | 11.76 | 11.34 | ||||||||||||||||||
| Parkway Marketplace |
Virginia Beach, VA | 1998 | 37,804 | 100.0 | % | 754,702 | 19.96 | 20.88 | ||||||||||||||||||
| Harrisonburg Regal |
Harrisonburg, VA | 1999 | 49,000 | 100.0 | % | 683,550 | 13.95 | 13.95 | ||||||||||||||||||
| Dick’s at Town Center |
Virginia Beach, VA | 2002 | 100,804 | 83.3 | % | 798,000 | 9.50 | 9.11 | ||||||||||||||||||
| 249 Central Park Retail |
Virginia Beach, VA(8) |
2004 | 92,515 | 100.0 | % | 2,552,830 | 27.59 | 26.98 | ||||||||||||||||||
| Studio 56 Retail |
Virginia Beach, VA | 2007 | 11,600 | 84.8 | % | 371,200 | 37.75 | 36.92 | ||||||||||||||||||
| Commerce Street Retail |
Virginia Beach, VA | 2008 | 20,123 | 100.0 | % | 792,313 | 39.37 | (9) | 39.67 | |||||||||||||||||
| Fountain Plaza Retail |
Virginia Beach, VA | 2004 | 35,961 | 100.0 | % | 972,021 | 27.03 | 25.40 | ||||||||||||||||||
| South Retail |
Virginia Beach, VA | 2002 | 38,763 | 100.0 | % | 837,358 | 21.60 | 21.06 | ||||||||||||||||||
|
|
|
|
|
|
|
|
|
|
|
|||||||||||||||||
| Subtotal / Weighted Avg Retail Portfolio not Subject to Ground Leases(10) |
|
1,094,663 | 94.6 | % | $ | 17,245,851 | $ | 16.65 | $ | 16.35 | ||||||||||||||||
|
|
|
|
|
|
|
|
|
|
|
|||||||||||||||||
| Retail Properties Subject to Ground Lease |
||||||||||||||||||||||||||
| Bermuda Crossroads(11) |
Chester, VA | 2001 | (13) | 100.0 | % | $ | 163,344 | |||||||||||||||||||
| Broad Creek Shopping Center(12) |
Norfolk, VA | 1997-2001 | (14) | 100.0 | % | 572,291 | ||||||||||||||||||||
| Hanbury Village(11) |
Chesapeake, VA | 2006-2009 | (15) | 100.0 | % | 1,067,598 | ||||||||||||||||||||
| North Point Center(11) |
Durham, NC | 1996-2009 | (16) | 100.0 | % | 1,048,175 | ||||||||||||||||||||
| Tyre Neck Harris Teeter(12) |
Chesapeake, VA | 2011 | (17) | 100.0 | % | 507,603 | ||||||||||||||||||||
|
|
|
|
|
|||||||||||||||||||||||
| Subtotal / Weighted Avg Retail Portfolio Subject to Ground Leases |
|
100.0 | % | $ | 3,359,012 | |||||||||||||||||||||
|
|
|
|
|
|
|
|
|
|
|
|||||||||||||||||
| Total / Weighted Avg Retail Portfolio |
1,094,663 | (18) | 94.6 | % | $ | 20,604,863 | $ | 16.65 | $ | 16.35 | ||||||||||||||||
|
|
|
|
|
|
|
|
|
|
|
|||||||||||||||||
| Total / Weighted Average Retail and Office Portfolio |
2,049,121 | 94.0 | % | $ | 44,896,241 | $ | 21.55 | $ | 21.91 | |||||||||||||||||
|
|
|
|
|
|
|
|
|
|
|
|||||||||||||||||
| Property |
Location |
Year Built | Units(19) | % Leased(2) | Annualized Base Rent(20) |
Average Monthly Base Rent per Leased Unit(21) |
||||||||||||||||
| Multifamily |
||||||||||||||||||||||
| Smith’s Landing(22) |
Blacksburg, VA | 2009 | 284 | 93.0 | % | $ | 3,273,291 | $ | 1,033.24 | |||||||||||||
| The Cosmopolitan |
Virginia Beach, VA | 2006 | 342 | 89.8 | % | 6,321,732 | (23) | 1,463.25 | ||||||||||||||
|
|
|
|
|
|
|
|
|
|||||||||||||||
| Total / Weighted Avg Multifamily Portfolio |
626 | 91.2 | % | $ | 9,595,023 | $ | 1,264.43 | |||||||||||||||
|
|
|
|
|
|
|
|
|
|||||||||||||||
| Second Quarter 2013 Supplemental Information | Page 10 |
Portfolio Definitions
| (1) | The net rentable square footage for each of our office properties is the sum of (a) the square footages of existing leases, plus (b) for available space, management’s estimate of net rentable square footage based, in part, on past leases. The net rentable square footage included in office leases is generally determined consistently with the Building Owners and Managers Association, or BOMA, 1996 measurement guidelines. The net rentable square footage for each of our retail properties is the sum of (a) the square footages of existing leases, plus (b) for available space, the field verified square footage. |
| (2) | Percentage leased for each of our office and retail properties is calculated as (a) square footage under commenced leases as of June 30, 2013, divided by (b) net rentable square feet, expressed as a percentage. Percentage leased for our multifamily properties is calculated as (a) total units rented as of June 30, 2013, divided by (b) total units available, expressed as a percentage. |
| (3) | For the properties in our office and retail portfolios, annualized base rent is calculated by multiplying (a) base rental payments (defined as cash base rents (before abatements) excluding tenant reimbursements for expenses paid by the landlord) for the month ended June 30, 2013, by (b) 12. Annualized base rent per leased square foot is calculated by dividing (a) annualized base rent, by (b) square footage under commenced leases as of June 30, 2013. In the case of triple net or modified gross leases, annualized base rent does not include tenant reimbursements for real estate taxes, insurance, common area or other operating expenses. |
| (4) | Average net effective annual base rent per leased square foot represents (a) the contractual base rent for leases in place as of June 30, 2013, calculated on a straight-line basis to amortize free rent periods and abatements, but without regard to tenant improvement allowances and leasing commissions, divided by (b) square footage under commenced leases as of June 30, 2013. |
| (5) | As of June 30, 2013, we occupied 16,151 square feet at this property at an annualized base rent of $484,853, or $30.02 per leased square foot, which amounts are reflected in the % leased, annualized base rent and annualized base rent per square foot columns in the table above. The rent paid by us is eliminated from our revenues in consolidation. In addition, effective March 1, 2013, we sublease approximately 5,000 square feet of space from a tenant at this property. |
| (6) | This property is subject to a triple net lease pursuant to which the tenant pays operating expenses, insurance and real estate taxes. |
| (7) | Includes square footage and annualized base rent pursuant to leases for space occupied by us. |
| (8) | As of June, 2013, we occupied 8,995 square feet at this property at an annualized base rent of $270,839, or $30.11 per leased square foot, which amounts are reflected in the % leased, annualized base rent and annualized base rent per square foot columns in the table above. The rent paid by us is eliminated from our revenues in consolidation. |
| (9) | Includes $31,200 of annualized base rent pursuant to a rooftop lease. |
| (10) | Reflects square footage and annualized base rent pursuant to leases for space occupied by us. |
| (11) | For this ground lease, we own the land and the tenant owns the improvements thereto. We will succeed to the ownership of the improvements to the land upon the termination of the ground lease. |
| (12) | We lease the land underlying this property from the owner of the land pursuant to a ground lease. We re-lease the land to our tenant under a separate ground lease pursuant to which our tenant owns the improvements on the land. |
| (13) | Tenants collectively lease approximately 139,356 square feet of land from us pursuant to ground leases. |
| (14) | Tenants collectively lease approximately 299,170 square feet of land from us pursuant to ground leases. |
| (15) | Tenants collectively lease approximately 105,988 square feet of land from us pursuant to ground leases. |
| (16) | Tenants collectively lease approximately 1,443,985 square feet of land from us pursuant to ground leases. |
| (17) | Tenant leases approximately 200,073 square feet of land from us pursuant to a ground lease. |
| (18) | The total square footage of our retail portfolio excludes the square footage of land subject to ground leases. |
| (19) | Units represent the total number of apartment units available for rent at June 30, 2013. |
| (20) | For the properties in our multifamily portfolio, annualized base rent is calculated by multiplying (a) base rental payments for the month ended June 30, 2013 by (b) 12. |
| (21) | Average monthly base rent per leased unit represents the average monthly rent for all leased units for the month ended June 30, 2013. |
| (22) | We lease the land underlying this property from the owner of the land pursuant to a ground lease. |
| (23) | The annualized base rent for The Cosmopolitan includes $931,125 of annualized rent from 15 retail leases at the property. |
| Second Quarter 2013 Supplemental Information | Page 11 |
Historical Occupancy
| Occupancy - All Properties as of | ||||||||||||
| Sector |
6/30/2013 | 3/31/2013 | 12/31/2012 | |||||||||
| Office(1) |
93.4 | % | 93.9 | % | 94.1 | % | ||||||
| Retail(1) |
94.6 | % | 93.9 | % | 93.9 | % | ||||||
| Multifamily(2) |
91.2 | % | 93.3 | % | 94.9 | % | ||||||
|
|
|
|
|
|
|
|||||||
|
Total(3) |
93.5 | % | 93.8 | % | 94.2 | % | ||||||
|
|
|
|
|
|
|
|||||||
| (1) | Office and retail occupancy based on occupied square feet as a % of respective total |
| (2) | Multifamily occupancy based on weighted average of total units |
| (3) | Total occupancy weighted by annualized base rent |
| Second Quarter 2013 Supplemental Information | Page 12 |
Multifamily Occupancy Summary
| Occupancy Summary - Smiths Landing |
||||||||||||||||
| Quarter Ended |
Number of Units Occupied | Percentage Occupied(1) | Annualized Base Rent(2) | Average Monthly Rent per Occupied Unit |
||||||||||||
| 6/30/2013(4) |
264 | 93.0 | % | $ | 3,273,291 | $ | 1,033.24 | |||||||||
| 3/31/2013 |
284 | 100.0 | % | $ | 3,354,463 | $ | 984.29 | |||||||||
| 12/31/2012 |
280 | 98.6 | % | $ | 3,305,046 | $ | 983.64 | |||||||||
| Occupancy Summary - The Cosmopolitan |
||||||||||||||||
| Quarter Ended |
Number of Units Occupied | Percentage Occupied(1) | Annualized Base Rent(2)(3) | Average Monthly Rent per Occupied Unit |
||||||||||||
| 6/30/2013 |
307 | 89.9 | % | $ | 5,390,607 | $ | 1,463.25 | |||||||||
| 3/31/2013 |
300 | 87.7 | % | $ | 5,642,035 | $ | 1,567.23 | |||||||||
| 12/31/2012 |
314 | 91.8 | % | $ | 5,636,650 | $ | 1,494.50 | |||||||||
| (1) | Total units rented as of each respective quarter end date |
| (2) | Annualized base rent is calculated by multiplying base rental payments for each of the last month of the respective quarter multiplied by 12 |
| (3) | Excludes annualized base rent from retail leases |
| Second Quarter 2013 Supplemental Information | Page 13 |
Historical Office Lease Retention and Tenant Improvement and Leasing Commission Costs
The following table sets forth certain historical information regarding tenant improvement and leasing commission costs per square foot at the properties in our office portfolio for the three months ended 6/30/2013:
| Three months ended | ||||
| 6/30/2013 | ||||
| Expirations |
||||
| Number of Leases expired during the applicable period |
4 | |||
| Aggregate net rentable square footage of expiring leases(1) |
16,635 | |||
| Renewals |
||||
| Number of Leases renewed during the applicable period |
5 | |||
| Aggregate net rentable square footage of renewed leases |
29,725 | |||
| Retention percentage by square feet |
76.1 | % | ||
| Tenant improvement costs(2) |
$ | 309,426 | ||
| Leasing commission costs(2) |
171,963 | |||
|
|
|
|||
| Total tenant improvements and leasing commission costs |
$ | 481,389 | ||
|
|
|
|||
| Tenant improvement costs per square foot |
$ | 10.41 | ||
| Leasing commission costs per square foot |
$ | 5.79 | ||
|
|
|
|||
| Total tenant improvements and leasing commission costs per square foot |
$ | 16.19 | ||
|
|
|
|||
| New Leases |
||||
| Number of New Leases |
2 | |||
| Square Feet |
4,046 | |||
| Tenant improvement costs(2) (3) |
$ | 155,148 | ||
| Leasing commission costs(2) |
10,480 | |||
|
|
|
|||
| Total tenant improvements and leasing commission costs |
$ | 165,628 | ||
|
|
|
|||
| Tenant improvement costs per square foot |
$ | 38.35 | ||
| Leasing commission costs per square foot |
$ | 2.59 | ||
|
|
|
|||
| Total tenant improvements and leasing commission costs per square foot |
$ | 40.94 | ||
|
|
|
|||
| Total Tenant Improvements and Leasing Commissions |
||||
| Square feet |
33,771 | |||
| Tenant improvement costs(2) (3) |
$ | 464,574 | ||
| Leasing commission costs(2) |
182,443 | |||
|
|
|
|||
| Total tenant improvement and leasing commission costs |
$ | 647,017 | ||
|
|
|
|||
| Tenant improvement costs per square foot(2) (3) |
$ | 13.76 | ||
| Leasing commission costs per square foot(2) |
$ | 5.40 | ||
|
|
|
|||
| Total tenant improvement and leasing commission costs per square foot |
$ | 19.16 | ||
|
|
|
|||
| (1) | Excludes properties subject to ground lease |
| (2) | Reflects tenant improvement and leasing commissions incurred during the three months ended 6/30/13, which may be different than the period in which the lease commenced |
| (3) | Excludes $27.39 PSF for landward base building work above ceiling related to a 1,400 SF lease at Two Columbus |
| Second Quarter 2013 Supplemental Information | Page 14 |
Historical Retail Lease Retention and Tenant Improvement and Leasing Commission Costs
The following table sets forth certain historical information regarding tenant improvement and leasing commission costs per square foot at the properties in our retail portfolio for the three months ended 6/30/2013:
| Three months ended | ||||
| 6/30/2013 | ||||
| Expirations |
||||
| Number of Leases expired during the applicable period |
3 | |||
| Aggregate net rentable square footage of expiring leases(1) |
7,728 | |||
| Renewals |
||||
| Number of Leases renewed during the applicable period |
6 | |||
| Aggregate net rentable square footage of renewed leases |
26,345 | |||
| Retention percentage by square feet |
100.0 | % | ||
| Tenant improvement costs(2) |
$ | 0 | ||
| Leasing commission costs(2) |
0 | |||
|
|
|
|||
| Total tenant improvements and leasing commission costs |
$ | 0 | ||
|
|
|
|||
| Tenant improvement costs per square foot |
$ | 0.00 | ||
| Leasing commission costs per square foot |
$ | 0.00 | ||
|
|
|
|||
| Total tenant improvements and leasing commission costs per square foot |
$ | 0.00 | ||
|
|
|
|||
| New Leases |
||||
| Number of New Leases |
7 | |||
| Square Feet |
20,037 | |||
| Tenant improvement costs(2) |
$ | 317,000 | ||
| Leasing commission costs(2) |
116,101 | |||
|
|
|
|||
| Total tenant improvements and leasing commission costs |
$ | 433,101 | ||
|
|
|
|||
| Tenant improvement costs per square foot |
$ | 15.82 | ||
| Leasing commission costs per square foot |
$ | 5.79 | ||
|
|
|
|||
| Total tenant improvements and leasing commission costs per square foot |
$ | 21.62 | ||
|
|
|
|||
| Total Tenant Improvements and Leasing Commissions |
||||
| Square feet |
46,382 | |||
| Tenant improvement costs(2) |
$ | 317,000 | ||
| Leasing commission costs(2) |
116,101 | |||
|
|
|
|||
| Total tenant improvement and leasing commission costs |
$ | 433,101 | ||
|
|
|
|||
| Tenant improvement costs per square foot(2) |
$ | 6.83 | ||
| Leasing commission costs per square foot(2) |
$ | 2.50 | ||
|
|
|
|||
| Total tenant improvement and leasing commission costs per square foot |
$ | 9.34 | ||
|
|
|
|||
| (1) | Excludes properties subject to ground lease |
| (2) | Reflects tenant improvement and leasing commissions incurred during the three months ended 6/30/13, which may be different than the period in which the lease commenced |
| Second Quarter 2013 Supplemental Information | Page 15 |
Top 10 Tenants by Annualized Base Rent as of 6/30/2013
| Office Portfolio |
||||||||||||||||||||||
| Tenant |
Number of Leases |
Number of Properties |
Property(ies) |
Lease Expiration |
Weighted Annualized Base Rent |
% of Office Portfolio Annualized Base Rent |
% of Total Portfolio Annualized Base Rent |
|||||||||||||||
| Williams Mullen | 3 | 2 | Armada Hoffler Tower, Richmond Tower | 3/19/2026 | $ | 7,779,349 | 32.0 | % | 14.3 | % | ||||||||||||
| Troutman Sanders LLP | 1 | 1 | Armada Hoffler Tower | 1/31/2015 | 1,026,938 | 4.2 | % | 1.9 | % | |||||||||||||
| Sentara Medical Group | 1 | 1 | Sentara Williamsburg | 3/31/2023 | 1,006,140 | 4.1 | % | 1.8 | % | |||||||||||||
| Pender & Coward | 2 | 1 | Armada Hoffler Tower | 1/31/2015 | 972,179 | 4.0 | % | 1.8 | % | |||||||||||||
| Cherry, Bekaert & Holland, LLP | 3 | 3 | Armada Hoffler Tower, Richmond Tower, Oyster Point | 9/21/2022 | 932,547 | 3.8 | % | 1.7 | % | |||||||||||||
| GSA-USAF | 1 | 1 | Oyster Point | 4/26/2017 | 870,047 | 3.6 | % | 1.6 | % | |||||||||||||
| The Art Institute | 1 | 1 | Two Columbus | 12/31/2019 | 771,898 | 3.2 | % | 1.4 | % | |||||||||||||
| Hampton University | 2 | 1 | Armada Hoffler Tower | 5/3/2023 | 629,935 | 2.6 | % | 1.2 | % | |||||||||||||
| Virginia Natural Gas | 1 | 1 | Virginia Natural Gas Headquarters | 9/30/2025 | 568,230 | 2.3 | % | 1.0 | % | |||||||||||||
| Hankins & Anderson | 1 | 1 | Armada Hoffler Tower | 4/30/2022 | 562,363 | 2.3 | % | 1.0 | % | |||||||||||||
|
|
|
|
|
|
|
|||||||||||||||||
| Top 10 Total | $ | 15,119,627 | 62.2 | % | 27.7 | % | ||||||||||||||||
|
|
|
|
|
|
|
|||||||||||||||||
| Retail Portfolio |
||||||||||||||||||||||
| Tenant |
Number of Leases |
Number of Properties |
Property(ies) |
Lease Expiration |
Weighted Annualized Base Rent |
% of Retail Portfolio Annualized Base Rent |
% of Total Portfolio Annualized Base Rent |
|||||||||||||||
| Home Depot | 2 | 2 | Broad Creek Shopping Center, North Point Center | 12/27/2019 | $ | 2,032,600 | 9.9 | % | 3.7 | % | ||||||||||||
| Harris Teeter | 2 | 2 | Tyre Neck Harris Teeter, Hanbury Village | 10/15/2028 | 1,430,001 | 6.9 | % | 2.6 | % | |||||||||||||
| Food Lion | 3 | 3 | Broad Creek Shopping Center, Bermuda Crossroads, Gainsborough Square | 3/19/2020 | 1,282,568 | 6.2 | % | 2.4 | % | |||||||||||||
| Dick’s Sporting Goods | 1 | 1 | Dick’s at Town Center | 1/31/2020 | 798,000 | 3.9 | % | 1.5 | % | |||||||||||||
| Regal Cinemas | 1 | 1 | Harrisonburg Regal | 4/23/2019 | 683,550 | 3.3 | % | 1.3 | % | |||||||||||||
| PetsMart | 2 | 2 | Broad Creek Shopping Center, North Point Center | 2/7/2016 | 618,704 | 3.0 | % | 1.1 | % | |||||||||||||
| Kroger | 1 | 1 | North Point Center | 8/31/2018 | 552,864 | 2.7 | % | 1.0 | % | |||||||||||||
| Yard House | 1 | 1 | Commerce Street Retail | 11/30/2023 | 538,000 | 2.6 | % | 1.0 | % | |||||||||||||
| Rite Aid | 2 | 2 | Gainsborough Square, Parkway Marketplace | 5/29/2019 | 484,193 | 2.3 | % | 0.9 | % | |||||||||||||
| Walgreens | 1 | 1 | Hanbury Village | 12/31/2083 | 447,564 | 2.2 | % | 0.8 | % | |||||||||||||
|
|
|
|
|
|
|
|||||||||||||||||
| Top 10 Total |
$ | 8,868,044 | 43.0 | % | 16.3 | % | ||||||||||||||||
|
|
|
|
|
|
|
|||||||||||||||||
| Second Quarter 2013 Supplemental Information | Page 16 |
Lease Expirations for Office Portfolio
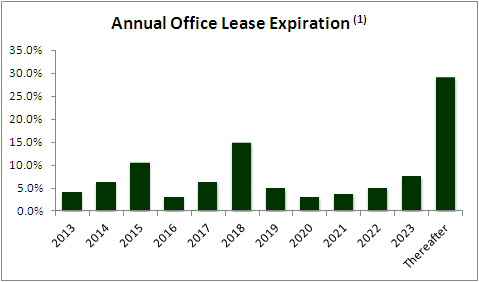
| Year of Lease Expiration |
Number of Leases Expiring |
Square Footage of Leases Expiring |
% Portfolio Net Rentable Square Feet |
Annualized Base Rent |
% of Portfolio Annualized Base Rent |
Annualized Base Rent per Leased Square Foot |
||||||||||||||||||
| Available |
— | 63,047 | 6.6 | % | $ | — | — | $ | 0.00 | |||||||||||||||
| 2013 |
7 | 34,608 | 3.6 | % | 1,020,231 | 4.2 | % | 29.48 | ||||||||||||||||
| 2014 |
14 | 59,226 | 6.2 | % | 1,545,787 | 6.4 | % | 26.10 | ||||||||||||||||
| 2015 |
9 | 96,577 | 10.1 | % | 2,587,380 | 10.7 | % | 26.79 | ||||||||||||||||
| 2016 |
10 | 33,481 | 3.5 | % | 781,772 | 3.2 | % | 23.35 | ||||||||||||||||
| 2017 |
4 | 64,589 | 6.8 | % | 1,555,767 | 6.4 | % | 24.09 | ||||||||||||||||
| 2018 |
13 | 139,177 | 14.6 | % | 3,653,770 | 15.0 | % | 26.25 | ||||||||||||||||
| 2019 |
4 | 54,264 | 5.7 | % | 1,235,086 | 5.1 | % | 22.76 | ||||||||||||||||
| 2020 |
3 | 25,283 | 2.6 | % | 769,811 | 3.2 | % | 30.45 | ||||||||||||||||
| 2021 |
4 | 41,363 | 4.3 | % | 938,151 | 3.9 | % | 22.68 | ||||||||||||||||
| 2022 |
3 | 48,117 | 5.0 | % | 1,258,877 | 5.2 | % | 26.16 | ||||||||||||||||
| 2023 |
4 | 89,009 | 9.3 | % | 1,864,058 | 7.7 | % | 20.94 | ||||||||||||||||
| Thereafter |
5 | 205,717 | 21.6 | % | 7,080,688 | 29.1 | % | 34.42 | ||||||||||||||||
|
|
|
|
|
|
|
|
|
|
|
|
|
|||||||||||||
| Total / Weighted Average |
80 | 954,458 | 100.0 | % | $ | 24,291,378 | 100.0 | % | $ | 27.25 | ||||||||||||||
|
|
|
|
|
|
|
|
|
|
|
|
|
|||||||||||||
| (1) | Annualized base rent as of 6/30/13 |
| Second Quarter 2013 Supplemental Information | Page 17 |
Lease Expirations for Retail Portfolio
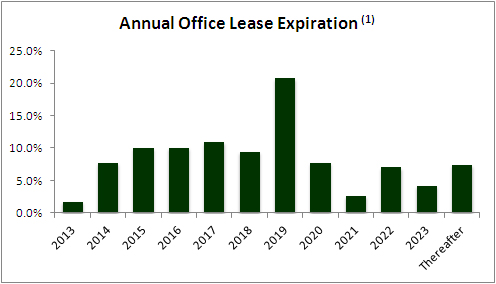
| Year of Lease Expiration |
Number of Leases Expiring |
Square Footage of Leases Expiring |
% Portfolio Net Rentable Square Feet |
Annualized Base Rent |
% of Portfolio Annualized Base Rent |
Annualized Base Rent per Leased Square Foot |
||||||||||||||||||
| Available |
— | 58,992 | 5.4 | % | $ | — | — | $ | 0.00 | |||||||||||||||
| 2013 |
11 | 16,725 | 1.5 | % | 308,903 | 1.8 | % | 18.47 | ||||||||||||||||
| 2014 |
19 | 59,277 | 5.4 | % | 1,335,031 | 7.7 | % | 22.52 | ||||||||||||||||
| 2015 |
19 | 93,011 | 8.5 | % | 1,728,906 | 10.0 | % | 18.59 | ||||||||||||||||
| 2016 |
23 | 75,645 | 6.9 | % | 1,742,502 | 10.1 | % | 23.04 | ||||||||||||||||
| 2017 |
19 | 135,545 | 12.4 | % | 1,890,547 | 11.0 | % | 13.95 | ||||||||||||||||
| 2018 |
16 | 115,194 | 10.5 | % | 1,630,659 | 9.5 | % | 14.16 | ||||||||||||||||
| 2019 |
12 | 269,729 | 24.6 | % | 3,584,803 | 20.8 | % | 13.29 | ||||||||||||||||
| 2020 |
5 | 105,946 | 9.7 | % | 1,343,863 | 7.8 | % | 12.68 | ||||||||||||||||
| 2021 |
3 | 15,068 | 1.4 | % | 455,649 | 2.6 | % | 30.24 | ||||||||||||||||
| 2022 |
6 | 83,588 | 7.6 | % | 1,214,794 | 7.0 | % | 14.53 | ||||||||||||||||
| 2023 |
4 | 23,792 | 2.2 | % | 726,576 | 4.2 | % | 30.54 | ||||||||||||||||
| Thereafter |
5 | 42,151 | 3.9 | % | 1,283,617 | 7.4 | % | 30.45 | ||||||||||||||||
|
|
|
|
|
|
|
|
|
|
|
|
|
|||||||||||||
| Total / Weighted Average |
142 | 1,094,663 | 100.0 | % | $ | 17,245,851 | 100.0 | % | $ | 16.65 | ||||||||||||||
|
|
|
|
|
|
|
|
|
|
|
|
|
|||||||||||||
| (1) | Annualized base rent as of 6/30/13 |
| Second Quarter 2013 Supplemental Information | Page 18 |
Development Pipeline
$ in thousands
| Property |
Location | Property Type | Estimated Square Footage(1) |
Estimated Apartment Units(1) |
Estimated Cost(1) |
Cost Incurred through June 30, 2013 |
Estimated
Date of Completion(1) |
Estimated Ownership %(1) |
Principal Tenants | |||||||||||||||||||
| Main Street Office(2) |
Virginia Beach, VA | Office | 234,000 | (3) | N/A | $ | 50,863 | $ | 7,535 | July 2014 | 100 | % | Clark Nexsen, Development Authority of Virginia Beach | |||||||||||||||
| Main Street |
Virginia Beach, VA | Multifamily | N/A | 288 | 32,845 | 2,688 | July 2014 | 100 | % | N/A | ||||||||||||||||||
| Jackson Street Apartments |
Durham, NC | Multifamily | N/A | 203 | 27,857 | 3,004 | August 2014 | 100 | % | N/A | ||||||||||||||||||
| Sandbridge Commons |
Virginia Beach, VA | Retail | 75,000 | N/A | 13,675 | 645 | September 2014 | 85 | % | Harris Teeter | ||||||||||||||||||
| Brooks Crossing |
Virginia Beach, VA | Office | 60,000 | N/A | 12,793 | 672 | February 2015 | 65 | % | Huntington Ingalls(4), City of Newport News(4) | ||||||||||||||||||
| Greentree Shopping Center(5) |
Chesapeake, VA | Retail | 15,600 | N/A | 5,402 | 412 | September 2014 | 100 | % | Wawa | ||||||||||||||||||
|
|
|
|
|
|
|
|
|
|||||||||||||||||||||
| 384,600 | 491 | $ | 143,435 | $ | 14,956 | |||||||||||||||||||||||
|
|
|
|
|
|
|
|
|
|||||||||||||||||||||
| (1) | Represents estimates that may change as the development process proceeds |
| (2) | This property will be located within the Virginia Beach Town Center |
| (3) | 82,645 square feet is leased to Clark Nexsen, an architectural firm and approximately 23,300 square feet is leased to the Development Authority of Virginia Beach |
| (4) | No lease agreement has been signed |
| (5) | We have a contract to sell Wal-Mart a pad-ready site adjacent to Greentree Shopping Center |
| Second Quarter 2013 Supplemental Information | Page 19 |
Market Capitalization
$ in thousands, except per share data
| Market Data |
June 30, 2013 | |||
| Common shares outstanding |
19,163,705 | |||
| Common units outstanding |
13,059,365 | |||
|
|
|
|||
| Common shares and common units outstanding |
32,223,070 | |||
| Market price per common share |
$ | 11.78 | ||
| Equity market capitalization |
379,588 | |||
| Total debt |
244,336 | |||
|
|
|
|||
| Total market capitalization |
$ | 623,924 | ||
| Less: cash on hand |
(17,854 | ) | ||
|
|
|
|||
| Total enterprise value |
$ | 606,070 | ||
|
|
|
|||
| Total assets, gross |
$ | 497,543 | ||
|
|
|
|||
| Total debt/Total capitalization |
39.2 | % | ||
| Total debt/Total enterprise value |
40.3 | % | ||
| Total debt/Total assets, gross |
49.1 | % | ||
| Second Quarter 2013 Supplemental Information | Page 20 |
Summary of Outstanding Debt
$ in thousands
| Debt |
Amount Outstanding |
Interest Rate(1) | Effective Rate as of June 30, 2013 |
Maturity Date | Balance at Maturity | |||||||||||||||
| Oyster Point |
$ | 6,558 | 5.41 | % | December 1, 2015 | $ | 6,089 | |||||||||||||
| One Columbus |
13,955 | 5.31 | % | December 11, 2014 | 13,542 | |||||||||||||||
| Broad Creek Shopping Center |
||||||||||||||||||||
| Note 1 |
4,528 | LIBOR 3.00 | % | 3.19 | % | November 29, 2014 | 4,454 | |||||||||||||
| Note 2 |
8,313 | LIBOR+2.75 | % | 2.94 | % | December 7, 2016 | 7,947 | |||||||||||||
| Note 3 |
3,481 | LIBOR+2.75 | % | 2.94 | % | December 7, 2016 | 3,327 | |||||||||||||
| Hanbury Village |
||||||||||||||||||||
| Note 1 |
21,558 | 6.67 | % | October 11, 2017 | 20,499 | |||||||||||||||
| Note 2 |
4,309 | LIBOR+2.75 | % | 2.94 | % | February 28, 2015 | 4,226 | |||||||||||||
| Harrisonburg Regal |
3,930 | 6.06 | % | June 8, 2017 | 3,165 | |||||||||||||||
| North Point Center |
||||||||||||||||||||
| Note 1 |
10,400 | 6.45 | % | February 5, 2019 | 9,333 | |||||||||||||||
| Note 2 |
2,877 | 7.25 | % | September 15, 2015 | 1,344 | |||||||||||||||
| Note 4 |
1,042 | 5.59 | % | December 1, 2014 | 1,007 | |||||||||||||||
| Note 5 |
714 | LIBOR+2.00 | % | 3.57 | %(2) | February 1, 2017 | 641 | |||||||||||||
| Tyre Neck Harris Teeter |
2,650 | LIBOR+2.75 | % | 2.94 | % | June 10, 2014 | 2,650 | |||||||||||||
| 249 Central Park Retail |
15,960 | 5.99 | % | September 8, 2016 | 15,084 | |||||||||||||||
| South Retail |
7,041 | 5.99 | % | September 8, 2016 | 6,655 | |||||||||||||||
| Studio 56 Retail |
2,725 | 3.75 | % | May 7, 2015 | 2,592 | |||||||||||||||
| Commerce Street Retail |
6,771 | LIBOR+3.00 | % | 3.19 | % | August 18, 2014 | 6,694 | |||||||||||||
| Fountain Plaza Retail |
7,980 | 5.99 | % | September 8, 2016 | 7,542 | |||||||||||||||
| Dick’s at Town Center |
8,366 | LIBOR+2.75 | % | 2.94 | % | October 31, 2017 | 7,929 | |||||||||||||
| The Cosmopolitan |
48,010 | 3.75 | % | July 1, 2051 | — | |||||||||||||||
| Bermuda Crossroads |
10,834 | (4) | 6.01 | % | January 1, 2014 | 10,710 | ||||||||||||||
| Smith’s Landing |
24,945 | (4) | LIBOR+2.15 | % | 2.34 | % | January 31, 2014 | 24,770 | ||||||||||||
| Main Street Land |
2,208 | LIBOR+2.50 | % | 4.00 | %(3) | July 3, 2013 | 2,208 | |||||||||||||
|
|
|
|
|
|||||||||||||||||
| 219,155 | 162,408 | |||||||||||||||||||
| Credit Facility |
25,000 | LIBOR + 1.60% - 2.20 | % | 2.39 | %(5) | May 13, 2016 | 25,000 | |||||||||||||
|
|
|
|
|
|||||||||||||||||
| Total |
$ | 244,155 | $ | 187,408 | ||||||||||||||||
|
|
|
|||||||||||||||||||
| Unamortized fair value adjustment |
181 | |||||||||||||||||||
|
|
|
|||||||||||||||||||
| Indebtedness |
$ | 244,336 | ||||||||||||||||||
|
|
|
|||||||||||||||||||
|
|
||||||||||||
| (1) LIBOR rate is determined by individual lenders. |
Weighted Average Interest Rate |
4.48 | % | |||||||||
| (2) Subject to an interest rate swap lock. |
Variable Interest Rate as a % of Total |
37.10 | % | |||||||||
| (3) Subject to an interest rate floor. |
Weighted Average Maturity (years) |
9.56 | ||||||||||
| (4) Principal balance excluding any fair value adjustment that was recognized upon acquisition. |
||||||||||||
| (5) Decreased to 1.94% as of 7/16/13. |
||||||||||||
| Second Quarter 2013 Supplemental Information | Page 21 |
Definitions
Core Funds From Operations:
We calculate Core Funds From Operations (“Core FFO”) as FFO calculated in accordance with the standards established by NAREIT, adjusted for losses on debt extinguishments, non-cash stock compensation and impairment charges. Such items are non-recurring or non-cash in nature.
Management believes that the computation of FFO in accordance to NAREIT’s definition includes certain items that are not indicative of the results provided by the Company’s operating portfolio and affect the comparability of the Company’s period-over-period performance. Our calculation of Core FFO differs from NAREIT’s definition of FFO. Other equity REITs may not calculate Core FFO in the same manner as us, and, accordingly, our Core FFO may not be comparable to other REITs’ Core FFO.
Funds From Operations:
We calculate Funds From Operations (“FFO”) in accordance with the standards established by the National Association of Real Estate Investment Trusts (“NAREIT”). NAREIT defines FFO as net income (loss) (calculated in accordance with accounting principles generally accepted in the United States (“GAAP”)), excluding gains (or losses) from sales of depreciable operating property, real estate related depreciation and amortization (excluding amortization of deferred financing costs) and after adjustments for unconsolidated partnerships and joint ventures.
FFO is a supplemental non-GAAP financial measure. Management uses FFO as a supplemental performance measure because it believes that FFO is beneficial to investors as a starting point in measuring our operational performance. Specifically, in excluding real estate related depreciation and amortization and gains and losses from property dispositions, which do not relate to or are not indicative of operating performance, FFO provides a performance measure that, when compared year over year, captures trends in occupancy rates, rental rates and operating costs. Other equity REITs may not calculate FFO in accordance with the NAREIT definition as we do, and, accordingly, our FFO may not be comparable to such other REITs’ FFO.
| Second Quarter 2013 Supplemental Information | Page 22 |
Definitions
Net Operating Income:
We calculate Net Operating Income (“NOI”) as property revenues (base rent, expense reimbursements and other revenue) less property expenses (rental expenses and real estate taxes). For our office, retail and multifamily segments, NOI excludes general contracting and real estate services expenses, depreciation and amortization, general and administrative expenses, and impairment charges. Other REITs may use different methodologies for calculating NOI, and accordingly, our NOI may not be comparable to such other REITs’ NOI. NOI is not a measure of operating income or cash flows from operating activities as measured by GAAP and is not indicative of cash available to fund cash needs. As a result, net operating income should not be considered an alternative to cash flows as a measure of liquidity. We consider NOI to be an appropriate supplemental measure to net income because it assists both investors and management in understanding the core operations of our real estate business.
Same Store Portfolio:
We define same store properties as including those properties that were owned and operated for the entirety of the period being presented and excluding properties that were in lease-up during the period present. We generally consider a property to be in lease-up until the earlier of (i) the quarter after which the property reaches 80% occupancy or (ii) the thirteenth quarter after the property receives its certificate of occupancy. The following table shows the properties included in the same store and non-same store portfolio for the comparative periods presented.
| Second Quarter 2013 Supplemental Information | Page 23 |
Definitions
| Comparison of Three Months Ended June 30, 2013 to 2012 |
Comparison of Six Months Ended June 30, 2013 to 2012 | |||||||
| Same Store | Non-Same Store | Same Store | Non-Same Store | |||||
| Office Properties |
||||||||
| Armada Hoffler Tower |
X | X | ||||||
| One Columbus |
X | X | ||||||
| Two Columbus |
X | X | ||||||
| Virginia Natural Gas |
X | X | ||||||
| Richmond Tower |
X | X | ||||||
| Oyster Point |
X | X | ||||||
| Sentara Williamsburg |
X | X | ||||||
| Retail Properties |
||||||||
| Bermuda Crossroads |
X | X | ||||||
| Broad Creek Shopping Center |
X | X | ||||||
| Courthouse 7-Eleven |
X | X | ||||||
| Gainsborough Square |
X | X | ||||||
| Hanbury Village |
X | X | ||||||
| North Point Center |
X | X | ||||||
| Parkway Marketplace |
X | X | ||||||
| Harrisonburg Regal |
X | X | ||||||
| Dick’s at Town Center |
X | X | ||||||
| 249 Central Park Retail |
X | X | ||||||
| Studio 56 Retail |
X | X | ||||||
| Commerce Street Retail |
X | X | ||||||
| Fountain Plaza Retail |
X | X | ||||||
| South Retail |
X | X | ||||||
| Tyre Neck Harris Teeter |
X | X | ||||||
| Multifamily |
||||||||
| Smith’s Landing |
X | X | ||||||
| The Cosmopolitan |
X | X | ||||||
| Second Quarter 2013 Supplemental Information | Page 24 |