Attached files
| file | filename |
|---|---|
| 8-K - 8-K - PNMAC Holdings, Inc. | a13-18483_18k.htm |
| EX-99.1 - EX-99.1 - PNMAC Holdings, Inc. | a13-18483_1ex99d1.htm |
Exhibit 99.2
|
|
Second Quarter 2013 Earnings Report |

|
|
Forward Looking Statements 1 This presentation contains forward-looking statements within the meaning of Section 21E of the Securities Exchange Act of 1934, as amended, regarding management’s beliefs, estimates, projections and assumptions with respect to, among other things, the Company’s financial results, future operations, business plans and investment strategies, as well as industry and market conditions, all of which are subject to change. Words like “believe,” “expect,” “anticipate,” “promise,” “plan,” and other expressions or words of similar meanings, as well as future or conditional verbs such as “will,” “would,” “should,” “could,” or “may” are generally intended to identify forward-looking statements. Actual results and operations for any future period may vary materially from those projected herein, from past results discussed herein, or from illustrative examples provided herein. Factors which could cause actual results to differ materially from historical results or those anticipated include, but are not limited to: changes in federal, state and local laws and regulations applicable to the highly regulated industry in which we operate; lawsuits or governmental actions if we do not comply with the laws and regulations applicable to our businesses; the creation of the Consumer Financial Protection Bureau, or CFPB, and enforcement of its rules; changes in existing U.S. government-sponsored entities, their current roles or their guarantees or guidelines; changes to government mortgage modification programs; the licensing and operational requirements of states and other jurisdictions applicable to our businesses, to which our bank competitors are not subject; foreclosure delays and changes in foreclosure practices; certain banking regulations that may limit our business activities; changes in macroeconomic and U.S. residential real estate market conditions; difficulties in growing loan production volume; changes in prevailing interest rates; increases in loan delinquencies and defaults; our reliance on PennyMac Mortgage Investment Trust as a significant source of financing for, and revenue related to, our correspondent lending business; availability of required additional capital and liquidity to support business growth; our obligation to indemnify third-party purchasers or repurchase loans that we originate, acquire or assist in with fulfillment; our obligation to indemnify advised entities or investment funds to meet certain criteria or characteristics or under other circumstances; decreases in the historical returns on the assets that we select and manage for our clients, and our resulting management and incentive fees; regulation applicable to our investment management segment; conflicts of interest in allocating our services and investment opportunities among ourselves and our advised entities; the potential damage to our reputation and adverse impact to our business resulting from ongoing negative publicity; and our rapid growth. You should not place undue reliance on any forward-looking statement and should consider all of the uncertainties and risks described above, as well as those more fully discussed in reports and other documents filed by the Company with the Securities and Exchange Commission from time to time. The Company undertakes no obligation to publicly update or revise any forward-looking statements or any other information contained herein, and the statements made in this presentation are current as of the date of this presentation only. |
|
|
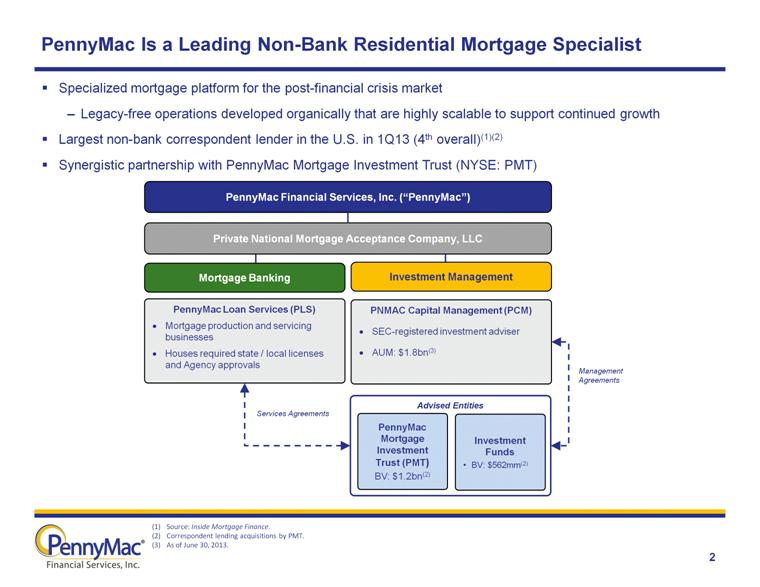
PennyMac Is a Leading Non-Bank Residential Mortgage Specialist 2 Management Agreements Services Agreements Mortgage Banking PennyMac Loan Services (PLS) Mortgage production and servicing businesses Houses required state / local licenses and Agency approvals PNMAC Capital Management (PCM) SEC-registered investment adviser AUM: $1.8bn(3) PennyMac Mortgage Investment Trust (PMT) BV: $1.2bn(2) Investment Funds BV: $562mm(2) Advised Entities Private National Mortgage Acceptance Company, LLC Investment Management PennyMac Financial Services, Inc. (“PennyMac”) Specialized mortgage platform for the post-financial crisis market Legacy-free operations developed organically that are highly scalable to support continued growth Largest non-bank correspondent lender in the U.S. in 1Q13 (4th overall)(1)(2) Synergistic partnership with PennyMac Mortgage Investment Trust (NYSE: PMT) Source: Inside Mortgage Finance. Correspondent lending acquisitions by PMT. As of June 30, 2013. |
|
|
PFSI Has a Unique Business Model With Diverse Revenue Sources 3 Loan Production Loan Servicing Investment Management Gain on mortgage loans: Retail lending and government-insured correspondent acquisitions Fulfillment fees from PMT’s correspondent acquisitions Loan origination fees Servicing fees on owned MSRs Subservicing fees from Advised Entities Ancillary income Management fees from Advised Entities Performance-based incentive fees from PMT Carried Interest from Investment Funds Significant portions of PFSI’s revenues are cash-based, recurring fees |
|
|
Market Outlook 4 Loan Production Competition Jumbo Loans Mortgage Rates and Housing Increased mortgage rates have significantly reduced refinance activity since early May Total mortgage originations forecast to decline from ~$1 trillion in 1H13 to $500 - $700 billion in 2H13(1) Affordability remains near all-time highs despite higher mortgage rates Demand for homes remains strong and inventory remains low Margins continue to decline from historically elevated levels as the origination market contracts Opportunities remain to capture share, but heightened importance of disciplined pricing and execution to maintain profitability More originators shifting from retaining servicing to selling loans servicing-released may drive increased correspondent channel share Pipeline of NPL opportunities remains robust with additional sellers emerging Interest rate increases not a significant event for NPLs; home price expectations are the more relevant driver Opportunity expected to remain strong through 2014 Distressed Whole Loans Decreased refinance activity adversely impacts jumbo market Spread widening has affected the economics of private-label securitization Remain opportunistic over the long term that jumbo loans and private-label securitization should expand (1) Source: Freddie Mac, Fannie Mae and Mortgage Bankers Association mortgage market forecasts, as of July 2013. Mortgage Servicing Rights Several large bulk legacy portfolios coming to market, including new bank sellers Continue to evaluate mini-bulk and flow opportunities PMT would co-invest with PLS in the form of excess I/O investment |
|
|
2013 Origination Estimates(1) Rising Rates Present Challenges, But PFSI Remains Well Positioned 5 Industry forecasts for the second half of 2013 show origination volumes declining by an average of 36% compared to the first half of the year Purchase volume forecast to grow 16% Refinance volume forecast to decline 56% Rising rates on fixed-rate mortgages have made adjustable-rate and hybrid products more attractive PFSI’s business model is well-positioned to address market dynamics Relatively small market share, continued growth and geographic expansion allow correspondent lending to somewhat offset market volume declines (1) Source: Freddie Mac, Fannie Mae and Mortgage Bankers Association mortgage market forecasts, as of July 2013. (2) Source: Freddie Mac Primary Mortgage Market Survey Mortgage Rates(2) 36% Average Decline UPB % 1H13 ($ in millions) |

|
|
Continuing Growth Across PFSI’s Businesses 6 Loan Production Loan Servicing Mortgage Banking Investment Management In correspondent lending, disciplined growth through specific initiatives to increase market share In retail lending, continue to build out infrastructure to support additional growth Organic growth of prime servicing portfolio from loan production activities Prime subservicing growth from PMT’s conventional and jumbo acquisitions Special servicing from PMT acquisitions Bulk and flow MSR acquisitions Driven by growth of the Advised Entities and their performance PMT’s need to raise capital for investment opportunities (e.g. distressed loans, jumbo, MSRs) Loan Production UPB(1) Loan Servicing UPB Net Assets Under Mgmt. ($ in billions) ($ in billions) ($ in billions) (1) Includes loans purchased by PMT |
|
|
7 (UPB in billions) $8.6bn in total correspondent acquisitions by PMT in Q2 2013 50% government-insured loans (gain on mortgage loans) 50% fulfillment for PMT (fee revenue) Increased the number of approved correspondent sellers to 220 from 179 at the end of 1Q13 Growing contribution from recently introduced products, e.g., VA July correspondent production totaled $3.2 billion; locks totaled $2.5 billion PennyMac’s Businesses – Correspondent Lending (1) Conventional loans are acquired by PMT, for which PLS is paid a fulfillment fee. Correspondent Volume and Mix Growth Opportunities Operational Highlights PMT expects to maintain volumes and continue to capture new business through its targeted growth strategies in the face of a market slowdown and tighter margins Continued growth and optimization of the correspondent seller network Increased presence in certain geographies (e.g., Northeast) New products, e.g., hybrid ARMs |

|
|
Retail origination volumes increased 29% Q/Q to $343 million Majority continues to be portfolio-sourced originations, e.g. refinance, purchase loans from distressed portfolio Consumer direct originations (non-portfolio) up 93% Q/Q Improvements in non-portfolio lead response times and processing efficiencies (reduction in days to close) 8 (UPB in millions) PennyMac’s Businesses – Retail Lending Retail Origination Volume Growth Opportunities Operational Highlights Continued growth of servicing for portfolio-sourced originations Active, targeted marketing for non-portfolio originations, e.g., media and internet marketing, direct mail Focus on transition to purchase-money market through targeted campaigns and strategies Focus on consumer direct HARP originations |
|
|
9 PennyMac’s Businesses – Loan Servicing Loan Servicing Portfolio UPB as of 6/30/13 Growth Opportunities Operational Highlights Servicing portfolio grew to $44.4bn in UPB at quarter-end, up 22% Q/Q $8 billion in organic growth of new prime servicing and subservicing from loan production activities PMT’s distressed loan acquisitions also added to special servicing Closed $450 million in UPB of mini-bulk and flow MSR acquisitions (PMT co-investment pending) Continued organic growth in prime portfolio from loan production activities Owned servicing from government-insured correspondent acquisitions and retail lending Subservicing from PMT’s correspondent acquisitions supplemented by PMT’s jumbo pool acquisition Special servicing from PMT’s distressed acquisitions $1 billion in UPB of recent and pending whole loan investments yet to transfer(1) Continue to evaluate legacy bulk MSR portfolios 100% = $44.4bn in UPB (1) This includes a pending transaction which is subject to continuing due diligence and customary closing conditions. There can be no assurance that the committed amount will ultimately be acquired or that the transaction will be completed. |
|
|
10 ($ in millions) PennyMac’s Businesses – Investment Management Investment Management Revenues Growth Opportunities Operational Highlights Continued need to raise capital in PMT to support ongoing investment growth: Continued acquisitions of distressed whole loan investments MSR investments through correspondent lending Acquisition of jumbo loans for securitization and long-term investment in the retained securities Agency credit risk-sharing transactions Excess I/O investment in MSR portfolios While net assets under management remained at $1.8bn, revenues declined slightly to $13.5 million in the second quarter Incentive fees and carried interest were $6.7 million (driven by performance of Advised Entities) PMT issued $250 million in 7-year exchangeable debt; does not result in additional management fee unless converted, but expected to be accretive to PMT’s financial performance |
|
|
Financial Results 11 Diluted earnings per share of $0.22 for the post-IPO period from May 9 to June 30, 2013 Full-quarter equivalent diluted earnings per share of $0.38 Second Quarter Results: Pretax income of $50.2 million on total net revenue of $110.8 million Strong results from both business segments: Mortgage Banking revenue of $97.2 million, up 6% from 1Q13 Investment Management revenue of $13.5 million, down 3% from 1Q13 Loan production totaled $8.9 billion in UPB, up 2% from 1Q13 Servicing portfolio reaches $44.4 billion, up 23% from March 31, 2013 |
|
|
Net gains on mortgage loans held for sale at fair value Loan origination fees Fulfillment fees from PennyMac Mortgage Investment Trust Net servicing income: Loan servicing fees From non-affiliates From PennyMac Mortgage Investment Trust From Investment Funds Mortgage servicing rebate to Investment Funds Ancillary and other fees Amortization, impairment and change in estimated fair value of mortgage servicing rights Net servicing income Management fees: From PennyMac Mortgage Investment Trust From Investment Funds Carried Interest from Investment Funds Interest Change in fair value of investment in and dividends received from PennyMac Mortgage Investment Trust Other Total net revenue Compensation Interest Loan origination Other Total expenses Income before provision for income taxes Provision for income taxes Net income Less: Net income attributable to noncontrolling interest Net income attributable to PennyMac Financial Services, Inc. common stockholders Earnings per share Basic Diluted $ 42,654 6,312 22,054 11,744 8,787 2,100 (34) 2,662 25,259 (3,190) 22,069 8,455 1,974 10.429 2,862 4,474 (320) 243 110,777 42,339 4,200 2,516 11,493 60,548 50,229 2,038 48,191 45,398 $ 2,793 $ 0.22 $ 0.22 12 Quarter Ended June 30, 2013(1) ($ in thousands) Revenue Expenses Quarter Ended March 31, 2013 $ 39,957 5,668 28,244 9,057 7,722 2,147 (139) 2,265 21,052 (5,010) 16,042 6,492 1,914 8,406 4,737 1,742 88 814 105,698 35,681 3,330 2,507 8,887 50,405 55,293 - $ 55,293 (1) Provision for income taxes, net income attributable to PennyMac Financial Services, Inc. common stockholders, and earnings per share represent the post-IPO period from May 9, 2013 to June 30, 2013. Net servicing income: Loan servicing fees From non-affiliates |

|
|
Pretax Income by Operating Segment 13 Revenues: Net gains on mortgage loans held for sale at fair value Loan origination fees Fulfillment fees from PMT Net servicing fees Management fees Carried Interest from Investment Funds Interest Other Expenses: Compensation Interest Other Pretax income Segment assets at period end Quarter Ended June 30, 2013 $ 42,654 6,312 22,054 22,069 - - 4,469 (320) 97,238 Mortgage Banking Investment Management 39,293 4,200 13,860 57,353 $ 39,885 $ 1,234,766 $ - - - - 10,429 2,862 5 243 13,539 3,046 - 149 3,195 $ 10,344 $ 46,014 ($ in thousands) |
|
|
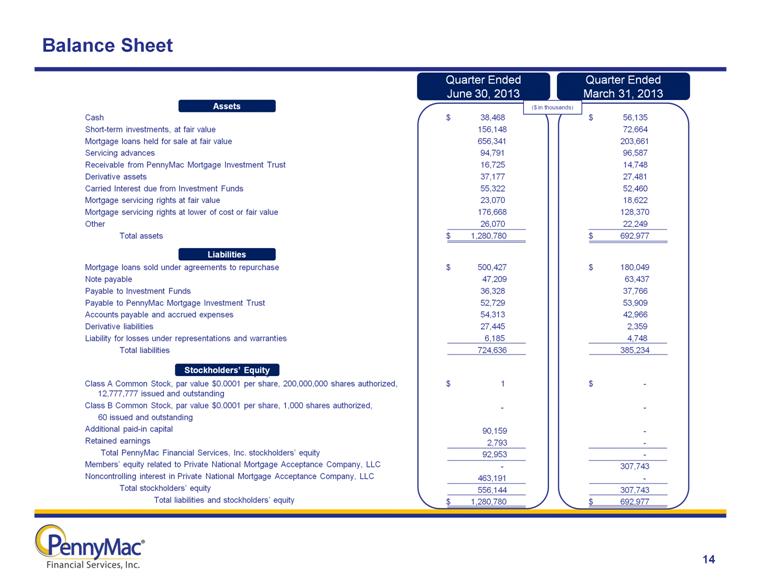
Assets $ 38,468 156,148 656,341 94,791 16,725 37,177 55,322 23,070 176,668 26,070 $ 1,280,780 $ 500,427 47,209 36,328 52,729 54,313 27,445 6,185 724,636 $ 1 - 90,159 2,793 92,953 - 463,191 556,144 $ 1,280,780 Balance Sheet 14 Assets Cash Short-term investments, at fair value Mortgage loans held for sale at fair value Servicing advances Receivable from PennyMac Mortgage Investment Trust Derivative assets Carried Interest due from Investment Funds Mortgage servicing rights at fair value Mortgage servicing rights at lower of cost or fair value Other Total assets Liabilities Mortgage loans sold under agreements to repurchase Note payable Payable to Investment Funds Payable to PennyMac Mortgage Investment Trust Accounts payable and accrued expenses Derivative liabilities Liability for losses under representations and warranties Total liabilities Shareholder’s Equity Class A Common Stock, par value $0.0001 per share, 200,000,000 shares authorized, 12,777,777 issued and outstanding Class B Common Stock, par value $0.0001 per share, 1,000 shares authorized, 60 issued and outstanding Additional paid-in capital Retained earnings Total PennyMac Financial Services, Inc. stockholders’ equity Members’ equity related to Private National Mortgage Acceptance Company, LLC Noncontrolling interest in Private National Mortgage Acceptance Company, LLC Total stockholders’ equity Total liabilities and stockholders’ equity Quarter Ended June 30, 2013 Quarter Ended March 31, 2013 ($ in thousands) Assets Liabilities Stockholders’ Equity Assets $ 56,135 72,664 203,661 96,587 14,748 27,481 52,460 18,622 128,370 22,249 $ 692,977 $ 180,049 63,437 37,766 53,909 42,966 2,359 4,748 385,234 $ - - - - - 307,743 - 307,743 $ 692,977 |
|
|
Mortgage Servicing Right (MSR) Asset Valuation 15 UPB ($in millions) Weighted average note rate Prepayment speed assumption (CPR) Weighted average servicing fee rate Fair value As multiple of servicing fee Carrying value Fair value in excess of accounting value Quarter Ended June 30, 2013 Lower of amortized cost or fair value Fair Value $16,295 3.52% 9.0% 0.28% $194.5 3.94 $176.7 $17.8 $2,483 5.29% 11.3% 0.37% $23.1 2.52 $23.1 PFSI accounts for most of its originated MSRs under the lower of amortized cost or fair value method MSRs where the note rate on the underlying loan is equal to or less than 4.5% Fair value of the MSRs increased in excess of their cost basis, due to higher interest rates and declining expectations for prepayments |

|
|
Appendix |

|
|
Reconciliation of Full Quarter Equivalent EPS to GAAP EPS for the Post-IPO Period 17 Income before provision for income taxes 50,229 $ 50,229 $ Provision for income taxes (2,038) (1,514) $ (3,552) Net income 48,191 (1,514) 46,677 Less: Net income attributable to noncontrolling interest (45,398) 3,626 (41,772) Net income attributable to PennyMac Financial Services, Inc. common shareholders 2,793 $ 2,112 $ 4,905 $ Earnings per common share 0.22 $ 0.38 $ Adjustments for full quarter allocation of earnings and income tax to PFSI As presented Full quarter equivalent For the quarter ended June 30, 2013 ($ in thousands) |