Attached files
| file | filename |
|---|---|
| 8-K - 8-K - CAPSTEAD MORTGAGE CORP | d581578d8k.htm |
Exhibit 99.1
CAPSTEAD
2Q 2013R
FACT SHEET
ABOUT US
Capstead is based in Dallas,Texas and is listed on the New YorkStock Exchange (symbol CMO). Having been formed in 1985, we hold the distinction of being the oldest of the publicly-traded mortgage REITs.
We invest in a leveraged portfolio of short duration and well-seasoned residential adjustable-rate mortgage (“ARM”) securities issued and guaranteed by Fannie Mae, Freddie Mac or Ginnie Mae. Duration is a measure of market price sensitivity to changes in interest rates. Our investment strategy differentiates us from our peers because short duration ARM securities reset to more current interest rates within a relatively short period of time allowing for:
the recovery of financing spreads diminished during periods of rising interest rates, and
smaller fluctuations in portfolio values, and therefore book value, caused by changes in interest rates compared to longer-duration ARM or fixed-rate mortgage securities.
with this strategy, Capstead is widely recognized as the most defensively-positioned residential mortgage REIT from an interest rate and credit risk perspective.
Quality Assets
Agency-guaranteed residential mortgage securities are considered to have little, if any, credit risk, particularly given federal government support for Fannie Mae and Freddie Mac. These mortgage investments are highly liquid and can be financed with multiple funding providers through standard repurchase arrangements.
Conservatively Financed
We prudently leverage our portfolio to provide financial flexibility needed to successfully manage through periodsof changing market conditions, and we have long-standing relationships with numerous lending counterparties. Further, our use of interest rate swap agreements helps further mitigate the effects of rising short-term interest rates.
Experienced Management in a Stockholder Friendly Structure
Our management team has over 85 years of combined mortgage finance industry experience. We are self-managed with low operating costs and rely heavilyonperformance-based compensation.This structure greatly enhances the alignment of management interests with those of our stockholders.
Capstead Mortgage Corporation 8401 North Central Expressway • Suite 800 Dallas,Texas 75225-4410 www.capstead.com
2Q2013 SECOND QUARTER HIGHLIGHTS
Completed offering of $170 million face amount of 7.50% Series E perpetual preferred shares using proceeds and cash on hand to redeem higher-cost perpetual preferred shares. These transactions have reduced future preferred dividend requirements by nearly $0.09 per common share (annualized). Generated core earnings of $0.27 per diluted common share (excluding certain one-time effects of the preferred capital transactions).
Book value ended the second quarter at $12.80 per common share, lower by 2.1% duetothe preferred capital transactions, and 3.8% dueto portfolio pricing changes net of hedges as well as other operational factors.
This compares favorably with average book value declines of over 15% for agency-only residential mortgage REITs and over 9% for agency/non-agency residential mortgage REITs during a quarter that saw an abrupt shift in the market to significantly higher long-term interest rates.
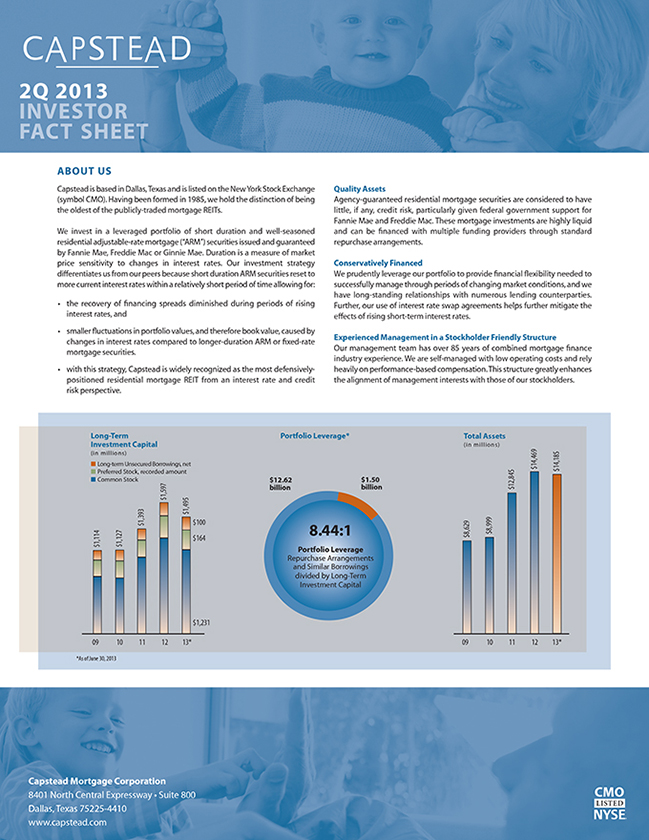
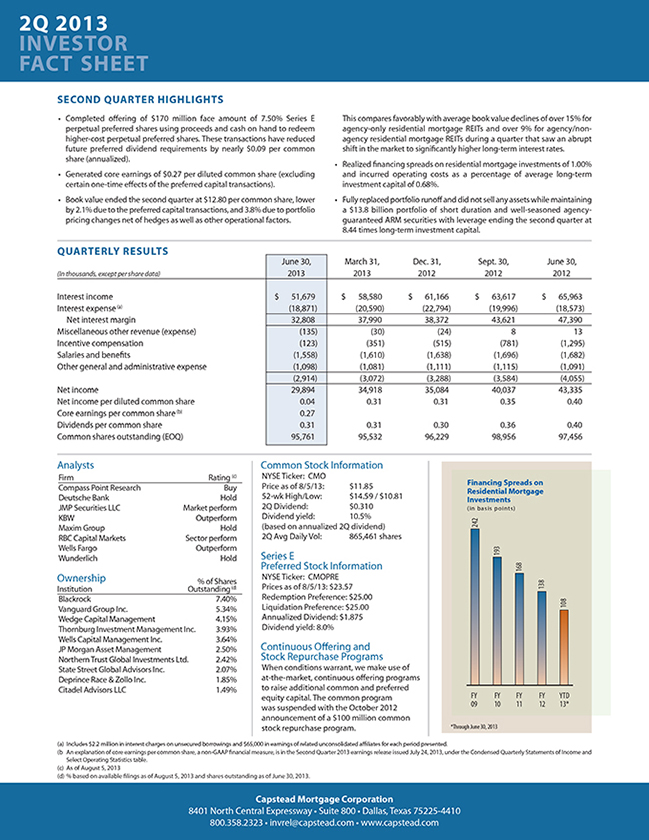
Realized financing spreads on residential mortgage investments of 1.00% and incurred operating costs as a percentage of average long-term investment capital of 0.68%. Fully replaced portfolio runoffand did not sell any assets while maintaining a $13.8 billion portfolio of short duration and well-seasoned agency-guaranteed ARM securities with leverage ending the second quarter at 8.44 times long-term investment capital.
Common Stock Information NYSE Ticker: CMO Price as of 8/5/13: $11.85 52-wk High/Low: $14.59 / $10.81 2Q Dividend: $0.310
Dividend yield: 10.5% (based on annualized 2Q dividend) 2Q Avg Daily Vol: 865,461 shares
Series E Preferred Stock Information NYSE Ticker: CMOPRE Prices as of 8/5/13: $23.57 Redemption Preference: $25.00 Liquidation Preference: $25.00 Annualized Dividend: $1.875 Dividend yield: 8.0% Continuous Offering and Stock Repurchase Programs When conditions warrant, we make use of at-the-market, continuous offering programs to raise additional common and preferred equity capital. The common program was suspended with the October 2012 announcement of a $100 million common stock repurchase program. (a) Includes $2.2 million in interest charges on unsecured borrowings and $65,000 in earnings of related unconsolidated affiliates for each period presented. (b An explanationof core earnings per common share, anon-GAAPfinancial measure,is in the Second Quarter 2013 earnings release issued July 24, 2013, under the Condensed Quarterly Statements of Income and Select Operating Statistics table. (c) As of August 5, 2013 (d) % based on available filings as of August 5, 2013 and shares outstanding as of June 30, 2013. Capstead Mortgage Corporation 8401 North Central Expressway • Suite 800 • Dallas, Texas 75225-4410 800.358.2323 • invrel@capstead.com • www.capstead.com
June 30, March 31, Dec. 31, Sept. 30, June 30, (In thousands, except per share data) 2013 2013 2012 2012 2012 Interest income $ 51,679 $ 58,580 $ 61,166 $ 63,617 $ 65,963 Interest expense(a) (18,871) (20,590) (22,794) (19,996) (18,573) Net interest margin 32,808 37,990 38,372 43,621 47,390 Miscellaneous other revenue (expense) (135) (30) (24) 8 13 Incentive compensation (123) (351) (515) (781) (1,295) Salaries and benefits (1,558) (1,610) (1,638) (1,696) (1,682) Other general and administrative expense (1,098) (1,081) (1,111) (1,115) (1,091) (2,914) (3,072) (3,288) (3,584) (4,055) Net income 29,894 34,918 35,084 40,037 43,335 Net income per diluted common share 0.04 0.31 0.31 0.35 0.40 Core earnings per common share(b) 0.27 Dividends per common share 0.31 0.31 0.30 0.36 0.40 Common shares outstanding (EOQ) 95,761 95,532 96,229 98,956 97,456 Analysts Firm Rating (c) Compass Point Research Buy Deutsche Bank Hold JMP Securities LLC Market perform KBW Outperform Maxim Group Hold RBC Capital Markets Sector perform Wells Fargo Outperform Wunderlich Hold Ownership % of Shares Institution Outstanding(d) Blackrock 7.40% Vanguard Group Inc. 5.34% Wedge Capital Management 4.15% Thornburg Investment ManagementInc. 3.93% Wells Capital Management Inc. 3.64% JP Morgan Asset Management 2.50% NorthernTrust Global Investments Ltd. 2.42% State Street Global Advisors Inc. 2.07% Deprince Race & Zollo Inc. 1.85% Citadel Advisors LLC 1.49%