Attached files
| file | filename |
|---|---|
| EX-1.1 - EX-1.1 - XOOM Corp | d575093dex11.htm |
| EX-23.1 - EX-23.1 - XOOM Corp | d575093dex231.htm |
Table of Contents
As filed with the Securities and Exchange Commission on August 12, 2013
Registration No. 333-
UNITED STATES
SECURITIES AND EXCHANGE COMMISSION
Washington, D.C. 20549
FORM S-1
REGISTRATION STATEMENT
Under
The Securities Act of 1933
XOOM CORPORATION
(Exact name of registrant as specified in its charter)
| Delaware | 7389 | 94-3401054 | ||
| (State or other jurisdiction of incorporation or organization) |
(Primary Standard Industrial Classification Code Number) |
(I.R.S. Employer Identification Number) |
Xoom Corporation
100 Bush Street, Suite 300
San Francisco, CA 94104
(415) 777-4800
(Address, including zip code, and telephone number, including area code, of registrant’s principal executive offices)
John Kunze
Xoom Corporation
President & Chief Executive Officer
100 Bush Street, Suite 300
San Francisco, CA 94104
(415) 777-4800
(Name, address, including zip code, and telephone number, including area code, of agent for service)
Copies to:
| Anthony J. McCusker, Esq. Richard A. Kline, Esq. Goodwin Procter LLP 135 Commonwealth Drive Menlo Park, CA 94025 (650) 752-3100 |
Christopher G. Ferro, Esq. Vice President and General Counsel Xoom Corporation 100 Bush Street, Suite 300 San Francisco, CA 94104 (415) 777-4800 |
Douglas D. Smith, Esq. Stewart L. McDowell, Esq. Gibson, Dunn & Crutcher LLP 555 Mission Street, Suite 3000 San Francisco, CA 94105 (415) 393-8200 |
Approximate date of commencement of proposed sale to public: as soon as practicable after this Registration Statement is declared effective.
If any of the securities being registered on this form are to be offered on a delayed or continuous basis pursuant to Rule 415 under the Securities Act of 1933, check the following box. ¨
If this Form is filed to register additional securities for an offering pursuant to Rule 462(b) under the Securities Act, check the following box and list the Securities Act registration statement number of the earlier effective registration statement for the same offering. ¨
If this Form is a post-effective amendment filed pursuant to Rule 462(c) under the Securities Act, check the following box and list the Securities Act registration statement number of the earlier registration statement for the same offering. ¨
If this Form is a post-effective amendment filed pursuant to Rule 462(d) under the Securities Act, check the following box and list the Securities Act registration statement number of the earlier registration statement for the same offering. ¨
Indicate by check mark whether the registrant is a large accelerated filer, an accelerated filer, a non-accelerated filer, or a smaller reporting company. See the definitions of “large accelerated filer,” “accelerated filer” and “smaller reporting company” in Rule 12b-2 of the Exchange Act. (Check one):
| Large Accelerated Filer | ¨ | Accelerated Filer | ¨ | |||||
| Non-Accelerated Filer | x | (Do not check if a smaller reporting company) | Smaller Reporting Company | ¨ | ||||
CALCULATION OF REGISTRATION FEE
|
| ||||
| Title of Each Class of Securities to be Registered |
Proposed Maximum Aggregate Offering Price(1) (2) |
Amount of Registration Fee | ||
| Common Stock, par value $0.0001 per share |
$70,000,000 | $9,548.00 | ||
|
| ||||
|
| ||||
| (1) | Estimated solely for the purpose of computing the amount of the registration fee pursuant to Rule 457(o) under the Securities Act of 1933, as amended. |
| (2) | Includes the aggregate offering price of additional shares that the underwriters have the option to purchase. |
The registrant hereby amends this registration statement on such date or dates as may be necessary to delay its effective date until the registrant shall file a further amendment which specifically states that this registration statement shall thereafter become effective in accordance with Section 8(a) of the Securities Act of 1933, as amended, or until the registration statement shall become effective on such date as the Securities and Exchange Commission, acting pursuant to said Section 8(a), may determine.
Table of Contents
The information in this preliminary prospectus is not complete and may be changed. These securities may not be sold until the registration statement filed with the Securities and Exchange Commission is effective. This preliminary prospectus is not an offer to sell nor does it seek an offer to buy these securities in any jurisdiction where the offer or sale is not permitted.
Subject to Completion, dated August 12, 2013
PROSPECTUS
Shares

Xoom Corporation
Common Stock
Xoom Corporation is offering shares to be sold in this offering. The selling stockholders identified in this prospectus are offering an additional shares. Xoom will not receive any proceeds from the sale of shares by the selling stockholders.
Xoom’s common stock is listed on the NASDAQ Global Select Market under the symbol “XOOM.” On August 9, 2013, the last reported sale price of Xoom’s common stock on the NASDAQ Global Select Market was $30.26 per share.
Xoom is an “emerging growth company” under the federal securities laws and is subject to reduced public company reporting requirements. Investing in the common stock involves risks. See “Risk Factors” on page 11 to read about factors you should consider before buying shares of the common stock.
| Per Share | Total | |||||||
| Offering price |
$ | $ | ||||||
| Underwriting discount |
$ | $ | ||||||
| Proceeds, before expenses, to Xoom |
$ | $ | ||||||
| Proceeds, before expenses, to the selling stockholders |
$ | $ | ||||||
To the extent that the underwriters sell more than shares of common stock, the underwriters have the option to purchase up to an additional shares from Xoom at the offering price less the underwriting discount.
Neither the Securities and Exchange Commission nor any other regulatory body has approved or disapproved of these securities or passed upon the accuracy or adequacy of this prospectus. Any representation to the contrary is a criminal offense.
The underwriters expect to deliver the shares against payment in New York, New York on or about , 2013.
| Barclays | Needham & Company |
Prospectus dated , 2013
Table of Contents
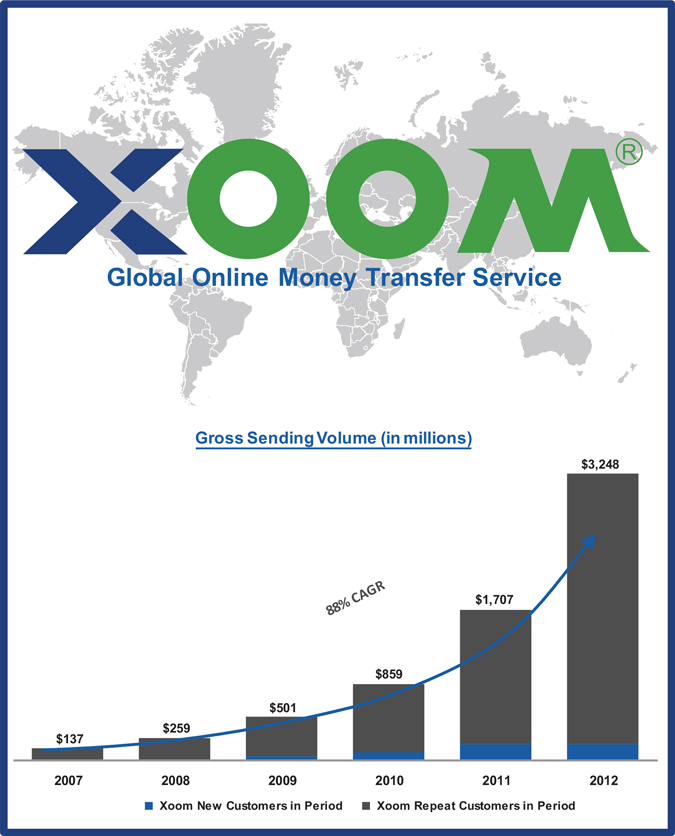
Table of Contents
Prospectus
| Page | ||||
| 1 | ||||
| 11 | ||||
| 41 | ||||
| 42 | ||||
| 42 | ||||
| 42 | ||||
| 43 | ||||
| 44 | ||||
| 46 | ||||
| Management’s Discussion and Analysis of Financial Condition and Results of Operations |
49 | |||
| 73 | ||||
| 87 | ||||
| 93 | ||||
| 104 | ||||
| 107 | ||||
| 111 | ||||
| 115 | ||||
| 117 | ||||
| 122 | ||||
| 127 | ||||
| 127 | ||||
| 127 | ||||
| F-1 | ||||
The market data and certain other statistical information used throughout this prospectus are based on independent industry publications, governmental publications, reports by market research firms or other independent sources. Some data are also based on our good faith estimates.
Neither we, the selling stockholders, nor the underwriters have authorized anyone to provide any information or to make any representations other than those contained in this prospectus or in any free writing prospectuses we have prepared. We take no responsibility for, and can provide no assurance as to the reliability of, any other information that others may give you. This prospectus is an offer to sell only the shares offered hereby, but only under circumstances and in jurisdictions where it is lawful to do so. The information contained in this prospectus is current only as of its date.
i
Table of Contents
This summary highlights selected information contained in greater detail elsewhere in this prospectus. This summary does not contain all of the information you should consider before investing in our common stock. You should read this entire prospectus carefully, especially the information set forth under “Risk Factors” and “Management’s Discussion and Analysis of Financial Condition and Results of Operations” and our consolidated financial statements and the related notes appearing at the end of this prospectus, before making an investment decision. Unless the context otherwise requires, we use the terms “Xoom,” “we,” “us,” “the company” and “our” in this prospectus to refer to Xoom Corporation and its subsidiary.
Company Overview
Xoom is a pioneer and leader in the digital consumer-to-consumer international money transfer industry. Our customers use Xoom to send money to family and friends in 30 countries. Since January 1, 2008, our customers have used Xoom to send $9.2 billion, including $1.7 billion in 2011, $3.2 billion in 2012 and $2.7 billion in the six months ended June 30, 2013. According to the World Bank, international consumer money transfer volume totaled $529 billion worldwide in 2012 and is forecasted to grow to approximately $665 billion by 2015, an 8% CAGR. Our modern online and mobile platforms disrupt traditional forms of money transfer and deliver our customers a convenient, fast and cost-effective way to send money.
Our typical customers left their home countries and moved to the United States to seek better employment opportunities and to support their family and friends back home. Our customers represent a broad range of professions and education levels, but share common traits in that they have bank accounts and actively use the Internet or mobile devices. They maintain close ties to home and regularly use Xoom to help their family and friends in their home countries afford basic, and sometimes dire, needs for food, shelter, healthcare and other critical, non-discretionary expenses.
We earn and maintain our customers’ trust by providing a high level of service through convenient, fast and cost-effective money transfers. Xoom’s money transfers are initiated online or through a mobile device and can be sent at any time, from any Internet-enabled location. Recipients receive money in the manner they prefer and to which they are individually or culturally accustomed, at major banks and leading retailers. We believe we process and complete money transfer transactions as fast as, or faster than, our competitors, and our customers and their recipients can track the status of their transactions in real time, providing them peace of mind. Our business model allows us to provide our customers with cost-effective money transfers because we do not pay originating agent commissions and the majority of our transfers are funded directly from bank accounts, which lowers our cost of sales.
Our solutions are built on our proprietary technology which, combined with our risk management capabilities and global disbursement network, constitute our operating platform. Our technology enables easy-to-use online and mobile sender interfaces, effective risk management and seamless integration with our disbursement partners’ systems. We have developed extensive partnerships with major banks and leading retailers who form our global disbursement network across 30 countries and deliver a high quality of service through regionally-recognized, trusted brands.
We generate revenue from transaction fees charged to customers, and from foreign exchange spreads on transactions where the payout currency is other than U.S. dollars. Service fees vary by country, type of funding source, disbursement currency and send amount, but do not vary by method of disbursement, how the transaction was initiated (via computer or mobile device) or the location of the customer. Our foreign exchange revenue is derived from the difference between our cost to buy local currency and the price at which we sell the currency, referred to as our foreign exchange spread. Our foreign exchange spread varies by country, but our spreads have typically ranged from approximately 1% to 3% of a transaction’s principal send amount.
1
Table of Contents
We believe our business model is often characterized by predictable and recurring revenue from our large and growing base of new and repeat customers. We have achieved significant revenue growth as our customer base has expanded. From 2008 to 2012, our revenue increased from $14.1 million to $80.0 million, representing a 54% CAGR. Our revenue increased from $38.0 million for the six months ended June 30, 2012 to $57.8 million for the six months ended June 30, 2013, a 52% increase. We incurred a net loss of $5.9 million in 2012 as we continued to invest in growing our revenue. We incurred a net loss of $2.1 million in the six months ended June 30, 2012 and generated net income of $4.0 million in the six months ended June 30, 2013. We have incurred net losses primarily as a result of long-term investments in our service innovation, solutions and marketing programs to increase brand awareness.
Industry Overview
The market for global money transfer is large and growing. According to the World Bank’s Migration and Development Briefs, the worldwide remittance market grew at an 11% CAGR from $234 billion in 2004 to $529 billion in 2012 and is expected to continue to grow to $665 billion by 2015, an 8% CAGR. Traditionally, the global money transfer market has been served by a few large players, many small regional players, traditional banks and informal person-to-person money transfer service providers that evade regulation. The large industry players primarily service senders who fund with cash, which requires an extensive network of originating agents in the United States and significant infrastructure in receiving locations. This antiquated model of predominantly cash-to-cash money transfer has not evolved meaningfully in more than 100 years and has been plagued by one or more of the following problems: slow transaction processing; non-transparent fees; opaque exchange rates; and an inconvenient offline money transfer experience, including limited store hours, long wait times, complicated manual forms and sometimes unsafe locations. With the widespread adoption of online and mobile channels and a steady increase in the proportion of the banked population among the foreign-born community in the United States, we believe there is a significant opportunity to disrupt the traditional forms of money transfer and provide a better customer experience.
Our Solutions
Our solutions are designed to offer customers a convenient, fast and cost-effective way to send money to family and friends at any time, from any Internet-enabled location. Our operating platform allows us to provide innovative solutions to the challenge of transferring funds internationally, as described below.
| • | Origination. All Xoom money transfers originate online, without the costs or inconvenience of initiating a transaction at a physical agent location or bank. Our money transfer services are available over the Internet or through a mobile device on our website at www.xoom.com, our co-branded website with Walmart.com and our new mobile application. |
| • | Funding. Our customers have the option to fund a money transfer with a U.S.-based bank account, credit card or debit card. We do not have originating agents who accept cash. As a result, we do not incur the costs or commissions associated with physical agent-based origination and funding. Over 90% of our gross sending volume is funded by bank accounts through the Automated Clearinghouse system, or ACH. ACH transactions are less expensive to fund than credit or debit card transactions, as ACH does not include the variable fees associated with these transactions. |
| • | Disbursement. Our customers can transfer money from the United States to 30 countries, including many major recipient countries, such as India, Mexico and the Philippines. Our disbursement options include direct deposit into recipient bank accounts in all countries we serve, cash pick-up at our disbursement partner locations in most countries we serve or home delivery of cash in the Dominican Republic and the Philippines. These convenient options are made available through established partnerships with major banks and leading retailers that form our global disbursement network. |
2
Table of Contents
| • | Transaction Processing. Throughout the entire money transfer process, we provide a high level of risk management, compliance and regulatory oversight and customer service. Our operating platform is built to track each of these requirements. From the inception of a transaction, our platform enables us to quickly and seamlessly assess the transaction’s risk profile without introducing undue friction into the customer experience. To minimize payment and fraud risk, we require several requirements to be satisfied in order for a prospective customer to use our services. We have built our technology to test each transaction for compliance, anti-money laundering, acceptable use, anti-fraud and funding risk within seconds. |
Our Competitive Strengths
The majority of our employees are from first or second generation immigrant families and personally understand the importance and impact of our service on our customer base. Our first-hand knowledge of our customers’ needs enhances our ability to innovate and design solutions that solve their challenges. This customer-centric culture and mission-driven approach permeates our organization, defines the fabric of our company and drives our focus on serving our customers. We believe we have the following competitive strengths:
| • | Compelling Value Proposition. We provide significant value to our customers through a unique combination of convenience, speed and cost-effective pricing of our services. We also provide transparency to our customers with simple fees and locked-in foreign exchange rates so our customers clearly understand the fee they will pay and the exact amount their recipients will receive before submitting a transaction. In general, we purchase each foreign currency one or more times each business day, and we set our foreign exchange rates for our customers using historical customer transaction data and our quantitative models built over several years to balance internal target spreads of 1% to 3% with competitive pricing. |
| • | Proprietary Risk Management System. Our proprietary risk management system serves as the backbone of our technology platform, balancing a low-friction customer experience with low transaction loss rates, which have been 35 basis points or lower as a percentage of gross sending volume on an annual basis since 2010. |
| • | Online Origination Affords Valuable Customer Insight. Our customers initiate money transfers online or through mobile devices on www.xoom.com or through our new mobile application, creating a body of digital, transaction-related data that affords us deep insight into repeat customer behavior. This data provides us with revenue visibility, allows us to quantify the value of each customer and enables us to continually improve our overall customer experience. |
| • | Marketing Expertise. We believe our expertise in customizing our marketing to culturally diverse target markets provides us with a competitive advantage in attracting new customers to Xoom and retaining existing customers. In addition, the fact that our customers originate transfers online enables us to directly attribute new customers to specific marketing campaigns and optimize future marketing investment. |
| • | Established Global Disbursement Capabilities. Our network of major banks and leading retailers, assembled relationship by relationship over more than ten years, is comprised of trusted local brands who offer high-quality service. We believe our speed of deposit is superior to that of our competitors and it would be difficult for a new competitor to replicate the breadth and quality of service our disbursement network provides. |
| • | Efficient Regulatory Compliance. We have designed our technology platform to operate efficiently in a highly complex and continuously evolving regulatory environment. Our technology and compliance expertise enable a low-friction customer experience in a highly-regulated environment, which new market entrants would likely find difficult to replicate. |
3
Table of Contents
Our Growth Strategy
Our growth strategy is focused primarily on attracting and retaining customers in the markets we currently serve. We intend to aggressively grow our business through the following strategies:
| • | Attract and Retain Customers in the Markets We Currently Serve. Our customers tend to behave predictably, and we are therefore able to increase and optimize our marketing investment to acquire new customers at a cost that is a fraction of their estimated lifetime values. We will continue to selectively invest more in targeted marketing campaigns to acquire new customers. We will also focus on enhancing our service and continue developing new features, including expanding and enhancing our mobile capabilities, to improve our customers’ experience and further strengthen brand loyalty. We launched our mobile strategy in November 2011 and our new mobile application in June 2013. During the six months ended June 30, 2013, 29% of the total number of transactions was sent via mobile devices compared to 16% in the same period in the prior year. In June 2013, we released our new mobile application. The “Xoom App” is simple to use and allows existing customers to send money to their family and friends in seconds with “one tap and one swipe” and track the status of their transactions. |
| • | Establish New Partnerships and Improve Current Partnerships. We will continue to establish new marketing partnerships to improve awareness of our money transfer services with potential customers. For example, in July 2013, we announced a partnership with Sprint through which our money transfer services are now available for mobile virtual network operators on the Sprint Network. By increasing the number of disbursement partners and improving the quality of service from existing partners, we believe we can increase the relevance of our service and improve our value proposition for our target customers. |
| • | Expand into New International Markets. We will continue to leverage the experience and expertise gained from our success in current markets to identify attractive, new origination and recipient markets for our services. |
| • | Leverage Technology and Develop Services in Adjacent Markets. As part of our long-term strategic plan, we intend to explore opportunities to leverage our technology and money transfer network to unlock new revenue streams in adjacent markets. |
Developments Since Our Initial Public Offering
In the six months ended June 30, 2013, we experienced significant growth compared to the same period in 2012 as our customer base expanded. Revenue increased from $38.0 million for the six months ended June 30, 2012 to $57.8 million for the six months ended June 30, 2013.
During the six months ended June 30, 2013, we launched a number of new initiatives to enhance our customer experience and expand our reach in the communities we serve:
| • | StatusTrak. Released a new tracking center that provides customers a variety of ways to track their transfers by text message, email updates and 24/7 customer support. |
| • | Pay Only When Received, or POWR. Provides assurance to qualifying customers that we will only withdraw their money after it is received by their recipients. |
| • | Four Hour Bank Deposit to India. Announced a quick deposit service to India where customers can transfer money to any rupee-denominated bank account in India in four hours when sent during Indian banking hours. |
| • | Targeted Marketing Campaigns. Initiated an Indian marketing campaign featuring Indian superstar Amitabh Bachchan as our brand ambassador of our market-leading four hour bank deposit to India and another strong marketing campaign focused on expanding our reach in the Mexican community. |
4
Table of Contents
| • | Native Apps for Existing Customers. Released our new mobile application, which is now available in both English and Spanish. The application is targeted at existing customers, empowering them to send money to their family and friends in seconds with “one tap and one swipe” and track the status of their transactions. |
In February 2013, the Reserve Bank of India extended its rupee drawing arrangement, or RDA, to money transmitters based in the United States. In July 2013, we began processing transactions to India via RDA which had formerly been processed pursuant to our license under the Money Transfer Service Scheme, or MTSS, issued by the Reserve Bank of India. There are fewer limitations on transactions processed pursuant to RDA. For example, we are now able to process transactions to bank accounts held by non-resident Indians, and we are no longer subject to the $2,500 transaction limit required by MTSS. This regulatory change expands the portion of U.S.-to-India remittance volume that is addressable by our service.
Risks Affecting Us
Our business, financial condition, results of operations and prospects are subject to numerous risks and uncertainties. These risks include, among others, that:
| • | We have incurred significant operating losses in the past, and we may not be able to sustain our recent revenue growth and generate sufficient revenue to achieve or maintain profitability. |
| • | We have a limited operating history in an evolving industry, which makes it difficult to evaluate our future prospects and may increase the risk that we will not be successful. |
| • | If we fail to attract new customers or retain our existing customers, our business and revenue will be harmed. |
| • | Inaccurate forecasts of our new customer growth could result in our expenses exceeding our revenue and ultimately harm our business. |
| • | If the revenue generated by new customers differs significantly from our expectations, or if our customer acquisition costs or costs associated with servicing our customers increase, we may not be able to recover our customer acquisition costs or generate profits from this investment. |
| • | Our quarterly operating results fluctuate and may not predict our future performance accurately. Variability in our future performance could cause our stock price to fluctuate or decline. |
| • | Our cash balances are significantly affected by the day of the week on which a quarter ends. As a result, you should not rely on quarter-to-quarter comparisons of our cash balances. |
| • | Failure to maintain sufficient capital could harm our business, financial condition and results of operations. |
| • | Our revenue and profitability could be harmed and fluctuate period-to-period due to changes in foreign exchange rates and other risks related to foreign exchange. |
| • | We may not be able to secure additional financing in a timely manner, or at all, to meet our future capital needs, which could impair our ability to execute on our business plan. |
| • | We generate a substantial portion of our revenue from money transfers to India and the Philippines, and the failure to continue to generate such revenue, due to economic, political or regulatory factors beyond our control, could harm our business, financial position and results of operations. |
| • | We face intense competition and, if we are unable to compete effectively, our business, financial condition and results of operations could be harmed. |
| • | New or existing technologies could gain wide adoption and supplant our services and features and harm our revenue and financial results. |
5
Table of Contents
| • | We face payment and fraud risks that could harm our business, financial condition and results of operations. |
| • | Our business is subject to a wide range of laws and regulations intended to help detect and prevent illegal or illicit activity and our failure, or the failure of one of our disbursement partners or payment processors, to comply with those laws and regulations could harm our business, financial condition and results of operations. |
| • | Our business is subject to a variety of U.S. and foreign laws, many of which are unsettled and still developing, and many of which may contradict one another due to conflicting regulatory goals. Failure to comply with these laws could subject us to claims or otherwise harm our business. |
Company Information
We were incorporated in California in June 2001 and reincorporated into Delaware in November 2012. Since our inception we have provided digital consumer-to-consumer money transfers. From 2003 to 2005, we also offered other services within the money transfer business. In 2006, we chose to focus solely on our current business model, providing digital consumer-to-consumer international money transfers.
Our principal executive office is located at 100 Bush Street, Suite 300, San Francisco, CA 94104. Our telephone number at our principal executive office is (415) 777-4800. Our website address is www.xoom.com. This is a textual reference only. We do not incorporate the information on, or accessible through, our website into this prospectus, and you should not consider any information on, or that can be accessed through, our website as part of this prospectus.
We use various trademarks and trade names in our business, including “Xoom” and XOOM®, which we have registered in the United States and in various other countries. This prospectus also contains trademarks and trade names of other businesses that are the property of their respective holders. We have omitted the ® and ™ designations, as applicable, for the trademarks we name in this prospectus.
6
Table of Contents
THE OFFERING
| Common stock offered by us |
shares | |
| Common stock offered by the selling stockholders |
shares | |
| Common stock to be outstanding after this offering |
shares | |
| Option to purchase additional shares |
We have granted the underwriters an option, exercisable for 30 days after the date of this prospectus, to purchase up to an additional shares of common stock from us. | |
| Use of proceeds |
We expect our net proceeds from this offering will be $ million (or $ million if the underwriters exercise their option to purchase additional shares in full), based on an estimated offering price of $ per share, the last reported sale price of our common stock on the NASDAQ Global Select Market on , 2013, and after deducting underwriting discounts and commissions and estimated offering expenses payable by us. We will not receive any proceeds from the sale of shares by the selling stockholders. | |
| We intend to use the net proceeds to us from this offering primarily for working capital and also for general corporate purposes. We may also use a portion of the net proceeds to acquire complementary businesses, products or technologies. However, we have not entered into agreements or commitments for any specific acquisitions at this time. For a more complete description of our intended use of proceeds from this offering, see “Use of Proceeds.” | ||
| Risk factors |
You should read “Risk Factors” for a discussion of factors to consider carefully before deciding to invest in shares of our common stock. | |
| NASDAQ Global Select Market trading symbol |
“XOOM” | |
The number of shares of our common stock to be outstanding after this offering is based on 32,994,080 shares of our common stock outstanding as of June 30, 2013, and excludes:
| • | 6,730,461 shares of common stock issuable upon exercise of stock options outstanding as of June 30, 2013 at a weighted-average exercise price of $5.98 per share; and |
| • | 2,774,659 shares of common stock reserved for issuance under our 2012 Stock Option and Incentive Plan, and any future increase in shares reserved for issuance under such plan. |
Unless otherwise indicated, the information in this prospectus assumes the following:
| • | no exercise of options outstanding as of June 30, 2013; and |
| • | no exercise by the underwriters of their option to purchase additional shares. |
7
Table of Contents
SUMMARY CONSOLIDATED FINANCIAL DATA
The following table summarizes our consolidated financial data. We have derived the summary consolidated statements of operations data for the years ended December 31, 2010, 2011 and 2012 and the consolidated balance sheet data as of December 31, 2011 and 2012 from our audited consolidated financial statements included elsewhere in this prospectus. The summary consolidated statements of operations data for the six months ended June 30, 2012 and 2013 and the consolidated balance sheet data as of June 30, 2013 have been derived from our unaudited interim consolidated financial statements included elsewhere in this prospectus. The unaudited interim consolidated financial data have been prepared on the same basis as the audited consolidated financial statements and, in the opinion of management, reflect all adjustments, which consist only of normal recurring adjustments, necessary to fairly reflect our consolidated results of operations data for the six months ended June 30, 2012 and 2013 and our consolidated financial position as of June 30, 2013. Our historical results are not necessarily indicative of the results that may be expected in the future, and the results for the six months ended June 30, 2013 are not necessarily indicative of operating results to be expected for the full year ending December 31, 2013 or any other period. The following summary consolidated financial data should be read in conjunction with “Management’s Discussion and Analysis of Financial Condition and Results of Operations” and our consolidated financial statements and related notes included elsewhere in this prospectus.
| Year Ended December 31, | Six Months Ended June 30, |
|||||||||||||||||||
| 2010 | 2011 | 2012 | 2012 | 2013 | ||||||||||||||||
| (in thousands, except per share data) | ||||||||||||||||||||
| (unaudited) | ||||||||||||||||||||
| Revenue |
$ | 32,837 | $ | 50,020 | $ | 80,016 | $ | 37,953 | $ | 57,808 | ||||||||||
| Cost of revenue |
12,231 | 18,075 | 26,779 | 12,842 | 17,638 | |||||||||||||||
|
|
|
|
|
|
|
|
|
|
|
|||||||||||
| Gross profit |
20,606 | 31,945 | 53,237 | 25,111 | 40,170 | |||||||||||||||
|
|
|
|
|
|
|
|
|
|
|
|||||||||||
| Marketing |
11,608 | 14,314 | 21,496 | 10,417 | 12,599 | |||||||||||||||
| Technology and development |
6,046 | 9,431 | 15,950 | 7,654 | 10,310 | |||||||||||||||
| Customer service and operations |
5,257 | 7,321 | 10,964 | 4,977 | 6,342 | |||||||||||||||
| General and administrative |
3,728 | 4,957 | 9,135 | 3,872 | 5,962 | |||||||||||||||
|
|
|
|
|
|
|
|
|
|
|
|||||||||||
| Total operating expense |
26,639 | 36,023 | 57,545 | 26,920 | 35,213 | |||||||||||||||
|
|
|
|
|
|
|
|
|
|
|
|||||||||||
| Income (loss) from operations |
(6,033 | ) | (4,078 | ) | (4,308 | ) | (1,809 | ) | 4,957 | |||||||||||
| Other income (expense): |
||||||||||||||||||||
| Interest expense |
(108 | ) | (370 | ) | (1,504 | ) | (602 | ) | (946 | ) | ||||||||||
| Interest income |
44 | 29 | 85 | 44 | 77 | |||||||||||||||
| Other income (expense) |
140 | 49 | (125 | ) | 263 | 57 | ||||||||||||||
|
|
|
|
|
|
|
|
|
|
|
|||||||||||
| Income (loss) before provision for income taxes |
(5,957 | ) | (4,370 | ) | (5,852 | ) | (2,104 | ) | 4,145 | |||||||||||
| Provision for income taxes |
2 | 2 | 2 | 2 | 134 | |||||||||||||||
|
|
|
|
|
|
|
|
|
|
|
|||||||||||
| Net income (loss) |
$ | (5,959 | ) | $ | (4,372 | ) | $ | (5,854 | ) | $ | (2,106 | ) | $ | 4,011 | ||||||
|
|
|
|
|
|
|
|
|
|
|
|||||||||||
| Net income (loss) per share: |
||||||||||||||||||||
| Basic |
$ | (1.25 | ) | $ | (0.88 | ) | $ | (1.16 | ) | $ | (0.42 | ) | $ | 0.15 | ||||||
|
|
|
|
|
|
|
|
|
|
|
|||||||||||
| Diluted |
$ | (1.25 | ) | $ | (0.88 | ) | $ | (1.16 | ) | $ | (0.42 | ) | $ | 0.11 | ||||||
|
|
|
|
|
|
|
|
|
|
|
|||||||||||
| Weighted-average shares used to compute per share amounts: |
||||||||||||||||||||
| Basic |
4,752 | 4,956 | 5,049 | 5,035 | 26,046 | |||||||||||||||
|
|
|
|
|
|
|
|
|
|
|
|||||||||||
| Diluted |
4,752 | 4,956 | 5,049 | 5,035 | 35,865 | |||||||||||||||
|
|
|
|
|
|
|
|
|
|
|
|||||||||||
8
Table of Contents
Stock-based compensation included in the accompanying statements of operations data above was as follows:
| Year Ended December 31, | Six Months Ended June 30, |
|||||||||||||||||||
| 2010 | 2011 | 2012 | 2012 | 2013 | ||||||||||||||||
| (in thousands) | ||||||||||||||||||||
| (unaudited) | ||||||||||||||||||||
| Stock-based compensation expense: |
||||||||||||||||||||
| Marketing |
$ | 72 | $ | 145 | $ | 282 | $ | 117 | $ | 198 | ||||||||||
| Technology and development |
93 | 235 | 727 | 318 | 522 | |||||||||||||||
| Customer service and operations |
107 | 118 | 256 | 109 | 184 | |||||||||||||||
| General and administrative |
278 | 451 | 1,180 | 464 | 833 | |||||||||||||||
|
|
|
|
|
|
|
|
|
|
|
|||||||||||
| Total stock-based compensation |
$ | 550 | $ | 949 | $ | 2,445 | $ | 1,008 | $ | 1,737 | ||||||||||
|
|
|
|
|
|
|
|
|
|
|
|||||||||||
The following table presents our key operating and financial metrics for the years and interim periods presented (unaudited):
| Year Ended December 31, | Six Months Ended June 30, | |||||||||||||||||||
| 2010 | 2011 | 2012 | 2012 | 2013 | ||||||||||||||||
| Other Financial and Operational Data: |
||||||||||||||||||||
| Gross Sending Volume (in thousands)(1) |
$ | 858,955 | $ | 1,706,659 | $ | 3,248,457 | $ | 1,530,398 | $ | 2,662,431 | ||||||||||
| Transactions(2) |
2,848,000 | 4,068,000 | 6,617,000 | 3,002,000 | 4,621,000 | |||||||||||||||
| Active Customers(3) |
392,666 | 516,597 | 776,426 | 658,233 | 919,610 | |||||||||||||||
| New Customers(4) |
225,949 | 291,532 | 405,304 | 208,416 | 244,530 | |||||||||||||||
| Cost Per Acquisition of a New Customer(5) |
$ | 37 | $ | 38 | $ | 44 | $ | 43 | $ | 42 | ||||||||||
| Adjusted EBITDA (in thousands)(6) |
$ | (5,067 | ) | $ | (2,532 | ) | $ | (493 | ) | $ | 75 | $ | 7,723 | |||||||
| (1) | Reflects the total principal amount of funds sent, excluding our fees, during a given period. |
| (2) | Reflects the aggregate number of transactions sent using our services during a given period. |
| (3) | Reflects customers who have sent at least one transaction during the last twelve month trailing period. |
| (4) | Reflects new customers added who have transacted at least once during a given period. |
| (5) | Reflects direct marketing cost, a portion of which is reflected in our cost of revenue, divided by new customers added in a given period. |
| (6) | See “Non-GAAP Financial Measures” below for how we define and calculate adjusted EBITDA, a reconciliation of adjusted EBITDA to net income (loss), the most directly comparable GAAP financial measure, and a discussion about the limitations of adjusted EBITDA. |
| As of December 31, | As of June 30, 2013 | |||||||||||||||
| 2011 | 2012 | Actual | As Adjusted(1) | |||||||||||||
| (in thousands) | ||||||||||||||||
| (unaudited) | ||||||||||||||||
| Consolidated Balance Sheet Data: |
||||||||||||||||
| Cash and cash equivalents |
$ | 48,248 | $ | 45,077 | $ | 91,072 | $ | |||||||||
| Disbursement prefunding |
9,004 | 15,070 | 14,236 | |||||||||||||
| Customer funds receivable |
17,187 | 9,318 | 47,456 | |||||||||||||
| Property, equipment and software, net |
2,185 | 3,884 | 3,787 | |||||||||||||
| Working capital |
56,323 | 68,838 | 162,740 | |||||||||||||
| Total assets |
100,190 | 113,093 | 233,020 | |||||||||||||
| Convertible preferred stock |
2,144 | 2,144 | — | |||||||||||||
| Total stockholders’ equity |
60,361 | 57,320 | 152,051 | |||||||||||||
| (1) | The as adjusted balance sheet data in the table above reflects the sale of shares of our common stock in this offering by us at an estimated offering price of $ per share, the last reported sale price of our common stock on the NASDAQ Global Select Market on , 2013, and after deducting estimated underwriting discounts and commissions and estimated offering expenses payable by us. |
9
Table of Contents
Non-GAAP Financial Measures
Adjusted EBITDA
To provide investors with additional information regarding our financial results, we have disclosed in the table above and within this prospectus adjusted EBITDA, a non-GAAP financial measure. We have provided a reconciliation below between adjusted EBITDA and net income (loss), the most directly comparable GAAP financial measure.
We have included adjusted EBITDA in this prospectus because it is a key measure used by our management to evaluate our operating performance, generate future operating plans and make strategic decisions. Accordingly, we believe that adjusted EBITDA provides useful information to investors and others in understanding and evaluating our operating results in the same manner as our management and board of directors.
While we believe that this non-GAAP financial measure is useful in evaluating our business, this information should be considered as supplemental in nature and is not meant as a substitute for the related financial information prepared in accordance with GAAP. Some of these limitations are:
| • | although depreciation and amortization are non-cash charges, the assets being depreciated and amortized may have to be replaced in the future; |
| • | adjusted EBITDA does not reflect changes in, or cash requirements for, our working capital needs; |
| • | adjusted EBITDA does not include the impact of stock-based compensation; |
| • | adjusted EBITDA does not reflect income tax payments that may represent a reduction in cash available to us; and |
| • | other companies, including companies in our industry, may calculate adjusted EBITDA differently or not at all, which reduces its usefulness as a comparative measure. |
We believe it is useful to exclude non-cash charges, such as depreciation and amortization and stock-based compensation, from our adjusted EBITDA because the amount of such expenses in any specific period may not directly correlate to the underlying performance of our business operations.
Because of the aforementioned limitations, you should consider adjusted EBITDA alongside other financial performance measures, including net income (loss), cash flow metrics and our financial results presented in accordance with GAAP. The following table presents a reconciliation of net income (loss) to adjusted EBITDA for each of the years and interim periods indicated (unaudited):
| Year Ended December 31, | Six Months Ended June 30, |
|||||||||||||||||||
| 2010 | 2011 | 2012 | 2012 | 2013 | ||||||||||||||||
| (in thousands) | ||||||||||||||||||||
| Reconciliation of Adjusted EBITDA: |
||||||||||||||||||||
| Net income (loss) |
$ | (5,959 | ) | $ | (4,372 | ) | $ | (5,854 | ) | $ | (2,106 | ) | $ | 4,011 | ||||||
| Provision for income taxes |
2 | 2 | 2 | 2 | 134 | |||||||||||||||
| Interest expense |
108 | 370 | 1,504 | 602 | 946 | |||||||||||||||
| Interest income |
(44 | ) | (29 | ) | (85 | ) | (44 | ) | (77 | ) | ||||||||||
| Depreciation and amortization |
276 | 548 | 1,495 | 613 | 972 | |||||||||||||||
| Stock-based compensation |
550 | 949 | 2,445 | 1,008 | 1,737 | |||||||||||||||
|
|
|
|
|
|
|
|
|
|
|
|||||||||||
| Adjusted EBITDA |
$ | (5,067 | ) | $ | (2,532 | ) | $ | (493 | ) | $ | 75 | $ | 7,723 | |||||||
|
|
|
|
|
|
|
|
|
|
|
|||||||||||
10
Table of Contents
Investing in our common stock involves a high degree of risk. You should carefully consider the following risks and all other information contained in this prospectus, including our consolidated financial statements and the related notes thereto, before investing in our common stock. If any of the following risks materialize, our business, financial condition and results of operations could be materially harmed. In that case, the trading price of our common stock could decline, and you may lose some or all of your investment.
Risks Related to Our Business
We have incurred significant operating losses in the past, and we may not be able to sustain our recent revenue growth and generate sufficient revenue to achieve or maintain profitability.
Since our inception, we have incurred significant operating losses and, as of December 31, 2012, we had an accumulated deficit of $63.4 million. Although our revenue has grown rapidly, increasing from $14.1 million in 2008 to $80.0 million in 2012, we expect that our revenue growth rate will decline in the future as a result of a variety of factors, including the maturation of our business, increased competition and the gradual decline in the year-over-year percentage growth of new customers. You should not rely on the revenue growth of any prior quarterly or annual period as an indication of our future performance. We also expect our costs to increase in future periods as we continue to expend substantial financial resources on, among other things:
| • | business development and marketing; |
| • | technology infrastructure; |
| • | service and feature development and enhancement; |
| • | international expansion efforts; and |
| • | general administration, including legal and accounting expenses related to being a public company. |
These investments may not result in increased revenue or growth in our business. If we are unable to maintain adequate revenue growth and to manage our expenses, we may continue to incur significant losses in the future and may not be able to achieve or maintain profitability.
We have a limited operating history in an evolving industry, which makes it difficult to evaluate our future prospects and may increase the risk that we will not be successful.
We have a limited operating history in an evolving market that may not grow as expected. This limited operating history makes it difficult to effectively assess our future prospects. You should consider our business and prospects in light of the risks and difficulties we encounter in this evolving market. These risks and difficulties include our ability to, among other things:
| • | retain an active customer base and attract new customers; |
| • | avoid interruptions or disruptions in our service or slower-than-expected website load times; |
| • | improve the quality of the customer experience on our website and through mobile devices; |
| • | earn and preserve our customers’ trust with respect to the security of their digital money transfers and personal financial information; |
| • | process, store and use personal customer data in compliance with governmental regulation and other legal obligations related to privacy; |
| • | comply with extensive existing and new laws and regulations; |
| • | effectively maintain a scalable, high-performance technology infrastructure that can efficiently and reliably handle increased digital money transfers globally; |
11
Table of Contents
| • | successfully deploy new or enhanced features and services; |
| • | compete with other companies that are currently in, or may in the future enter, the digital money transfer business; |
| • | hire, integrate and retain world-class talent; and |
| • | expand our business into new sending and receiving countries. |
If the market for digital money transfer does not develop as we expect, or if we fail to address the needs of this market, our business will be harmed. We may not be able to successfully address these risks and challenges, including those described elsewhere in these risk factors. Failure to adequately address these risks and challenges could harm our business and results of operations.
If we fail to attract new customers or retain our existing customers, our business and revenue will be harmed.
We must continually attract new customers and retain existing customers in order to grow our business. Our ability to do so depends in large part on the success of our marketing efforts, our ability to enhance our services and our overall customer experience, to keep pace with changes in technology and our competitors and to expand our marketing partnerships and disbursement network. We spent $21.5 million on marketing and $16.0 million on technology and development in 2012, and we expect to continue to spend significant amounts to acquire new customers and to keep existing customers loyal to our service. We cannot assure you that the revenue from customers we acquire will ultimately exceed the marketing and technology and development costs associated with acquiring these customers. We may not be able to acquire new customers in sufficient numbers to continue to grow our business due to macroeconomic factors including exchange rate fluctuations, increased competition, new regulations or other factors, or we may be required to incur significantly higher marketing expenses in order to acquire new customers. If the level of usage by our existing customers declines or does not continue as expected, we may suffer a decline in customer growth or revenue. In addition, our marketing efforts may fail to attract or retain customers. As we continue to work with endorsers to promote our business, negative publicity about our endorsers or a failure to enter into cost effective endorsement arrangements could adversely affect our reputation. A decrease in the level of usage or customer growth would harm our business and revenue.
Inaccurate forecasts of our new customer growth could result in our expenses exceeding our revenue and ultimately harm our business.
Our new customer growth forecast is a key driver in our business plan which affects our ability to accurately forecast revenue. If we overestimate new customer growth, our revenue will not grow as we forecast, our costs and expenses may continue to exceed our revenue and our profitability will be harmed. In addition, we plan our operating expenses, including marketing expenses, and our hiring needs in part on our forecasts of new customer growth and future revenue. If new customer growth or revenue for a particular period is lower than expected, we may not be able to proportionately reduce our operating expenses for that period, which would harm our results of operations for that period.
If the revenue generated by new customers differs significantly from our expectations, or if our customer acquisition costs or costs associated with servicing our customers increase, we may not be able to recover our customer acquisition costs or generate profits from this investment.
We spent $21.5 million on marketing to acquire new customers in 2012 and expect to continue to spend significant amounts to acquire additional customers, primarily through television advertising, online advertising and marketing promotions. Our decisions regarding investments in customer acquisition are based upon our analysis of the revenue we have historically generated per customer over the expected lifetime value of the customer. Our analysis of the revenue that we expect a new customer to generate over his or her lifetime depends upon several estimates and assumptions, including whether a customer will send a second transaction, whether a customer will send multiple transactions in a month, the amount of money that a customer sends in a transaction and the predictability of a customer’s sending pattern. Our experience in markets in which we presently have low penetration rates may differ from our more established markets.
12
Table of Contents
If our estimates and assumptions regarding the revenue we can generate from new customers prove incorrect, or if the revenue generated from new customers differs significantly from that of prior customers, we may be unable to recover our customer acquisition costs or generate profits from our investment in acquiring new customers. Moreover, if our customer acquisition costs or our operating costs increase, as they historically have, the return on our investment may be lower than we anticipate irrespective of the revenue generated from new customers. If we cannot generate profits from this investment, we may need to alter our growth strategy, and our growth rate and results of operations may be harmed.
Our quarterly operating results fluctuate and may not predict our future performance accurately. Variability in our future performance could cause our stock price to fluctuate or decline.
Although we have grown quickly in recent years, our quarterly operating results will fluctuate in the future as a result of a variety of factors, many of which are beyond our control. These factors include:
| • | changes in our costs, including transaction fees charged by our payment processors and disbursement partners; |
| • | relative rates of acquisition of new customers; |
| • | the digital money transfer sending behavior of our customers, including seasonal patterns; |
| • | exchange rate fluctuations; |
| • | changes in our pricing policies or those of our competitors; |
| • | the introduction of new or enhanced services and related features by us or our competitors and any delays in the introduction of such services or market acceptance of these features and services; |
| • | the number of customer transaction refunds in a given period; |
| • | the number of fraudulent transactions in a given period; |
| • | the success rate of recovering failed or insufficient transaction funding; |
| • | bank holidays in foreign markets; |
| • | draw downs on our line of credit; and |
| • | other changes in our operating expenses, personnel and general economic conditions. |
As a result, period-to-period comparisons of our operating results may not be meaningful, and you should not rely on them as an indication of our future performance.
Our cash balances are significantly affected by the day of the week on which a quarter ends. As a result, you should not rely on quarter-to-quarter comparisons of our cash balances.
Our cash balances may be affected by the day of the week on which each quarter ends which may affect our quarterly operating results. There is a delay between when we release funds for disbursement and when we receive customer funds from our payment processors. For example, if a quarter closes on a Saturday, our analysis of cash flow statements will show a decreased cash balance because we will have wired out funds on Friday which will be available for disbursement on Saturday, Sunday and Monday but we will not receive customer funds from our payment processors until Monday. In addition, due to time zone differences, an additional day’s worth of funding is required for disbursements to certain markets. As a result, period-to-period comparisons of our statements of cash flows may not be meaningful, and you should not rely on them as an indication of our liquidity or capital resources.
13
Table of Contents
Failure to maintain sufficient capital could harm our business, financial condition and results of operations.
We have significant working capital requirements driven by:
| • | the delay between when we release funds for disbursement and when we receive customer funds from our payment processors, exacerbated by time zone differences, bank holidays and weekends; |
| • | regulatory requirements; |
| • | collateral requirements imposed on our subsidiary by our Indian regulator; |
| • | collateral requirements imposed on us by our payment processors; and |
| • | collateral requirements imposed on us by our disbursement partners. |
This requires us to have access to significant amounts of capital, particularly at high volume sending times which we may not be able to forecast accurately. Our need to access capital will increase as our number of customers, transactions processed and gross sending volume increases. If we do not have sufficient capital, we may not be able to pursue our growth strategy, fund key strategic initiatives, such as feature development, or continue to transfer money to recipients before we receive the funds from our customers, which we refer to as instant ACH transactions. In addition, we may not be able to meet new capital requirements introduced or required by our regulators and payment processors. Increases in our transactions processed, even if short term in nature, can cause increases in our capital requirements. We currently have a line of credit but there can be no assurance that the line of credit will be sufficient or that we will have access to additional capital. Failure to meet capital requirements or to have access to sufficient capital could harm our business, financial condition and results of operations.
Our revenue and profitability could be harmed and fluctuate period-to-period due to changes in foreign exchange rates and other risks related to foreign exchange.
We have seen increased money transfer volume if the U.S. dollar strengthens against certain currencies. Conversely, we have seen decreased money transfer volume if the U.S. dollar weakens against certain currencies. In particular, we experience abrupt changes in money transfer volume to India when the U.S. dollar strengthens or weakens against the Indian rupee. As foreign exchange rates vary, revenue and other results of operations may differ materially from expectations. We have in the past and may in the future experience significant volatility in foreign exchange rates which we believe has resulted in short-term increases in transactions and gross sending volume. We may not be able to predict how perceptions of foreign exchange rates will influence customer behavior. It is possible that customers may choose not to send transactions, or not to send as much money per transaction, after a period of particularly high sending activity. This uncertainty may make it more difficult to forecast revenue and results of operations.
We generate a substantial portion of our revenue from foreign exchange spreads on transactions where the payout currency is other than U.S. dollars. We typically purchase foreign currency each business day on an as-needed basis and evaluate and reset our foreign exchange spread as necessary. Our revenue may be reduced if we incorrectly set our foreign exchange spread. Our revenue also could be reduced in certain instances when customers initiate transactions in a foreign currency that we have not yet purchased. In such instances, if the foreign exchange rate changes materially between the time that a customer initiates a transaction and the time that we purchase the foreign currency, then our revenue could be reduced and our profitability harmed. Our revenue also could be reduced and our profitability harmed if the foreign exchange rate changes between when we purchase our foreign currency and when we sell the foreign currency. In that case, we may reduce our spread to remain competitive or keep our spread the same but lose transaction volume because our exchange rates are viewed as uncompetitive. In addition, foreign exchange rates could become regulated by either U.S. or foreign governments and such governments could implement new laws or regulations that limit our right to set foreign exchange spreads. We may not be able to comply with such regulations and such regulations could harm our business. We do not currently hedge our foreign currency exposure but may in the future.
14
Table of Contents
We may not be able to secure additional financing in a timely manner, or at all, to meet our future capital needs, which could impair our ability to execute on our business plan.
We believe that our existing cash, cash equivalents and short-term investments, available borrowing under our existing line of credit, expected cash flow from operations and net proceeds of this offering, will be sufficient to meet our operating and capital requirements for at least the next 12 months. However, we may require additional capital to respond to business opportunities (including increasing the number of customers acquired or during high volume sending periods), challenges, acquisitions or unforeseen circumstances and may determine to engage in equity or debt financings for other reasons. Any debt financing secured by us in the future could involve restrictive covenants relating to our capital raising activities and other financial and operational matters, which may make it more difficult for us to obtain additional capital and to pursue business opportunities, including potential acquisitions. We may not be able to secure additional debt or equity financing in a timely manner, or at all, which could require us to scale back our business plan and operations.
We have substantial debt obligations that could restrict our operations.
As of June 30, 2013, we had $49.0 million in indebtedness outstanding, as well as $16.0 million available borrowing capacity under our line of credit and $15.0 million reserved under our standby letter of credit, and we may incur additional indebtedness in the future.
Our indebtedness could have adverse consequences on our business, including:
| • | limiting our ability to compete and our flexibility in planning for, or reacting to, changes in our business and the industry; |
| • | limiting our ability to borrow additional funds because our line of credit agreement contains financial and restrictive covenants that could significantly impact our ability to operate our business, and any failure to comply with them may result in an event of default, which could harm our business; |
| • | requiring us to dedicate a substantial portion of our cash flows from operations to repay our debt, thereby reducing funds available for working capital and other purposes; |
| • | increasing our vulnerability to changing economic, regulatory and industry conditions; and |
| • | limiting our ability to pay dividends to our stockholders. |
Actions by regulators could interfere with our business or require us to limit or cease money transfers, which could harm our business and results of operations.
Money transfers are regulated by state, federal and foreign governments. We, along with our payment processors and disbursement partners, are subject to an extensive set of legal and regulatory requirements, including licensing requirements in many U.S. states and in India. If federal, state or foreign regulators were to take actions that interfered with our ability to transfer money reliably, attempt to seize money transfer funds, or limit or prohibit us, our payment processors or our disbursement partners from transferring money in certain countries, this could harm our business. For example, we have in the past ceased to do business in South Korea as a result of regulatory scrutiny of our disbursement partner’s business in South Korea. If we are prevented from transferring money from particular states or jurisdictions that are significant to our business, it could harm our business and results of operations. For more information, see “—Regulatory Risks Faced by our Business.”
We generate a substantial portion of our revenue from money transfers to India and the Philippines, and the failure to continue to generate such revenue due to economic, political or regulatory factors beyond our control could harm our business, financial position and results of operations.
Approximately 60% of our total revenue in 2012 was derived from money transfers to India and the Philippines. As a result, any limitations (regulatory or otherwise) on our ability to send money to these
15
Table of Contents
jurisdictions, or any economic or political instability, civil unrest, natural disasters or other similar circumstances localized in these countries could have a disproportionately harmful impact on our business, financial position and results of operations.
Our business is subject to seasonal fluctuations which could result in volatility or have an adverse effect on the market price of our common stock.
Our business is subject to some degree of seasonality. Historically, we have experienced increased money transfer volume during holiday periods such as Mother’s Day and Christmas and decreased money transfer volume during the first and third quarters. As the growth of our business stabilizes, these seasonal fluctuations may become more evident as our current growth may mask seasonality to some degree. Seasonality may cause our working capital cash flow requirements to vary from quarter to quarter depending on the variability in the volume and timing of money transfers. These factors, among other things, make forecasting our future business results and needs more difficult and may adversely affect our ability to manage working capital and to predict financial results accurately, which could adversely affect the market price of our common stock.
We face intense competition and, if we are unable to continue to compete effectively, our business, financial condition and results of operations would be harmed.
The markets in which we compete are highly competitive and are highly fragmented. Our largest competitors are The Western Union Company and MoneyGram Payment Systems, Inc. We also compete against smaller, country-specific competitors, banks and informal person-to-person money transfer service providers that evade regulation. In the future, new competitors, alliances, or consolidation among established companies may emerge, or competitors may leave the market, resulting in a changed competitive environment. Some of our competitors have longer operating histories, significantly greater financial, technical, marketing, customer service and other resources, greater name recognition, exclusive agreements or a larger base of customers in affiliated businesses than us. Our competitors may respond to new or emerging technologies and changes in customer requirements faster and more effectively than we do, and they could be perceived to effectively improve their products and services relative to ours. Our competitors may devote greater resources to the development, promotion and sale of money transfer services, offer lower prices or better exchange rates and may negotiate exclusive deals which would reduce our opportunities. For example, our competitors have offered coupons for free money transfers and, in India, have established no fee services. Competing services tied to established banks and other financial institutions may offer greater liquidity or superior foreign exchange rates and engender greater consumer confidence in the safety and efficacy of their services than us. We expect competition to continue to intensify. This competition could result in increased pricing pressure, reduced profit margins, increased sales and marketing expenses, our failure to increase market share, or our loss of market share, any of which could harm our business, results of operations and financial condition. There can be no assurance that growth in the digital money transfer market will continue and that competitors would not decrease our market share. If we are unable to compete effectively and continue to grow our business, our business, financial condition and results of operations could be harmed.
New or existing technologies could gain wide adoption and supplant our services and features and harm our revenue and financial results.
The introduction of services embodying new technologies could render our existing services and features obsolete or less attractive to customers. Other similar technologies exist or could be developed in the future, and our business could be harmed if such technologies are widely adopted. We may not be able to successfully anticipate or adapt to changing technology or customer requirements on a timely basis, or at all. If we fail to keep up with technological changes or to convince our customers and potential customers of the value of our services even in light of new technologies, our business, results of operations and financial condition could be harmed.
16
Table of Contents
Sustained financial market illiquidity, or illiquidity at our financial institutions, could harm our business, financial condition and results of operations.
We face risks in the event of a sustained deterioration of financial market liquidity, as well as in the event of sustained deterioration in the liquidity or failure of financial institutions where we deposit money, including financial institutions that hold prefunding accounts for our disbursement partners. In particular:
| • | We may be unable to access funds in our investment portfolio, deposit accounts and clearing accounts on a timely basis to pay money transfers and receive settlement funds. Any resulting need to access other sources of liquidity or short-term borrowing would increase our costs. Any delay or inability to pay money transfers could harm our business, financial condition and results of operations; |
| • | Our funds are held by banks in the United States and abroad. During high volume sending periods, a significant portion of our available cash may be held in an account or accounts outside of the United States. Our payment processors, the commercial banks that hold our funds, our disbursement partners and the financial institutions that hold prefunding accounts for our disbursement partners or our disbursement collateral could fail or experience sustained deterioration in liquidity. This could lead to our inability to move funds on a global and timely basis as required to pay money transfers and receive settlement funds, loss of prefunded balances or a breach in our regulatory capital requirements if we are unable to recover our funds; |
| • | Our line of credit is one source of funding for our liquidity needs. If our lenders were unable or unwilling to fulfill their lending commitments to us, our short-term liquidity and ability to operate our business could be harmed; |
| • | We may be unable to borrow from financial institutions or engage in equity or debt financings on favorable terms, or at all, which could harm our ability to operate our business and pursue our growth strategy; and |
| • | We maintain cash at commercial banks in the United States in amounts in excess of the Federal Deposit Insurance Corporation, or the FDIC, limit of $250,000. In the event of a failure at a commercial bank where we maintain our deposits, we may incur a loss to the extent such loss exceeds the insurance limitation. |
If financial liquidity deteriorates, our business, financial condition and our ability to access capital may be harmed and we could become insolvent.
We face payment and fraud risks that could harm our business, financial condition and results of operations.
Individual customer transactions, making up more than 90% of the volume of amounts sent through Xoom in the aggregate, which we refer to as gross sending volume, is released for disbursement prior to our receiving funds from our customers, which exposes us to repayment risk. If customers have insufficient funds in their bank accounts or have closed their bank accounts and we are unable to collect the funds from customers, our revenue will decline and our business may be harmed. We also offer our customers the ability to transfer money utilizing their credit or debit card. Because these are card-not-present transactions, they involve a greater risk of fraud. If we are unable to effectively manage our payment and fraud risks, our business may be harmed.
To minimize payment and fraud risk, several requirements must be satisfied in order for a prospective customer to use our services. A prospective customer must provide us with the following information: name, address, e-mail address, phone number, date of birth, U.S.-based payment source, name of recipient, recipient disbursement information and recipient address. The U.S.-based payment source may be a bank account, credit card or debit card, but we do not require that it be from any particular bank or banks. All of the transaction data is then evaluated by our proprietary risk management system, which assesses the transaction for regulatory compliance, anti-money laundering, acceptable use, anti-fraud and funding risk. If the transaction is deemed to be high risk by our risk management system, then we will either hold the transaction for further screening or cancel the transaction.
17
Table of Contents
Criminals are using increasingly sophisticated methods to engage in illegal activities such as unauthorized use of credit or debit cards and bank account information. Because we are a digital service provider, requirements relating to customer authentication and fraud detection are more complex. We may ultimately be held liable for the unauthorized use of a cardholder’s card number in an illegal activity and be required by card issuers to pay a charge-back fee. Charge-backs result not only in our loss of fees earned with respect to the payment, but also leave us liable for the underlying money transfer amount. If our charge-back rate becomes excessive, card associations also may require us to pay fines. In addition, we may be subject to additional fraud risk if third-party service providers or our employees fraudulently use customer information for their own gain or facilitate the fraudulent use of such information. In general, we have little recourse if we process a criminally fraudulent transaction.
For the year ended December 31, 2012 and the six months ended June 30, 2013, our transaction loss expense totaled $7.7 million and $6.2 million, respectively, representing 0.24% and 0.23% of our gross sending volume, respectively. Our transaction loss expense may increase in future quarters if our fraud systems lose effectiveness. We have taken measures to detect and reduce the risk of fraud, but we cannot assure you of these measures’ effectiveness or our ability to update these measures to address future fraud risks. If these measures do not succeed, our business will be harmed.
The money transfer industry is under increasing scrutiny from federal, state and foreign regulators in connection with the potential for consumer fraud. Negative economic conditions may result in increased disbursement partner or consumer fraud. If consumer fraud levels involving our services were to rise, it could lead to regulatory intervention and reputational and financial damage to us. This, in turn, could lead to government enforcement actions and investigations, a reduction in the use and acceptance of our services or an increase in our compliance costs which may harm our business, financial condition and results of operations.
There has also been increased public attention regarding the use and disclosure of personal information, and regulatory authorities around the world are considering a number of legislative and regulatory proposals concerning data protection and consumer privacy and other matters that may be applicable to our business. Our ability to prevent fraudulent transactions may conflict with the goal of protecting individual privacy. If federal, state or foreign governments or our disbursement partners changed the parameters regarding the customer or recipient information we are allowed to monitor and/or collect, our ability to prevent fraud might be negatively impacted, and our business could be harmed.
We are exposed to the risk of loss or insolvency if our disbursement partners fail to disburse funds according to our instructions.
We are exposed to the risk of loss in the event our disbursement partners fail, for any reason, to disburse funds to recipients according to our instructions. Such reasons could include mistakes by our disbursement partners, or insolvency or fraud by our disbursement partners. To the extent such funds are not disbursed correctly and cannot be recovered, we could be exposed to significant losses, which could harm our results of operations, cash flows and financial condition or potentially cause insolvency. Our funds held by our disbursement partners are not insured by any government or other insurance programs. We have in the past and may in the future suffer such losses. In the event such losses occur, they are not covered by our provision for transaction losses, but are instead characterized in our statements of operations as bad debt.
Our ability to continue to offer our services in the manner we currently offer them depends, in part, on our ability to contract with third-party vendors on commercially reasonable terms.
We currently contract with and obtain certain services from a number of third-party vendors. If these vendors’ services are interrupted, we may experience a disruption in our services. Further, if these agreements are terminated or we are unable to renegotiate acceptable arrangements with these vendors or find alternative sources of such services, we may experience a disruption in our services and our business may be harmed.
18
Table of Contents
If we are unable to maintain our payment network under terms consistent with those currently in place, or if our disbursement partners encounter business difficulties, our business could be harmed.
Our payment network consists of payment processors and disbursement partners. Payment processors clear and process the funds from the customer to us. We rely on U.S. banks and card processors to provide clearing, processing and settlement functions for the funding of all of our transactions. Disbursement partners disburse funds to our customers’ recipients. We rely on a network of major banks and leading retailers to disburse funds to our customers’ recipients in 30 countries. In addition, our disbursement partners may operate their own network of disbursement partners, which we refer to as sub-disbursement partners, with which we do not have a direct relationship.
While we have entered into non-exclusive agreements with each of our payment processors and disbursement partners, our payment processors and disbursement partners could choose to terminate or not renew their agreements with us or disbursement partners could choose to terminate sub-disbursement partners. A sub-disbursement partner could also choose to terminate its relationship with our disbursement partner or with us. Payment processor, disbursement partner and sub-disbursement partner attrition might occur for a number of reasons, including such payment processor’s, disbursement partner’s or sub-disbursement partner’s dissatisfaction with the relationship or the revenue derived from the relationship, changes in the law or changes or perceived changes in the regulatory environment that prohibit continuing the relationship or make the relationship less profitable for our payment processor, disbursement partner or sub-disbursement partner. In the case of a disbursement partner, a competitor may engage a disbursement partner on an exclusive basis, offer greater financial incentives, or cause less attention to be provided to us. If we are unable to maintain our agreements with current payment processors and disbursement partners, or if our disbursement partners are unable to provide an adequate number of disbursement locations with satisfactory hours of operation in their network, our ability to disburse transactions and our revenue and business may be harmed.
Our payment processors and disbursement partners are critical components of our business. We have in the past experienced long business development periods before signing up both payment processors and disbursement partners. If we are unable to sign new payment processors and disbursement partners under terms consistent with, or better than, those currently in place, and if we are unable to sign new relationships or maintain our current relationships under terms consistent with those currently in place, our revenue and business may be harmed.
Payment processors and disbursement partners also engage in a variety of activities in addition to providing our services and may encounter business difficulties unrelated to our services. Such engagement could cause the affected payment processor or disbursement partner to reduce the services provided, cease to do business with us, or cease doing business altogether. This could lead to our inability to clear our payment instruments or move funds on a global and timely basis as required to settle our obligations. In addition, because we offer instant ACH transactions for the vast majority of our money transfers, if a disbursement partner experienced insufficient liquidity or ceased to do business, we may not be able to recover funds held with that disbursement partner which could lead to a breach of our capital requirements, our insolvency or otherwise harm our business.
We may also be forced to cease doing business with payment processors if card association operating rules, certification requirements and rules governing electronic funds transfers to which we are subject change or are reinterpreted to make it difficult or impossible for us to comply. If we fail to comply with these rules or requirements, we may be subject to fines and higher transaction fees and lose our ability to accept credit and debit card payments from customers or facilitate other types of online payments, and our business and operating results could be harmed.
If we fail to manage our growth effectively, our brand, results of operations and business could be harmed.
We have experienced rapid growth in our headcount and transaction volume, which places substantial demands on our management and operational infrastructure. Our headcount grew from 70 employees at
19
Table of Contents
December 31, 2010 to 150 employees at December 31, 2012, and then to 170 employees at June 30, 2013. Additionally, we may not be able to hire new employees quickly enough to meet our needs. As we continue to grow, we must effectively integrate, develop and motivate a large number of new employees, while maintaining the beneficial aspects of our company culture. If we fail, our efficiency and ability to meet our forecasts and our employee morale, productivity and retention could suffer, and our business and operating results could be harmed.
Our gross sending volume increased over 273% from $859.0 million in 2010 to $3.2 billion in 2012. Our gross sending volume for the six months ended June 30, 2013 was $2.7 billion. We will need to continue to improve our operational, financial and management controls, and our reporting systems and procedures in order to manage this growth. If we do not manage the growth of our business and operations effectively, the quality of our services and efficiency of our operations could suffer, which could harm our brand, results of operations and business.
If we fail to expand effectively into new markets abroad, our future growth rates may be harmed.
We are exploring opportunities to expand our operations into new markets abroad by both increasing the number of countries that customers can send money to and also increasing the number of countries where transactions can originate. Any future expansion into new markets could place us in unfamiliar competitive environments and involve various risks, including incurring losses or failing to comply with applicable laws and regulations. Such expansion would also require significant resources and management time, and there is no guarantee that, after expending such resources and time, we will receive the necessary approvals to operate in such new markets. If we are ultimately granted authority to operate in such new markets, it is possible that returns on such investments will not be achieved for several years, if at all. There is no guarantee that our business model will be successful in a new market, that we could maintain profit margins in these new markets or that international expansion would help grow our business. If we are unable to successfully expand our operations into new markets, our future growth rates may be harmed.
Increases in transaction processing fees could increase our costs, affect our profitability, or otherwise limit our operations.
Our payment processors and disbursement partners charge us fees which may be increased from time to time. Banks currently determine the fees charged for ACH transactions and may increase the fees with little prior notice. Our card processors have in the past and may in the future increase the fees charged for each transaction using credit and debit cards which may be passed on to us. Our card processors currently assign us merchant category codes which may change from time to time. Any changes to these codes may affect the fees our customers are charged if they use a credit card, which could increase the overall cost to use our service.
Our disbursement partners charge us disbursement fees which they may renegotiate if they are dissatisfied with their revenue or if we are not providing them with enough transactions. U.S. and foreign governments could also mandate a payment processing tax or require additional taxes or fees to be imposed upon our customers, or otherwise impact the manner in which we provide our services. Any such taxes or increased fees could increase our operating costs, require us to provide additional disbursement collateral and reduce our profit margins.
The effectiveness of our marketing solutions depends in part on our relationships with media buying companies.
We rely, in part, on media buying companies to deliver our online and television marketing. We typically enter into short-term agreements with advertising companies for estimated levels of advertising. If we are not able to have our advertising orders fulfilled, if our agreements with these companies are not extended or renewed, or if we are not able to extend or renew our agreements on terms and conditions favorable to us and we are not able to enter into agreements with alternative companies on acceptable terms or on a timely basis, or both, our business could be harmed.
20
Table of Contents
Our services might be used for illegal or improper purposes, which could expose us to additional liability and harm our business.
Our services remain susceptible to potentially illegal or improper uses as criminals are using increasingly sophisticated methods to engage in illegal activities involving Internet services and payment providers. Because our customers transfer money using bank accounts or credit and debit cards via the Internet, and these are not face-to-face transactions, these transactions involve a greater risk of fraud. Other illegal or improper uses of our services may include money laundering, terrorist financing, drug trafficking, human trafficking, illegal online gaming, romance and other online scams, illegal sexually-oriented services, prohibited sales of pharmaceuticals, fraudulent sale of goods or services, piracy of software, movies, music and other copyrighted or trademarked goods, unauthorized uses of credit and debit cards or bank accounts and similar misconduct. Users of our services may also encourage, promote, facilitate or instruct others to engage in illegal activities. If the measures we have taken are too restrictive and inadvertently screen proper transactions, this could diminish our customer experience which could harm our business. Despite measures we have taken to detect and lessen the risk of this kind of conduct, we cannot assure you that these measures will stop all illegal or improper uses of our services. Our business could be harmed if customers use our system for illegal or improper purposes.
If our payment processors and disbursement partners experience an interruption in service, our business and revenue would be harmed.
Our payment processors and disbursement partners have experienced service outages or an inability to connect with our processing systems and this may reoccur in the future. If a payment processor experiences a service outage or service interruption that results in our being unable to collect funds from customers, our liquidity could be harmed and we may not meet our capital requirements.
We rely on our disbursement partners’ information systems to obtain transaction data. If a disbursement partner, or its sub-disbursement partner, experiences a significant disruption to its information system, is unable to synch its system to our system, or does not maintain the appropriate controls over its systems, we may lose our customers’ confidence and our reputation may be harmed. Specific problems that could arise include a disbursement partner could be unable to disburse funds in the time period that we communicated to our customers, we may be unable to confirm if a transaction has been disbursed or customer information could be compromised. We currently undergo an extensive integration process with each disbursement partner, but unforeseen bugs or services outages by either the disbursement partner or us could delay disbursement. Such outages have lasted from a couple of hours to a couple of days and may be unplanned. If we are unable to minimize service outages, our business and revenue would be harmed.
If our disbursement partners do not provide a positive recipient experience, our business would be harmed.
We rely on our disbursement partners to disburse funds to our customers’ recipients. If the experience delivered by our disbursement partners to a recipient is deemed unsatisfactory for any reason, including because our disbursement partners are not properly trained to disburse money or deliver poor customer service, if wait times at our disbursement partners’ pick up locations are too long, or if cash pick-up locations are not located in convenient and safe locations and open for business at convenient times, customers may choose to not use our services in the future and our business would be harmed.
Customer complaints or negative publicity could result in a decline in the use of our services and our business could suffer.
Customer complaints or negative publicity about our service could diminish consumer confidence in our services which could lead to a reduced use of our services. Breaches of our customers’ privacy and our security measures could have the same effect. Measures we take to combat risks of fraud and breaches of privacy and security, such as cancelling customer transactions or closing customer accounts, can damage relations with our customers by restricting or decreasing money transfers or restricting the activities of certain customers. These
21
Table of Contents
measures heighten the need for prompt and accurate customer service to resolve irregularities and disputes. Effective customer service requires significant personnel expense, and this expense, if not managed properly, could impact our profitability significantly. Any inability by us to manage or train our own or our outsourced customer service representatives properly could compromise our ability to handle customer complaints effectively. If we do not handle customer complaints effectively, our reputation may be harmed and we may lose our customers’ confidence.
If consumers’ confidence in our business or in money transfer providers generally deteriorates, our business could be harmed.
We rely on consumers’ confidence in our brand and our ability to provide a convenient, fast and cost-effective service to send money online to family and friends. Erosion in confidence in our business, or in money transfer providers as a means to transfer money, could adversely impact money transfer volumes, which would in turn harm our business, financial position and results of operations.
A number of factors could adversely affect consumers’ confidence in our business, or in money transfer providers generally, many of which are beyond our control, and could have an adverse impact on our results of operations. These factors include:
| • | changes or proposed changes in laws or regulations or system rules that make it more difficult for consumers to transfer money using traditional money transfer providers or require us to capture or handle data in a way that is more burdensome or expensive; |
| • | actions by federal, state or foreign regulators that interfere with our ability to transfer consumers’ money reliably, including, for example, attempts to seize money transfer funds; |
| • | federal, state or foreign legal requirements, including those that require us to provide consumer data to a greater extent than is currently required; |
| • | any significant interruption in our systems, including by fire, natural disaster, power loss, telecommunications failure, terrorism, vendor failure, unauthorized entry and computer viruses; and |
| • | any breach, or reported breach, of our security policies or legal requirements resulting in a compromise of consumer data. |
We may be unable to continue to use the domain names that we use in our business, or prevent third parties from acquiring and using domain names that infringe on, are similar to, or otherwise decrease the value of our brand or our trademarks.
We have registered domain names for our website that we use in our business, such as www.xoom.com. If we lose the ability to use a domain name, whether due to trademark claims, failure to renew the applicable registration, or any other cause, we may be forced to market our services under a new domain name, which could diminish our brand or cause us to incur significant expenses in order to purchase rights to the domain name in question. In addition, our competitors and others could attempt to capitalize on our brand recognition by using domain names similar to ours. Domain names similar to ours have been registered in the United States and elsewhere. We may be unable to prevent third parties from acquiring and using domain names that infringe on, are similar to, or otherwise decrease the value of our brand or our trademarks or service marks. Protecting and enforcing our rights in our domain names may require litigation, which could result in substantial costs and diversion of management’s attention, and we may not prevail.
If Internet search engines’ methodologies are modified or our search result page rankings decline for other reasons, our new customer growth could decline.
We depend in part on various Internet search engines, such as Google and Yahoo!, to direct a significant amount of traffic to our website. Our ability to maintain the number of visitors directed to our website is not entirely within our control. Our competitors’ search engine optimization efforts may result in their websites receiving a higher search result page ranking than ours, or Internet search engines could revise their
22
Table of Contents
methodologies in an attempt to improve their search results, which could adversely affect the placement of our search result page ranking. As a result, links to our website may not be prominent enough to drive traffic to our website, and we may not be able to influence the results. If Internet search engines modify their search algorithms in ways that are detrimental to our new customer growth or in ways that make it harder for our customers to find or use our website, or if our competitors’ search engine optimization efforts are more successful than ours, overall growth in our customer base could slow, and we could lose existing customers. In addition, search engines that we use to advertise our brand have frequently changing rules that govern the pricing, availability and placement of online advertisements (e.g., paid search and keywords) and changes to these rules could harm our ability to use online advertising to promote our brands in a cost-effective manner. Our website has experienced fluctuations in search result rankings in the past, and we anticipate similar fluctuations in the future. Any reduction in the number of persons directed to our website would harm our business.
Many people use smartphones and other mobile devices to access information on the Internet and if we are not successful in developing effective mobile solutions, or those solutions are not widely adopted, our business could be harmed.
The number of people who access the Internet through mobile devices, including smartphones and handheld tablets or computers, has increased significantly in the past few years and is expected to continue to increase. Mobile devices provide us an additional channel to offer our services to new and existing customers and offer a convenient solution to send money at any time, from any Internet-enabled location. We believe that mobile devices provide some customers with their first sustained Internet connection, which gives them access to our digital money transfer services. Customers can currently access our services on our mobile site or our mobile application. If we are not able to drive customers to our mobile site or mobile application or generate customer usage of our mobile website and mobile application, our ability to grow our business could be harmed.
Additionally, as new mobile devices and platforms are released, it is difficult to predict the problems we may encounter in developing features for these alternative devices and platforms, and we may need to devote significant resources to the creation, support and maintenance of such features. In addition, if we experience difficulties in the future in integrating our mobile application into mobile devices or if problems arise with our relationships with providers of mobile operating systems or mobile application download stores or if we face increased costs to distribute our mobile application, our future growth and results of operations could suffer. In addition, we may face different fraud risks from transactions sent from mobile devices than we do from personal computers. If we are unable to effectively anticipate and manage these fraud risks, our business and results of operations may be harmed.
We may not timely and effectively scale and adapt our existing technology and network infrastructure to ensure that our services are accessible.
The ability to access our services at all times and at acceptable load times is important for our business. We have previously experienced, and may experience in the future, service disruptions, outages and other performance problems due to a variety of factors, including infrastructure changes, human or software errors, hardware failures, capacity constraints due to an overwhelming number of customers accessing our service simultaneously, denial of service, fraud or security attacks or failure of third-party service providers on whom we rely to perform data hosting and related services. In some instances, we may not be able to identify the cause of these performance problems within an acceptable period of time. It may become increasingly difficult to maintain and improve the availability and reliability of our services, especially during peak usage times and as our services become more complex and our customer traffic increases. If our service is unavailable when customers attempt to access it or it does not load as quickly as they expect, customers may believe that our services are unreliable or too slow. New or existing customers may seek other money transfer services and may not return to our services as often in the future, or at all. This would harm our ability to attract customers and could decrease the frequency with which they use our website, mobile website and mobile application. We expect to continue to make significant investments to maintain and improve the availability and reliability of our
23
Table of Contents
services and to enable rapid releases of new features. To the extent that we do not effectively address capacity constraints, upgrade our systems as needed and continually develop our technology and network architecture to accommodate actual and anticipated changes in technology, our business and results of operations may be harmed.
We recently implemented a disaster recovery program, which allows us to transition our websites and data to a backup center in the event of a catastrophe. Although this program has been tested and is functional, it does not yet provide a real-time back-up data center, so if our primary data center shuts down, there will be a period of time that our websites will remain shut down while the transition to the back-up data center takes place. Further, some of our systems are not fully redundant, and our disaster recovery program is not sufficient for all eventualities.
We market certain levels of service to our customers, including advertisements regarding the speed of our service. If we fail to meet the advertised levels of service, our business could be harmed.
Our direct to consumer marketing may include certain claims, both direct and implied, regarding the quality of our services. For example, we have deployed advertising for our India business in which we say we are able to, within certain timeframes, to deposit money into recipients’ accounts within four hours. If we are unable to meet the claims made in our advertisements and our marketing, we may alienate or lose credibility with our customers, and we may attract legal or regulatory scrutiny, including potentially under new remittance rules which will take effect in the United States in October 2013 as described elsewhere in these risk factors. New or existing customers may seek other money transfer services and may not return to our services as often in the future, or at all. This would harm our ability to attract new customers and could decrease the frequency with which current customers use our service, which would be harmful to our business and our revenue.
A breach of security of our systems could harm our business.
We obtain, transmit and store confidential customer information in connection with our services. These activities are subject to laws and regulations in the United States and other jurisdictions. The requirements imposed by these laws and regulations, which often differ materially among the many jurisdictions to which we are subject, are designed to protect the privacy of personal information and to prevent that information from being inappropriately disclosed. We rely on a variety of technologies to provide security for our systems. Advances in computer capabilities, new discoveries in the field of cryptography or other events or developments, including improper acts by third parties, may result in a compromise or breach of the security measures we use to protect our systems. We could also suffer from an internal security breach. If a third party or an employee were to misappropriate, misplace or lose corporate information, including our financial and account information, our customers’ personal information or our source code, our business may be harmed. We may be required to expend significant capital and other resources to protect against these security breaches or losses or to alleviate problems caused by these breaches or losses. Our disbursement partners and third-party contractors also may experience security breaches involving the storage and transmission of our data. If third parties gain improper access to our systems or databases or those of our disbursement partners or contractors, they may be able to steal, publish, delete or modify confidential customer information. A security breach could expose us to monetary liability, lead to inquiries and fines or penalties from regulatory or governmental authorities, lead to reputational harm and make our customers less confident in our services, which could harm our business, financial condition and results of operations.
If we are unable to adequately protect our brand and the intellectual property rights related to our existing and any new services, or if we infringe on the rights of others, our business, prospects, financial condition and results of operations could be harmed.
The XOOM brand is important to our business. Our business could be harmed if we were unable to adequately protect our brand and the value of our brand decreased as a result.
24
Table of Contents
We rely on a combination of patent and trademark laws, trade secret protection and confidentiality and license agreements to protect the intellectual property rights related to our services, all of which offer only limited protection. While we have filed three patent applications, we have not been granted any patents for features of our electronic payment processing system. The process of obtaining patent protection is expensive and time consuming, and we may not be able to prosecute all necessary or desirable patent applications at a reasonable cost or in a timely manner. We may choose not to seek patent protection for certain innovations and may choose not to pursue patent protection in certain jurisdictions. Furthermore, it is possible that our patent applications may not issue as granted patents, that the scope of our issued patents will be insufficient or not have the coverage originally sought, that our issued patents will not provide us with any competitive advantages, and that our patents and other intellectual property rights may be challenged by others or invalidated through administrative process or litigation. In addition, issuance of a patent does not guarantee that we have an absolute right to practice the patented invention. As a result, we may not be able to obtain adequate patent protection or to enforce our issued patents effectively. We may be subject to claims by third parties alleging that we infringe their intellectual property rights or have misappropriated other proprietary rights.
We have in the past and may in the future bring a claim against third parties alleging infringement of our intellectual property rights. For example, in February 2011, we filed a lawsuit in federal court in the Northern District of California against Motorola Mobility, Inc. and other affiliated companies, alleging trademark infringement and other related claims, stemming from Motorola’s use of the name “XOOM” in connection with its wireless tablet devices and related accessories, which we settled in July 2013. If future claims are unsuccessful, and one or more infringing products are commercially successful, then this could diminish the value of our brand, adversely affect our ability to market our services, and our business could be harmed. We may be required to spend resources to defend such claims or to protect and police our own rights. Some of our intellectual property rights may not be protected by intellectual property laws, particularly in foreign jurisdictions. The loss of our intellectual property protection, the inability to secure or enforce intellectual property protection or to successfully defend against claims of intellectual property infringement could harm our business.
We also rely on our unpatented proprietary technology and trade secrets. Despite our efforts to protect our proprietary technology and trade secrets, unauthorized parties may attempt to misappropriate, reverse engineer or otherwise obtain and use them. The contractual provisions that we enter into with employees, consultants, disbursement partners, vendors and customers may not prevent unauthorized use or disclosure of our proprietary technology or intellectual property rights and may not provide an adequate remedy in the event of unauthorized use or disclosure of our proprietary technology or intellectual property rights. Moreover, policing unauthorized use of our technologies, services and intellectual property is difficult, expensive and time consuming, particularly in foreign countries where the laws may not be as protective of intellectual property rights as those in the United States, and where mechanisms for enforcement of intellectual property rights may be weak. We may be unable to determine the extent of any unauthorized use or infringement of our services, technologies or intellectual property rights.
From time to time, legal action by us may be necessary to enforce our patents and other intellectual property rights, to protect our trade secrets, to determine the validity and scope of the intellectual property rights of others or to defend against claims of infringement or invalidity. Such litigation could result in substantial costs and diversion of resources and could negatively affect our business, results of operations and financial condition. If we are unable to protect our intellectual property rights, we may find ourselves at a competitive disadvantage to others who need not incur the additional expense, time and effort required to create the innovative services that have enabled us to be successful to date.
Assertions by third parties of infringement or other violations by us of their intellectual property rights could result in significant costs and substantially harm our business and operating results.
Patent and other intellectual property disputes are common in the payments and money transfer industries. Some companies in the money transfer industry, including some of our competitors, own large numbers of
patents, copyrights, trademarks and trade secrets, which they may use to assert claims against us. Third parties
25
Table of Contents
have asserted and may in the future assert claims of infringement, misappropriation or other violations of intellectual property rights against us. As the number of services and competitors in our market increase and overlaps occur, claims of infringement, misappropriation and other violations of intellectual property rights may increase. Any claim of infringement, misappropriation or other violation of intellectual property rights by a third party, even those without merit, could cause us to incur substantial costs defending against the claim and could distract our management.
The patent portfolios of our most significant competitors are larger than ours and this disparity may increase the risk that they may sue us for patent infringement and may limit our ability to counterclaim for patent infringement or settle through patent cross-licenses. In addition, future assertions of patent rights by third parties, and any resulting litigation, may involve patent holding companies or other adverse patent owners who have no relevant product revenue and against whom our own patents may therefore provide little or no deterrence or protection. We cannot assure you that we are not infringing or otherwise violating any third-party intellectual property rights.
An adverse outcome of a dispute may require us to pay substantial damages, including treble damages, if we are found to have willfully infringed a third party’s patents or copyrights; cease making, licensing or using solutions that are alleged to infringe or misappropriate the intellectual property of others; expend additional development resources to attempt to redesign our services or otherwise to develop non-infringing technology, which may not be successful; enter into potentially unfavorable royalty or license agreements in order to obtain the right to use necessary technologies or intellectual property rights; and indemnify our disbursement partners and other third parties. Royalty or licensing agreements, if required or desirable, may be unavailable on terms acceptable to us, or at all, and may require significant royalty payments and other expenditures. In addition, some licenses may be non-exclusive, and therefore our competitors may have access to the same technology licensed to us. Any of these events could harm our business, financial condition and results of operations.
There are a number of risks associated with our international operations that could harm our business.
We provide money transfer services to 30 countries and territories and may expand into additional sending and receiving countries. Our ability to grow in international markets could be harmed by a number of factors, including:
| • | changes in political and economic conditions and potential instability in certain regions; |
| • | restrictions on money transfers to or from certain countries; |
| • | currency control and repatriation issues; |
| • | changes in regulatory requirements or in foreign policy, including the adoption of domestic or foreign laws, regulations and interpretations detrimental to our business; |
| • | possible increased costs and additional regulatory burdens imposed on our business; |
| • | the implementation of U.S. sanctions, resulting in bank closures in certain countries and the freezing of our assets; |
| • | burdens of complying with a wide variety of laws and regulations; |
| • | fraud, theft or lack of compliance by disbursement partners in foreign legal jurisdictions where legal enforcement may be difficult or costly; |
| • | reduced protection of our intellectual property rights; |
| • | unfavorable tax rules or trade barriers; |
| • | inability to secure, train or monitor disbursement partners; and |
| • | failure to successfully manage our exposure to foreign exchange rates, in particular with respect to the Indian rupee. |
26
Table of Contents
In addition, we conduct certain functions, including customer operations, in regions outside of the United States. We are subject to both U.S. and local laws and regulations applicable to our offshore activities, and any factors which reduce the anticipated benefits associated with providing these functions outside of the United States, including cost efficiencies and productivity improvements, could harm our business.
We expect new remittance rules to take effect in the United States in October 2013, which will impose additional disclosure and other responsibilities on us as described elsewhere in these risk factors.
A material slowdown or disruption in international migration patterns could harm our business.
A majority of our customers are from first or second generation immigrant families and our business relies in part on international migration patterns. A significant portion of money transfer transactions are initiated by immigrants who have moved from their home countries to the United States. These immigrants typically send money back to their home countries to their family and friends. Migration is affected by, among other factors, overall economic conditions, the availability of job opportunities, changes in immigration laws and political or other events such as war, terrorism or health emergencies that would make it more difficult for workers to migrate or work abroad. Changes to these factors could harm our digital money transfer volume, our business, financial condition and results of operations.
Changes in U.S. immigration laws or changes in the emigration laws of other jurisdictions that discourage international migration, and political or other events, such as war, terrorism or health emergencies, that make it more difficult for individuals to immigrate to the United States or work in the United States, could adversely affect our gross sending volume or growth rate. Sustained weakness in U.S. or global economic conditions could reduce economic opportunities for immigrant workers and result in reduced or disrupted international migration patterns. Reduced or disrupted international migration patterns are likely to reduce money transfer volumes and harm our results of operations.
Our use of open source and third-party technology could impose limitations on our ability to commercialize our software.
We use open source software in our services and, although we monitor our use of open source software to avoid subjecting our services to conditions we do not intend, the terms of many open source licenses have not been interpreted by U.S. courts. As a result, there is a risk that these licenses could be construed in a way that could impose unanticipated conditions or restrictions on our ability to provide our services. In such an event, we could be required to seek licenses from third parties to continue offering our services, to make our proprietary code generally available in source code form, to re-engineer our services or to discontinue our services if re-engineering could not be accomplished on a timely basis, any of which could harm our business, results of operations and financial condition.
Our business is subject to the risks of earthquakes, fires, floods, other natural catastrophic events and to interruption by man-made problems such as computer viruses or terrorism which could result in system failures and interruptions which could harm our business.
Although our systems have been designed around industry-standard architectures to reduce downtime in the event of outages or catastrophic occurrences, they remain vulnerable to damage or interruption from earthquakes, floods, fires, power loss, California rolling blackouts, telecommunication failures, terrorist attacks, cyber-attacks, computer viruses, computer denial-of-service attacks, human error, hardware or software defects or malfunctions (including defects or malfunctions of components of our systems that are supplied by third-party service providers), and similar events or disruptions. Our U.S. corporate offices and one of the facilities we lease to house our computer and telecommunications equipment are located in the San Francisco Bay Area, a region known for seismic activity. Our outsourced customer call centers are located in the Philippines and El Salvador, which are also known for seismic activity. Despite any precautions we may take, system interruptions and delays
27
Table of Contents
could occur if there is a natural disaster, if a third-party provider closes a facility we use without adequate notice for financial or other reasons, or if there are other unanticipated problems at our leased facilities. As we rely heavily on our servers, computer and communications systems and the Internet to conduct our business and provide high-quality customer service, such disruptions could harm our ability to run our business and cause lengthy delays which could harm our business, results of operations and financial condition. We currently are not able to switch instantly to our back-up center in the event of failure of the main server site. This means that an outage at one facility could result in our system being unavailable for a significant period of time. We do not carry business interruption insurance sufficient to compensate us for losses that may result from interruptions in our service as a result of system failures. A system outage or data loss could harm our business, financial condition and results of operations.
Continued weakness in economic conditions, in both the United States and global markets, could harm our business.
Our business relies in part on the overall strength of global economic conditions as well as international migration patterns. Money transfer transactions and international migration patterns are affected by, among other things, employment opportunities and overall economic conditions. Poor economic conditions may result in reduced job opportunities for our customers, or other countries that may become important to our business, which could harm our results of operations.
If general market conditions in the United States were to deteriorate, our business could be harmed. Additionally, if the volume of our digital money transfers declines or international migration patterns shift due to deteriorating economic conditions, we may be unable to timely and effectively reduce our operating costs or take other actions in response, which could harm our results of operations.
We enable money transfers through disbursement partners in some regions that are politically volatile.
We enable money transfers in some regions that are politically volatile. If a country experiences political instability that affects its economy or financial systems, our business could be harmed. It also is possible that our services could be used by wrongdoers in contravention of U.S. or foreign law or regulations. Such circumstances could result in increased compliance costs, regulatory inquiries, suspension or revocation of required licenses or registrations, seizure or forfeiture of assets and the imposition of civil and criminal fees and penalties. In addition to monetary fines or penalties that we could incur, we could be subject to reputational harm that could harm our business.
The loss of one or more key members of our management team, or our failure to attract, integrate and retain other highly qualified personnel in the future, could harm our business.
We believe our success has depended, and continues to depend, on the efforts and talents of our employees, including John Kunze, our President and Chief Executive Officer, Ryno Blignaut, our Chief Financial Officer, and Julian King, our Senior Vice President of Marketing and Corporate Development. Our future success depends on our continuing ability to attract, develop, motivate and retain highly qualified and skilled employees. Qualified individuals are in high demand, and we may incur significant costs to attract and keep them. In addition, the loss of any of our senior management or key employees could harm our ability to execute our business plan, and we may not be able to find adequate replacements. All of our officers and other U.S. employees are at-will employees, which means they may terminate their employment relationship with us at any time, and their knowledge of our business and industry would be extremely difficult to replace. We cannot ensure that we will be able to retain the services of any members of our senior management or other key employees. If we do not succeed in attracting well-qualified employees or retaining and motivating existing employees, our business could be harmed.
28
Table of Contents
Our management team has limited experience managing a public company, and regulatory compliance may divert its attention from the day-to-day management of our business.
The individuals who now constitute our management team have limited experience managing a publicly-traded company and limited experience complying with the increasingly complex laws pertaining to public companies. Our management team may not successfully or efficiently manage a public company that is subject to significant regulatory oversight and reporting obligations under the federal securities laws. In particular, these new obligations will require substantial attention from our senior management and could divert their attention away from the day-to-day management of our business.
Acquisitions could disrupt our business and harm our financial condition and results of operations.
We may decide to acquire complementary businesses, products and technologies. Our ability as an organization to successfully make and integrate acquisitions is unproven. Acquisitions could require significant capital infusions and could involve many risks, including potential negative impact on our results of operations due to debt or liabilities incurred in connection with an acquisition, difficulties assimilating and integrating the acquired business, disruption of our ongoing business by diverting resources and distracting management, not realizing the expected benefits of the acquisition, and potential dilution of stockholders’ ownership in the event we issue equity securities to complete an acquisition. We cannot assure you that we will be able to identify or consummate any future acquisition on favorable terms, or at all. If we do pursue an acquisition, it is possible that we not realize the anticipated benefits from the acquisition or that the financial markets or investors will view the acquisition negatively. Even if we successfully complete an acquisition, it could harm our business, results of operations and financial condition.
The requirements of being a public company may strain our resources, divert management’s attention and affect our ability to attract and retain executive management and qualified board members.
As a public company, we are subject to the reporting requirements of the Securities Exchange Act of 1934, as amended, or the Exchange Act, the Sarbanes-Oxley Act of 2002, or the Sarbanes-Oxley Act, the Dodd-Frank Wall Street Reform and Consumer Protection Act, or the Dodd-Frank Act, the listing requirements of the NASDAQ Stock Market LLC and other applicable securities rules and regulations. Compliance with these rules and regulations will increase our legal and financial compliance costs, make some activities more difficult, time consuming or costly and increase demand on our systems and resources, particularly after we are no longer an “emerging growth company,” as defined in the Jumpstart Our Business Startups Act of 2012, or the JOBS Act. The Exchange Act requires, among other things, that we file annual, quarterly and current reports with respect to our business and results of operations. The Sarbanes-Oxley Act requires, among other things, that we maintain effective disclosure controls and procedures and internal control over financial reporting. In order to maintain and, if required, improve our disclosure controls and procedures and internal control over financial reporting to meet this standard, significant resources and management oversight may be required. As a result, management’s attention may be diverted from other business concerns, which could harm our business and results of operations. Although we have already hired additional employees to comply with these requirements, we may need to hire more employees in the future or engage outside consultants, which will increase our costs and expenses.
In addition, changing laws, regulations and standards relating to corporate governance and public disclosure are creating uncertainty for public companies, increasing legal and financial compliance costs and making some activities more time consuming. These laws, regulations and standards are subject to varying interpretations, in many cases due to their lack of specificity, and, as a result, their application in practice may evolve over time as new guidance is provided by regulatory and governing bodies. This could result in continuing uncertainty regarding compliance matters and higher costs necessitated by ongoing revisions to disclosure and governance practices. We intend to continue to invest resources to comply with evolving laws, regulations and standards, and this investment may result in increased general and administrative expenses and a diversion of management’s time and attention from revenue-generating activities to compliance activities. If our efforts to comply with new
29
Table of Contents
laws, regulations and standards differ from the activities intended by regulatory or governing bodies due to ambiguities related to their application and practice, regulatory authorities may initiate legal proceedings against us and our business may be adversely affected.
As a public company subject to these rules and regulations, we may find it more expensive for us to obtain director and officer liability insurance, and we may be required to accept reduced coverage or incur substantially higher costs to obtain coverage. These factors could also make it more difficult for us to attract and retain qualified members of our board of directors, particularly to serve on our audit committee and compensation committee, and qualified executive officers.
As a result of disclosure of information in this prospectus and in filings required of a public company, our business and financial condition will become more visible, which may result in threatened or actual litigation, including by competitors and other third parties. If such claims are successful, our business and results of operations could be harmed, and even if the claims do not result in litigation or are resolved in our favor, these claims, and the time and resources necessary to resolve them, could divert the resources of our management and harm our business and results of operations.
As a result of becoming a public company, we are obligated to develop and maintain proper and effective internal control over financial reporting, but we may not complete our analysis of our internal control over financial reporting in a timely manner, or these internal controls may not be determined to be effective, either of which may harm investor confidence in us and the value of our common stock.
We will be required, pursuant to Section 404 of the Sarbanes-Oxley Act, to furnish a report by management on, among other things, the effectiveness of our internal control over financial reporting for the year ended December 31, 2014. This assessment will need to include disclosure of any material weaknesses identified by our management in our internal control over financial reporting, as well as a statement that our independent registered public accounting firm has issued an opinion on our internal control over financial reporting.
We are in the early stages of the costly and challenging process of compiling the system and processing documentation necessary to perform the evaluation needed to comply with Section 404. We may not be able to complete our evaluation, testing and any required remediation in a timely fashion. During the evaluation and testing process, if we identify one or more material weaknesses in our internal control over financial reporting, we will be unable to assert that our internal controls are effective.
If we are unable to assert that our internal control over financial reporting is effective, or if our independent registered public accounting firm is unable to express an opinion on the effectiveness of our internal controls, we could lose investor confidence in the accuracy and completeness of our financial reports, which could cause the price of our common stock to decline, and we may be subject to investigation or sanctions by the Securities and Exchange Commission, or the SEC.
We will be required to disclose changes made in our internal control and procedures on a quarterly basis. However, our independent registered public accounting firm will not be required to formally attest to the effectiveness of our internal control over financial reporting pursuant to Section 404 until the later of the year following our first annual report required to be filed with the SEC, or the date we are no longer an “emerging growth company.” We will remain an “emerging growth company” for up to five years, although if the market value of our common stock that is held by non-affiliates exceeds $700 million as of any June 30 before that time, we would cease to be an “emerging growth company” as of the following December 31. To comply with the requirements of being a public company, we may need to undertake various actions, such as implementing new internal controls and procedures and hiring accounting or internal audit staff.
30
Table of Contents
We are an “emerging growth company” and we cannot be certain if the reduced disclosure requirements applicable to emerging growth companies will make our common stock less attractive to investors.
We are an “emerging growth company” and we may take advantage of certain exemptions from various reporting requirements that are applicable to other public companies that are not “emerging growth companies,” including not being required to comply with the auditor attestation requirements of Section 404 of the Sarbanes-Oxley Act, reduced disclosure obligations regarding executive compensation in our periodic reports and proxy statements, and exemptions from the requirements of holding a nonbinding advisory vote on executive compensation and stockholder approval of any golden parachute payments not previously approved. If we choose not to comply with the auditor attestation requirements of Section 404 of the Sarbanes-Oxley Act, our auditors will not be required to attest to the effectiveness of our internal control over financial reporting. As a result, investors may become less comfortable with the effectiveness of our internal controls and the risk that material weaknesses or other deficiencies in our internal controls go undetected may increase. If we choose to provide reduced disclosures in our periodic reports and proxy statements while we are an emerging growth company, investors would have access to less information and analysis about our executive compensation, which may make it difficult for investors to evaluate our executive compensation practices. We cannot predict if investors will find our common stock less attractive because we may rely on these exemptions and provide reduced disclosure. If some investors find our common stock less attractive as a result, there may be a less active trading market for our common stock and our stock price may be more volatile.
Our revenue may be harmed if we are required to pay transaction taxes on all or a portion of our past and future transfers in jurisdictions where we are currently not collecting and reporting tax.
We currently only pay transaction taxes in certain jurisdictions in which we do business. We do not separately collect other transaction taxes. A successful assertion by any state, local jurisdiction or country in which we do not pay such taxes that we should be paying sales or other transaction taxes on our services, or the imposition of new laws requiring the payment of sales or other transaction taxes on our services, could result in substantial tax liabilities related to past transactions, create increased administrative burdens or costs, discourage consumers from using our services, decrease our ability to compete or otherwise harm our business and results of operations.
New tax treatment of companies engaged in online money transfer may harm the commercial use of our services and our financial results.
Due to the global nature of the Internet, it is possible that various states or foreign countries might attempt to regulate our money transfers or levy sales, income or other taxes relating to our activities. Tax authorities at the international, federal, state and local levels are currently reviewing the appropriate treatment of companies engaged in Internet commerce in general. New or revised international, federal, state or local tax regulations may subject us or our customers to additional sales, income and other taxes. We cannot predict the effect of current attempts to impose sales, income or other taxes on commerce over the Internet. New or revised taxes would likely increase the cost of doing business online and decrease the attractiveness of using our Internet services. New taxes could also create significant increases in internal costs necessary to capture data, and collect and remit taxes. Any of these events could harm our business and results of operations.
Our ability to use net operating loss carryforwards to reduce future tax payments may be limited by provisions of the Internal Revenue Code.
As of December 31, 2012, we had net operating loss carryforwards for federal and state income tax purposes of approximately $56.6 million and $54.2 million, respectively. The annual use of our net operating losses may be limited following certain ownership changes under provisions of the Internal Revenue Code of 1986, as amended, and applicable state tax law. We have not completed a study to assess whether an ownership change occurred as a result of our initial public offering, will occur as a result of this offering, or whether there have been one or more ownership changes since our inception, due to the costs and complexities associated with such
31
Table of Contents
study. Accordingly, our ability to use our net operating loss carryforwards to reduce future tax payments may be currently limited or may be limited as a result of our initial public offering, this offering or any future issuance of shares of our stock.
Changes or modifications in financial accounting standards may harm our results of operations.
From time to time, the Financial Accounting Standards Board, or FASB, either alone or jointly with the International Accounting Standards Board, or IASB, promulgates new accounting principles that could have a material adverse impact on our results of operations. For example, the FASB is currently working together with the IASB to converge certain accounting principles and facilitate more comparable financial reporting between companies who are required to follow generally accepted accounting principles, or GAAP, and those who are required to follow International Financial Reporting Standards, or IFRS. These efforts may result in different accounting principles under GAAP, which may have a material impact on the way in which we report financial results in areas including, among others, revenue recognition and financial statement presentation. We expect the SEC to make a determination in the future regarding the incorporation of IFRS into the financial reporting system for U.S. companies. A change in accounting principles from GAAP to IFRS would be costly to implement and may have a material impact on our financial statements and may retroactively harm previously reported transactions.
Regulatory Risks Faced by Our Business
Our business is subject to a wide range of laws and regulations intended to help detect and prevent illegal or illicit activity and our failure, or the failure of one of our disbursement partners or payment processors to comply with those laws and regulations could harm our business, financial condition and results of operations.
Our services are subject to an increasingly strict set of legal and regulatory requirements intended to help detect and prevent money laundering, terrorist financing, fraud and other illicit activity. The interpretation of those requirements by judges, regulatory bodies and enforcement agencies is changing, often quickly and with little notice. Economic and trade sanctions programs that are administered by the U.S. Treasury Department’s Office of Foreign Assets Control, or OFAC, prohibit or restrict transactions to or from or dealings with specified countries, their governments, and in certain circumstances, with individuals and entities that are specially-designated nationals of those countries, narcotics traffickers and terrorists or terrorist organizations. As federal, state and foreign legislative regulatory scrutiny and enforcement action in these areas increase, we expect our costs to comply with these requirements will increase, perhaps substantially. Failure to comply with any of these requirements by us or our disbursement partners could result in the suspension or revocation of a money transmitter license, the limitation, suspension or termination of our services, the seizure and/or forfeiture of our assets and/or the imposition of civil and criminal penalties, including fines.
We are subject to reporting, recordkeeping and anti-money laundering provisions of the Bank Secrecy Act, as amended by the USA PATRIOT Act of 2001, or the Bank Secrecy Act, and to regulatory oversight. We are also subject to enforcement by the U.S. Department of the Treasury Financial Crimes Enforcement Network, or FinCEN, the Consumer Financial Protection Bureau, or the CFPB, and U.S. state regulators, and to economic sanctions imposed by the United States which are overseen by OFAC.
Our subsidiary is also subject to regulations in India in addition to U.S. federal and state regulations. Additionally, Indian regulations may require our subsidiary or us to file reports relating to suspicious transactions. If we are unable to file these reports in the required timeframes or in the appropriate manner, we may face penalties. We may also become subject to additional reporting, recordkeeping and anti-money laundering regulations as well as additional risks and obligations if we expand our business into new geographic regions.
We are also subject to regulations imposed by the Foreign Corrupt Practices Act, or the FCPA, in the United States and similar laws in other countries which generally prohibit companies and those acting on their behalf from making improper payments to foreign government officials for the purpose of obtaining or retaining
32
Table of Contents
business. Because our services are offered in 30 countries, we face a higher risk associated with FCPA compliance and similar statutes than many other companies. Any determination that we have violated these laws could harm our business, financial condition and results of operations.
The foregoing laws and regulations are constantly evolving, unclear and inconsistent across various jurisdictions, making compliance challenging. If we fail to update our compliance system to reflect legislative or regulatory developments, we could incur penalties. New legislation, changes in laws or regulations, implementing rules and regulations, litigation, court rulings, changes in industry practices or standards, changes in systems rules or requirements or other similar events could expose us to increased compliance costs, liability, reputational damage, and could reduce the market value of our services or render them less profitable or obsolete.
Our business is subject to a variety of U.S. and foreign laws, many of which are unsettled and still developing, and many of which may contradict one another due to conflicting regulatory goals. Failure to comply with these laws could subject us to claims or otherwise harm our business.
The Xoom service is subject to a variety of laws in the United States and abroad that are continuously evolving and developing, including laws regarding data retention, privacy, anti-spam, consumer protection, payment processing and money transfers. The scope and interpretation of the various laws that are or may be applicable to us are often uncertain and may be conflicting, particularly regarding laws outside the United States. For example, we are subject to regulatory requirements to assist in the prevention of money laundering and terrorist financing, such as the Bank Secrecy Act and, pursuant to these legal obligations and authorizations, we make information available to certain U.S. federal, state and local, as well as foreign, government agencies when required by law. As a result of particular concern with respect to terrorist financing, these agencies have increased their requests for such information from money service businesses in recent years. At the same time, there has been increased public attention regarding the use and disclosure of personal information, and regulatory authorities around the world are considering a number of legislative and regulatory proposals concerning data protection and consumer privacy and other matters that may be applicable to our business. The regulatory goals of preventing illegal activity, such as money laundering and terrorist financing, may conflict with the goal of protecting individual privacy. If federal, state or foreign governments or our disbursement partners changed requirements regarding the customer or recipient information we are required to collect, we may be unable to comply with such changes, or such changes could interfere with our ability to assess fraud or other risks, and our business could be harmed as a result. New laws and regulations may be enacted in connection with mobile transactions, including money transfers that are performed via smartphones.
Failure to comply with existing and future laws could result in fines, sanctions, penalties or other adverse consequences and loss of consumer confidence, which could harm our results of operations, business and reputation. While we believe that we are compliant with our regulatory responsibilities, the legal, political and business environments in these areas are rapidly changing, and subsequent legislation, regulation, litigation, court rulings or other events could expose us to increased liability, increased operating costs to implement new measures to reduce our exposure to this liability and reputational damage.
Our business could be harmed if a government were to levy taxes on money transfers, as has occurred in the past. The current budget shortfalls in many jurisdictions could lead other states and jurisdictions to impose similar fees and taxes, as well as increase unclaimed property obligations. A tax or fee exclusively on money transfer companies could put us at a competitive disadvantage to other means of remittance or payment transfers which may not be subject to the same fees or taxes. A change in the unclaimed property obligations could increase our regulatory burdens and costs related to our obligation to escheat unclaimed property to the states.
It is possible that governments of one or more countries may seek to censor content available on our website and mobile applications or may even attempt to completely block access to our website. Adverse legal or regulatory developments could harm our business. In particular, in the event that we are restricted, in whole or in part, from operating in one or more countries, our ability to retain or increase our customer base may be harmed and we may not be able to maintain or grow our revenue as anticipated.
33
Table of Contents
Consumer advocacy groups or governmental agencies could also seek to change laws and regulations to seek greater protections for our money transfer customers, which could result in enhanced consumer disclosure, impact fees or exchange spreads, or require other different customer treatment. If consumer advocacy groups are able to generate widespread support for positions that are detrimental to our business, then our business, financial position and results of operations could be harmed.
We are subject to licensing and other requirements imposed by U.S. state regulators, the U.S. federal government and the government of India. If we were found to be subject to or in violation of any laws or regulations governing money transmitters, we could lose our licenses, be subject to liability or be forced to change our business practices.
A number of states have enacted legislation regulating money transmitters. To date, we have obtained licenses to operate as a money transmitter in 44 U.S. states, the District of Columbia and Puerto Rico and have applied, or plan to apply, for money transmitter licenses in additional states. Our subsidiary holds a money transmitter license in India and a license in one U.S. state. Our subsidiary is a regulated entity in India, and we must renew our license to operate every two years, with our next renewal scheduled for January 2015. If regulators were to revoke or decline to renew our subsidiary’s license to operate in India, and we were unable to process transactions pursuant to the rupee drawing arrangement, then we may be required to stop doing business in India, which would harm our business and results of operations. We and our subsidiary are also registered as money services businesses with FinCEN. As a licensed money transmitter, we are subject to bonding requirements, liquidity requirements, restrictions on our investment of customer funds, reporting requirements and inspection by state and foreign regulatory agencies. If our pending applications were denied or if additional states or jurisdictions require us to apply for a license, we could be forced to change our business practice or required to bear substantial cost to comply with the requirements of the additional states or jurisdictions. If we were found to be subject to and in violation of any banking or money services laws or regulations, we could be subject to liability or additional restrictions, such as increased liquidity requirements. In addition, our licenses could be revoked or we could be forced to cease doing business or change our practices in certain states or jurisdictions, or be required to obtain additional licenses or regulatory approvals that could impose a substantial cost on us. Regulators could also impose other regulatory orders and sanctions on us. Any change to our business practices that makes our service less attractive to customers or prohibits use of our services by residents of a particular jurisdiction could decrease our transaction volume and harm our business.
The Dodd-Frank Act, as well as the regulations required by the Dodd-Frank Act, and the creation of the Consumer Financial Protection Bureau could harm us and the scope of our activities, and could harm our operations, results of operations and financial condition.
The Dodd-Frank Act, which became law in the United States on July 21, 2010, calls for significant structural reforms and new substantive regulation across the financial services industry. In addition, the Dodd-Frank Act created the CFPB, whose purpose is to issue and enforce consumer protection initiatives governing financial products and services, including money transfer services. The CFPB will create additional regulatory oversight for us. The Dodd-Frank Act and actions by the CFPB could have a significant impact on us by, for example, requiring us to limit or change our business practices, limiting our ability to pursue business opportunities, requiring us to invest valuable management time and resources in compliance efforts, imposing additional costs on us, limiting fees we can charge for services, requiring us to meet more stringent capital requirements, impacting the value of our assets, delaying our ability to respond to marketplace changes, requiring us to alter our services in a manner that would make them less attractive to consumers and impair our ability to offer them profitably, or requiring us to make other changes that could harm our business.
The CFPB has recently issued regulations implementing the remittance provisions of the Dodd-Frank Act. These regulations, which we expect to become effective in October 2013, will impact our business in a variety of areas as described elsewhere in these risk factors. These requirements and other potential changes under CFPB regulations could harm our operations and financial results and change the way we operate our business.
34
Table of Contents
We may also be subject to examination by the CFPB, which has broad authority to enforce consumer financial laws. In July 2011, many consumer financial protection functions formerly assigned to the federal banking agency and other agencies were transferred to the CFPB. The CFPB has a large budget and staff and has broad authority with respect to our money transfer service and related business. It is authorized to collect fines and provide consumer restitution in the event of violations, engage in consumer financial education, track consumer complaints, request data and promote the availability of financial services to underserved consumers and communities. In addition, the CFPB may adopt other regulations governing consumer financial services, including regulations defining unfair, deceptive or abusive acts or practices, and new model disclosures. The CFPB’s authority to change regulations adopted in the past by other regulators, or to rescind or alter past regulatory guidance, could increase our compliance costs and litigation exposure.
The Dodd-Frank Act establishes a Financial Stability Oversight Counsel that is authorized to designate as “systemically important” non-bank financial companies and payment systems. Companies designated under either standard will become subject to new regulation and regulatory supervision. If we were designated under either standard, the additional regulatory and supervisory requirements could result in costly new compliance burdens or may require changes in the way we conduct business that could harm our business.
The effect of the Dodd-Frank Act and the CFPB on our business and operations will be significant, in part because the function and scope of the CFPB, the reactions of our competitors and the responses of consumers and other marketplace participants are uncertain.
New remittance rules adopted by the CFPB, which we expect to become effective in October 2013, could harm us and the scope of our activities, and could harm our operations, results of operations and financial condition.
The CFPB has issued new remittance regulations that we expect to go into effect in October 2013. Among other things, these regulations require money transmitters to disclose to customers, at the time of their transaction, certain transaction details, such as any fees charged, the foreign exchange rate and the amount of money to be disbursed to the recipient. Money transmitters must also provide the customer with a receipt, and inform the customer as to the date on which the money will be available to the recipient. In addition, the regulations require money transmitters to provide refunds to customers in certain circumstances within certain timeframes, and to create a customer complaint process, according to which money transmitters must investigate certain notices of error according to certain timeframes. While we already comply with many of the new remittance regulations, we do not currently comply with all of them. For example, we do not currently provide a date when the funds will be available to the recipient. If we are unable to provide an accurate date available to our customers, then we may be required to refund fees to our customers, which could harm our business. Additionally, our scheduled transfer product allows customers to set up a transaction for a date in the future, but we are not able to provide the foreign exchange rate for a future scheduled transfer. The CFPB rules require money transmitters to provide an exchange rate for transactions scheduled fewer than five business days from authorization. As a result, we may decide to deprecate our scheduled transfer product, or alter it to prohibit transactions that are scheduled within five business days of their authorization.
If we are unable to comply with all of the new remittance regulations by the date such regulations are effective, our business could be harmed. These regulations and other potential changes under CFPB regulations could harm our operations, results of operations and financial condition and change the way we operate our business.
Our disbursement partners generally are regulated institutions in their home jurisdiction, and money transfers are regulated by governments in both the United States and in the jurisdiction of the recipient. If our disbursement partners fail to comply with applicable laws, it could harm our business.
Money transfers are regulated by state, federal and foreign governments. Many of our disbursement partners are banks and are heavily regulated by their home jurisdictions. Our non-bank disbursement partners are also subject to money transfer regulations. We require regulatory compliance as a condition to our continued
35
Table of Contents
relationship, perform due diligence on our disbursement partners and monitor them periodically with the goal of meeting regulatory expectations. However, there are limits to the extent to which we can monitor their regulatory compliance. Any determination that our disbursement partners or their sub-disbursement partners have violated laws and regulations could seriously damage our reputation, resulting in diminished revenue and profit and increased operating costs. While our services are not directly regulated by governments outside the United States, except with respect to our subsidiary which is regulated by the Indian government, it is possible that in some cases we could be liable for the failure of our disbursement partners or their sub-disbursement partners to comply with laws, which also could harm our business, financial condition and results of operations.
We process, store and use personal information and other data, which subjects us to governmental regulation and other legal obligations related to privacy. Our actual or perceived failure to comply with such obligations could harm our business.
We receive, store and process personal information and other customer data, including bank account numbers, credit and debit card information, identification numbers and images of government identification cards. As a result, we are required to comply with the privacy provisions of the Gramm-Leach-Bliley Act of 1999, or the Gramm-Leach-Bliley Act, and the Payment Card Industry Data Security Standard. There are also numerous other federal, state and local laws around the world regarding privacy and the storing, sharing, use, processing, disclosure and protection of personal information and other customer data, the scope of which are changing, subject to differing interpretations, and may be inconsistent among different jurisdictions or conflict with other applicable rules. It is possible that these obligations may be interpreted and applied in a manner that is inconsistent from one jurisdiction to another and may conflict with other rules or our business practices.
Additionally, with advances in computer capabilities and data protection requirements to address ongoing threats, we may be required to expend significant capital and other resources to protect against potential security breaches or to alleviate problems caused by security breaches.
Any failure or perceived failure by us to comply with our privacy policies, our privacy-related obligations to customers or other third parties, or our privacy-related legal obligations, or any compromise of security that results in the unauthorized release or transfer of personally identifiable information or other customer data, may result in governmental enforcement actions, fines or litigation. If there is a breach of credit or debit card information that we store, we could also be liable to the issuing banks for their cost of issuing new cards and related expenses. In addition, a significant breach could result in our being prohibited from processing transactions for any of the relevant network organizations, such as Visa or MasterCard, which would harm our business. If any third parties with whom we work, such as marketing partners, vendors or developers, violate applicable laws or our policies, such violations may put our customers’ information at risk and could harm our business. Any negative publicity arising out of a data breach or failure to comply with applicable privacy requirements could damage our reputation and cause our customers to lose trust in us, which could harm our business, results of operations, financial position and potential for growth.
Public scrutiny of Internet privacy issues may result in increased regulation and different industry standards, which could deter or prevent us from providing our current services to our customers, thereby harming our business.
The regulatory framework for privacy issues worldwide is currently in flux and is likely to remain so for the foreseeable future. Practices regarding the collection, use, storage, transmission and security of personal information by companies operating over the Internet have recently come under increased public scrutiny. The U.S. government, including the Federal Trade Commission, or FTC, and the Department of Commerce, has announced that it is reviewing the need for greater regulation for the collection of information concerning consumer behavior on the Internet, including regulation aimed at restricting certain targeted advertising practices. Various government and consumer agencies have also called for new regulation and changes in industry practices. These data protection laws may be interpreted and applied inconsistently.
36
Table of Contents
While we do not sell or share personally identifiable information with third parties for direct marketing purposes, we do have relationships with third parties that may allow them access to customer information for other purposes. For example, when we outsource functions such as customer support, tracking and reporting, and payment processing to other companies, we make customer information available to those companies to the extent necessary for them to provide their services. We believe our policies and practices comply with the FTC privacy guidelines and other applicable laws and regulations. However, if our belief proves incorrect, if there are changes to the guidelines, laws or regulations or their interpretation, or if new regulations are enacted that are inconsistent with our current business practices, our business could be harmed. We may be required to change our business practices, services or privacy policy, reconsider any plans to expand internationally, or obtain additional consents from our customers before collecting or using their information, among other changes. Changes like these could increase our operating costs and make it more difficult for customers to use our services, resulting in less revenue. Additionally, data collection, privacy and security have become the subject of increasing public concern. If Internet users were to reduce their use of our services as a result, our business could be harmed.
Risks Related to this Offering and Ownership of our Common Stock
Our stock price may be volatile and you may be unable to sell your shares at or above the offering price.
The market price of our common stock could be subject to wide fluctuations in response to, among other things, the risk factors described in this section of this prospectus, and other factors beyond our control, such as fluctuations in the valuation of companies perceived by investors to be comparable to us.
The stock markets have experienced price and volume fluctuations that have affected and continue to affect the market prices of equity securities of many companies. These fluctuations often have been unrelated or disproportionate to the operating performance of those companies. These broad market and industry fluctuations, as well as general economic, political and market conditions, such as recessions, interest rate changes or international currency fluctuations, may harm the market price of our common stock.
In the past, many companies that have experienced volatility in the market price of their stock have been subject to securities class action litigation. We may become the target of this type of litigation in the future. Securities litigation against us could result in substantial costs and divert our management’s attention from other business concerns, which could harm our business.
If research analysts do not continue to publish research about our business or if they issue unfavorable commentary or downgrade our common stock, our stock price and trading volume could decline.
The trading market for our common stock depends in part on the research and reports that research analysts publish about us and our business. If we do not maintain adequate research coverage or if one or more analysts who covers us downgrades our stock or publishes inaccurate or unfavorable research about our business, the price of our common stock could decline. If one or more of the research analysts ceases to cover us or fails to publish reports on us regularly, demand for our common stock could decrease, which could cause our stock price or trading volume to decline.
Our principal stockholders, executive officers and directors own a significant percentage of our stock, have significant control of our management and affairs, and can take actions that may be against your best interests.
Following the completion of this offering, and excluding any purchases of our common stock in this offering and after giving effect to the sale of shares by the selling stockholders, our executive officers and directors, and entities that are affiliated with them, will beneficially own an aggregate of % of our outstanding common stock. This significant concentration of stock ownership may adversely affect the trading price for our common stock because investors often perceive disadvantages in owning stock in companies with controlling
37
Table of Contents
stockholders. Also, as a result, these stockholders, acting together, may be able to control our management and affairs and other matters requiring stockholder approval, including the election of directors and approval of significant corporate transactions, such as mergers, consolidations or the sale of substantially all of our assets. Consequently, this concentration of ownership may have the effect of delaying or preventing a change in control, including a merger, consolidation or other business combination involving us, or discouraging a potential acquirer from making a tender offer or otherwise attempting to obtain control, even if such a change in control would benefit our other stockholders.
Our stock price could decline due to the large number of outstanding shares of our common stock eligible for future sale.
Sales of substantial amounts of our common stock in the public market, or the perception that these sales could occur, could cause the market price of our common stock to decline. These sales could also make it more difficult for us to sell equity or equity-related securities in the future at a time and price that we deem appropriate.
Assuming completion of this offering, as of June 30, 2013, we would have had an aggregate of shares of common stock outstanding, assuming no exercise of the underwriters’ over-allotment option and no exercise of outstanding options. The shares sold pursuant to this offering and the 7,273,750 shares sold in our initial public offering will be immediately tradable without restriction. Of the remaining shares:
| • | shares are available for sale, subject in some cases to volume and other restrictions of Rule 144 and Rule 701 under the Securities Act of 1933, as amended, or the Securities Act; and |
| • | shares will be eligible for sale upon the expiration of lock-up agreements, subject in some cases to volume and other restrictions of Rule 144 and Rule 701 under the Securities Act. |
The lock-up agreements expire 60 days after the date of this prospectus. Barclays Capital Inc., as representative of the underwriters, may, in its discretion and at any time, release all or any portion of the securities subject to lock-up agreements. We registered 9,595,910 shares of our common stock that have been issued or reserved for future issuance under our equity incentive plans. Subject to the lock-up agreements or unless they are held by “affiliates,” as that term is defined in Rule 144 of the Securities Act, these shares can be freely sold in the public market upon issuance.
We may also issue shares of our common stock or securities convertible into our common stock from time to time in connection with a financing, acquisition or otherwise. Any such issuance could result in substantial dilution to our existing stockholders and cause the trading price of our common stock to decline.
Because our offering price is substantially higher than the pro forma as adjusted net tangible book value per share of our outstanding common stock, new investors will incur immediate and substantial dilution.
The offering price is substantially higher than the pro forma as adjusted net tangible book value per share of our common stock based on the expected total value of our total assets, less our goodwill and other intangible assets, less our total liabilities immediately following this offering. Our pro forma net tangible book value per share as of June 30, 2013 was $4.62 and our pro forma net tangible book value per share after this offering will be $ , assuming an offering price of $ per share, the last reported sale price of our common stock on the NASDAQ Global Select Market on , 2013, and after deducting the underwriting discounts and commissions and estimated offering expenses. Therefore, if you purchase shares of our common stock in this offering, you will experience immediate and substantial dilution of $ per share in the price you pay for our common stock as compared to the pro forma as adjusted net tangible book value as of June 30, 2013. To the extent outstanding options to purchase common stock are exercised, there will be further dilution.
38
Table of Contents
Our management has broad discretion in the use of the net proceeds from this offering and our use of the net proceeds may not produce a positive rate of return.
Our management will have broad discretion in the application of the net proceeds of this offering. We cannot specify with certainty the uses to which we will apply the net proceeds we will receive from this offering and cannot assure you that our management will apply the net proceeds from this offering in ways that improve our results of operations or increase the value of your investment. The failure by our management to apply these funds in a manner that produces a positive rate of return could harm our ability to continue to maintain and expand our business, which could cause our stock price to decline.
We currently do not intend to pay dividends on our common stock and, consequently, an investor’s only opportunity to achieve a return on the investment is if the price of our common stock appreciates.
We currently do not plan to declare dividends on shares of our common stock in the foreseeable future. See “Dividend Policy” for more information. Consequently, an investor’s only opportunity to achieve a return on the investment in us will be if the market price of our common stock appreciates and the investor sells shares at a profit. There is no guarantee that the price of our common stock that will prevail in the market after this offering will ever exceed the price that an investor pays.
Certain provisions of our certificate of incorporation and bylaws and of Delaware law could prevent a takeover that stockholders consider favorable and could also reduce the market price of our stock.
Our amended and restated certificate of incorporation and our amended and restated bylaws contain provisions that could delay or prevent a merger, acquisition or other change in control that stockholders may consider favorable, including transactions in which stockholders might otherwise receive a premium for their shares. These provisions may also prevent or delay attempts by stockholders to replace or remove our current management or members of our board of directors. These provisions include:
| • | providing for a classified board of directors with staggered three-year terms, which could delay the ability of stockholders to change the membership of a majority of our board of directors; |
| • | not providing for cumulative voting in the election of directors, which limits the ability of minority stockholders to elect director candidates; |
| • | authorizing our board of directors to issue, without stockholder approval, preferred stock rights senior to those of common stock, which could be used to significantly dilute the ownership of a hostile acquirer; |
| • | prohibiting stockholder action by written consent, which forces stockholder action to be taken at an annual or special meeting of our stockholders; |
| • | limiting the persons who may call special meetings of stockholders, which could delay the ability of our stockholders to force consideration of a proposal or to take action, including the removal of directors; and |
| • | requiring advance notification of stockholder nominations and proposals, which may discourage or deter a potential acquirer from conducting a solicitation of proxies to elect the acquirer’s own slate of directors or otherwise attempting to obtain control of us. |
The affirmative vote of the holders of at least 66 2/3% of our shares of capital stock entitled to vote is generally necessary to amend or repeal the above provisions that are contained in our amended and restated certificate of incorporation. Also, absent approval of our board of directors, our amended and restated by-laws may only be amended or repealed by the affirmative vote of the holders of at least 66 2/3% of our shares of capital stock entitled to vote.
39
Table of Contents
In addition, we are subject to the provisions of Section 203 of the Delaware General Corporation Law. These provisions may prohibit large stockholders, in particular those owning 15% or more of our outstanding common stock, from engaging in certain business combinations without approval of substantially all of our stockholders for a certain period of time.
These and other provisions in our amended and restated certificate of incorporation, our amended and restated bylaws and under Delaware law could discourage potential takeover attempts, reduce the price that investors might be willing to pay for shares of our common stock in the future and result in the market price being lower than it would be without these provisions. See “Description of Capital Stock—Preferred Stock” and “Description of Capital Stock—Anti-takeover Effects of Our Certificate of Incorporation and Bylaws and Delaware Law.”
40
Table of Contents
SPECIAL NOTE REGARDING FORWARD-LOOKING STATEMENTS
This prospectus contains forward-looking statements within the meaning of the federal securities laws, which statements involve substantial risks and uncertainties. Forward-looking statements generally relate to future events or our future financial or operating performance. You can generally identify forward-looking statements because they contain words such as “may,” “will,” “should,” “expects,” “plans,” “anticipates,” “could,” “intends,” “target,” “projects,” “contemplates,” “believes,” “estimates,” “predicts,” “potential” or “continue” or the negative of these terms or other similar expressions that concern our expectations, strategy, plans or intentions. We have based these forward-looking statements largely on our current expectations and projections about future events and trends that we believe may affect our business, financial condition or results of operations. The outcome of the events described in these forward-looking statements is subject to risks, uncertainties and other factors described in “Risk Factors” and elsewhere in this prospectus. Accordingly, you should not rely upon forward-looking statements as predictions of future events. We cannot assure you that the results, events and circumstances reflected in the forward-looking statements will be achieved or occur, and actual results, events or circumstances could differ materially from those projected in the forward-looking statements. Forward-looking statements contained in this prospectus include statements about:
| • | our expectations related to the use of proceeds from this offering; |
| • | expected growth in the markets for money transfer services; |
| • | our ability to compete with other companies that are developing or selling services that are competitive with our services; |
| • | our expectations regarding mobile usage of our services; |
| • | our ability to grow our active customer base; |
| • | our plans to continue to invest in and develop technology and services for our markets; |
| • | our expectations regarding future expenditures, including targeted marketing campaigns; |
| • | our ability to establish new marketing partnerships; |
| • | our ability to expand into new markets; |
| • | our ability to acquire and integrate new businesses and technologies; |
| • | the timing of expected introductions of new or enhanced services; |
| • | our ability to attract and retain key personnel; and |
| • | other factors discussed elsewhere in this prospectus. |
We caution you that the foregoing list may not contain all of the forward-looking statements made in this prospectus. In addition, in light of these risks and uncertainties, the matters referred to in the forward-looking statements contained in this prospectus may not occur.
The forward-looking statements made in this prospectus relate only to events as of the date on which the statements are made. We undertake no obligation to update any forward-looking statement to reflect events or circumstances after the date on which the statement is made or to reflect the occurrence of unanticipated events. We may not actually achieve the plans, intentions or expectations disclosed in our forward-looking statements and you should not place undue reliance on our forward-looking statements. Our forward-looking statements do not reflect the potential impact of any future acquisitions, mergers, dispositions, joint ventures or investments we may make. We do not assume any obligation to update any forward-looking statements, whether as a result of new information, future events or otherwise, except as required by law.
This prospectus also contains statistical data, estimates and forecasts that are based on independent industry publications or other publicly available information, while other information is based on our internal sources. Although we believe that these third-party sources referred to in this prospectus are reliable, neither we nor the underwriters have independently verified the information provided by these third parties. While we are not aware of any misstatements regarding any third-party information presented in this prospectus, their estimates, in particular, as they relate to projections, involve numerous assumptions, are subject to risks and uncertainties, and are subject to change based on various factors, including those discussed under “Risk Factors.”
41
Table of Contents
We estimate that the net proceeds from the sale of shares of our common stock that we are selling in this offering will be approximately $ , based on an estimated offering price of $ per share, the last reported sale price of our common stock on the NASDAQ Global Select Market on , 2013, and after deducting estimated underwriting discounts and commissions and estimated offering expenses payable by us. If the underwriters’ option to purchase additional shares from us is exercised in full, we estimate that we will receive additional net proceeds of $ .
We will not receive any proceeds from the sale of shares of our common stock by the selling stockholders.
The principal purposes of this offering are to raise additional capital, to increase our public float and to facilitate an orderly distribution of shares for the selling stockholders, we plan to invest the net proceeds in short-term, investment-grade, interest-bearing securities such as money market accounts, certificates of deposit, commercial paper or guaranteed obligations of the U.S. government. We currently intend to use the net proceeds received by us from this offering primarily for working capital and also for general corporate purposes. We may also use a portion of the net proceeds received by us from this offering for acquisitions of complementary businesses, technologies or other assets. We have not entered into any agreements or commitments with respect to any specific acquisitions and have no understandings or agreements with respect to any such acquisition or investment at this time. We cannot specify with certainty the particular uses for the net proceeds to be received by us from this offering. Accordingly, our management team will have broad discretion in using the net proceeds to be received by us from this offering.
Our common stock has been listed on the NASDAQ Global Select Market under the symbol “XOOM” since February 15, 2013. Prior to that date, there was no public trading market for our common stock. The following table sets forth for the periods indicated the high and low sales prices per share of our common stock as reported on the NASDAQ Global Select Market:
| High | Low | |||||||
| Fiscal 2013 |
||||||||
| First Quarter (from February 15, 2013) |
$ | 26.00 | $ | 20.00 | ||||
| Second Quarter |
$ | 23.74 | $ | 17.68 | ||||
| Third Quarter (through August 9, 2013) |
$ | 36.46 | $ | 22.21 | ||||
On August 9, 2013, the last reported sale price of our common stock on the NASDAQ Global Select Market was $30.26 per share. As of June 30, 2013, we had 139 holders of record of our common stock. The actual number of stockholders is greater than this number of record holders, and includes stockholders who are beneficial owners, but whose shares are held in street name by brokers and other nominees. This number of holders of record also does not include stockholders whose shares may be held in trust by other entities.
We have never declared or paid cash dividends on our common stock. We currently intend to retain any future earnings and do not expect to pay any dividends in the foreseeable future. Any determination to pay dividends in the future will be at the discretion of our board of directors and will be dependent on a number of factors, including our earnings, capital requirements and overall financial condition. Currently, our line of credit prohibits the payment of any dividends without obtaining our lenders’ prior written consent, other than dividends payable solely in our common stock.
42
Table of Contents
The following table sets forth our cash and cash equivalents, disbursement prefunding and short-term investments and capitalization as of June 30, 2013, on:
| • | an actual basis; and |
| • | on an as adjusted basis, to reflect our receipt of the net proceeds from the sale of shares of common stock offered by us in this offering, at an assumed public offering price of $ per share, the last reported sale price of our common stock on the NASDAQ Global Select Market on , 2013, after deducting underwriting discounts and commissions and estimated offering expenses payable by us. |
You should read this table in conjunction with “Selected Consolidated Financial Data” and “Management’s Discussion and Analysis of Financial Condition and Results of Operations” and our consolidated financial statements and related notes included elsewhere in this prospectus.
| As of June 30, 2013 | ||||||||
| Actual | As Adjusted | |||||||
| (in thousands except share data) (unaudited) |
||||||||
| Cash and cash equivalents, disbursement prefunding and short-term investments |
$ | 166,879 | $ | |||||
|
|
|
|
|
|||||
| Line of credit |
$ | 49,000 | $ | |||||
| Stockholders’ equity: |
||||||||
| Common stock, $0.0001 par value actual and as adjusted. 500,000,000 shares authorized, issued and outstanding 32,994,080 shares, actual; 500,000,000 shares authorized, shares issued and outstanding, as adjusted |
3 | |||||||
| Additional paid-in capital |
211,433 | |||||||
| Accumulated other comprehensive income (loss) |
(30 | ) | (30 | ) | ||||
| Accumulated deficit |
(59,355 | ) | (59,355 | ) | ||||
|
|
|
|
|
|||||
| Total stockholders’ equity |
152,051 | |||||||
|
|
|
|
|
|||||
| Total capitalization |
$ | 201,051 | $ | |||||
|
|
|
|
|
|||||
The number of shares of common stock issued and outstanding actual and as adjusted in the table above excludes the following shares:
| • | 6,730,461 shares of common stock issuable upon exercise of stock options outstanding as of June 30, 2013 at a weighted-average exercise price of $5.98 per share; and |
| • | 2,774,659 shares of common stock reserved for issuance under our 2012 Stock Option and Incentive Plan, and any future increase in shares reserved for issuance under such plan. |
43
Table of Contents
If you invest in our common stock in this offering, your interest will be diluted immediately to the extent of the difference between the offering price per share of our common stock and the pro forma as adjusted net tangible book value per share of our common stock after this offering. Our pro forma net tangible book value as of June 30, 2013 was $152.1 million, or $4.62 per share of common stock. Pro forma net tangible book value per share represents the amount of our total tangible assets less our total liabilities, divided by the number of shares of common stock outstanding, as of June 30, 2013.
After giving effect to the sale of shares of common stock by us at the public offering price of $ per share, which is the last reported sales price of our common stock on the NASDAQ Global Select Market on , 2013, less the estimated offering expenses payable by us and underwriters’ discounts, our pro forma net tangible book value at June 30, 2013 would have been approximately $ , or $ per share. This would represent an immediate increase in the net tangible book value of $ per share to existing stockholders and an immediate dilution of $ per share to investors in this offering. The following table illustrates this per share dilution.
| Assumed public offering price per share |
$ | |||||||
| Pro forma net tangible book value per share as of June 30, 2013 |
$ | 4.62 | ||||||
| Increase per share attributable to this offering |
$ | |||||||
|
|
|
|||||||
| Pro forma net tangible book value per share after this offering |
$ | |||||||
|
|
|
|||||||
| Dilution per share to new investors |
$ | |||||||
|
|
|
Each $1.00 increase or decrease in the assumed public offering price of $ per share, which is the last reported sale price of our common stock on the NASDAQ Global Select Market on , 2013, would increase or decrease, as applicable, our pro forma net tangible book value per share to new investors by $ , and would increase or decrease, as applicable, dilution per share to new investors in this offering by $ , assuming that the number of shares offered by us, as set forth on the cover page of this prospectus, remains the same and after deducting estimated underwriting discounts and commissions payable by us. In addition, to the extent any outstanding options to purchase common stock are exercised, new investors would experience further dilution. If the underwriters exercise their option to purchase additional shares from us in full, the pro forma net tangible book value per share of our common stock immediately after this offering would be per share, and the dilution in pro forma net tangible book value per share to new investors in this offering would be $ per share.
The following table presents, on a pro forma basis as of June 30, 2013, the differences between the existing stockholders and the new investors purchasing shares of our common stock in this offering with respect to the number of shares purchased from us, the total consideration paid or to be paid to us, which includes net proceeds received from the issuance of common stock, cash received from the exercise of stock options, and the average price per share paid or to be paid to us at the public offering price of $ per share, before deducting underwriting discounts and commissions and estimated offering expenses payable by us:
| Shares Purchased | Total Consideration | Average Price Per Share |
||||||||||||||||
| Number | Percent | Amount | Percent | |||||||||||||||
| Existing stockholders |
% | $ | % | $ | ||||||||||||||
| New investors |
||||||||||||||||||
|
|
|
|
|
|
|
|
||||||||||||
| 100.0 | % | $ | 100.0 | % | $ | |||||||||||||
|
|
|
|
|
|
|
|
||||||||||||
Each $1.00 increase or decrease in the assumed public offering price of $ per share, which is the last reported sale price of our common stock on the NASDAQ Global Select Market on , 2013, would increase or
44
Table of Contents
decrease, as applicable, the total consideration paid by new investors and total consideration paid by all stockholders by approximately $ , assuming that the number of shares offered by us, as set forth on the cover page of this prospectus, remains the same and after deducting estimated underwriting discounts and commissions payable by us. In addition, to the extent any outstanding options to purchase common stock are exercised, new investors will experience further dilution.
Assuming the underwriters’ option to purchase additional shares is exercised in full, sales by us in this offering will reduce the percentage of shares held by existing stockholders to % and will increase the number of shares held by our new investors to , or %, assuming no purchases of our common stock by existing stockholders in this offering.
The number of shares of common stock issued and outstanding actual and as adjusted in the table above excludes the following shares:
| • | 6,730,461 shares of common stock issuable upon exercise of stock options outstanding as of June 30, 2013 at a weighted-average exercise price of $5.98 per share; and |
| • | 2,774,659 shares of common stock reserved for issuance under our 2012 Stock Option and Incentive Plan, and any future increase in shares reserved for issuance under such plan. |
45
Table of Contents
SELECTED CONSOLIDATED FINANCIAL AND OTHER DATA
The following selected consolidated financial and other data regarding our business should be read in conjunction with, and are qualified by reference to, “Management’s Discussion and Analysis of Financial Condition and Results of Operations” and our consolidated financial statements and related notes included elsewhere in this prospectus. We derived the consolidated statement of operations data for 2010, 2011 and 2012 and the consolidated balance sheet data as of December 31, 2011 and 2012 from our audited consolidated financial statements included elsewhere in this prospectus. We derived the audited consolidated statement of operations data for 2008 and 2009 and the audited consolidated balance sheet data at December 31, 2008, 2009 and 2010 from our audited consolidated financial statements not included in this prospectus. We derived the unaudited consolidated statement of operations data for the six months ended June 30, 2012 and 2013, as well as the unaudited consolidated balance sheet data at June 30, 2013, from our unaudited interim consolidated financial statements included elsewhere in this prospectus. The unaudited interim consolidated financial statements have been prepared on the same basis as the audited consolidated financial statements and reflect all adjustments, consisting only of normal recurring adjustments, necessary for a fair presentation of the financial information set forth in those statements. Our historical results are not necessarily indicative of results to be expected in any future period, and results for the six months ended June 30, 2013 are not necessarily indicative of results to be expected for the full year ending December 31, 2013 or any other period.
| Year Ended December 31, | Six Months Ended June 30, |
|||||||||||||||||||||||||||
| 2008 | 2009 | 2010 | 2011 | 2012 | 2012 | 2013 | ||||||||||||||||||||||
| (in thousands, except per share data) | ||||||||||||||||||||||||||||
| (unaudited) | ||||||||||||||||||||||||||||
| Consolidated Statements of Operations Data: |
||||||||||||||||||||||||||||
| Revenue |
$ | 14,144 | $ | 26,276 | $ | 32,837 | $ | 50,020 | $ | 80,016 | $ | 37,953 | $ | 57,808 | ||||||||||||||
| Cost of revenue |
7,527 | 12,856 | 12,231 | 18,075 | 26,779 | 12,842 | 17,638 | |||||||||||||||||||||
|
|
|
|
|
|
|
|
|
|
|
|
|
|
|
|||||||||||||||
| Gross profit |
6,617 | 13,420 | 20,606 | 31,945 | 53,237 | 25,111 | 40,170 | |||||||||||||||||||||
|
|
|
|
|
|
|
|
|
|
|
|
|
|
|
|||||||||||||||
| Marketing |
6,828 | 8,144 | 11,608 | 14,314 | 21,496 | 10,417 | 12,599 | |||||||||||||||||||||
| Technology and development |
4,485 | 4,478 | 6,046 | 9,431 | 15,950 | 7,654 | 10,310 | |||||||||||||||||||||
| Customer service and operations |
2,377 | 3,143 | 5,257 | 7,321 | 10,964 | 4,977 | 6,342 | |||||||||||||||||||||
| General and administrative |
2,609 | 3,228 | 3,728 | 4,957 | 9,135 | 3,872 | 5,962 | |||||||||||||||||||||
|
|
|
|
|
|
|
|
|
|
|
|
|
|
|
|||||||||||||||
| Total operating expense |
16,299 | 18,993 | 26,639 | 36,023 | 57,545 | 26,920 | 35,213 | |||||||||||||||||||||
|
|
|
|
|
|
|
|
|
|
|
|
|
|
|
|||||||||||||||
| Income (loss) from operations |
(9,682 | ) | (5,573 | ) | (6,033 | ) | (4,078 | ) | (4,308 | ) | (1,809 | ) | 4,957 | |||||||||||||||
| Other income (expense): |
||||||||||||||||||||||||||||
| Interest expense |
(1 | ) | (32 | ) | (108 | ) | (370 | ) | (1,504 | ) | (602 | ) | (946 | ) | ||||||||||||||
| Interest income |
510 | 72 | 44 | 29 | 85 | 44 | 77 | |||||||||||||||||||||
| Other income (expense) |
99 | 39 | 140 | 49 | (125 | ) | 263 | 57 | ||||||||||||||||||||
|
|
|
|
|
|
|
|
|
|
|
|
|
|
|
|||||||||||||||
| Income (loss) before provision for income taxes |
(9,074 | ) | (5,494 | ) | (5,957 | ) | (4,370 | ) | (5,852 | ) | (2,104 | ) | 4,145 | |||||||||||||||
| Provision for income taxes |
2 | 2 | 2 | 2 | 2 | 2 | 134 | |||||||||||||||||||||
|
|
|
|
|
|
|
|
|
|
|
|
|
|
|
|||||||||||||||
| Net income (loss) |
$ | (9,076 | ) | $ | (5,496 | ) | $ | (5,959 | ) | $ | (4,372 | ) | $ | (5,854 | ) | $ | (2,106 | ) | $ | 4,011 | ||||||||
|
|
|
|
|
|
|
|
|
|
|
|
|
|
|
|||||||||||||||
| Net income (loss) per share: |
||||||||||||||||||||||||||||
| Basic |
$ | (2.01 | ) | $ | (1.18 | ) | $ | (1.25 | ) | $ | (0.88 | ) | $ | (1.16 | ) | $ | (0.42 | ) | $ | 0.15 | ||||||||
|
|
|
|
|
|
|
|
|
|
|
|
|
|
|
|||||||||||||||
| Diluted |
$ | (2.01 | ) | $ | (1.18 | ) | $ | (1.25 | ) | $ | (0.88 | ) | $ | (1.16 | ) | $ | (0.42 | ) | $ | 0.11 | ||||||||
|
|
|
|
|
|
|
|
|
|
|
|
|
|
|
|||||||||||||||
| Weighted-average shares used to compute per share amounts: |
||||||||||||||||||||||||||||
| Basic |
4,521 | 4,643 | 4,752 | 4,956 | 5,049 | 5,035 | 26,046 | |||||||||||||||||||||
|
|
|
|
|
|
|
|
|
|
|
|
|
|
|
|||||||||||||||
| Diluted |
4,521 | 4,643 | 4,752 | 4,956 | 5,049 | 5,035 | 35,865 | |||||||||||||||||||||
|
|
|
|
|
|
|
|
|
|
|
|
|
|
|
|||||||||||||||
46
Table of Contents
Stock-based compensation included in the accompanying statements of operations data above was as follows:
| Year Ended December 31, | Six Months Ended June 30, |
|||||||||||||||||||||||||||
| 2008 | 2009 | 2010 | 2011 | 2012 | 2012 | 2013 | ||||||||||||||||||||||
| (in thousands) | ||||||||||||||||||||||||||||
| (unaudited) | ||||||||||||||||||||||||||||
| Stock-based compensation expense: |
||||||||||||||||||||||||||||
| Marketing |
$ | 7 | $ | 24 | $ | 72 | $ | 145 | $ | 282 | $ | 117 | $ | 198 | ||||||||||||||
| Technology and development |
34 | 48 | 93 | 235 | 727 | 318 | 522 | |||||||||||||||||||||
| Customer service and operations |
22 | 11 | 107 | 118 | 256 | 109 | 184 | |||||||||||||||||||||
| General and administrative |
19 | 167 | 278 | 451 | 1,180 | 464 | 833 | |||||||||||||||||||||
|
|
|
|
|
|
|
|
|
|
|
|
|
|
|
|||||||||||||||
| Total stock-based compensation |
$ | 82 | $ | 250 | $ | 550 | $ | 949 | $ | 2,445 | $ | 1,008 | $ | 1,737 | ||||||||||||||
|
|
|
|
|
|
|
|
|
|
|
|
|
|
|
|||||||||||||||
The following table presents our key operating and financial metrics for the years and interim periods presented (unaudited):
| Year Ended December 31, | Six Months Ended June 30, |
|||||||||||||||||||||||||||
| 2008 | 2009 | 2010 | 2011 | 2012 | 2012 | 2013 | ||||||||||||||||||||||
| Other Financial and Operational Data: |
||||||||||||||||||||||||||||
| Gross Sending Volume (in thousands)(1) |
$ | 258,670 | $ | 500,549 | $ | 858,955 | $ | 1,706,659 | $ | 3,248,457 | $ | 1,530,398 | $ | 2,662,431 | ||||||||||||||
| Transactions(2) |
1,191,000 | 2,254,000 | 2,848,000 | 4,068,000 | 6,617,000 | 3,002,000 | 4,621,000 | |||||||||||||||||||||
| Active Customers(3) |
185,968 | 301,840 | 392,666 | 516,597 | 776,426 | 658,233 | 919,610 | |||||||||||||||||||||
| New Customers(4) |
136,559 | 205,317 | 225,949 | 291,532 | 405,304 | 208,416 | 244,530 | |||||||||||||||||||||
| Cost Per Acquisition of a New Customer(5) |
$ | 34 | $ | 29 | $ | 37 | $ | 38 | $ | 44 | $ | 43 | $ | 42 | ||||||||||||||
| Adjusted EBITDA (in thousands)(6) |
$ | (9,213 | ) | $ | (5,093 | ) | $ | (5,067 | ) | $ | (2,532 | ) | $ | (493 | ) | $ | 75 | $ | 7,723 | |||||||||
| (1) | Reflects the total principal amount of funds sent, excluding our fees, during a given period. |
| (2) | Reflects the aggregate number of transactions sent using our services during a given period. |
| (3) | Reflects customers who have sent at least one transaction during the last twelve month trailing period. |
| (4) | Reflects new customers added who have transacted at least once during a given period. |
| (5) | Reflects direct marketing cost, a portion of which is reflected in our cost of revenue, divided by new customers added in a given period. |
| (6) | See “Non-GAAP Financial Measures” below for how we define and calculate adjusted EBITDA, a reconciliation of adjusted EBITDA to net income (loss), the most directly comparable GAAP financial measure, and a discussion about the limitations of adjusted EBITDA. |
| As of December 31, | As of June 30, | |||||||||||||||||||||||
| 2008 | 2009 | 2010 | 2011 | 2012 | 2013 | |||||||||||||||||||
| (in thousands) | ||||||||||||||||||||||||
| (unaudited) | ||||||||||||||||||||||||
| Consolidated Balance Sheet Data: |
||||||||||||||||||||||||
| Cash and cash equivalents |
$ | 8,565 | $ | 21,850 | $ | 20,694 | $ | 48,248 | $ | 45,077 | $ | 91,072 | ||||||||||||
| Disbursement prefunding |
3,528 | 6,106 | 6,723 | 9,004 | 15,070 | 14,236 | ||||||||||||||||||
| Customer funds receivable |
865 | 1,175 | 4,164 | 17,187 | 9,318 | 47,456 | ||||||||||||||||||
| Property, equipment and software, net |
477 | 427 | 1,051 | 2,185 | 3,884 | 3,787 | ||||||||||||||||||
| Working capital |
15,055 | 24,255 | 35,833 | 56,323 | 68,838 | 162,740 | ||||||||||||||||||
| Total assets |
21,542 | 33,148 | 47,557 | 100,190 | 113,093 | 233,020 | ||||||||||||||||||
| Convertible preferred stock |
1,607 | 1,738 | 1,926 | 2,144 | 2,144 | — | ||||||||||||||||||
| Total stockholders’ equity |
16,275 | 25,423 | 38,657 | 60,361 | 57,320 | 152,051 | ||||||||||||||||||
47
Table of Contents
Non-GAAP Financial Measures
Adjusted EBITDA
To provide investors with additional information regarding our financial results, we have disclosed in the table below and within this prospectus adjusted EBITDA, a non-GAAP financial measure. We have provided a reconciliation below between adjusted EBITDA and net income (loss), the most directly comparable GAAP financial measure.
We have included adjusted EBITDA in this prospectus because it is a key measure used by our management to evaluate our operating performance, generate future operating plans and make strategic decisions. Accordingly, we believe that adjusted EBITDA provides useful information to investors and others in understanding and evaluating our operating results in the same manner as our management and board of directors.
While we believe that this non-GAAP financial measure is useful in evaluating our business, this information should be considered as supplemental in nature and is not meant as a substitute for the related financial information prepared in accordance with GAAP. Some of these limitations are:
| • | although depreciation and amortization are non-cash charges, the assets being depreciated and amortized may have to be replaced in the future; |
| • | adjusted EBITDA does not reflect changes in, or cash requirements for, our working capital needs; |
| • | adjusted EBITDA does not include the impact of stock-based compensation; |
| • | adjusted EBITDA does not reflect the impact of income taxes that may represent a reduction in cash available to us; and |
| • | other companies, including companies in our industry, may calculate adjusted EBITDA differently or not at all, which reduces its usefulness as a comparative measure. |
We believe it is useful to exclude non-cash charges, such as depreciation and amortization and stock-based compensation, from our adjusted EBITDA because the amount of such expenses in any specific period may not directly correlate to the underlying performance of our business operations.
Because of the aforementioned limitations, you should consider adjusted EBITDA alongside other financial performance measures, including net income (loss), cash flow metrics and our financial results presented in accordance with GAAP. The following table presents a reconciliation of net income (loss) to adjusted EBITDA for each of the years and interim periods indicated (unaudited):
| Year Ended December 31, | Six Months Ended June 30, |
|||||||||||||||||||||||||||
| 2008 | 2009 | 2010 | 2011 | 2012 | 2012 | 2013 | ||||||||||||||||||||||
| (in thousands) | ||||||||||||||||||||||||||||
| Reconciliation of Adjusted EBITDA: |
||||||||||||||||||||||||||||
| Net income (loss) |
$ | (9,076 | ) | $ | (5,496 | ) | $ | (5,959 | ) | $ | (4,372 | ) | $ | (5,854 | ) | $ | (2,106 | ) | $ | 4,011 | ||||||||
| Provisions for income taxes |
2 | 2 | 2 | 2 | 2 | 2 | 134 | |||||||||||||||||||||
| Interest expense |
1 | 32 | 108 | 370 | 1,504 | 602 | 946 | |||||||||||||||||||||
| Interest income |
(510 | ) | (72 | ) | (44 | ) | (29 | ) | (85 | ) | (44 | ) | (77 | ) | ||||||||||||||
| Depreciation and amortization |
288 | 191 | 276 | 548 | 1,495 | 613 | 972 | |||||||||||||||||||||
| Stock-based compensation |
82 | 250 | 550 | 949 | 2,445 | 1,008 | 1,737 | |||||||||||||||||||||
|
|
|
|
|
|
|
|
|
|
|
|
|
|
|
|||||||||||||||
| Adjusted EBITDA |
$ | (9,213 | ) | $ | (5,093 | ) | $ | (5,067 | ) | $ | (2,532 | ) | $ | (493 | ) | $ | 75 | $ | 7,723 | |||||||||
|
|
|
|
|
|
|
|
|
|
|
|
|
|
|
|||||||||||||||
48
Table of Contents
MANAGEMENT’S DISCUSSION AND ANALYSIS
OF FINANCIAL CONDITION AND RESULTS OF OPERATIONS
You should read the following discussion and analysis of our financial condition and results of operations in conjunction with our consolidated financial statements and the notes thereto included elsewhere in this prospectus. The following discussion contains forward-looking statements that reflect our plans, estimates and beliefs. Our actual results could differ materially from those discussed in the forward-looking statements. Factors that could cause or contribute to these differences include those discussed below and elsewhere in this prospectus, particularly in “Risk Factors.”
Xoom is a pioneer and leader in the digital consumer-to-consumer international money transfer industry. Our customers use Xoom to send money to family and friends in 30 countries. Since January 1, 2008, our customers have used Xoom to send $9.2 billion, including $1.7 billion in 2011, $3.2 billion in 2012 and $2.7 billion in the six months ended June 30, 2013. We believe we are creating significant value for our customers by providing a convenient, fast and cost-effective solution for international money transfers.
We believe our business model is characterized by sustainable revenue from a growing base of active customers, creating attractive per unit economics and operating leverage. We expect to continue to grow this customer base through increased marketing investment.
Although we are not a traditional subscription business, we operate our business and forecast our revenue similar to a subscription-based business model. This similarity is demonstrated by the predictable and recurring revenue from our active customers. The following graph identifies the quarterly gross sending volume by the year in which we originally acquired the customer and demonstrates a meaningful amount of stable recurring sending volume from active customers:
Gross Sending Volume By Year of Customer Acquisition (in thousands)
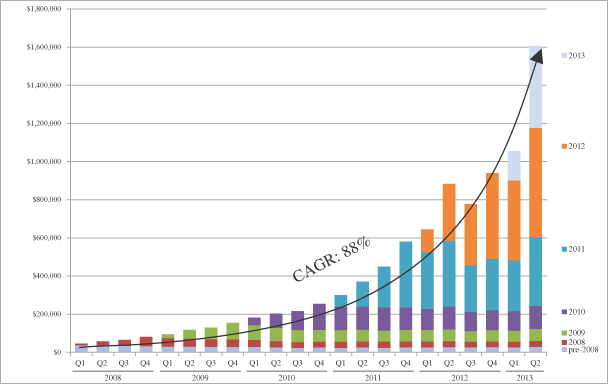
49
Table of Contents
During the six months ended June 30, 2013, we launched the following new initiatives to enhance our customer experience and expand our reach in the communities we serve:
| • | StatusTrak, a new tracking center that provides customers a variety of ways to track their transfers by text message, email updates and 24/7 customer support; |
| • | Pay Only When Received, or POWR, an assurance to qualifying customers that we will only withdraw their money after it is received by their recipients; |
| • | Four hour bank deposit to India, a quick deposit service to India where customers can transfer money to any rupee-denominated bank account in India in four hours when sent during Indian banking hours; |
| • | Indian marketing campaign featuring Indian superstar Amitabh Bachchan as our brand ambassador of our revolutionary four hour bank deposit to India; |
| • | Another strong marketing campaign focused on expanding our reach in the Mexican community; and |
| • | Released our new mobile application, which is targeted at existing customers, empowering them to send money to their family and friends in seconds with “one tap and one swipe,” as well as track the status of their transactions. |
In February 2013, the Reserve Bank of India extended its rupee drawing arrangement, or RDA, to money transmitters based in the United States. In July 2013, we began processing transactions to India via RDA. Prior to July 2013, we processed transactions to India exclusively through our wholly-owned subsidiary, buyindiaonline.com Inc., pursuant to its license under the Money Transfer Service Scheme, or MTSS, issued by the Reserve Bank of India. Now we are processing the vast majority of transactions to India without the involvement of our subsidiary, pursuant to RDA. There are fewer limitations on transactions processed pursuant to RDA. For example, we are now able to process transactions to bank accounts held by non-resident Indians, and we are no longer subject to the $2,500 transaction limit required by MTSS.
On February 21, 2013, we completed our initial public offering, or IPO, whereby 7,273,750 shares of our common stock were sold to the public (inclusive of 948,750 shares of common stock sold by us pursuant to the full exercise of an overallotment option granted to the underwriters and 1,104,107 shares of common stock sold by selling stockholders) at a price of $16.00 per share. The aggregate net proceeds received by us from the offering were $88.4 million, net of underwriting discounts and commissions and offering expenses payable by us. Immediately prior to the completion of the IPO, all shares of our then-outstanding convertible preferred stock automatically converted into 21,444,251 shares of common stock.
Key Metrics
In addition to the line items in our financial statements, we regularly review the following key metrics to evaluate our business, measure our performance, identify trends in our business, prepare financial projections, make strategic business decisions, and assess marketing program efficacy, market share trends and working capital needs. We believe information on these metrics is useful for investors to understand the underlying trends in our business. The following table presents our key operating and financial metrics for the years and interim periods presented (unaudited):
| Year Ended December 31, | Six Months Ended June 30, | |||||||||||||||||||
| 2010 | 2011 | 2012 | 2012 | 2013 | ||||||||||||||||
| Gross Sending Volume (in thousands) |
$ | 858,955 | $ | 1,706,659 | $ | 3,248,457 | $ | 1,530,398 | $ | 2,662,431 | ||||||||||
| Transactions |
2,848,000 | 4,068,000 | 6,617,000 | 3,002,000 | 4,621,000 | |||||||||||||||
| Active Customers |
392,666 | 516,597 | 776,426 | 658,233 | 919,610 | |||||||||||||||
| New Customers |
225,949 | 291,532 | 405,304 | 208,416 | 244,530 | |||||||||||||||
| Cost Per Acquisition of a New Customer |
$ | 37 | $ | 38 | $ | 44 | $ | 43 | $ | 42 | ||||||||||
| Adjusted EBITDA (in thousands) |
$ | (5,067 | ) | $ | (2,532 | ) | $ | (493 | ) | $ | 75 | $ | 7,723 | |||||||
50
Table of Contents
Gross Sending Volume. We define gross sending volume, or GSV, as the total principal amount of funds sent by our customers in a given period, which does not include our fees. A percentage of GSV does not ultimately get paid out to recipients due to customer cancellations, our risk management decisions and customer error. In the periods presented, this percentage has ranged from 2.75% to 3.50%. Our GSV increased 74% for the six months ended June 30, 2013 compared to the same period in the prior year, 90% for 2012, 99% for 2011 and 72% for 2010. Some of our customers transact more depending on the value of the local currency relative to the U.S. dollar. For example, amongst our Indian customers, we saw an increase in activity in the three months ended June 30, 2012 due to a weakening Indian rupee and a decrease in activity in the three months ended September 30, 2012 due to a strengthening Indian rupee.
Transactions. This represents the total number of transactions sent by our customers in a given period. A small percentage of transactions do not ultimately get paid out to recipients due to customer cancellations, our risk management decisions and customer error. Our transactions increased 54% for the six months ended June 30, 2013 compared to the same period in the prior year, 63% for 2012, 43% for 2011 and 26% for 2010.
Active Customers. We define active customers as the number of customers who have sent at least one transaction during a trailing twelve month period. A new customer with one transaction during a trailing twelve month period would also be included as an active customer in the same period. Our active customers increased 40% for the six months ended June 30, 2013 compared to the same period in the prior year, 50% for 2012, 32% for 2011 and 30% for 2010.
New Customers. We define new customers as those customers who have sent their first transaction in a given period. Our new customer growth increased by 17% for the six months ended June 30, 2013, compared to the same period in the prior year, 39% for 2012, 29% for 2011 and 10% for 2010.
Cost Per Acquisition of a New Customer. We calculate cost per acquisition of a new customer, or CPA, in a reporting period as direct marketing cost, a portion of which is reflected in our cost of revenue, divided by new customers added in a given period. Our direct marketing cost does not include certain indirect marketing costs that are included in our marketing expense line item in our consolidated statements of operations. Examples of our indirect marketing costs include personnel-related costs, including stock-based compensation, and creative production costs.
Adjusted EBITDA. Adjusted EBITDA is a non-GAAP financial measure that we calculate as net income (loss) adjusted for provision for income taxes, interest expense, interest income, depreciation and amortization and stock-based compensation. For a reconciliation of adjusted EBITDA to net income (loss) and an explanation of how management uses this metric, see “Selected Consolidated Financial And Other Data.”
Basis of Presentation
Revenue. We generate revenue from transaction fees charged to customers, and foreign exchange spreads on transactions where the payout currency is other than U.S. dollars. Our revenue is derived from each transaction and may vary based on the size of the transaction, the funding method used, the currency to ultimately be disbursed and the country to which the funds are transferred. Revenue is recognized net of cancellations and refunds. Revenue growth will depend on our ability to retain active customers and attract new customers.
Cost of Revenue. Our cost of revenue includes fees to our disbursement partners for paying funds to the recipient, fees to our payment processors for funding our transactions, a provision for transaction losses and the promotional expenses to acquire new customers that are referees described below under “—Marketing Expense.” We expect our cost of revenue to increase on an absolute basis for the foreseeable future as we continue to grow our business.
51
Table of Contents
Marketing Expense. Our marketing expense consists of business development costs, television, print, online and promotional advertising costs to acquire new customers, employee compensation and related costs to support the marketing process and allocated facilities and other supporting overhead costs. During 2011, we introduced a Refer-A-Friend incentive program where the referrer receives either a cash-type or non-cash award and the referee receives a non-cash award. Cash-type awards are considered to be cash-type because the referrer could use them as cash. The amount related to the referee is classified as cost of revenue for non-cash awards. Awards provided to the referrer are recorded in marketing expense as these payments are a reward for bringing a new customer to Xoom. We anticipate our marketing expense will vary from period to period due to the timing of when such programs occur.
Technology and Development Expense. Our technology and development expense consists of employee compensation and related costs for our engineers and developers, professional services and consulting, costs related to the development of new technologies, costs associated with the enhancements of existing technologies, amortization of capitalized internally-developed software and allocated facilities and other supporting overhead costs. Internally-developed software costs are a combination of internal compensation costs of engineering time and costs of outside consultants and primarily relate to the development of specific enhancements such as the development of our mobile application. We intend to continue to invest in technology and development efforts to further improve our customer experience and to continue expanding our operating platform. As a result, we expect technology and development expense to increase on an absolute basis for the foreseeable future.
Customer Service and Operations Expense. Our customer service and operations expense consists of outsourced customer call centers, employee compensation for our employees who support customer service calls, costs incurred for fraud detection, compliance operations, maintenance costs related to our outsourced customer call centers and allocated facilities and other supporting overhead costs. We expect customer service and operations expense to increase on an absolute basis for the foreseeable future to support the anticipated growth of our business.
General and Administrative Expense. Our general and administrative expense consists of employee compensation and related costs for our executives, finance, legal, compliance policy, human resources and other administrative employees, outside consulting, legal and accounting services and facilities and other supporting overhead costs not allocated to other departments. We expect to incur additional expenses associated with being a public company, including increased legal and accounting costs, compliance costs in connection with the Sarbanes-Oxley Act and investor relations costs.
Interest Expense. Interest expense represents interest incurred in connection with outstanding borrowings under our line of credit.
Interest Income. Interest income represents interest earned on our cash and cash equivalents and short-term investments.
Other Income (Expense). Other income (expense) consists of gains or losses on foreign currency balances held at month end.
Provision for Income Taxes. Provision for income taxes consists of federal and state income taxes in the United States. We have not been required to pay U.S. federal income taxes to date because of our current and accumulated net operating losses which totaled $56.6 million as of December 31, 2012. Since inception, we have only been required to pay minimal state income taxes. For the six months ended June 30, 2013, tax expense was $134,000, which consists of U.S. federal minimum tax and state income taxes. In the event we expand our operations outside the United States, we will become subject to foreign taxes and our effective tax rate could change accordingly.
52
Table of Contents
Results of Operations
The following tables set forth our results of operations in dollars and as a percentage of revenue for the years and interim periods presented. The period-to-period comparison of financial results is not necessarily indicative of future results.
| Year Ended December 31, | Six Months Ended June 30, |
|||||||||||||||||||
| 2010 | 2011 | 2012 | 2012 | 2013 | ||||||||||||||||
| (in thousands) | ||||||||||||||||||||
| (unaudited) | ||||||||||||||||||||
| Consolidated Statements of Operations Data: |
||||||||||||||||||||
| Revenue |
$ | 32,837 | $ | 50,020 | $ | 80,016 | $ | 37,953 | $ | 57,808 | ||||||||||
| Cost of revenue |
12,231 | 18,075 | 26,779 | 12,842 | 17,638 | |||||||||||||||
|
|
|
|
|
|
|
|
|
|
|
|||||||||||
| Gross profit |
20,606 | 31,945 | 53,237 | 25,111 | 40,170 | |||||||||||||||
|
|
|
|
|
|
|
|
|
|
|
|||||||||||
| Marketing |
11,608 | 14,314 | 21,496 | 10,417 | 12,599 | |||||||||||||||
| Technology and development |
6,046 | 9,431 | 15,950 | 7,654 | 10,310 | |||||||||||||||
| Customer service and operations |
5,257 | 7,321 | 10,964 | 4,977 | 6,342 | |||||||||||||||
| General and administrative |
3,728 | 4,957 | 9,135 | 3,872 | 5,962 | |||||||||||||||
|
|
|
|
|
|
|
|
|
|
|
|||||||||||
| Total operating expense |
26,639 | 36,023 | 57,545 | 26,920 | 35,213 | |||||||||||||||
|
|
|
|
|
|
|
|
|
|
|
|||||||||||
| Income (loss) from operations |
(6,033 | ) | (4,078 | ) | (4,308 | ) | (1,809 | ) | 4,957 | |||||||||||
| Other income (expense): |
||||||||||||||||||||
| Interest expense |
(108 | ) | (370 | ) | (1,504 | ) | (602 | ) | (946 | ) | ||||||||||
| Interest income |
44 | 29 | 85 | 44 | 77 | |||||||||||||||
| Other income (expense) |
140 | 49 | (125 | ) | 263 | 57 | ||||||||||||||
|
|
|
|
|
|
|
|
|
|
|
|||||||||||
| Income (loss) before provision for income taxes |
(5,957 | ) | (4,370 | ) | (5,852 | ) | (2,104 | ) | 4,145 | |||||||||||
| Provision for income taxes |
2 | 2 | 2 | 2 | 134 | |||||||||||||||
|
|
|
|
|
|
|
|
|
|
|
|||||||||||
| Net income (loss) |
$ | (5,959 | ) | $ | (4,372 | ) | $ | (5,854 | ) | $ | (2,106 | ) | $ | 4,011 | ||||||
|
|
|
|
|
|
|
|
|
|
|
|||||||||||
| Year Ended December 31, | Six Months Ended June 30, |
|||||||||||||||||||
| 2010 | 2011 | 2012 | 2012 | 2013 | ||||||||||||||||
| (unaudited) | ||||||||||||||||||||
| Consolidated Statements of Operations Data:(1) |
||||||||||||||||||||
| Revenue |
100 | % | 100 | % | 100 | % | 100 | % | 100 | % | ||||||||||
| Cost of revenue |
37 | 36 | 33 | 34 | 31 | |||||||||||||||
|
|
|
|
|
|
|
|
|
|
|
|||||||||||
| Gross profit |
63 | 64 | 67 | 66 | 69 | |||||||||||||||
|
|
|
|
|
|
|
|
|
|
|
|||||||||||
| Marketing |
35 | 29 | 27 | 27 | 22 | |||||||||||||||
| Technology and development |
18 | 19 | 20 | 20 | 18 | |||||||||||||||
| Customer service and operations |
16 | 15 | 14 | 13 | 11 | |||||||||||||||
| General and administrative |
11 | 10 | 11 | 10 | 10 | |||||||||||||||
|
|
|
|
|
|
|
|
|
|
|
|||||||||||
| Total operating expense |
81 | 72 | 72 | 71 | 61 | |||||||||||||||
|
|
|
|
|
|
|
|
|
|
|
|||||||||||
| Income (loss) from operations |
(18 | ) | (8 | ) | (5 | ) | (5 | ) | 9 | |||||||||||
| Other income (expense): |
||||||||||||||||||||
| Interest expense |
— | (1 | ) | (2 | ) | (2 | ) | (2 | ) | |||||||||||
| Interest income |
— | — | — | — | — | |||||||||||||||
| Other income (expense) |
— | — | — | 1 | — | |||||||||||||||
|
|
|
|
|
|
|
|
|
|
|
|||||||||||
| Income (loss) before provision for income taxes |
(18 | ) | (9 | ) | (7 | ) | (6 | ) | 7 | |||||||||||
| Provision for income taxes |
— | — | — | — | — | |||||||||||||||
|
|
|
|
|
|
|
|
|
|
|
|||||||||||
| Net income (loss) |
(18 | )% | (9 | )% | (7 | )% | (7 | )% | 7 | % | ||||||||||
|
|
|
|
|
|
|
|
|
|
|
|||||||||||
| (1) | Certain items may not foot due to rounding. |
53
Table of Contents
Six Months Ended June 30, 2012 and 2013
Revenue
| Six Months Ended June 30, |
||||||||||||
| 2013 | 2012 | % Change | ||||||||||
| (in thousands) | ||||||||||||
| (unaudited) | ||||||||||||
| Revenue |
$ | 57,808 | $ | 37,953 | 52 | % | ||||||
In the six months ended June 30, 2013, revenue increased $19.9 million, or 52%, compared to the six months ended June 30, 2012. The increase was primarily due to a 40% increase in active customers, which included 244,530 new customers added during the six months ended June 30, 2013. Revenue grew at a faster rate than the increase in our active customers because six-month revenue per average active customer grew from $65 to $68, or 5%, for the six months ended June 30, 2013 compared to the same period in the prior year. The increase was due to changes in the mix of transactions to the countries we served towards those with higher transaction amounts.
Cost of Revenue
| Six Months Ended June 30, |
||||||||||||
| 2013 | 2012 | % Change | ||||||||||
| (dollars in thousands) | ||||||||||||
| (unaudited) | ||||||||||||
| Cost of revenue |
$ | 17,638 | $ | 12,842 | 37 | % | ||||||
| Percentage of revenue |
31 | % | 34 | % | ||||||||
In the six months ended June 30, 2013, cost of revenue increased $4.8 million, or 37%, compared to the six months ended June 30, 2012. The increase in cost of revenue was driven by a $3.1 million increase to $10.5 million in processing and disbursement costs to support the 54% increase in transactions and a $2.2 million increase in the provision for transaction losses due to the increase in our GSV. This was partially offset by a decrease of $0.5 million in costs related to Refer-A-Friend and other incentive programs. The decrease in cost of revenue as a percentage of revenue and corresponding increase in gross profit for the six months ended June 30, 2013 was primarily a result of a reduction in disbursement costs per transaction due to the shift in country concentration.
Marketing Expense
| Six Months Ended June 30, |
||||||||||||
| 2013 | 2012 | % Change | ||||||||||
| (dollars in thousands) | ||||||||||||
| (unaudited) | ||||||||||||
| Marketing |
$ | 12,599 | $ | 10,417 | 21 | % | ||||||
| Percentage of revenue |
22 | % | 27 | % | ||||||||
In the six months ended June 30, 2013, marketing expense increased $2.2 million, or 21%, compared to the six months ended June 30, 2012. The increase was primarily due to an expansion of our marketing programs to drive increased customer acquisition, including increasing television, online and incentive promotions by $1.7 million to $10.5 million during the six months ended June 30, 2013. The remaining increase was due to personnel-related costs (including stock-based compensation).
Technology and Development Expense
| Six Months Ended June 30, |
||||||||||||
| 2013 | 2012 | % Change | ||||||||||
| (dollars in thousands) | ||||||||||||
| (unaudited) | ||||||||||||
| Technology and development |
$ | 10,310 | $ | 7,654 | 35 | % | ||||||
| Percentage of revenue |
18 | % | 20 | % | ||||||||
54
Table of Contents
In the six months ended June 30, 2013, technology and development expense increased $2.7 million, or 35%, compared to the six months ended June 30, 2012. The increase was primarily the result of an increase in personnel-related costs of $1.9 million to $8.1 million (including stock-based compensation) due to an increase in headcount from 63 to 89 employees to expand and improve our service. The remaining increase was due to an increase in depreciation and amortization expense of $0.3 million and an increase in facilities, information technology and other infrastructure costs.
Customer Service and Operations Expense
| Six Months Ended June 30, |
||||||||||||
| 2013 | 2012 | % Change | ||||||||||
| (dollars in thousands) | ||||||||||||
| (unaudited) | ||||||||||||
| Customer service and operations |
$ | 6,342 | $ | 4,977 | 27 | % | ||||||
| Percentage of revenue |
11 | % | 13 | % | ||||||||
In the six months ended June 30, 2013, customer service and operations expense increased $1.4 million, or 27%, compared to the six months ended June 30, 2012. The increase was primarily due to an increase in the volume of transactions we processed, resulting in an increase in costs of $1.0 million to $3.6 million associated with our outsourced customer call centers. The remaining increase was due to an increase in call center costs of $0.2 million.
General and Administrative Expense
| Six Months Ended June 30, |
||||||||||||
| 2013 | 2012 | % Change | ||||||||||
| (dollars in thousands) | ||||||||||||
| (unaudited) | ||||||||||||
| General and administrative |
$ | 5,962 | $ | 3,872 | 54 | % | ||||||
| Percentage of revenue |
10 | % | 10 | % | ||||||||
In the six months ended June 30, 2013, general and administrative expense increased $2.1 million, or 54%, compared to the six months ended June 30, 2012. The increase was primarily the result of an increase in personnel-related costs of $1.3 million to $3.6 million (including stock-based compensation) due to an increase in headcount from 26 to 37 employees to support our overall growth, and an increase in consulting and professional services of $0.3 million. The remaining increase was due to an increase in facilities, information technology and other infrastructure costs.
Interest Expense
Interest expense increased $0.3 million in the six months ended June 30, 2013, compared to the same period in the prior year as a result of the increase in average outstanding debt balances on our line of credit compared to the same periods in the prior year.
Years Ended December 31, 2010, 2011 and 2012
Revenue
| Year Ended December 31, | 2010 to 2011 | 2011 to 2012 | ||||||||||||||||||
| 2010 | 2011 | 2012 | % Change | % Change | ||||||||||||||||
| (in thousands) | ||||||||||||||||||||
| Revenue |
$ | 32,837 | $ | 50,020 | $ | 80,016 | 52 | % | 60 | % | ||||||||||
2011 Compared to 2012. Revenue increased $30.0 million, or 60%, in 2012 as compared to 2011. The increase was primarily due to a 50% increase in active customers, which included 405,304 new customers added during 2012. Revenue grew at a faster rate than the increase in our active customers because the annual revenue per average active customer increased from $110 in 2011 to $124 in 2012, or 13%. This increase was due to changes in the mix of countries we serve toward those with a higher average transaction amount.
55
Table of Contents
2010 Compared to 2011. Revenue increased $17.2 million, or 52%, in 2011 as compared to 2010. The increase was primarily due to a 32% increase in active customers, which included 291,532 new customers added during 2011. Revenue grew at a faster rate than the increase in our active customers because the annual revenue per average active customer increased from $95 in 2010 to $110 in 2011, or 16%. This increase was due to changes in the mix of countries we serve toward those with a higher average transaction amount.
Cost of Revenue
| Year Ended December 31, | 2010 to 2011 | 2011 to 2012 | ||||||||||||||||||
| 2010 | 2011 | 2012 | % Change | % Change | ||||||||||||||||
| (dollars in thousands) | ||||||||||||||||||||
| Cost of revenue |
$ | 12,231 | $ | 18,075 | $ | 26,779 | 48 | % | 48 | % | ||||||||||
| Percentage of revenue |
37 | % | 36 | % | 33 | % | ||||||||||||||
2011 Compared to 2012. Cost of revenue increased $8.7 million, or 48%, in 2012 as compared to 2011. The increase in cost of revenue was driven by a $4.4 million increase to $16.3 million in processing and disbursement costs to support the 63% increase in transactions, a $2.3 million increase to $7.7 million in the provision for transaction losses due to the increase in our GSV and an additional $1.8 million in costs related to the Refer-A-Friend and other incentive programs. The decrease in cost of revenue as a percentage of revenue and corresponding increase in gross profit for 2012 was primarily a result of a reduction in processing costs due to more active customers funding their money transfers via bank account, which is less costly to us than if they fund via credit or debit card. Further, we experienced a reduction in our processing costs per transaction as a result of the Durbin Amendment to the Dodd-Frank Act, which resulted in lower debit card fees beginning in the fourth quarter of 2011.
2010 Compared to 2011. Cost of revenue increased $5.8 million, or 48%, in 2011 as compared to 2010. The increase in cost of revenue was primarily driven by a $2.7 million increase to $5.4 million in the provision for transaction losses due to the increase in our GSV, a $1.4 million increase to $11.9 million in processing and disbursement costs to support the 43% increase in transactions and an additional $0.8 million in costs related to the Refer-A-Friend incentive program. During 2010, we reduced the provision for transaction losses by $0.9 million due to lower than expected transaction losses, which further contributed to the increase in cost of revenue for 2011. Processing and disbursement costs did not increase at the same rate as the increase in revenue as more of our active customers funded their money transfers via bank accounts, which is less costly to us than if they fund via credit or debit card. Further, we experienced a reduction in our processing costs as a result of the Durbin Amendment to the Dodd-Frank Act, which resulted in lower debit card fees, beginning in the fourth quarter of 2011.
Marketing Expense
| Year Ended December 31, | 2010 to 2011 | 2011 to 2012 | ||||||||||||||||||
| 2010 | 2011 | 2012 | % Change | % Change | ||||||||||||||||
| (dollars in thousands) | ||||||||||||||||||||
| Marketing |
$ | 11,608 | $ | 14,314 | $ | 21,496 | 23 | % | 50 | % | ||||||||||
| Percentage of revenue |
35 | % | 29 | % | 27 | % | ||||||||||||||
2011 Compared to 2012. Marketing expense increased $7.2 million, or 50%, in 2012 as compared to 2011. The increase was primarily due to an increase in our marketing programs to drive increased customer acquisition, including television, online and incentive promotions of $6.3 million to $17.9 million in 2012. Our Refer-A-Friend incentive program contributed $2.0 million of this $6.3 million increase. As stated in “—Cost of Revenue” above, marketing expenses in this line item do not reflect certain marketing expenses related to our Refer-A-Friend incentive program that we recognize under cost of revenue. The remaining increase was due to personnel-related costs (including stock-based compensation).
56
Table of Contents
2010 Compared to 2011. Marketing expense increased $2.7 million, or 23%, in 2011 as compared to 2010. The increase was primarily due to an expansion of our marketing programs to drive increased customer acquisition, including television, print, online and incentive promotions, of $1.7 million to $11.6 million. During 2011, we hired additional headcount to support our marketing initiatives which resulted in an additional $0.5 million of marketing expense. Our Refer-A-Friend incentive program contributed $0.3 million of the increase for 2011. As stated in “—Cost of Revenue” above, marketing expenses in this line item do not reflect certain marketing expenses related to our Refer-A-Friend incentive program that we recognize under cost of revenue.
Technology and Development Expense
| Year Ended December 31, | 2010 to 2011 | 2011 to 2012 | ||||||||||||||||||
| 2010 | 2011 | 2012 | % Change | % Change | ||||||||||||||||
| (dollars in thousands) | ||||||||||||||||||||
| Technology and development |
$ | 6,046 | $ | 9,431 | $ | 15,950 | 56 | % | 69 | % | ||||||||||
| Percentage of revenue |
18 | % | 19 | % | 20 | % | ||||||||||||||
2011 Compared to 2012. Technology and development expense increased $6.5 million, or 69%, in 2012 as compared to 2011. The increase was primarily the result of an increase in personnel-related costs of $5.0 million to $12.9 million (including stock-based compensation) due to an increase in headcount from 58 to 78 employees to expand and improve our service. The remaining increase was due to an increase in depreciation and amortization expense of $0.5 million, an increase in the investment of additional technology infrastructure of $0.5 million and an increase in allocated overhead costs.
2010 Compared to 2011. Technology and development expense increased $3.4 million, or 56%, in 2011 as compared to 2010. The increase was primarily the result of an increase in personnel-related costs of $2.7 million to $7.9 million (including stock-based compensation) due to an increase in headcount from 28 to 58 employees to expand and improve our service.
Customer Service and Operations Expense
| Year Ended December 31, | 2010 to 2011 | 2011 to 2012 | ||||||||||||||||||
| 2010 | 2011 | 2012 | % Change | % Change | ||||||||||||||||
| (dollars in thousands) | ||||||||||||||||||||
| Customer service and operations |
$ | 5,257 | $ | 7,321 | $ | 10,964 | 39 | % | 50 | % | ||||||||||
| Percentage of revenue |
16 | % | 15 | % | 14 | % | ||||||||||||||
2011 Compared to 2012. Customer service and operations expense increased $3.6 million, or 50%, in 2012 as compared to 2011. The increase was primarily due to an increase in the volume of transactions we processed, resulting in higher costs of $2.5 million to $6.1 million associated with our outsourced customer call centers and personnel-related costs of $0.8 million to $3.0 million (including stock-based compensation) due to an increase in headcount.
2010 Compared to 2011. Customer service and operations expense increased $2.1 million, or 39%, in 2011 as compared to 2010. The increase was primarily due to an increase in the volume of transactions we processed, resulting in higher costs of $1.4 million to $3.6 million associated with our outsourced customer call centers, customer verifications of $0.3 million and personnel-related costs of $0.2 million to $2.2 million (including stock-based compensation) due to an increase in headcount.
General and Administrative Expense
| Year Ended December 31, | 2010 to 2011 | 2011 to 2012 | ||||||||||||||||||
| 2010 | 2011 | 2012 | % Change | % Change | ||||||||||||||||
| (dollars in thousands) | ||||||||||||||||||||
| General and administrative |
$ | 3,728 | $ | 4,957 | $ | 9,135 | 33 | % | 84 | % | ||||||||||
| Percentage of revenue |
11 | % | 10 | % | 11 | % | ||||||||||||||
57
Table of Contents
2011 Compared to 2012. General and administrative expense increased $4.2 million, or 84%, in 2012 as compared to 2011. The increase was primarily the result of an increase in personnel-related costs of $2.4 million to $5.5 million (including stock-based compensation) due to an increase in headcount from 18 to 32 employees to support our overall growth and an increase in consulting and professional services of $0.9 million. The remaining increase was due to an increase in allocated overhead costs.
2010 Compared to 2011. General and administrative expense increased $1.2 million, or 33%, in 2011 as compared to 2010. The increase was primarily due to an increase in personnel-related costs of $0.6 million to $3.1 million (including stock-based compensation) due to an increase in headcount and an increase in consulting and professional services of $0.3 million.
Interest Expense
2011 Compared to 2012. Interest expense increased $1.1 million as a result of the increase in average outstanding balances during 2012 on our line of credit.
2010 Compared to 2011. Interest expense increased $0.3 million as a result of average higher outstanding balances during 2011 on our line of credit.
58
Table of Contents
Quarterly Results of Operations Data
The following tables set forth our unaudited quarterly consolidated statements of operations data in dollars and as a percentage of revenue and our key metrics for each of the ten quarters ended June 30, 2013. We have prepared the quarterly data on a consistent basis with the audited consolidated financial statements included in this prospectus. In the opinion of management, the financial information reflects all necessary adjustments, consisting only of normal recurring adjustments, necessary for a fair presentation of this data. This information should be read in conjunction with the audited consolidated financial statements and related notes included elsewhere in this prospectus. The results of historical periods are not necessarily indicative of the results of operations for a full year or any future period.
| Three Months Ended, | ||||||||||||||||||||||||||||||||||||||||
| March 31, 2011 |
June 30, 2011 |
September 30, 2011 |
December 31, 2011 |
March 31, 2012 |
June 30, 2012 |
September 30, 2012 |
December 31, 2012 |
March 31, 2013 |
June 30, 2013 |
|||||||||||||||||||||||||||||||
| (in thousands, except per share data) | ||||||||||||||||||||||||||||||||||||||||
| (unaudited) | ||||||||||||||||||||||||||||||||||||||||
| Revenue |
$ | 9,878 | $ | 11,364 | $ | 13,204 | $ | 15,574 | $ | 16,945 | $ | 21,008 | $ | 19,901 | $ | 22,162 | $ | 24,315 | $ | 33,493 | ||||||||||||||||||||
| Cost of revenue |
3,717 | 4,128 | 4,558 | 5,672 | 5,461 | 7,381 | 6,533 | 7,404 | 7,519 | 10,119 | ||||||||||||||||||||||||||||||
|
|
|
|
|
|
|
|
|
|
|
|
|
|
|
|
|
|
|
|
|
|||||||||||||||||||||
| Gross profit |
6,161 | 7,236 | 8,646 | 9,902 | 11,484 | 13,627 | 13,368 | 14,758 | 16,796 | 23,374 | ||||||||||||||||||||||||||||||
|
|
|
|
|
|
|
|
|
|
|
|
|
|
|
|
|
|
|
|
|
|||||||||||||||||||||
| Marketing |
2,962 | 3,280 | 3,537 | 4,535 | 4,288 | 6,129 | 5,648 | 5,431 | 5,692 | 6,907 | ||||||||||||||||||||||||||||||
| Technology and development |
1,687 | 1,921 | 2,635 | 3,188 | 3,623 | 4,031 | 4,015 | 4,281 | 4,834 | 5,476 | ||||||||||||||||||||||||||||||
| Customer service and operations |
1,605 | 1,710 | 1,937 | 2,069 | 2,197 | 2,780 | 2,885 | 3,102 | 3,017 | 3,325 | ||||||||||||||||||||||||||||||
| General and administrative |
1,313 | 1,230 | 1,121 | 1,293 | 1,678 | 2,194 | 2,357 | 2,906 | 2,923 | 3,039 | ||||||||||||||||||||||||||||||
|
|
|
|
|
|
|
|
|
|
|
|
|
|
|
|
|
|
|
|
|
|||||||||||||||||||||
| Total operating expense |
7,567 | 8,141 | 9,230 | 11,085 | 11,786 | 15,134 | 14,905 | 15,720 | 16,466 | 18,747 | ||||||||||||||||||||||||||||||
|
|
|
|
|
|
|
|
|
|
|
|
|
|
|
|
|
|
|
|
|
|||||||||||||||||||||
| Income (loss from operations) |
(1,406 | ) | (905 | ) | (584 | ) | (1,183 | ) | (302 | ) | (1,507 | ) | (1,537 | ) | (962 | ) | 330 | 4,627 | ||||||||||||||||||||||
| Other income (expense): |
||||||||||||||||||||||||||||||||||||||||
| Interest expense |
(34 | ) | (39 | ) | (96 | ) | (201 | ) | (247 | ) | (355 | ) | (387 | ) | (515 | ) | (447 | ) | (499 | ) | ||||||||||||||||||||
| Interest income |
6 | 5 | 5 | 13 | 21 | 23 | 23 | 18 | 36 | 41 | ||||||||||||||||||||||||||||||
| Other income (expense) |
32 | 116 | (92 | ) | (7 | ) | 36 | 227 | (374 | ) | (14 | ) | 4 | 53 | ||||||||||||||||||||||||||
|
|
|
|
|
|
|
|
|
|
|
|
|
|
|
|
|
|
|
|
|
|||||||||||||||||||||
| Income (loss) before provision for income taxes |
(1,402 | ) | (823 | ) | (767 | ) | (1,378 | ) | (492 | ) | (1,612 | ) | (2,275 | ) | (1,473 | ) | (77 | ) | 4,222 | |||||||||||||||||||||
| Provision for income taxes |
2 | — | — | — | 2 | — | — | — | 2 | 132 | ||||||||||||||||||||||||||||||
|
|
|
|
|
|
|
|
|
|
|
|
|
|
|
|
|
|
|
|
|
|||||||||||||||||||||
| Net income (loss) |
$ | (1,404 | ) | $ | (823 | ) | $ | (767 | ) | $ | (1,378 | ) | $ | (494 | ) | $ | (1,612 | ) | $ | (2,275 | ) | $ | (1,473 | ) | $ | (79 | ) | $ | 4,090 | |||||||||||
|
|
|
|
|
|
|
|
|
|
|
|
|
|
|
|
|
|
|
|
|
|||||||||||||||||||||
| Net income (loss) per share: |
||||||||||||||||||||||||||||||||||||||||
| Basic |
$ | (0.29 | ) | $ | (0.17 | ) | $ | (0.15 | ) | $ | (0.27 | ) | $ | (0.10 | ) | $ | (0.32 | ) | $ | (0.45 | ) | $ | (0.29 | ) | $ | 0.00 | $ | 0.12 | ||||||||||||
|
|
|
|
|
|
|
|
|
|
|
|
|
|
|
|
|
|
|
|
|
|||||||||||||||||||||
| Diluted |
$ | (0.29 | ) | $ | (0.17 | ) | $ | (0.15 | ) | $ | (0.27 | ) | $ | (0.10 | ) | $ | (0.32 | ) | $ | (0.45 | ) | $ | (0.29 | ) | $ | 0.00 | $ | 0.11 | ||||||||||||
|
|
|
|
|
|
|
|
|
|
|
|
|
|
|
|
|
|
|
|
|
|||||||||||||||||||||
| Weighted-average shares used to compute per share amounts: |
||||||||||||||||||||||||||||||||||||||||
| Basic |
4,893 | 4,929 | 4,975 | 5,024 | 5,030 | 5,041 | 5,056 | 5,071 | 19,041 | 32,974 | ||||||||||||||||||||||||||||||
|
|
|
|
|
|
|
|
|
|
|
|
|
|
|
|
|
|
|
|
|
|||||||||||||||||||||
| Diluted |
4,893 | 4,929 | 4,975 | 5,024 | 5,030 | 5,041 | 5,056 | 5,071 | 19,041 | 37,263 | ||||||||||||||||||||||||||||||
|
|
|
|
|
|
|
|
|
|
|
|
|
|
|
|
|
|
|
|
|
|||||||||||||||||||||
59
Table of Contents
Stock-based compensation included in the above line items was as follows:
| Three Months Ended, | ||||||||||||||||||||||||||||||||||||||||
| March 31, 2011 |
June 30, 2011 |
September 30, 2011 |
December 31, 2011 |
March 31, 2012 |
June 30, 2012 |
September 30, 2012 |
December 31, 2012 |
March 31, 2013 |
June 30, 2013 |
|||||||||||||||||||||||||||||||
| (in thousands) | ||||||||||||||||||||||||||||||||||||||||
| (unaudited) | ||||||||||||||||||||||||||||||||||||||||
| Stock-based compensation expense: |
||||||||||||||||||||||||||||||||||||||||
| Marketing |
$ | 35 | $ | 35 | $ | 38 | $ | 37 | $ | 51 | $ | 66 | $ | 81 | $ | 84 | $ | 92 | $ | 106 | ||||||||||||||||||||
| Technology and development |
29 | 52 | 74 | 80 | 148 | 170 | 200 | 209 | 226 | 296 | ||||||||||||||||||||||||||||||
| Customer service and operations |
29 | 27 | 31 | 31 | 42 | 67 | 74 | 73 | 77 | 107 | ||||||||||||||||||||||||||||||
| General and administrative |
107 | 132 | 107 | 105 | 183 | 281 | 349 | 367 | 383 | 450 | ||||||||||||||||||||||||||||||
|
|
|
|
|
|
|
|
|
|
|
|
|
|
|
|
|
|
|
|
|
|||||||||||||||||||||
| Total stock-based compensation |
$ | 200 | $ | 246 | $ | 250 | $ | 253 | $ | 424 | $ | 584 | $ | 704 | $ | 733 | $ | 778 | $ | 959 | ||||||||||||||||||||
|
|
|
|
|
|
|
|
|
|
|
|
|
|
|
|
|
|
|
|
|
|||||||||||||||||||||
| Three Months Ended,(1) | ||||||||||||||||||||||||||||||||||||||||
| March 31, 2011 |
June 30, 2011 |
September 30, 2011 |
December 31, 2011 |
March 31, 2012 |
June 30, 2012 |
September 30, 2012 |
December 31, 2012 |
March 31, 2013 |
June 30, 2013 |
|||||||||||||||||||||||||||||||
| (unaudited) | ||||||||||||||||||||||||||||||||||||||||
| Revenue |
100 | % | 100 | % | 100 | % | 100 | % | 100 | % | 100 | % | 100 | % | 100 | % | 100 | % | 100 | % | ||||||||||||||||||||
| Cost of revenue |
38 | 36 | 35 | 36 | 32 | 35 | 33 | 33 | 31 | 30 | ||||||||||||||||||||||||||||||
|
|
|
|
|
|
|
|
|
|
|
|
|
|
|
|
|
|
|
|
|
|||||||||||||||||||||
| Gross profit |
62 | 64 | 65 | 64 | 68 | 65 | 67 | 67 | 69 | 70 | ||||||||||||||||||||||||||||||
|
|
|
|
|
|
|
|
|
|
|
|
|
|
|
|
|
|
|
|
|
|||||||||||||||||||||
| Marketing |
30 | 29 | 27 | 29 | 25 | 29 | 28 | 25 | 23 | 21 | ||||||||||||||||||||||||||||||
| Technology and development |
17 | 17 | 20 | 20 | 21 | 19 | 20 | 19 | 20 | 16 | ||||||||||||||||||||||||||||||
| Customer service and operations |
16 | 15 | 15 | 13 | 13 | 13 | 14 | 14 | 12 | 10 | ||||||||||||||||||||||||||||||
| General and administrative |
13 | 11 | 8 | 8 | 10 | 10 | 12 | 13 | 12 | 9 | ||||||||||||||||||||||||||||||
|
|
|
|
|
|
|
|
|
|
|
|
|
|
|
|
|
|
|
|
|
|||||||||||||||||||||
| Total operating expense |
77 | 72 | 70 | 71 | 70 | 72 | 75 | 71 | 68 | 56 | ||||||||||||||||||||||||||||||
|
|
|
|
|
|
|
|
|
|
|
|
|
|
|
|
|
|
|
|
|
|||||||||||||||||||||
| Income (loss) from operations |
(14 | ) | (8 | ) | (4 | ) | (8 | ) | (2 | ) | (7 | ) | (8 | ) | (4 | ) | 1 | 14 | ||||||||||||||||||||||
| Other income (expense): |
||||||||||||||||||||||||||||||||||||||||
| Interest expense |
— | — | (1 | ) | (1 | ) | (1 | ) | (2 | ) | (2 | ) | (2 | ) | (2 | ) | (1 | ) | ||||||||||||||||||||||
| Interest income |
— | — | — | — | — | — | — | — | — | — | ||||||||||||||||||||||||||||||
| Other income (expense) |
— | 1 | (1 | ) | — | — | 1 | (2 | ) | — | — | — | ||||||||||||||||||||||||||||
|
|
|
|
|
|
|
|
|
|
|
|
|
|
|
|
|
|
|
|
|
|||||||||||||||||||||
| Income (loss) before provision for income taxes |
(14 | ) | (7 | ) | (6 | ) | (9 | ) | (3 | ) | (8 | ) | (11 | ) | (7 | ) | — | 13 | ||||||||||||||||||||||
| Provision for income taxes |
— | — | — | — | — | — | — | — | — | — | ||||||||||||||||||||||||||||||
|
|
|
|
|
|
|
|
|
|
|
|
|
|
|
|
|
|
|
|
|
|||||||||||||||||||||
| Net income (loss) |
(14 | )% | (7 | )% | (6 | )% | (9 | )% | (3 | )% | (8 | )% | (11 | )% | (7 | )% | — | % | 12 | % | ||||||||||||||||||||
|
|
|
|
|
|
|
|
|
|
|
|
|
|
|
|
|
|
|
|
|
|||||||||||||||||||||
| (1) | Certain items may not foot due to rounding. |
60
Table of Contents
The following table presents our key operating and financial metrics for the periods presented (unaudited):
| Three Months Ended,(1) | ||||||||||||||||||||||||||||||||||||||||
| March 31, 2011 |
June 30, 2011 |
September 30, 2011 |
December 31, 2011 |
March 31, 2012 |
June 30, 2012 |
September 30, 2012 |
December 31, 2012 |
March 31, 2013 |
June 30, 2013 |
|||||||||||||||||||||||||||||||
| Other Financial and Operational Data:(1) |
||||||||||||||||||||||||||||||||||||||||
| Gross Sending Volume (in thousands) |
$ | 301,726 | $ | 371,978 | $ | 450,183 | $ | 582,772 | $ | 646,041 | $ | 884,357 | $ | 777,905 | $ | 940,154 | $ | 1,055,847 | $ | 1,606,584 | ||||||||||||||||||||
| Transactions |
816,000 | 955,000 | 1,051,000 | 1,246,000 | 1,354,000 | 1,648,000 | 1,680,000 | 1,935,000 | 2,039,000 | 2,582,000 | ||||||||||||||||||||||||||||||
| Active Customers |
399,365 | 425,581 | 458,604 | 516,597 | 576,446 | 658,233 | 718,064 | 776,426 | 841,819 | 919,610 | ||||||||||||||||||||||||||||||
| New Customers |
62,776 | 65,370 | 69,351 | 94,035 | 92,316 | 116,100 | 94,043 | 102,845 | 109,631 | 134,899 | ||||||||||||||||||||||||||||||
| Cost Per Acquisition of a New Customer |
$ | 34 | $ | 37 | $ | 37 | $ | 42 | $ | 40 | $ | 45 | $ | 50 | $ | 41 | $ | 40 | $ | 44 | ||||||||||||||||||||
| Adjusted EBITDA (in thousands) |
$ | (1,075 | ) | $ | (435 | ) | $ | (286 | ) | $ | (736 | ) | $ | 420 | $ | (345 | ) | $ | (828 | ) | $ | 260 | $ | 1,574 | $ | 6,149 | ||||||||||||||
| (1) | For information on how we define these operational and financial metrics see “—Key Metrics.” |
| Three Months Ended, | ||||||||||||||||||||||||||||||||||||||||
| March 31, 2011 |
June 30, 2011 |
September 30, 2011 |
December 31, 2011 |
March 31, 2012 |
June 30, 2012 |
September 30, 2012 |
December 31, 2012 |
March 31, 2013 |
June 30, 2013 |
|||||||||||||||||||||||||||||||
| (in thousands) | ||||||||||||||||||||||||||||||||||||||||
| (unaudited) | ||||||||||||||||||||||||||||||||||||||||
| Reconciliation of Adjusted EBITDA: |
||||||||||||||||||||||||||||||||||||||||
| Net income (loss) |
$ | (1,404 | ) | $ | (823 | ) | $ | (767 | ) | $ | (1,378 | ) | $ | (494 | ) | $ | (1,612 | ) | $ | (2,275 | ) | $ | (1,473 | ) | $ | (79 | ) | $ | 4,090 | |||||||||||
| Provision for income taxes |
2 | — | — | — | 2 | — | — | — | 2 | 132 | ||||||||||||||||||||||||||||||
| Interest expense |
34 | 39 | 96 | 201 | 247 | 355 | 387 | 515 | 447 | 499 | ||||||||||||||||||||||||||||||
| Interest income |
(6 | ) | (5 | ) | (5 | ) | (13 | ) | (21 | ) | (23 | ) | (23 | ) | (18 | ) | (36 | ) | (41 | ) | ||||||||||||||||||||
| Depreciation and amortization |
99 | 108 | 140 | 201 | 262 | 351 | 379 | 503 | 462 | 510 | ||||||||||||||||||||||||||||||
| Stock-based compensation |
200 | 246 | 250 | 253 | 424 | 584 | 704 | 733 | 778 | 959 | ||||||||||||||||||||||||||||||
|
|
|
|
|
|
|
|
|
|
|
|
|
|
|
|
|
|
|
|
|
|||||||||||||||||||||
| Adjusted EBITDA |
$ | (1,075 | ) | $ | (435 | ) | $ | (286 | ) | $ | (736 | ) | $ | 420 | $ | (345 | ) | $ | (828 | ) | $ | 260 | $ | 1,574 | $ | 6,149 | ||||||||||||||
|
|
|
|
|
|
|
|
|
|
|
|
|
|
|
|
|
|
|
|
|
|||||||||||||||||||||
With the exception of the three months ended September 30, 2012, we have experienced sequential revenue growth in all periods presented as a result of attracting new customers and retaining our active customers. The sequential decline in revenue in the three months ended September 30, 2012 was due to the increased activity we experienced during the three months ended June 30, 2012. We experience some seasonal trends in our business. Generally, revenue in our second and fourth quarters is stronger due to Mother’s Day and Christmas when we tend to have an increased rate of activity from our active customers. In addition, some of our customers transact more depending on the value of the local currency relative to the U.S. dollar. We see this trend most clearly among our Indian customers, a subset of which is highly influenced by the value, or the perceived value, of the Indian rupee relative to the U.S. dollar. For example, we saw an increase in activity in the three months ended June 30, 2012 due to a weakening Indian rupee, or the perception of a weakening Indian rupee. Conversely, during the three months ended September 30, 2012 we saw a decrease in activity to India due to a strengthening Indian rupee, or the perception of a strengthening Indian rupee. We believe our business may become more seasonal in the future in terms of absolute dollars.
Our cost of revenue has increased in absolute dollars but has remained generally flat as a percentage of revenue. Our operating expenses have increased in absolute dollars as we continue to invest in service innovation and technology by hiring additional employees, and we continue to introduce new marketing programs to increase brand awareness. We continue to look for innovative and efficient marketing efforts and anticipate our marketing expense will vary from period to period due to the timing of when the programs occur. Marketing will continue to be our largest operating expense as a percentage of revenue as we seek to attract new customers.
Liquidity and Capital Resources
Since inception, we have financed our operations and capital expenditures through the sale of preferred stock and common stock and, to a lesser extent, from borrowings. Our principal uses of cash are funding our operations and capital expenditures.
61
Table of Contents
As of June 30, 2013, we had cash, cash equivalents, disbursement prefunding and short-term investments of $166.9 million, which consisted of cash, money market funds, U.S. government securities, commercial paper, certificates of deposit, corporate bonds and prefunded balances with some of our disbursement partners. All of our cash equivalents and short-term investments are held at U.S. financial institutions.
The following table summarizes our cash and cash equivalents and disbursement prefunding as of the dates presented (in millions):
| December 31, | June
30, 2013 |
|||||||||||
| 2011 | 2012 | |||||||||||
| (unaudited) | ||||||||||||
| Domestic institutions |
$ | 27.2 | $ | 26.7 | $ | 56.3 | ||||||
| Foreign institutions |
30.1 | 33.4 | 49.0 | |||||||||
We hold cash at foreign financial institutions in order to prefund our disbursement partners. Our policy is generally to have relationships with multiple foreign institutions in each of our major markets so that our institutional risk is diversified. For example, we hold balances in the Philippines at eight different institutions. In India, all of our balances are held at one institution, Punjab National Bank, which is a large, state-owned bank. We generally review financial statements of our disbursement partners before commencing a business relationship with them, and annually thereafter, though such reviews may not mitigate all risk of loss. Certain of our balances in domestic and all of our balances in foreign institutions are uninsured. Our institutional losses of pre-funded balances have totaled less than $150,000 since our inception.
We experience significant day-to-day fluctuations in our cash and cash equivalents, disbursement prefunding and line of credit balances. These fluctuations are primarily due to:
| • | Fluctuations in daily GSV. As daily GSV increases, our cash and cash equivalents and disbursement prefunding amounts will increase, and we may draw down on our line of credit to fund the increased activity. Typically our cash, cash equivalents and disbursement prefunding balances at period end represent one to four days of disbursements to be made in the subsequent period; and |
| • | Timing of period end. For periods that end on a weekend or a bank holiday, our cash and cash equivalents and prefunding amounts typically will be more than for periods ending on a weekday as we fund these balances five days a week, but we disburse funds seven days a week. |
If a period ends on a weekend or holiday, our cash, cash equivalents and disbursement prefunding is generally higher than if the period ends on a business day, because we will then prefund our disbursement partners for the entire weekend or through the holiday instead of for one business day. As a result, we would need to draw down on our line of credit discussed below under “—Our Indebtedness,” which would increase our cash, cash equivalents and disbursement prefunding balances.
We believe that our existing cash and cash equivalents, cash flow from operations, availability under our line of credit and the net proceeds we expect to receive from this offering will be sufficient to meet our working capital needs and planned capital expenditures for at least the next 12 months. From time to time, we may explore additional financing sources which could include equity, equity-linked and debt financing arrangements. We cannot assure you that any additional financing will be available to us on acceptable terms or at all.
Our Indebtedness
In October 2009, we entered into a line of credit agreement, or the Loan Agreement, with Silicon Valley Bank, or SVB, which was amended in September 2012 to add a second lender and increase the available borrowing amount. The Loan Agreement allows for borrowings up to $80.0 million, bearing interest at the greater of prime plus 1.25% or 4.50%. The line of credit is scheduled to mature on September 19, 2014, at which time all outstanding borrowings would be due and payable. As part of the line of credit, we had a $10.0 million
62
Table of Contents
standby letter of credit which increased to $15.0 million in May 2013. At June 30, 2013, we had $16.0 million available under our line of credit, reflecting $49.0 million outstanding under the line of credit and $15.0 million reserved under the standby letter of credit. We were in compliance with all of our debt covenants as of June 30, 2013. We further amended our line of credit in August 2013 to increase the available borrowing amount temporarily from $80.0 million to $100.0 million until December 31, 2013.
Cash Flows
We typically prefund our disbursement partners on each business day which allows the funds to be made available to our disbursement partners seconds or minutes after a customer’s transaction is processed. Our prefunding estimates are based on historical experiences with our customers and disbursement partners, which vary depending on factors such as seasonality, the timing of bank holidays, weekends and paydays. These estimates incorporate assumptions surrounding the timing in which the customer funds receivables are settled and the customer liabilities are paid out. We often utilize our line of credit to satisfy short-term capital requirements over weekends or during bank holiday periods or high volume sending periods. We typically pay down the outstanding amount on the line of credit the first business day after the weekend or bank holiday period. Given these factors, we believe it is useful to review our cash flow in the aggregate to better understand the short-term flow of funds which can vary greatly depending on the timing of a weekend or bank holiday.
The following table summarizes our cash flows for the years and interim periods presented:
| Year Ended December 31, | Six Months Ended June 30, | |||||||||||||||||||
| 2010 | 2011 | 2012 | 2012 | 2013 | ||||||||||||||||
| (in thousands) |
||||||||||||||||||||
| (unaudited) | ||||||||||||||||||||
| Net cash used in operating activities |
$ | (8,312 | ) | $ | (12,060 | ) | $ | (750 | ) | $ | (8,915 | ) | $ | (13,266 | ) | |||||
| Net cash used in investing activities |
(12,387 | ) | (10,274 | ) | (16,061 | ) | (11,994 | ) | (38,696 | ) | ||||||||||
| Net cash provided by financing activities |
19,543 | 49,888 | 13,640 | 11,542 | 97,957 | |||||||||||||||
Operating Activities
Our use of cash for the six months ended June 30, 2013 was attributable to changes in our working capital of $20.5 million, partially offset by $4.0 million of our net income and $3.2 million in adjustments for non-cash items. Adjustments for non-cash items primarily consisted of stock-based compensation, depreciation and amortization expense and accretion of discounts and premiums on short-term investments. The use of cash resulting from changes in our working capital primarily consisted of an increase in customer funds receivable of $38.1 million relating to the timing of transactions in process, partially offset by an increase in customer liabilities of $15.1 million related to money that had not yet been disbursed. The significant increase in customer funds receivable and customer liabilities was due to the quarter ending on a weekend, rather than on a Monday which was the case at December 31, 2012.
Our use of cash for the six months ended June 30, 2012 was attributable to changes in our working capital of $8.7 million and our net loss of $2.1 million, partially offset by $1.9 million in adjustments for non-cash items. Adjustments for non-cash items primarily consisted of stock-based compensation, depreciation and amortization expense and accretion of discounts and premiums on short-term investments. The use of cash resulting from changes in our working capital primarily consisted of an increase in customer funds receivable of $12.0 million relating to the timing of transactions in process, partially offset by an increase in customer liabilities of $5.2 million related to money that had not yet been disbursed.
Our use of cash for 2012 was attributable to our net loss of $5.9 million partially offset by $4.5 million in adjustments for non-cash items and changes in our working capital of $0.6 million. Adjustments for non-cash items primarily consisted of stock-based compensation, depreciation and amortization expense and discounts and premiums on marketable securities. The decrease in cash resulting from changes in our working capital primarily consisted of a decrease in customer funds receivable of $7.9 million relating to the timing of transactions in process, partially offset by an increase in disbursement prefunding of $6.1 million related to money that had not yet been disbursed.
63
Table of Contents
Our use of cash for 2011 was attributable to changes in our working capital of $9.5 million and our net loss of $4.4 million, partially offset by $1.8 million in adjustments for non-cash items. Adjustments for non-cash items primarily consisted of stock-based compensation, depreciation and discounts and premiums on short-term investments. The decrease in cash resulting from changes in our working capital primarily consisted of an increase in customer funds receivable of $13.0 million relating to the timing of transactions in process, partially offset by an increase in customer liabilities of $4.1 million related to money that had not yet been disbursed.
Our use of cash for 2010 was attributable to our net loss of $6.0 million and to changes in our working capital of $3.5 million, partially offset by $1.2 million in adjustments for non-cash items. Adjustments for non-cash item primarily consisted of stock-based compensation, depreciation and amortization expense and discounts and premiums on short-term investments. The decrease in cash resulting from changes in our working capital primarily consisted of an increase in customer funds receivable of $3.0 million relating to the timing of transactions.
Investing Activities
Our primary investing activities have consisted of purchases, sales and maturities of short-term investments, purchases of property, equipment and software and changes in our restricted cash. Purchases of property and equipment may vary from period to period due to the timing of the expansion of our operations and website and internal-use software development. We expect to continue to invest in property and equipment and development of software during 2013 and thereafter.
We used $36.9 million and $3.2 million in six months ended June 30, 2013 and 2012, respectively, in net purchases of short-term investments. We used $10.5 million, $8.4 million and $5.2 million in 2010, 2011 and 2012, respectively, in net purchases of short-term investments.
We used $0.8 million and $1.8 million for purchases of property, equipment and development of software in the six months ended June 30, 2013 and 2012, respectively. We used $0.9 million, $1.7 million and $3.2 million for purchases of property, equipment and the development of software in 2010, 2011 and 2012, respectively.
In addition, we had an increase in our restricted cash of $1.0 million and $0.2 million during 2010 and 2011 due to higher collateral requirements under our license to disburse funds in India due to our increased sending volume to India. Our restricted cash increased $1.0 million during the six months ended June 30, 2013 for the same reason. During the six months ended June 30, 2012, we integrated a new ACH payment processor and increased our GSV with an existing ACH payment processor, which required us to restrict an additional $7.0 million of our cash as collateral.
Financing Activities
Our financing activities have primarily consisted of net proceeds from the issuance of preferred stock and common stock and exercise of preferred stock warrants and common stock options and repayments and borrowings under our line of credit.
Cash provided by financing activities was $98.0 million in the six months ended June 30, 2013 primarily due to the $88.4 million net proceeds from our IPO of common stock and net borrowings of $9.0 million under our line of credit.
Cash provided by financing activities was $11.5 million in the six months ended June 30, 2012 consisting primarily of net borrowings of $11.5 million under our line of credit.
Cash provided by financing activities in 2012 was $13.6 million consisting primarily of net borrowings of $13.5 million on our line of credit.
64
Table of Contents
Cash provided by financing activities in 2011 was $49.9 million consisting of $25.0 million of net proceeds from the issuance of 2.2 million shares of our Series F preferred stock and $24.8 million of net borrowing under our line of credit.
Cash provided by financing activities in 2010 was $19.5 million consisting primarily of net proceeds of $17.5 million from the issuance of 1.6 million shares of our Series F preferred stock.
Off-Balance Sheet Arrangements
As described in “—Our Indebtedness” above, SVB issued a standby letter of credit which satisfies the additional collateral requirement to maintain our subsidiary’s license to operate in India. As of June 30, 2013 and December 31, 2012, we had $15.0 million and $10.0 million, respectively, reserved under our standby letter of credit.
Contractual Obligations and Commitments
The following table describes our contractual obligations as of June 30, 2013 (unaudited):
| Payments Due by Period | ||||||||||||||||
| Total | Less Than 1 Year |
1-3 Years |
4-5 Years |
|||||||||||||
| (in thousands) | ||||||||||||||||
| Line of credit |
$ | 49,000 | $ | 24,000 | $ | 25,000 | $ | — | ||||||||
| Operating lease obligations |
4,314 | 1,245 | 2,627 | 442 | ||||||||||||
The contractual obligations in the tables above are associated with agreements that are enforceable and legally binding. Obligations under contracts that we can cancel without a significant penalty are not included in the table above. We have no material long-term purchase obligations outstanding with any vendors or third parties.
For a description of our line of credit see “Our Indebtedness.”
We lease our office facilities for our corporate headquarters in San Francisco, California, under operating leases which expire in 2016. The terms of the lease agreements provide for rental payments on a graduated basis. We recognize rent expense on a straight-line basis over the lease periods. We do not have any material capital lease obligations and all of our property, equipment and software have been purchased with cash.
Critical Accounting Policies and Estimates
Our consolidated financial statements are prepared in accordance with GAAP. The preparation of these consolidated financial statements requires us to make estimates and assumptions that affect the reported amounts of assets, liabilities, revenue, expenses and related disclosures. We evaluate our estimates and assumptions on an ongoing basis. Our estimates are based on historical experience and various other assumptions that we believe to be reasonable under the circumstances. Our actual results could differ from these estimates.
We believe that the assumptions and estimates associated with our reserve for transaction losses, income taxes and stock-based compensation have the greatest potential impact on our consolidated financial statements. Therefore, we consider these to be our critical accounting policies and estimates. For further information on all of our significant accounting policies, please see Note 2 of the accompanying notes to our consolidated financial statements.
We are choosing to “opt out” of the extended transition period provided in Section 7(a)(2)(B) of the Securities Act for complying with new or revised accounting standards and, as a result, we will comply with new or revised accounting standards on the relevant dates on which adoption of such standards is required for non-emerging growth companies. Section 107 of the JOBS Act provides that our decision to opt out of the extended transition period for complying with new or revised accounting standards is irrevocable.
65
Table of Contents
Reserve for Transaction Losses
On a quarterly basis, the reserve for estimated transaction losses is calculated based on our historical trends and data specific to each reporting period. We review the actual transaction losses evidenced in prior quarters as a percent of GSV to determine a historical loss rate. We then apply the historical rate to the current period GSV as a basis for estimating future transaction losses. When necessary, we also provide a specific transaction loss reserve for specific risks identified in processing customer transactions. Recoveries are reflected as a reduction in the reserve for transaction losses when the recovery occurs. We evaluate the adequacy of the provision every reporting period and adjust the reserve accordingly. The following table summarizes our reserve for transaction losses for the following years and interim period (in thousands):
| Balance at Beginning of Period |
Additions to Expense |
Losses Incurred |
Balance at End of Period |
|||||||||||||
| December 31, 2010 |
$ | 1,084 | $ | 1,823 | $ | (2,611 | ) | $ | 296 | |||||||
| December 31, 2011 |
296 | 5,372 | (4,894 | ) | 774 | |||||||||||
| December 31, 2012 |
774 | 7,722 | (7,949 | ) | 547 | |||||||||||
| June 30, 2013 (unaudited) |
547 | 6,159 | (5,857 | ) | 849 | |||||||||||
Income Taxes
We use the asset and liability method to account for income taxes, which requires the recognition of deferred tax assets and liabilities for the expected future income tax consequences of events that have been recognized in our consolidated financial statements or tax returns. Deferred tax assets and liabilities are recognized based on temporary differences between the financial statement carrying amounts and the tax bases of assets and liabilities using enacted tax rates in effect in the years in which the temporary differences are expected to reverse. Valuation allowances are established for deferred tax assets to the extent of the likelihood that the deferred tax assets may not be realized.
We also provide reserves as necessary for uncertain tax positions taken on our tax filings. First, we determine if a tax position is more likely than not to be sustained upon audit solely based on technical merits, including resolution of related appeals or litigation processes, if any. Second, based on the largest amount of benefit, which is more likely than not to be realized on ultimate settlement, we recognize any such differences as a liability. We include in income tax expense any interest and penalties related to uncertain tax positions. For all years presented, there are no uncertain tax positions.
Stock-Based Compensation
Stock-based compensation is measured at the grant date based on the fair value of the award and is recognized as expense, net of estimated forfeitures, over the requisite service period, which is the vesting period of the respective award.
Determining the fair value of stock-based awards at the grant date requires judgment. We use the Black-Scholes option-pricing model to determine the fair value of stock options. The determination of the grant date fair value of options using an option-pricing model is affected by our estimated common stock fair value as well as assumptions regarding a number of other complex and subjective variables. These variables include the fair value of our common stock, our expected stock price volatility over the expected term of the options, stock option exercise and cancellation behaviors, risk-free interest rates and expected dividends, which are estimated as follows:
| • | Fair value of our common stock. Prior to our initial public offering in February 2013, we estimated the fair value of our common stock, as discussed in “Common Stock Valuations” below. |
| • | Expected Term. The expected term was estimated using the simplified method allowed under the authoritative guidance. |
66
Table of Contents
| • | Volatility. As we do not have a trading history for our common stock, the expected stock price volatility for our common stock was estimated by taking the average of the historical volatilities of an index fund and industry peers based on daily price observations over a period equivalent to the expected term of the stock option grants. We did not rely on implied volatilities of traded options in our industry peers’ common stock because the volume of activity was relatively low. We intend to continue to consistently apply this process using the same or similar public companies until a sufficient amount of historical information regarding the volatility of our own common stock share price becomes available. |
| • | Risk-free rate. The risk-free interest rate is based on the U.S. Treasury yield in effect at the time of the grant for zero-coupon U.S. Treasury notes with remaining terms similar to the expected term of the options. |
| • | Dividend yield. We have never declared or paid any cash dividends and do not presently plan to pay cash dividends in the foreseeable future. Consequently, we used an expected dividend yield of zero. |
If any of the assumptions used in the Black-Scholes model changes significantly, stock-based compensation for future awards may differ materially compared with the awards granted previously.
The following table presents the weighted-average assumptions used to estimate the fair value of options granted during the years presented:
| Year Ended December 31, | ||||||||||||
| 2010 | 2011 | 2012 | ||||||||||
| Expected term (in years) |
6.2 | 5.8 | 6.3 | |||||||||
| Risk-free interest rate |
2.90% | 1.73% | 1.26% | |||||||||
| Dividend yield |
None | None | None | |||||||||
| Volatility rate |
47% | 39% | 42% | |||||||||
Common Stock Valuations
Since the completion of our initial public offering in February 2013, we have determined the fair value of the common stock underlying our stock options based on the closing price of our common stock at the date of grant. Prior to the completion of our initial public offering, the fair value of the common stock underlying our stock options was determined by our board of directors, which intended all options granted to be exercisable at a price per share not less than the per share fair value of our common stock underlying those options on the date of grant. The valuations of our common stock were determined in accordance with the guidelines outlined in the American Institute of Certified Public Accountants Practice Aid, Valuation of Privately-Held-Company Equity Securities Issued as Compensation. The assumptions we used in the valuation model were based on future expectations combined with management judgment. In the absence of a public trading market, our board of directors, with input from management, exercised significant judgment and considered numerous objective and subjective factors to determine the fair value of our common stock as of the date of each option grant, including the following factors:
| • | independent third-party valuations of our common stock performed as of February 2011, December 2011, April 2012 and July 2012; |
| • | the prices, rights, preferences and privileges of our preferred stock relative to the common stock; |
| • | our operating and financial performance; |
| • | current business conditions and projections; |
| • | our stage of development; |
67
Table of Contents
| • | the likelihood of achieving a liquidity event for the shares of common stock underlying these stock options, such as an initial public offering or sale of our company, given prevailing market conditions; |
| • | any adjustment necessary to recognize a lack of marketability for our common stock; |
| • | the market performance of comparable publicly-traded money transfer and technology companies; and |
| • | the U.S. and global capital market conditions. |
In valuing our common stock, the board of directors determined the equity value of our business by taking a combination of the value indications under two valuation approaches, an income approach and a market approach.
The income approach estimates the fair value of a company based on the present value of the company’s future estimated cash flows and the residual value of the company beyond the forecast period. These future values are discounted to their present values to reflect the risks inherent in the company achieving these estimated cash flows. Significant inputs of the income approach (in addition to our estimated future cash flows themselves) include the long-term growth rate assumed in the residual value, discount rate, terminal value and normalized long-term operating margin. The terminal value was calculated to estimate our value beyond the forecast period by applying a multiple to the terminal year.
The market approach estimates the fair value of a company by applying market multiples of comparable publicly-traded companies in the same industry or similar lines of business. The market multiples are based on key metrics implied by the enterprise or acquisition values of comparable publicly-traded companies. Given our significant focus on investing in and growing our business, we primarily utilized the revenue multiple when performing our valuation assessment under the market approach. When considering which companies to include in our comparable industry peer companies, we focused on U.S.-based publicly-traded companies with businesses similar to ours. The selection of our comparable industry peer companies requires us to make judgments as to the comparability of these companies to us. We considered a number of factors including business description, business size, market share, revenue model, development stage and historical operating results. We then analyzed the business and financial profiles of the selected companies for relative similarities to us and, based on this assessment, we selected our comparable industry peer companies. Several of the comparable industry peer companies are our competitors and are generally larger than us in terms of total revenue and assets. We believe that the comparable industry peers selected are a representative group for purposes of performing contemporaneous valuations. The same comparable industry peers were also used in determining various other estimates and assumptions in our contemporaneous valuations.
For each valuation, the enterprise value determined by the income and market approach was then allocated to the common stock using either the Option Pricing Method, or OPM, or Probability Weighted Expected Return Method, or PWERM.
The OPM treats common stock and preferred stock as call options on an enterprise value, with exercise prices based on the liquidation preference of the preferred stock. Therefore, the common stock has value only if the funds available for distribution to the stockholders exceed the value of the liquidation preference at the time of a liquidity event such as a merger, sale or initial public offering, assuming the enterprise has funds available to make a liquidation preference meaningful and collectible by the stockholders. The common stock is modeled to be a call option with a claim on the enterprise at an exercise price equal to the remaining value immediately after the preferred stock is liquidated. The OPM uses the Black-Scholes option pricing model to price the call option. The OPM is appropriate to use when the range of possible future outcomes is so difficult to predict that forecasts would be highly speculative.
The PWERM involves a forward-looking analysis of the possible future outcomes of the enterprise. This method is particularly useful when discrete future outcomes can be predicted at a high confidence level with a probability distribution. Discrete future outcomes considered under the PWERM included non-initial public
68
Table of Contents
offering market based outcomes as well as initial public offering scenarios. In the non-initial public offering scenarios, a large portion of the equity value is allocated to the preferred stock to reflect the preferred stock liquidation preferences. In the initial public offering scenarios, the equity value is allocated pro rata among the shares of common stock and each series of preferred stock, which causes the common stock to have a higher relative value per share than under the non-initial public offering scenario. The fair value of the enterprise determined using the initial public offering and non-initial public offering scenarios was weighted according to the board of directors’ estimate of the probability of each scenario.
Over time, as certainty developed regarding possible discrete events, including an initial public offering, or IPO, the allocation methodology utilized to allocate our enterprise value to our common stock transitioned away from the OPM, which was utilized for grants through December 31, 2011, to PWERM, which we utilized for grants after December 31, 2011.
We granted stock options with the following terms between January 1, 2011 and the date of our IPO:
| Number of Options Granted |
Exercise Price Per Share |
Common Stock Fair Value Per Share at Grant Date |
Fair Value Per Option |
|||||||||||||
| Option Grant Dates: |
||||||||||||||||
| May 12, 2011 |
374,019 | $ | 4.48 | $ | 4.48 | $ | 1.72 | |||||||||
| July 15, 2011 |
116,250 | 4.48 | 4.48 | 1.72 | ||||||||||||
| September 15, 2011 |
263,750 | 4.48 | 4.48 | 1.84 | ||||||||||||
| January 18, 2012 |
335,571 | 6.84 | 6.84 | 2.88 | ||||||||||||
| March 8, 2012 |
27,500 | 6.84 | 6.84 | 2.84 | ||||||||||||
| March 22, 2012 |
1,280,750 | 6.84 | 6.84 | 2.96 | ||||||||||||
| May 24, 2012 |
358,750 | 12.72 | 12.72 | 5.20 | ||||||||||||
| August 1, 2012 |
478,750 | 14.12 | 14.12 | 5.80 | ||||||||||||
| November 12, 2012 |
66,250 | 14.12 | 14.12 | 6.00 | ||||||||||||
| December 7, 2012 |
31,250 | 14.12 | 14.12 | 6.08 | ||||||||||||
With the exception of 28,544 stock options that were granted to non-employees, all of the above grants were issued to employees and directors. All of the stock options were granted for providing services to us.
No single event caused the valuation of our common stock to increase or decrease from May 12, 2011 through December 7, 2012. Instead, a combination of the factors described below in each period led to the changes in the fair value of the underlying common stock.
May, July and September 2011 Awards
We granted 374,019 options on May 12, 2011, 116,250 options on July 15, 2011 and 263,750 options on September 15, 2011. Our board of directors set an exercise price of $4.48 per share for these options based in part on a valuation prepared as of February 28, 2011. The February 28, 2011 valuation was prepared on a minority, non-marketable basis assuming our business was in the expansion stage of development.
This valuation was developed using the income approach and market approach. For the income approach, a discounted cash flow analysis was developed based on our cash flow projections for the years ending December 31, 2011 through December 31, 2015. These estimated future cash flows were discounted using a weighted-average cost of capital, or WACC, of 20%. For the market approach, we analyzed the financial performance of three publicly-traded companies in the funds transfer industry.
Based on the processes described above, our board of directors determined that it had equal confidence in both the income and market approaches so it weighted them equally to determine an aggregate enterprise value.
69
Table of Contents
This enterprise value was then allocated to the common stock utilizing an OPM with the following assumptions: a time to a liquidity event of two years, risk-free rate of 0.69%, dividend yield of 0% and volatility of 50% over the time to a liquidity event. As a result, the fair value of our common stock, as determined by an OPM and after applying a marketability discount of 32%, was determined to be not less than $4.16 per share. However, our board of directors determined the fair market value to be $4.48 per share.
January and March 2012 Awards
We granted 335,571 options on January 18, 2012, 27,500 options on March 8, 2012 and 1,280,750 options on March 22, 2012. Our board of directors set an exercise price of $6.84 per share for these options based in part on a valuation prepared as of December 31, 2011. The December 31, 2011 valuation was prepared on a minority, non-marketable basis assuming our business was still in the expansion stage of development.
This valuation was developed using the income approach and market approach. For the income approach, the discounted cash flow analysis was developed based on our cash flow projections for the years ending December 31, 2011 through December 31, 2016. These estimated future cash flows were discounted using a WACC of 23%. For the market approach, the comparable peer companies remained consistent with the February 28, 2011 valuation.
This valuation was in part based upon the PWERM approach instead of an OPM approach as applied previously. At the time of this valuation, the range of discrete events, specifically IPO and non-IPO scenarios, were fairly well established; therefore, PWERM was utilized to estimate the fair value of our common stock during this period. The expected outcomes were weighted as follows: (1) 40% toward an IPO scenario; (2) 10% toward non-IPO scenarios such as a merger or acquisition; (3) 50% toward remaining a private company; and (4) 0% toward non-IPO scenarios such as dissolution. We determined the appropriateness of the weighting of the expected outcome of the IPO by considering factors such as the planning stage we were in regarding the IPO, as well as a discount for general market factors. For example, during the December 31, 2011 valuation timing, we had begun to meet with underwriters, but had not yet decided to move forward with the IPO process. The IPO value assumed an IPO in 18 months, plus a six-month lock-up period.
As a result, the fair value of our common stock, as determined by a PWERM and after applying a marketability discount of 32%, was determined to be $6.84 per share. The increase in the fair value from the February 28, 2011 valuation was primarily due to strong projected revenue growth and projected profit margins, and the reduction in the time to a liquidity event due to the passage of time.
May 2012 Awards
We granted 358,750 options on May 24, 2012. Our board of directors set an exercise price of $12.72 per share for these options based in part on a valuation prepared as of April 30, 2012. The April 30, 2012 valuation was prepared on a minority, non-marketable basis assuming our business was still in the expansion stage of development.
This valuation was developed using the income approach and market approach. For the income approach, the discounted cash flow analysis was developed based on our cash flow projections for the years ending December 31, 2012 through December 31, 2016. These estimated future cash flows were discounted using a WACC of 20%. For the market approach, we analyzed the financial performance of the same publicly-traded companies we had used in the February 28, 2011 and December 31, 2011 valuations, but also included seven additional peer companies in the consumer Internet industry in our analysis.
Similar to the December 31, 2011 valuation, the April 30, 2012 valuation used the PWERM approach to estimate the fair value of our common stock during this period. The expected outcomes were weighted as follows: (1) 50% toward an IPO scenario; (2) 10% toward non-IPO scenarios such as a merger or acquisition; (3) 40% toward remaining a private company; and (4) 0% toward non-IPO scenarios such as dissolution. We determined the appropriateness of the weighting of the expected outcome of the IPO by considering factors such
70
Table of Contents
as the planning stage we were in regarding the IPO as well as a discount for general market factors. For example, during the April 30, 2012 valuation timing, we were closer to formally choosing an underwriter, as well as believing the likelihood of an IPO had increased based on feedback from the various underwriters with whom we met. The IPO value assumed an IPO in 8 months, plus a six-month lock-up period.
As a result, the fair value of our common stock, as determined by a PWERM and after applying a marketability discount of 26%, was determined to be $12.72 per share. The increase in the fair value from the December 31, 2011 valuation was primarily due to the reduction in the time to a liquidity event due to the passage of time.
August, November and December 2012 Awards
We granted 478,750 options on August 1, 2012, 66,250 options on November 12, 2012 and 31,250 options on December 7, 2012. Our board of directors set an exercise price of $14.12 per share for these options based in part on a valuation prepared as of July 15, 2012. The July 15, 2012 valuation was prepared on a minority, non-marketable basis assuming our business was still in the expansion stage of development.
This valuation was developed using the income approach and market approach. For the income approach, the discounted cash flow analysis was developed based on our cash flow projections for the years ending December 31, 2012 through December 31, 2018. These estimated future cash flows were discounted using a WACC of 20%. For the market approach, we analyzed the financial performance of the same publicly-traded companies we had used in the April 30, 2012 valuation.
Similar to the April 30, 2012 valuation, we used the PWERM approach to estimate the fair value of our common stock during this period. The expected outcomes were weighted as follows: (1) 70% toward an IPO scenario; (2) 10% toward non-IPO scenarios such as a merger or acquisition; (3) 20% toward remaining a private company; and (4) 0% toward non-IPO scenarios such as dissolution. We determined the appropriateness of the weighting of the expected outcome of the IPO by considering factors such as the stage we were in regarding the IPO, as well as a discount for general market factors. For example, during the July 15, 2012 valuation timing, we had formally chosen underwriters and had confidentially submitted our Registration Statement on Form S-1 with the Securities and Exchange Commission. The IPO value assumed an IPO in 2 months, plus a six-month lock-up period.
As a result, the fair value of our common stock, as determined by a PWERM and after applying a marketability discount of 22%, was determined to be $14.12 per share.
Quantitative and Qualitative Disclosure about Market Risk
Interest Rate Fluctuation Risk
Our cash and cash equivalents and short-term investments consist of cash, money market funds, U.S. government securities, commercial paper, certificates of deposit and corporate bonds.
The primary objective of our investment activities is to preserve principal while maximizing income without significantly increasing risk. Because our cash and cash equivalents have a relatively short maturity, our portfolio’s fair value is relatively insensitive to interest rate changes. We determined that the nominal difference in basis points from potentially investing our cash and cash equivalents in longer-term investments did not warrant a change in our investment strategy. In future periods, we will continue to evaluate our investment policy in order to ensure that we continue to meet our overall objectives.
Any borrowings under our line of credit with SVB are at a variable rate and, as a result, increases in market interest rates would generally result in increased interest expense on our outstanding borrowings.
71
Table of Contents
Foreign Exchange Risk
We are exposed to foreign exchange risk as we offer our services in 30 countries and disburse our transactions in multiple foreign currencies. However, we believe that this risk is somewhat limited due to the fact that these transactions are usually disbursed in less than three business days. As of June 30, 2013 and December 31, 2012, we had not entered into any foreign exchange hedging contracts.
Inflation Risk
We do not believe that inflation has had a material effect on our business, financial condition or results of operations. If our costs were to become subject to significant inflationary pressures, we may not be able to fully offset such higher costs through fee increases.
Recently Issued and Adopted Accounting Pronouncements
In February 2013, the Financial Accounting Standards Board amended the authoritative guidance related to comprehensive income. This update requires companies to provide information about the amounts reclassified out of accumulated other comprehensive income by component. The update is effective for fiscal years and interim periods beginning after December 15, 2012. The adoption of this new standard does not currently have a material impact on our consolidated financial statements.
72
Table of Contents
Company Overview
Xoom is a pioneer and leader in the digital consumer-to-consumer international money transfer industry. Our customers use Xoom to send money to family and friends in 30 countries. Since January 1, 2008, our customers have used Xoom to send $9.2 billion, including $1.7 billion in 2011, $3.2 billion in 2012 and $2.7 billion in the six months ended June 30, 2013.
According to the World Bank, international consumer money transfer volume totaled $529 billion worldwide in 2012 and is forecasted to grow to approximately $665 billion by 2015, an 8% CAGR. The traditional global money transfer market is highly fragmented and is primarily based on antiquated technology, with the majority of offline money transfers relying on physical infrastructure. In contrast, our modern online and mobile platforms disrupt the traditional forms of money transfer and deliver our customers a convenient, fast and cost-effective way to send money.
Our typical customers left their home countries and moved to the United States to seek better employment opportunities and to support their family and friends back home. Our customers represent a broad range of professions and education levels, but share common traits in that they have bank accounts and actively use the Internet or mobile devices. Despite being far from home, they maintain close ties to their family and friends and have a strong sense of family duty and obligation. As a result, our customers regularly use Xoom to help their family and friends in their home countries afford basic, and sometimes dire, needs for food, shelter, healthcare and other critical, non-discretionary expenses.
At Xoom, we earn and maintain our customers’ trust by providing a high level of service through convenient, fast and cost-effective money transfers. Xoom’s money transfers are initiated online or through a mobile device and can be sent at any time, from any Internet-enabled location. Our service is accessible in multiple languages and new customers can sign up and submit their first transaction in an average of less than ten minutes. Repeat customers typically submit transfers in approximately one minute. Recipients receive money in the manner they prefer and to which they are individually or culturally accustomed, at major banks and leading retailers. Our disbursement options include direct deposit into recipient bank accounts in all countries we serve, cash pick-up at our disbursement partner locations in most countries we serve or home delivery of cash in the Dominican Republic and the Philippines.
We believe we process and complete money transfer transactions as fast as, or faster than, our competitors, and our customers and their recipients can track the status of all transactions in real time. This speed and transparency provide our customers and their recipients peace of mind, providing certainty in the status of their money at any point. Our business model allows us to provide our customers with cost-effective money transfers because we do not pay originating agent commissions and the majority of our transfers are funded directly from bank accounts, which lowers our cost of sales. Xoom proudly passes a significant portion of these savings on to our customers in the form of cost-effective fees.
Our ability to provide our customers with convenient, fast and cost-effective money transfers relies on our proprietary technology which, combined with our risk management capabilities and global disbursement network, constitute our operating platform. We have invested in developing our operating platform over the past ten years. Our technology enables easy-to-use online and mobile sender interfaces, effective risk management and seamless integration with our disbursement partners’ systems. Our risk management capabilities allow us to proactively balance a low-friction customer experience with effective loss mitigation and regulatory compliance. We have built extensive partnerships with major banks and leading retailers that form our global disbursement network across 30 countries and deliver a high quality of service through regionally recognized, trusted brands.
We believe we are changing the way consumers transfer money around the globe by changing their habits and preferences. The value proposition we offer our customers has allowed us to add over one million new customers since 2007. The quality of service afforded by our operating platform has driven customer loyalty,
73
Table of Contents
resulting in a meaningful increase in gross sending volume, or GSV. GSV increased from $137.3 million for 2007 to $4.4 billion for the last twelve months, representing an 88% CAGR. GSV increased from $25.7 million for the three months ended March 31, 2007 to $1.6 billion for the three months ended June 30, 2013.
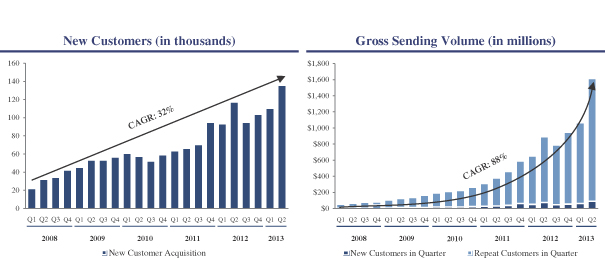
We generate revenue from transaction fees charged to customers, and from foreign exchange spreads on transactions where the payout currency is other than U.S. dollars. Service fees generally vary by country, type of funding source, disbursement currency and send amount, but do not vary by method of disbursement, how the transaction was initiated (via computer or mobile device) or the location of the customer. For example, the majority of our transactions sent to Mexico and the Philippines are funded from a bank account and are disbursed in local currency. For those transactions, the customer pays a flat fee of $4.99 to send any amount up to $2,999. Fees paid for debit and credit card-funded transactions to Mexico and the Philippines to be disbursed in local currency range from $4.99 to $75.99 depending on the amount sent and averaged $7.06 in the Philippines and $5.73 in Mexico per transaction for the six months ended June 30, 2013. In the Philippines, fees vary for transactions paid in U.S. dollars based on the amount sent and the funding source. These fees range from $7.99 to $65.99 and averaged $12.08 per transaction for the six months ended June 30, 2013. In India, we only offer bank deposit in local currency and over 99% of the transactions are funded from a bank account where the customer pays up to $4.99 to send up to $1,000 and is fee free if the amount sent is over $1,000. Fees for transactions sent to India averaged $1.01 per transaction for the six months ended June 30, 2013.
Our foreign exchange revenue is derived from the difference between our cost to buy local currency and the price at which we sell the currency, referred to as our foreign exchange spread. Our foreign exchange spread varies by country, but our spreads have typically ranged from approximately 1% to 3% of a transaction’s principal send amount. We believe our business model is often characterized by predictable and recurring revenue from our large and growing base of new and repeat customers. In addition, our business model yields attractive per unit economics; over a 36 month period we estimate that, for a customer acquired today for $44 in marketing expense, we will generate $285 revenue and $199 of gross profit.
We have achieved significant revenue growth as our customer base has expanded. From 2008 to 2012, our revenue increased from $14.1 million to $80.0 million, representing a 54% CAGR. Revenue increased from $38.0 million for the six months ended June 30, 2012 to $57.8 million for the six months ended June 30, 2013, a 52% increase. We incurred a net loss of $5.9 million in 2012 as we continued to invest in growing our revenue. We incurred a net loss of $2.1 million in the six months ended June 30, 2012 and generated net income of $4.0 million in the six months ended June 30, 2013. We have incurred a net loss primarily as a result of long-term investments in our service innovation, solutions and marketing programs to increase brand awareness.
A relatively limited number of countries, as determined based on location of the recipient of the funds disbursed, account for a large percentage of our total revenue. For 2011 and 2012, the Philippines accounted for
74
Table of Contents
approximately 42% and 35% of our revenue, respectively. For the six months ended June 30, 2013, India accounted for approximately 34% of our revenue. The top three countries, India, Mexico and the Philippines, in the aggregate represented approximately 71%, 74%, 74% and 77% of our revenue for 2011, 2012, and the six months ended June 30, 2012 and 2013, respectively.
Industry Overview
The market for global money transfer is large and growing. According to the World Bank’s Migration and Development Briefs, the worldwide remittance market grew at an 11% CAGR from $234 billion in 2004 to $529 billion in 2012. This market is expected to continue to grow to $665 billion by 2015, an 8% CAGR. The growth trend in this market has primarily been driven by increasing globalization of economies with cross-border movement of people and employees. Over 200 million people live outside their country of birth, with Asia and Latin America having the largest migrant pools. According to the World Bank Migration & Remittance Factbook 2011, the United States continues to be the top destination for the immigrant population, with over 40 million immigrants living in the United States in 2010. Immigrants accounted for 13% of the U.S. population in 2010, up from 11% in 2000, according to the U.S. Census Bureau. Immigrants continue to send money to their family and friends in their home countries and represent the significant majority of worldwide remittances. Developing countries largely remain the top recipients of global remittances. The top four remittance-receiving countries – India, China, the Philippines and Mexico – collectively received an estimated annual volume of over $177 billion in 2012 according to the World Bank. The United States continues to be the top remittance-sending country with an estimated $123 billion of outbound remittance in 2012 according to the World Bank’s Bilateral Remittance Matrix, of which approximately $75 billion was sent to countries that Xoom serves.
Traditionally, the global money transfer market has been highly fragmented. It is served by a few large players, many small regional players, traditional banks and informal person-to-person money transfer providers that evade regulation. The large industry players primarily service senders who fund with cash, which requires maintaining an extensive network of agents in the United States and the associated physical infrastructure. This model also requires significant infrastructure in receiving locations. Growth in transaction volume has typically been driven by adding more agent locations across the globe. This antiquated model of predominantly cash-to-cash money transfer has not evolved meaningfully in more than 100 years. The traditional model has been plagued by one or more of the following problems: slow transaction processing; non-transparent fees; opaque exchange rates and an inconvenient offline money transfer experience, including limited store hours, long wait times, complicated manual forms and sometimes unsafe locations. We believe these factors have led to customer frustration given the lack of a convenient, fast and cost-effective way to send money to family and friends.
With the widespread adoption of online and mobile channels and a steady increase in the proportion of the banked population among the foreign-born community in the United States, we believe there is a significant opportunity to disrupt the traditional forms of money transfer. According to the International Telecommunications Union, a United Nations agency, Internet penetration in the United States continues to grow and reached 81% in 2012. According to the Internet marketing research firm eMarketer, 50% of mobile phone users in the United States had a smartphone in 2012, compared to 39% in 2011. In addition, a 2011 FDIC survey estimated that approximately 93% of U.S.-born households, 95% of foreign-born citizens in the United States and 78% of foreign-born non-citizens residing in the United States had a bank account. The confluence of these online, mobile and banking penetration trends provides a significant opportunity to disrupt the traditional forms of money transfer and deliver a convenient, fast and cost-effective way to send money. In addition, electronic origination of funds is materially less expensive than an agent and physical infrastructure-based origination model.
75
Table of Contents
Our Solutions
Our solutions are designed to offer customers a convenient, fast and cost-effective way to send money to family and friends at any time, from any Internet-enabled location. Our operating platform allows us to provide innovative solutions to the challenge of transferring funds internationally, as described below.
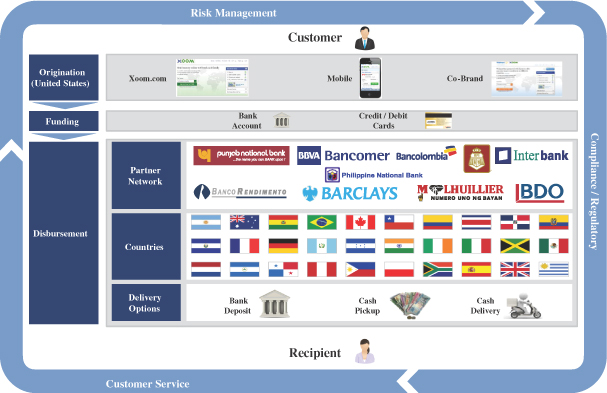
Origination. All Xoom money transfers originate online, without the costs or inconvenience of initiating a transaction at a physical agent location or bank. Our money transfer services are available over the Internet or through a mobile device on our website at www.xoom.com, our co-branded website with Walmart.com or through our new mobile application.
Funding. Our customers have the option to fund a money transfer with a U.S.-based bank account, credit card or debit card. We do not have originating agents who accept cash. As a result, we do not incur the costs or commissions associated with physical agent-based origination and funding. Over 90% of our GSV is funded by bank accounts through the Automated Clearinghouse system, or ACH. ACH transactions are less expensive to fund than credit or debit card transactions as ACH does not include variable fees associated with these transactions. We are able to pass these cost savings directly to our customers in the form of cost-effective and often fixed fees. We instantly process over 95% of our ACH-funded transactions in order to expedite disbursement by our partners, which we refer to as instant ACH. We receive settlement from our payment processors for our customers’ funds within one to two business days, though we are typically exposed to the risk of reversals for up to four business days. Reasons for reversals include “bounced checks,” invalid accounts, fraud and other losses, but we are able to minimize the risks and potential losses based on our proprietary risk management system, which is discussed in more detail below. For reversals due to criminal fraud, we generally have little recourse. For reversals due to bounced checks or invalid account numbers, we are often successful at contacting the customer and receiving reimbursement. The combination of factors above enable us to provide a convenient, fast and cost-effective service, which we believe our competitors are unable to match.
76
Table of Contents
Disbursement. Our customers can transfer money from the United States to 30 countries, including many major recipient countries, such as India, Mexico and the Philippines. Recipients accept money in the manner they prefer and to which they are individually or culturally accustomed. Xoom’s disbursement options include direct deposit into a recipient’s bank account in all countries we serve, cash pick-up at our disbursement partner locations in most countries we serve or home delivery of cash in the Dominican Republic and the Philippines. Direct deposit recipients enjoy fast deposits made possible through the direct integration of Xoom’s platform with each of its bank-to-bank partners. Cash pick-up provides recipients, particularly those who do not have a bank account, with the convenience of picking cash up at retail outlets and banks generally within seconds or minutes. With home delivery, recipients can enjoy the convenience of receiving cash directly at their doorstep.
These convenient options are made available through established partnerships with major banks and leading retailers that form our global disbursement network. We carefully choose our partners based on recipient preference, quality of service, brand recognition, fee structure and co-branding opportunities. The quality of our disbursement partners makes us a trusted source of money transfer because customers are typically already familiar with their chosen disbursement partner and recipients feel comfortable receiving money where they regularly bank or shop. For example, our partnership with Punjab National Bank in India allows us to deposit funds into accounts at most banks in India. We offer bank deposit to any bank account in the United Kingdom in less than an hour through our partnership with Barclays. In the Philippines, our partnerships with the country’s largest banks, BDO Unibank, Inc., Bank of the Philippine Islands, Metrobank and Philippine National Bank, and leading retailers such as Cebuana Lhuillier Services Corporation and M.J. Lhuillier Financial Services Inc., allow us to provide bank deposit, cash pick-up at over 14,000 convenient locations, and home delivery. We offer deposit to most banks in Mexico, and, to facilitate cash pick-up, we have established a network of over 11,000 cash pick-up locations through partnerships with leading banks such as BBVA Bancomer, S.A., through its relationship with Bancomer Transfer Services, Inc., and retailers such as Elektra and Soriana. In other Latin American countries, we have established partnerships with many of the leading banks including Bancolombia in Colombia; Itau Unibanco in Brazil; Banco de Crédito BCP, Interbank and Scotiabank Peru in Peru; and BAC and Citi Remesas Inc. in Central America.
We provide funds to our disbursement partners in two ways. One way is to “post-fund” a transaction, which means that we reimburse our disbursement partner after it has disbursed money to the recipients. We currently only have one disbursement partner utilizing post-funding. For the remainder of our disbursement partners, we “prefund” transactions, meaning that we provide them with funds prior to their disbursing money to the recipients. In order to prefund transactions, we generally deposit funds into a disbursement partner’s prefunding account each business day. Each disbursement partner then debits the appropriate prefunding account as transactions are disbursed. If the prefunding account balance is insufficient to cover the disbursements, the disbursement partner may halt disbursements until additional funding is deposited into the prefunding account.
Transaction Processing. Throughout the entire money transfer process, we provide a high level of risk management, compliance and regulatory oversight and customer service. Our operating platform is built to track each of these requirements. From the inception of a transaction, our platform enables us to quickly and seamlessly assess the transaction’s risk profile without introducing undue friction into the customer experience. We have built our technology to test each transaction for compliance, anti-money laundering, acceptable use, anti-fraud and funding risk within seconds. We also have 24/7 expert human oversight to monitor transaction traffic and identify and mitigate risks as they develop. Additionally, our multi-lingual customer service operations provide 24/7 support for both our customers and disbursement partners. Online and telephone support addresses customer inquiries, real-time transaction status updates, technical issue resolution, social media support, information verification, collections, internal processing monitoring and complaint resolution. We believe our strong risk management, combined with our high level of customer service, is reflected in our consistently low transaction loss rates and compelling value proposition. Our transaction loss rates have been 35 basis points or lower as a percentage of GSV on an annual basis since 2010.
77
Table of Contents
Our Competitive Strengths
The majority of our employees are from first or second generation immigrant families and personally understand the importance and impact of our service on our customer base. Our first-hand knowledge of our customers’ needs enhances our ability to innovate and design solutions that solve their challenges. This customer-centric culture and mission-driven approach permeates our organization, defines the fabric of our company and drives our focus on serving our customers. We believe we have the following competitive strengths:
Compelling Value Proposition. We provide significant value to our customers through a unique combination of convenience, speed and cost-effective pricing of our services. Our customers use Xoom to send money to their family and friends in 30 countries at any time, from any Internet-enabled location, either online or from a mobile device, in multiple languages. They also benefit from a safe and easy money transfer experience that requires four or fewer steps. Our operating platform offers superior speed of disbursement by making funds available to recipients within minutes for many of our transactions, while our real-time tracking on all transactions provides peace of mind to our customers and their recipients. Our business model innovations result in cost advantages that benefit our customers in the form of cost-effective fees. Importantly, we also provide transparency to our customers with simple fees and locked-in foreign exchange rates. As a result, our customers clearly understand the fee they will pay and the exact amount their recipients will receive before submitting a transaction. In general, we purchase each foreign currency one or more times each business day, and we set our foreign exchange rates for our customers using historical customer transaction data and our quantitative models built over several years to balance internal target spreads of 1% to 3% with competitive pricing. For example, if we purchased 4,200,000 Philippine pesos for 100,000 U.S. dollars, our cost would be 42.00 pesos to one U.S. dollar. Assuming a spread of 2% would result in a competitive price, we would then set the customer foreign exchange rate at 41.16.
Proprietary Risk Management System. Our proprietary risk management system serves as the backbone of our technology platform, balancing a low-friction customer experience with low transaction loss rates, which have been 35 basis points or lower as a percentage of GSV on an annual basis since 2010. This system has been developed from the ground up and refined over ten years through continuous innovation and a relentless dedication to provide the best experience to our customers. Our platform is highly scalable to meet future growth and is flexible and agile, enabling us to provide real-time responses to new fraud risks and regulatory changes that may develop. We continue to invest in our risk management capabilities including 24/7 expert human oversight to monitor transaction traffic and to spot evolving risks.
Online Origination Affords Valuable Customer Insight. Traditional money transfer providers generally require senders to bring cash to a physical agent location to originate a transfer. Such transactions provide little insight into repeat sender behavior and limit the money transfer provider’s ability to develop a deeper customer relationship over time. In contrast, our customers initiate money transfers online or through mobile devices on www.xoom.com or through our new mobile application and usually connect their bank accounts, creating a body of digital, transaction-related data that affords us deep insight into repeat customer behavior, including their expected funding methods, transfer frequency and disbursement preferences. This data provides us with revenue visibility as we can more accurately predict how frequently new customers will transfer money using Xoom in the future. As a result, we can quantify the value of new customers over a defined period of time and continually compare and contrast that value against the marketing expenses to acquire new customers. In addition, this data allows us to refine our service to increase conversion of site visitors to customers and continually improve the retention rate of existing customers. More importantly, we can continually improve the overall customer experience by making our customers’ money transfers easier to fund, faster to transfer and disburse, and more convenient for our customers’ friends and families to collect.
Marketing Expertise. We believe our marketing expertise provides us with a competitive advantage in attracting new customers to Xoom. Our marketing campaigns drive awareness, consideration and trial of our service and increase existing customer retention and usage. These campaigns include advertising on television
78
Table of Contents
stations and websites popular with, and frequented by, immigrant communities and ongoing incentive trial campaigns where we provide rewards to customers for trying our service. We believe our marketing expertise is a competitive strength because it enables us to directly market to our diverse customer base and make marketing impressions with a high frequency and at a relatively low cost per impression. The fact that our customers create Xoom accounts and originate transfers online enables us to directly attribute new customers and their subsequent money transfers to specific marketing campaigns and optimize future marketing investment.
Established Global Disbursement Capabilities. We believe our global disbursement network with major banks and leading retailers represents a significant competitive advantage. Assembled relationship by relationship over more than ten years, our network is comprised of trusted local brands who offer high-quality service. Our target customers generally recognize these brands, enabling us to more effectively acquire new customers through co-branded marketing campaigns in the United States. As the number of customers and recipients on our platform increases, we provide greater value to our disbursement network partners. This allows us to further expand and develop our disbursement network, which in turn affords more co-branded marketing opportunities, attracting more customers to Xoom. We believe this represents a network effect in our business model that will create value as our business continues to scale. In addition, we work extensively to integrate the Xoom operating platform with our partners to enable the quality and speed of service that we believe is often unique to Xoom. We believe our speed of deposit is superior to that of our competitors and that our cash pick-up service matches or surpasses those of other leading money transfer service providers wherever cash pick-up is relevant. We believe it would be difficult for a new competitor to replicate the breadth and quality of service our disbursement network provides.
Efficient Regulatory Compliance. We have designed our technology platform to operate efficiently in a highly complex and continuously evolving regulatory environment. Executing an effective compliance program while minimizing customer friction is challenging. Our technology and compliance expertise enable a low-friction customer experience in a highly-regulated environment, which new market entrants would likely find difficult to replicate. Acquiring the federal, state and international regulatory approvals necessary to operate as a money transmitter is a time-consuming and capital-intensive process. We have spent significant time and resources developing our regulatory compliance program and fostering positive relations with the licensing authorities in the jurisdictions in which we operate.
Our Growth Strategy
Our growth strategy is focused primarily on attracting and retaining customers in the markets we currently serve as well as broadening our partnerships, expanding into new international markets and developing services in adjacent markets. We intend to aggressively grow our business through the following strategies:
Attract and Retain Customers in the Markets We Currently Serve
| • | Optimize Marketing Investment. Our customers tend to behave predictably, and we are therefore able to increase and optimize our marketing investment to acquire new customers at a cost that is a fraction of their estimated lifetime values. We will continue to selectively invest more in targeted marketing campaigns to acquire new customers. These initiatives include offline and online media campaigns customized to the countries and demographics we serve. Examples of our marketing include advertising on television stations popular with, as well as websites frequented by, immigrant communities, and our ongoing incentive trial campaigns where we provide rewards to new customers. We intend to continue to efficiently increase our marketing investment. |
| • | Enhance Services and Overall Customer Experience. We are committed to enhancing our services and developing new capabilities to improve customer experience and build loyalty. For example, in December 2011, we optimized our “2-Click Quick Send” feature to allow our repeat customers to submit transfers in approximately one minute. During the six months ended June 30, 2013, |
79
Table of Contents
| approximately 74% of transactions submitted by repeat customers were submitted using this feature. In January 2013, we launched StatusTrak, a new tracking center that provides customers a variety of ways to track their transfers by text message, email updates and 24/7 customer support. In March 2013, we introduced POWR, an assurance to qualifying customers that we will only withdraw their money after it is received by their recipients. We believe our singular focus on the customer will grow our active customer base, solidify brand loyalty and expand our market share. |
| • | Expand and Enhance Mobile Capabilities. We launched our mobile strategy in November 2011 and our new mobile application in June 2013. In the six months ended June 30, 2013, 29% of our transactions were sent via mobile devices compared to 16% in the same period in the prior year. We believe this percentage will increase over time as mobile devices become more popular, particularly among people whose only Internet access is via mobile device. During the six months ended June 30, 2013, approximately $467 million of our gross sending volume was sent from mobile devices which represented growth of approximately 200% compared to the same period in the prior year. In June 2013, we released our new mobile application. The “Xoom App” is simple to use and allows existing customers to send money to their family and friends in seconds with “one tap and one swipe” and track the status of their transactions. We will continue to optimize our services for mobile devices to capitalize on the continued and growing trend in mobile usage. Our quarterly mobile usage as a percentage of overall transactions since we launched our mobile strategy in November 2011 was as follows: |
Transactions
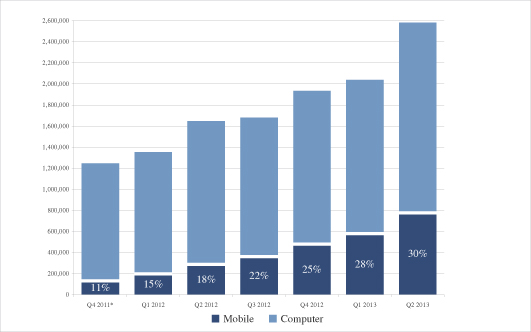
| * | We launched our mobile strategy on November 11, 2011. |
80
Table of Contents
Establish New Partnerships and Improve Current Partnerships
| • | Expand Our Marketing Partnerships. We will continue to establish new marketing partnerships to improve awareness of our money transfer services with potential customers. For example, in November 2011, we announced a retail partnership with Walmart.com, which made our online service available through Walmart.com’s Online MoneyCenter or directly at walmart.xoom.com, and in August 2013 we announced an incented trial offer through which new customers can earn a Walmart gift card. In November 2012, we announced a partnership with Univision Interactive Media, which allowed us to reach a significant customer base of immigrants in the United States with relatives in other countries. In July 2013, we announced a partnership with Sprint through which our money transfer services are now available for mobile virtual network operators on the Sprint Network. We believe that we can grow our active customer base by maintaining these strategic partnerships and adding others. |
| • | Expand and Improve Our Disbursement Network. By increasing the number of partners and improving the quality of service from existing partners, we believe we can increase the relevance of our service and improve our value proposition. For example, in November 2011, we launched an enhanced service to deposit money into nearly any bank account in the United Kingdom in less than one hour, 24 hours a day, 365 days a year. In April 2012, we also added Elektra, a leading retailer that provides a large cash pick-up network in Mexico, as a new disbursement partner, which materially increased the number of new customers sending to Mexico. In May 2013, we launched four hour bank deposit to India, a quick deposit service to India that allows customers to transfer money to any rupee-denominated bank account in India in four hours when sent during Indian banking hours. Prior to launching a new disbursement partnership, we spend a significant amount of time working directly with the partner to meet our high performance standards, rigorously review fraud and compliance requirements and enhance the recipients’ experience. We believe that by adding to the breadth and performance of our disbursement network, we can attract new customers and increase existing customer loyalty. |
Expand into New International Markets
| • | New Origination Markets. We are continuing to explore potential new originating countries such as Canada, the United Kingdom and other developed countries throughout Western Europe. Origination markets that we find attractive typically have mature regulatory and compliance systems, high median income levels and significant immigrant populations that could benefit from our services. We will continue to leverage the experience and expertise gained from our success in current markets to identify attractive new markets for our services. |
| • | New Recipient Markets. We have been successful in forging partnerships to expand into new recipient markets. We are exploring market entry opportunities in regions with significant incoming money transfer volumes, such as China, Eastern Europe, North Africa, South Korea and Vietnam. |
Leverage Technology and Develop Services in Adjacent Markets
| • | As part of our long-term strategic plan, we intend to explore opportunities to leverage our technology and money transfer network to unlock new revenue streams in adjacent markets. These opportunities may include commercial payment solutions for small-to-medium businesses and liquidation for virtual currencies. |
Technology
Our technology platform, developed over the last ten years, allows our customers to conveniently, quickly and cost-effectively send money to their family and friends. It also enables us to process money transfers safely and securely, while complying with applicable money transfer regulations and minimizing fraud. We use a combination of proprietary technology and open source solutions. We will continue to invest in delivering technologies that improve our customer experience and the safety and security of money transfers by our customers. We designed our technology platform to handle traffic well in excess of expected peaks and to scale efficiently and easily with the addition of new servers.
81
Table of Contents
Send Money Customer Interface. Our send money customer interface allows customers to send money from our website or mobile website quickly and easily, using a computer, a tablet or a smartphone. New customers complete four easy steps to sign up and send money, while repeat customers can send money with just two clicks. In June 2013, we released our new mobile application. The “Xoom App” is simple to use and allows existing customers to send money to their family and friends in seconds with “one tap and one swipe” and track the status of their transactions.
Risk Management. Our risk management processes and technology are a central part of our business. We have developed a proprietary risk management system that allows us to analyze a range of data to detect compliance issues and fraud, including predictive artificial intelligence models, inline real-time rules engines, granular controls, 24/7 expert oversight, sending limits, comprehensive searching to link related accounts and linking and visualization tools to detect emerging patterns. Our risk management technology helps us manage the primary risk challenges our business confronts:
| • | ACH Returns on Instant ACH transactions. Our system carefully monitors ACH returns in order to balance the positive impact that instant ACH transactions have on our customers’ experience against the risk of loss to Xoom from such transactions. |
| • | Payment and Fraud Risk. We are subject to attempted fraud from the use of stolen payment instruments and identity or account theft. Our proprietary risk management system allows us to detect fraudulent senders, cancel their transactions, create and maintain internal “black lists” of fraudulent senders and make required reports to government entities. |
To minimize payment and fraud risk, several requirements must be satisfied in order for a prospective customer to use our services. A prospective customer must provide us with the following information: name, address, e-mail address, phone number, date of birth, U.S.-based payment source, name of recipient, recipient disbursement information and recipient address. The U.S.-based payment source may be a bank account, credit card or debit card, but we do not require that it be from any particular bank or banks. All of the transaction data is then evaluated by our proprietary risk management system, which assesses the transaction for regulatory compliance, anti-money laundering, acceptable use, anti-fraud and funding risk. If the transaction is deemed to be high risk by our risk management system, then we will either hold the transaction for further screening or cancel the transaction.
| • | Anti-Money Laundering and Regulatory Compliance. While our risk from money laundering is reduced as compared to traditional money transfer businesses because we do not accept physical cash, our risk management system uses a multi-tier trust level matrix that adjusts the amount of information a customer and recipient must provide based on the amount of money sent and the frequency of sending. We leverage our fraud systems to prevent customers from opening multiple accounts in order to evade our trust levels and other compliance limits. |
| • | Acceptable Use. Our system is designed to detect sending patterns that indicate our service is potentially being used for illegal activities or for legal purposes that we do not want on our system, including gaming, pornography, pharmaceuticals, organized scams that solicit money transfers, or commercial activity. For example, patterns in which one person sends to many recipients or many senders send to one recipient are flagged for follow up. |
Transaction Processing. Our proprietary transaction processing platform allows us to send money seconds after our customer has authorized a transaction, either from a customer’s bank account through the ACH network, or from a customer’s credit or debit card. Our proprietary risk management system enables us to instantly process over 95% of ACH transactions. Our transaction processing platform allows processing of credit and debit card transfers in real time and ACH transfers from bank accounts in daily batches.
Disbursement Integration Platform. Our proprietary disbursement integration platform securely integrates our systems directly with those of our disbursement partners, so that we can deliver money quickly to a recipient’s bank account or to one of our disbursement partners for cash pickup or delivery. We work with our partners to deepen our integration with their systems in order to continuously improve our customers’ experience.
82
Table of Contents
Automated Testing Framework. Our automated testing framework allows us to continuously test our operating platform using innovative applications of technologies to cost-effectively simulate customer behavior in order to produce a high-quality operating platform. Without this technology, we would require significant additional investment in quality assurance engineering resources.
Marketing and Corporate Development
We market our money transfer services to customers through a variety of offline and online channels such as television and print advertising, paid and unpaid search, social networks and email. We also market through a number of incentive programs including Refer-A-Friend and targeted promotions focused on sporting and other culturally-relevant events. The primary purpose of our marketing campaigns is to drive new customer acquisition and brand awareness. We specifically develop and design our marketing programs for the demographics of the countries we serve, and we continually strive to innovate and optimize our marketing strategies.
Our marketing program uses quantitative metrics to optimize the balance between cost per acquisition of a new customer and customer lifetime value, or CLV. The program has been fine-tuned through years of continuous improvement and experience, yielding attractive return on investment and CLV.
Our corporate development team is responsible for developing our disbursement partner network. We strive to identify and work with disbursement partners that will allow us to offer our customers an accessible cash pickup network as well as direct integration with key banks to ensure quick access to money for recipients. We work continuously with our disbursement partners to improve quality and reduce costs. Our disbursement partners include prominent banks and retailers with well-recognized brands in the countries we serve.
Customer Support
We believe that effective customer support is critical to attracting new customers and retaining existing customers. Our customer operations group handles a range of customer experience management areas, including inbound customer calls and emails, partner and internal processing system monitoring, complaint resolution, customer verification and collections.
Our customer support organization provides support to customers by email, telephone and via a comprehensive set of frequently asked questions on our website. We have two outsourced customer call centers, one in the Philippines and one in El Salvador, allowing us to serve our customers around the clock in multiple languages. We take steps to ensure that calls and emails from customers are answered promptly and efficiently.
Regulation
Our services are subject to a wide range of laws and regulations enacted by the U.S. federal government, each of the states in the United States, many localities and many other countries and jurisdictions. These include international, federal and state anti-money laundering laws and regulations; financial services regulations; currency control regulations; anti-bribery laws; regulations of the U.S. Treasury Department’s Office of Foreign Assets Control, or OFAC; money transfer and payment instrument licensing laws; escheatment laws; privacy, data protection and information security laws; consumer disclosure and consumer protection laws; and rules, laws and regulations including those governing credit and debit cards, electronic payments and competition. Our subsidiary is licensed in India pursuant to the Money Transfer Service Scheme, or MTSS, as administered by the Reserve Bank of India, and must comply with all applicable MTSS rules, which include caps on transaction amounts, prohibitions against certain types of transactions and verification of a robust anti-money laundering program. Failure to comply with any of these requirements could result in the suspension or revocation of a license or registration required to provide money transfer services, the limitation, suspension or termination of services, the seizure of our assets and the imposition of civil and criminal penalties, including fines and restrictions on our ability to offer services. See “Risk Factors” for additional discussion regarding potential impacts of failure to comply.
83
Table of Contents
In February 2013, the Reserve Bank of India extended its rupee drawing arrangement, or RDA, to money transmitters based in the United States. In July 2013, we began processing transactions to India via RDA. Prior to July 2013, we processed transactions to India exclusively through our wholly-owned subsidiary, buyindiaonline.com Inc., pursuant to its license under the Money Transfer Service Scheme, or MTSS, issued by the Reserve Bank of India. Now we are processing the vast majority of transactions to India without the involvement of our subsidiary, pursuant to RDA. There are fewer limitations on transactions processed pursuant to RDA. For example, we are now able to process transactions to bank accounts held by non-resident Indians, and we are no longer subject to the $2,500 transaction limit required by MTSS.
We continually enhance our compliance programs, including our anti-money laundering program, which comprises policies, procedures, systems and internal controls to monitor and to address various legal and regulatory requirements. In addition, we continue to adapt our business practices and strategies to help us comply with current and evolving legal standards and industry practices. These programs include dedicated compliance personnel, training and monitoring programs, suspicious activity reporting, regulatory outreach and education, and support and guidance to our disbursement partners concerning regulatory compliance. Our money transfer network operates through third-party disbursement partners in most countries, and, therefore, there are limitations on our legal and practical ability to manage those disbursement partners’ compliance programs.
Anti-Money Laundering Compliance. Our money transfer services are subject to anti-money laundering laws and regulations of the United States, including the Bank Secrecy Act, as amended by the USA PATRIOT Act of 2001, or the Bank Secrecy Act, as well as similar state laws and regulations and the anti-money laundering laws and regulations in many of the countries in which we or our disbursement partners operate. Jurisdictions in which we operate may have requirements, including:
| • | maintenance of an anti-money laundering program; |
| • | identifying and reporting of suspicious activity; |
| • | recordkeeping, including funds transferred recordkeeping; |
| • | prohibition of transactions in, to or from certain countries, governments, individuals and entities; |
| • | limitations on amounts that may be transferred by a customer or from a jurisdiction at any one time or over specified periods of time, which require the aggregation of information over multiple transactions; |
| • | customer identification, information gathering and reporting requirements; |
| • | customer disclosure and notification requirements; |
| • | registration or licensing of us or our subsidiary with a state or federal agency in the United States or with the central bank or other proper authority in a foreign country; |
| • | bonding; and |
| • | minimum capital or capital adequacy requirements. |
Anti-money laundering regulations are constantly evolving. We continuously monitor our compliance with anti-money laundering regulations and implement policies and procedures to make our business practices flexible so that our services remain compliant with the most current legal requirements. As a money services business, we maintain a stringent anti-money laundering compliance program that includes internal policies and controls, designation of a compliance officer, ongoing employee training and an independent review function.
U.S. Sanctions. We are required to remain in compliance with the sanctions laws and regulations administered by OFAC and may be required to remain in compliance with sanctions regimes established in certain countries in which we or our disbursement partners operate. In order to address those requirements, we:
| • | ensure that we are not engaging in any transactions in, relating to, or involving, directly or indirectly, countries subject to U.S. economic sanctions, including Cuba, Iran, and Syria, or that otherwise would be prohibited if performed by U.S. persons or entities, unless authorized by the appropriate U.S. government agency; |
84
Table of Contents
| • | screen transactions, customers, affiliates, directors, officers or employees to ensure that none are listed on government watch-lists such as: The List of Specially Designated Nationals and Blocked Persons, or SDNs, maintained by OFAC; any lists of restricted persons or entities maintained by any other U.S. government authority or pursuant to any Executive Order of the President of the United States of America; and lists maintained by other governments as applicable; |
| • | block funds of SDNs; and |
| • | prepare and submit blocking and other reports, and maintain blocked funds as required by OFAC laws and regulations. |
Money Transfer Licensing. Most states in the United States require us to be licensed to process transactions for their residents. To date, we have obtained money transmitter licenses in 44 U.S. states, the District of Columbia and Puerto Rico, and have applied, or plan to apply, for money transmitter licenses in additional states. Our subsidiary, buyindiaonline.com Inc., is licensed as a money transmitter in Delaware and is licensed in India pursuant to the Money Transfer Service Scheme. We and our subsidiary are also registered as money services businesses with FinCEN. Licensing requirements generally include minimum net worth requirements, provision of surety bonds, compliance with operational procedures and the maintenance of reserves or “permissible investments” in an amount equivalent to outstanding payment obligations, as defined by our various regulators. The types of securities that are considered “permissible investments” vary across jurisdictions, but generally include cash and cash equivalents, U.S. government securities and other highly-rated debt instruments. Most states require us to file reports on a regular basis to verify our compliance with their requirements. Many states and other regulators also subject us to periodic examinations and require us to comply with anti-money laundering and other laws and regulations similar to the Bank Secrecy Act.
Recent Federal Legislation in the United States. The Dodd-Frank Act will likely impose additional regulatory requirements upon us. It is difficult to gauge the impact on our business because many provisions of the Dodd-Frank Act require the adoption of rules and further studies. The Dodd-Frank Act created the CFPB, which issues and enforces consumer protection initiatives governing financial products and services, including money transfer services, in the United States. We will be required to provide specific disclosures to our customers, which may require us to modify our systems and current customer disclosures. Enhanced disclosure requirements, error resolution procedures, refund requirements and other matters impacting how we offer international remittances from the United States were set forth in the Final Remittance Rule that was issued by the CFPB in January 2012 and that we expect to become effective in October 2013.
Privacy Regulations. In the ordinary course of our business, we collect certain types of data that subject us to privacy laws in the United States and abroad. In the United States, we are subject to the Gramm-Leach-Bliley Act, which requires that financial institutions have in place policies regarding the collection, processing, storage and disclosure of information considered nonpublic personal information. Many states in the U.S. and other countries where we operate have adopted similar laws. We have confidentiality and information security standards and procedures in place for our business activities and with our third-party vendors and service providers.
Escheatment Regulations. Unclaimed property laws require that we track certain information on all of our payment instruments and money transfers and, if they are unclaimed at the end of an applicable statutory abandonment period, that we remit the proceeds of the unclaimed property to the appropriate jurisdiction. Statutory abandonment periods for payment instruments and money transfers range from three to seven years.
Foreign Corrupt Practices Act. We are subject to regulations imposed by the Foreign Corrupt Practices Act in the United States and similar laws in other countries that generally prohibit companies and those acting on their behalf from making improper payments to foreign government officials for the purpose of obtaining or retaining business. We have developed training programs for employees, contractors and consultants who interact with foreign governmental officials and agencies.
85
Table of Contents
Competition
The markets in which we compete are highly competitive and are highly fragmented. However, we believe we have competitive strengths that position us favorably in our markets, including the convenience, speed and competitive cost of our services. Our largest competitors are The Western Union Company and MoneyGram Payment Systems, Inc. We also compete against country-specific players, banks and informal person-to-person money transfer service providers that evade regulation. In the future, new competitors or alliances among established companies may emerge.
Intellectual Property
The Xoom brand is important to our business. We utilize trademark registrations in the United States and internationally to protect our brand. We rely on a combination of patent and trademark laws, trade secret protection and confidentiality and license agreements to protect the intellectual property rights related to our services, all of which offer only limited protection. In addition, we have three patent applications on file with the U.S. Patent and Trademark Office.
We control access to our proprietary technology by entering into confidentiality and invention assignment agreements with employees, consultants, partners, vendors and customers. However, policing unauthorized use of our technologies, services and intellectual property is difficult, expensive and time-consuming, particularly in foreign countries where the laws may not be as protective of intellectual property rights as those in the United States and where mechanisms for enforcement of intellectual property rights may be weak. We may be unable to determine the extent of any unauthorized use or infringement of our services, technologies or intellectual property rights.
From time to time, legal action by us may be necessary to enforce our patents and other intellectual property rights, to protect our trade secrets, to determine the validity and scope of the intellectual property rights of others or to defend against claims of infringement or invalidity. We may also be subject to claims by third parties alleging that we infringe their intellectual property rights or have misappropriated other proprietary rights. Such litigation could result in substantial costs and diversion of resources and could negatively affect our business, operating results and financial condition. If we are unable to protect our intellectual property rights, we may find ourselves at a competitive disadvantage to others who need not incur the additional expense, time and effort required to create the innovative services that have enabled us to be successful to date.
Employees
As of June 30, 2013, we had 170 full-time employees, including 17 in marketing, 89 in technology and development, 27 in customer service and operations and 37 in general and administrative. We also rely on outsourcing for our customer call centers and other operational support. None of our employees is represented by a labor union or covered by a collective bargaining agreement. We have not experienced any work stoppages and we consider our relations with our employees to be good.
Legal Proceedings
We are not a party to any material pending legal proceedings. We may be involved from time to time in various legal proceedings in the normal course of business.
Facilities
We lease 35,552 square feet of space for our corporate headquarters in San Francisco, California pursuant to leases that expire in October 2016. We believe our facilities are adequate for our foreseeable needs.
86
Table of Contents
Executive Officers and Directors
The following table sets forth information regarding our directors and executive officers, including their ages, as of June 30, 2013.
| Name |
Age | Position | ||||
| John Kunze(1) |
50 | President, Chief Executive Officer and Director | ||||
| Ryno Blignaut |
40 | Chief Financial Officer and Chief Risk Officer | ||||
| Julian King |
43 | Senior Vice President, Marketing and Corporate Development | ||||
| Christopher G. Ferro |
42 | Vice President, Legal and Compliance, Secretary, General Counsel and Chief Compliance Officer | ||||
| Roelof Frederik Botha(2)(3) |
39 | Director | ||||
| Alison Davis(1)(2) |
51 | Director | ||||
| Murray J. Demo(2) |
52 | Director | ||||
| Kevin E. Hartz(3)(4) |
43 | Director | ||||
| C. Richard Kramlich(3)(4) |
78 | Director | ||||
| Anne Mitchell(1)(4) |
41 | Director | ||||
| Keith Rabois(1)(4) |
44 | Director | ||||
| Matthew Roberts(3) |
45 | Director | ||||
| (1) | Member of compliance committee. |
| (2) | Member of audit committee. |
| (3) | Member of compensation committee. |
| (4) | Member of nominating and corporate governance committee. |
Executive Officers and Directors
John Kunze. John Kunze has been our President and Chief Executive Officer since July 2006 and a director since March 2004. From August 1998 to October 2005, Mr. Kunze was the President, Chief Executive Officer and a director of Plumtree Software, Inc. (acquired by BEA Systems, Inc.), a provider of enterprise software solutions. From 1985 to 1998, Mr. Kunze worked at Adobe Systems Incorporated, a digital media solutions company, in a variety of product roles. Mr. Kunze holds a Bachelor of Arts degree in Economics from Franklin & Marshall College.
The board of directors believes that Mr. Kunze is qualified to serve as a director based on his extensive background in business management, his role as our President and Chief Executive Officer and his prior service on the board of Plumtree Software, a publicly-held company.
Ryno Blignaut. Ryno Blignaut has been our Chief Financial Officer since March 2008 and Chief Risk Officer since August 2012. Prior to that, he served as our acting Chief Financial Officer from August 2006 to March 2008, and Vice President of Finance from October 2005 to August 2006. From July 2003 to April 2005, and from June 2001 to August 2002, Mr. Blignaut worked as a consultant in financial regulation with RSM Robson Rhodes LLP (acquired by Grant Thornton LLP), an accounting firm. From September 2002 to February 2003, Mr. Blignaut served as Head of Finance for PayPal UK, an online payment company, in the United Kingdom. Mr. Blignaut has been a member of the South African Institute of Chartered Accountants since 1998 and holds a Bachelor of Commerce with Honors degree in Accounting from the University of Stellenbosch, South Africa.
Julian King. Julian King has been our Senior Vice President of Marketing and Corporate Development since May 2007. Prior to that, he served as our Senior Vice President of Marketing and Products from August 2005 to May 2007. From 2002 to 2005, Mr. King was Vice President of Marketing and Products of the PeoplePC
87
Table of Contents
business at EarthLink, Inc., an information technology services, network and communications provider. From 2000 to 2002, Mr. King served as Director of Marketing and most recently as Vice President of Marketing and Products at PeoplePC, Inc., an Internet service provider (acquired by Earthlink). From 1992 to 2000, Mr. King served in a number of roles at The Procter & Gamble Company, a multinational consumer goods company, most recently as Marketing Director. Mr. King holds a Bachelor of Science degree in Chemical Engineering from the Massachusetts Institute of Technology.
Christopher G. Ferro. Christopher G. Ferro has been our Vice President of Legal and Compliance, Secretary, General Counsel and Chief Compliance Officer since January 2008. From August 2001 to January 2008, Mr. Ferro was Senior Counsel at PayPal, Inc. From 1999 to 2001, Mr. Ferro practiced law at Davis & Gilbert LLP, a law firm in New York City. From 1996 to 1999, Mr. Ferro practiced law at Rosenman & Colin LLP, a law firm in New York City. He received his Bachelor of Arts degree in History from Stanford University and his Juris Doctor from Georgetown University Law Center.
Roelof Frederik Botha. Roelof Frederik Botha has served as a director of Xoom since May 2005. Mr. Botha has been with Sequoia Capital, a venture capital firm, since 2003, and has been a Managing Member of Sequoia Capital Operations, LLC since 2007. From 2000 to 2003, Mr. Botha served in a number of roles at PayPal, most recently as the Chief Financial Officer. From 1996 to 1998, Mr. Botha served as a management consultant for McKinsey & Company, a management consulting firm. Mr. Botha currently serves as a director of several private companies. Mr. Botha holds a Bachelor of Science degree in Actuarial Science, Economics and Statistics from the University of Cape Town and a Master of Business Administration degree from the Stanford Graduate School of Business.
The board of directors believes that Mr. Botha is qualified to serve as a director based on his financial and managerial experience and service on other private company boards of directors.
Alison Davis. Alison Davis has served as a director of Xoom since February 2010. Ms. Davis has been the Managing Partner of Fifth Era Financial LLC, an investor in, and incubator of, early stage technology enabled companies, since January 2011. From April 2004 to December 2010, Ms. Davis was a Managing Partner at Belvedere Capital Partners II LLC, a private equity firm and bank holding company focused on buyouts of banks and other financial services companies. From 2000 to 2003, Ms. Davis was the Chief Financial Officer and Global Management Committee Member for Barclays Global Investors, a money management firm. Ms. Davis currently serves as a director of the Royal Bank of Scotland plc, an international bank, Unisys Corporation, a global information technology services and software company, and Diamond Foods, Inc., a food company, and as a director of a private company. Ms. Davis received a Bachelor of Arts and a Masters degree in Economics from Cambridge University in England and a Masters in Business Administration from the Stanford Graduate School of Business.
The board of directors believes that Ms. Davis is qualified to serve a director based on her service on other public and private company boards, extensive financial leadership experience and SEC reporting and compliance expertise.
Murray J. Demo. Murray J. Demo has served as a director of Xoom since May 2012. Mr. Demo served as the Executive Vice President and Chief Financial Officer of Dolby Laboratories, Inc., a publicly-traded entertainment technology company, from May 2009 to June 2012. From September 2007 to June 2008, Mr. Demo served as Executive Vice President and Chief Financial Officer of LiveOps, Inc., a call center outsourcing company. Mr. Demo served as Executive Vice President and Chief Financial Officer of Postini, Inc., a security software company, from May 2007 until it was acquired by Google Inc. in September 2007. From 1996 to 2006, Mr. Demo served in a number of roles at Adobe Systems Incorporated, most recently as Executive Vice President and Chief Financial Officer. Mr. Demo currently serves as a director of Citrix Systems, Inc., an enterprise infrastructure company, and as a director of two private companies. Mr. Demo holds a Bachelor of Arts degree in Business Economics from the University of California, Santa Barbara and a Master of Business Administration degree from Golden Gate University.
88
Table of Contents
The board of directors believes that Mr. Demo is qualified to serve as a director based on his extensive experience with finance and accounting matters for global organizations in the technology industry, including his service as Chief Financial Officer of publicly-traded companies and as a director of one publicly-traded company.
Kevin E. Hartz. Kevin E. Hartz has served as a director of Xoom since June 2001. Mr. Hartz has been the Co-Founder and Chief Executive Officer of Eventbrite, Inc., an online event registration service, since October 2005. Mr. Hartz co-founded Xoom in 2001 and served as our Chief Executive Officer from June 2001 to October 2005. Mr. Hartz holds a Bachelor of Arts and Science degree in History and Applied Earth Science from Stanford University and a Masters of Studies degree in British History from Oxford University.
The board of directors believes that Mr. Hartz is qualified to serve as a director based on his experience as co-founder and former Chief Executive Officer of Xoom and his experience in the technology industry.
C. Richard Kramlich. C. Richard Kramlich has served as a director of Xoom since April 2005. Mr. Kramlich is a co-founder of New Enterprise Associates, a venture capital firm, where he served as a General Partner from its formation in 1978 through December 2012. Mr. Kramlich currently serves as Chairman of the NEA Management Company, and as a member of the board of directors of Zhone Technologies, Inc., a telecommunications equipment company, SVB Financial Group, a financial services company, Sierra Monitor Corporation, an electronic safety equipment manufacturer, and as a director of numerous private companies. Mr. Kramlich holds a Bachelor of Science degree from Northwestern University and a Master of Business Administration degree from Harvard Business School.
The board of directors believes that Mr. Kramlich is qualified to serve as a director based on his significant experience in the venture capital industry analyzing, investing in and serving on the boards of directors of global technology companies and his tenure with Xoom.
Anne Mitchell. Anne Mitchell has served as a director of Xoom since April 2006. From January 2010 to February 2013, Ms. Mitchell was a Venture Partner at Volition Capital LLC, a growth equity firm established by the U.S. partners of Fidelity Ventures. From 1996 to 2010, Ms. Mitchell was a partner at Fidelity Ventures, a venture capital firm. Ms. Mitchell has previously served as a director of various private companies. Ms. Mitchell holds a Bachelor of Arts in History from Harvard College.
The board of directors believes that Ms. Mitchell is qualified to serve as a director based on her service on other private company boards, broad industry experience and extensive experience as an investor in technology companies.
Keith Rabois. Keith Rabois has served as a director of Xoom since June 2003. Mr. Rabois has been a partner at Khosla Ventures, a venture capital firm, since March 2013. From August 2010 to January 2013, Mr. Rabois served as Chief Operating Officer at Square, Inc., a mobile payment processing company. From May 2007 to August 2010, Mr. Rabois served as Executive Vice President of Strategy and Business Development of Slide, Inc. (acquired by Google Inc.), a social entertainment applications publishing company. Mr. Rabois was Vice President of Business & Corporate Development for LinkedIn Corporation, a social networking company, from January 2005 to May 2007. From December 2003 to December 2004, Mr. Rabois served as Chief Operating Officer of Epoch Innovations, Inc., a neuroscience company. From November 2000 to November 2002, Mr. Rabois served as Executive Vice President of PayPal. Mr. Rabois also serves on the board of directors of Yelp, Inc., an online review company. Mr. Rabois holds a Bachelor of Arts degree in Political Science from Stanford University and a Juris Doctor from Harvard Law School.
The board of directors believes that Mr. Rabois is qualified to serve as a director based on his managerial and industry experience and his experience as a director of a publicly-traded company.
89
Table of Contents
Matthew Roberts. Matthew Roberts has served as a director of Xoom since January 2012. Mr. Roberts has been the President, Chief Executive Officer and a director of OpenTable, Inc., an online restaurant reservation company, since June 2011. From June 2005 to August 2011, Mr. Roberts served as OpenTable’s Chief Financial Officer. From January 1999 to May 2005, Mr. Roberts served in a number of roles at E-LOAN, Inc., a loan provider, most recently as Chief Financial Officer. Mr. Roberts currently serves as a director of a private company. Mr. Roberts is a Certified Public Accountant (inactive status) and holds a Bachelor of Science degree in Accounting from Santa Clara University.
The board of directors believes that Mr. Roberts is qualified to serve as a director based on his extensive experience with finance and accounting matters in the technology industry, including the experience that he has gained in his roles as Chief Executive Officer and Chief Financial Officer of a publicly-traded company.
Board Composition
Our board of directors consists of nine directors, eight of whom qualify as “independent” directors according to the rules and regulations of the NASDAQ Stock Market LLC, or NASDAQ. Our amended and restated certificate of incorporation provides for a classified board of directors divided into three classes with members of each class of directors serving staggered three-year terms. As a result, a portion of our board of directors will be elected at each annual meeting of stockholders. Mr. Botha, Mr. Kunze and Mr. Rabois have been designated Class I directors whose term will expire at the 2014 annual meeting of stockholders. Mr. Demo, Ms. Mitchell and Mr. Roberts have been designated Class II directors whose term will expire at the 2015 annual meeting of stockholders Ms. Davis, Mr. Hartz and Mr. Kramlich have been designated Class III directors whose term will expire at the 2016 annual meeting of stockholders.
Our amended and restated certificate of incorporation also provides that that the number of authorized directors will be determined from time to time by resolution of the board of directors and any vacancies in our board and newly created directorships may be filled only by our board of directors. Any additional directorships resulting from an increase in the number of directors will be distributed among the three classes, so that, as nearly as possible, each class will consist of one-third of the total number of directors. Our amended and restated certificate of incorporation further provides for the removal of a director only for cause and by the affirmative vote of the holders of 66 2/3% or more of the shares then entitled to vote at an election of our directors. These provisions and the classification of our board of directors may have the effect of delaying or preventing changes in the control or management of Xoom.
There are no family relationships among any of our directors or executive officers.
Our board of directors has considered the relationships of all directors and, where applicable, the transactions involving them described below under “Certain Relationships and Related Person Transactions,” and determined that Messrs. Botha, Demo, Hartz, Kramlich, Rabois and Roberts, and Messes. Davis and Mitchell do not have any relationship which would interfere with the exercise of independent judgment in carrying out his or her responsibility as a director and that each non-employee director qualifies as an independent director under the applicable rules of NASDAQ.
Committees of the Board of Directors
Our board of directors has established an audit committee, a compensation committee, a nominating and corporate governance committee and a compliance committee, each of which operates pursuant to a separate charter adopted by our board of directors. The composition and responsibilities of each committee are described below. Members serve on these committees until their resignation or until otherwise determined by our board of directors.
The composition and functioning of our board of directors and all of our committees comply with all applicable requirements of the Sarbanes-Oxley Act, and NASDAQ and SEC rules and regulations.
90
Table of Contents
Audit Committee
Our audit committee consists of Roelof Frederik Botha, Murray J. Demo and Alison Davis, with Ms. Davis chairing the audit committee. All members of our audit committee meet the requirements for financial literacy under the applicable rules and regulations of the SEC and NASDAQ. Our board of directors has determined that Messrs. Botha and Demo and Ms. Davis are “audit committee financial experts” as defined under the applicable rules of the SEC and have the requisite financial sophistication as defined under the applicable rules and regulations of NASDAQ. Roelof Frederik Botha, Murray J. Demo and Alison Davis are independent directors as defined under the applicable rules and regulations of the SEC and NASDAQ. The audit committee operates under a written charter that satisfies the applicable standards of the SEC and NASDAQ.
The audit committee’s responsibilities include:
| • | appointing, approving the compensation of, and assessing the independence of our independent registered public accounting firm; |
| • | pre-approving auditing and permissible non-audit services, and the terms of such services, to be provided by our independent registered public accounting firm; |
| • | reviewing and discussing with management and the independent registered public accounting firm our annual and quarterly financial statements and related disclosures; |
| • | coordinating the oversight and reviewing the adequacy of our internal control over financial reporting; |
| • | establishing policies and procedures for the receipt and retention of accounting-related complaints and concerns; and |
| • | preparing the audit committee report required by SEC rules to be included in our annual proxy statement. |
Compensation Committee
Our compensation committee consists of Roelof Frederik Botha, Kevin E. Hartz, C. Richard Kramlich and Matthew Roberts, with Mr. Roberts chairing the compensation committee. All members of our compensation committee are independent under the applicable rules and regulations of the SEC, NASDAQ and the Internal Revenue Code of 1986, as amended, or the Code.
The compensation committee’s responsibilities include:
| • | reviewing and approving corporate goals and objectives relevant to compensation of our chief executive officer; |
| • | evaluating the performance of our chief executive officer in light of such corporate goals and objectives and determining the compensation of our chief executive officer; |
| • | determining the compensation of all our other officers and reviewing periodically the aggregate amount of compensation payable to such officers; |
| • | overseeing and making recommendations to the board of directors with respect to our incentive-based compensation and equity plans; and |
| • | reviewing and making recommendations to the board of directors with respect to director compensation. |
Nominating and Corporate Governance Committee
Our nominating and corporate governance committee consists of Kevin E. Hartz, C. Richard Kramlich, Keith Rabois and Anne Mitchell, with Ms. Mitchell chairing the nominating and corporate governance committee. All members of our nominating and corporate governance committee are independent under the applicable rules and regulations of the SEC and NASDAQ.
91
Table of Contents
The nominating and corporate governance committee’s responsibilities include:
| • | developing and recommending to the board of directors the criteria for selecting board and committee membership; |
| • | establishing procedures for identifying and evaluating director candidates including nominees recommended by stockholders; |
| • | identifying individuals qualified to become board members; |
| • | recommending to the board of directors the persons to be nominated for election as directors and to each of the board’s committees; |
| • | developing and recommending to the board of directors a set of corporate governance guidelines; and |
| • | overseeing the evaluation of the board of directors, its committees and management. |
Compliance Committee
Our compliance committee consists of John Kunze, Keith Rabois, Alison Davis and Anne Mitchell, with Mr. Kunze chairing the compliance committee.
The compliance committee’s responsibilities include:
| • | overseeing the implementation of a compliance program to ensure the company’s compliance with legal and regulatory requirements; and |
| • | overseeing the implementation of the company’s risk management policies. |
Compensation Committee Interlocks and Insider Participation
None of the members of the compensation committee is or has at any time during the past fiscal year been an officer or employee of the company. None of the members of the compensation committee has been an officer of the company since 2005. None of our executive officers serve or in the past fiscal year has served as a member of the board of directors or compensation committee of any other entity that has one or more executive officers serving as a member of our board of directors or compensation committee.
92
Table of Contents
The following section provides compensation information pursuant to the scaled disclosure rules applicable to “emerging growth companies” under the rules of the SEC and may contain statements regarding future individual and company performance targets and goals. These targets and goals are disclosed in the limited context of the company’s executive compensation program and should not be understood to be statements of management’s expectations or estimates of results or other guidance. We specifically caution investors not to apply these statements to other contexts.
Overview
Historically, our board of directors has set the compensation of our executive officers. The primary objectives of our executive compensation program have been to:
| • | attract, engage, and retain superior talent who contribute to our long-term success; |
| • | motivate, inspire and reward executive officers whose knowledge, skills and performance are critical to our business; |
| • | ensure compensation is aligned with our corporate strategies and business objectives; and |
| • | provide our executive officers with incentives that effectively align their interests with those of our stockholders. |
Executive Compensation Design Overview
Historically, our executive compensation program has reflected our growth and development-oriented corporate culture. To date, the compensation of John Kunze, our President and Chief Executive Officer, and the other executive officers identified in the Summary Compensation Table in this prospectus, who we refer to as the Named Executive Officers, has consisted of a combination of base salary and long-term incentive compensation in the form of stock options. Our executive officers and all salaried employees also are eligible to receive health and welfare benefits. Pursuant to employment agreements, the Named Executive Officers are also eligible to receive certain payments and benefits upon a termination of employment under certain circumstances, as well as acceleration of vesting of certain outstanding equity awards in connection with a change in control of the company.
The key component of our executive compensation program has been equity awards in the form of options to purchase shares of our common stock. We have emphasized the use of equity to provide incentives for our executive officers to focus on the growth of our overall enterprise value and, correspondingly, to create value for our stockholders. Going forward, we may introduce other forms of stock-based compensation awards into our executive compensation program to offer our executive officers additional types of equity incentives that further this objective.
We will evaluate our philosophy and compensation plans and arrangements as circumstances require. At a minimum, we expect to review executive compensation annually. As part of this review process, we expect the board of directors or the compensation committee to apply our values and the objectives outlined above, while considering the compensation levels needed to ensure our executive compensation program remains competitive. We will also review whether we are meeting our retention objectives and the potential cost of replacing a key employee.
We are currently in the process of reviewing our executive compensation program and may make changes by the end of 2013.
Compensation of Named Executive Officers
Base Salaries
The board of directors reviews the base salaries of our executive officers, including the Named Executive Officers, from time to time and makes adjustments as it determines to be reasonable and necessary to reflect the scope of an executive officer’s performance, contributions, responsibilities, experience, prior salary level, position (in the case of a promotion) and market conditions.
93
Table of Contents
In March 2012, the board of directors reviewed the base salaries of our executive officers, taking into consideration the recommendations of our Chief Executive Officer (except with respect to his own base salary), compensation data compiled and prepared by Equilar, Inc., compensation data from a New Enterprise Associates, or NEA, survey of similarly-situated private companies, as well as the other factors described above. Our board of directors, exercising its judgment and discretion, decided to adjust the base salaries of certain of our executive officers. In particular, Mr. Kunze’s base salary was increased based on the compensation data in order to bring his salary more in line with salaries paid to chief executive officers at comparable companies. The base salaries of the Named Executive Officers for 2011 and 2012 are as follows:
| Named Executive Officer |
2011 Base Salary | 2012 Base Salary | ||||||
| John Kunze |
$ | 275,000 | $ | 400,000 | ||||
| Julian King |
$ | 230,000 | $ | 280,000 | ||||
| Ryno Blignaut |
$ | 220,000 | $ | 280,000 | ||||
The 2012 base salary adjustments became effective on April 1, 2012.
Equity Awards
We use equity awards to incentivize and reward our executive officers, including the Named Executive Officers, for long-term corporate performance based on the value of our common stock and, thereby, to align the interests of our executive officers with those of our stockholders. These equity awards have been granted in the form of stock options to purchase shares of our common stock. We believe that stock options, when granted with exercise prices equal to the fair market value of our common stock on the date of grant, provide an appropriate long-term incentive for our executive officers, since the stock options reward them only to the extent that our stock price grows and stockholders realize value following the stock option grant date.
Historically, we have granted stock options to our executive officers, including the Named Executive Officers, when the board of directors has determined that such awards were necessary or appropriate upon initial hiring, in recognition of a promotion, or to achieve our retention objectives. In making its award decisions, the board of directors has exercised its judgment and discretion to set the size of each award at a level it considered appropriate to create a meaningful opportunity for reward predicated on the creation of long-term stockholder value.
In March 2012, the board of directors, after considering the recommendations of our Chief Executive Officer, as well as compensation data from an NEA survey of similarly-situated privately-held companies, approved the grant of stock options to purchase shares of our common stock for certain of our executive officers, including the Named Executive Officers, to ensure that our executive officers are sufficiently retained and to recognize our financial results and each executive officer’s individual performance for 2011. These stock options were granted with an exercise price equal to $6.84 per share, the fair market value of our common stock as determined by the board of directors on that date. These stock options are subject to a five-year, time-based vesting schedule to maximize the retention objectives of the awards. The stock option grants made to these Named Executive Officers were as follows:
| Named Executive Officer |
Number of Shares Underlying Stock Option Grant (2012) |
|||
| John Kunze |
500,000 | |||
| Julian King |
140,000 | |||
| Ryno Blignaut |
140,000 | |||
94
Table of Contents
Senior Executive Incentive Bonus Plan
In December 2012, our board of directors adopted the Senior Executive Cash Incentive Bonus Plan, or the Bonus Plan. In the event the compensation committee decides in the future to implement a cash bonus program for certain key executive officers, including the Named Executive Officers, it will do so under the terms and conditions of the Bonus Plan. The Bonus Plan provides for cash bonus payments based upon the attainment of performance targets established by the compensation committee. The payment targets will be related to financial and operational measures or objectives with respect to us or our subsidiary, or the Performance Goals.
The compensation committee may select Performance Goals, from among the following: cash flow (including operating cash flow and free cash flow); revenue; corporate revenue; earnings before interest, taxes, depreciation and amortization; net income (loss) (either before or after interest, taxes, depreciation and/or amortization); changes in the market price of our common stock; economic value-added; acquisitions or strategic transactions; operating income (loss); return on capital, assets, equity, or investment; stockholder returns; return on sales; gross or net profit levels; productivity; expense; margins; operating efficiency; customer satisfaction; working capital; earnings (loss) per share of our common stock; sales or market shares; number of customers; number of new customers or customer references; operating income and net annual recurring revenue; any of which may be measured in absolute terms or compared to any incremental increase, measured in terms of growth, compared to another company or companies or to results of a peer group, measured against the market as a whole and/or according to applicable market indices, measured against our performance as a whole or a segment of the company and/or measured on a pre-tax or post-tax basis (if applicable).
Any bonuses paid under the Bonus Plan will be based upon objectively determinable bonus formulas that tie such bonuses to one or more performance targets relating to the Performance Goals. The bonus formulas will be adopted in each performance period by the compensation committee and communicated to each executive. No bonuses will be paid under the Bonus Plan unless and until the compensation committee makes a determination with respect to the attainment of the performance objectives. Notwithstanding the foregoing, the compensation committee can adjust or pay bonuses under the Bonus Plan based on achievement of individual performance goals or pay bonuses (including, without limitation, discretionary bonuses) to executive officers under the Bonus Plan based upon such other terms and conditions as the compensation committee may in its discretion determine.
Each executive officer who is selected to participate in the Bonus Plan will have a targeted bonus opportunity set for each performance period. The Performance Goals will be measured at the end of each performance period after our financial reports have been published or such other appropriate time as the compensation committee determines. If the Performance Goals are met, payments will be made as soon as practicable following the end of each performance period. Subject to the rights contained in any agreement between the executive officer and the company, an executive officer must be employed by the company on the bonus payment date to be eligible to receive a bonus payment.
95
Table of Contents
Compensation Tables
Summary Compensation Table
The following table presents summary information regarding the total compensation awarded to, earned by, and paid to each individual who served as our Chief Executive Officer and the two most highly-compensated executive officers (other than the Chief Executive Officer) who were serving as executive officers at the end of the fiscal years ended December 31, 2011 and 2012 for services rendered in all capacities to the company for such years. These individuals are our Named Executive Officers.
| Name and Principal Position |
Year | Salary $ |
Option Awards(1) |
Non-Equity Incentive Plan Compensation $ |
All
Other Compensation(2) ($) |
Total ($) |
||||||||||||||||||
| John Kunze, President and Chief Executive Officer |
2012 | $ | 368,750 | $ | 1,458,632 | — | $ | 1,370 | $ | 1,828,752 | ||||||||||||||
| 2011 | $ | 267,860 | — | — | $ | 2,868 | $ | 270,728 | ||||||||||||||||
| Julian King, Senior Vice President, Marketing and Corporate Development |
2012 | $ | 267,500 | 408,417 | — | — | $ | 675,917 | ||||||||||||||||
| 2011 | $ | 224,436 | — | — | — | $ | 224,436 | |||||||||||||||||
| Ryno Blignaut, Chief Financial Officer and Chief Risk Officer |
2012 | $ | 265,000 | $ | 408,417 | — | — | $ | 673,417 | |||||||||||||||
| 2011 | $ | 217,099 | — | — | — | $ | 217,099 | |||||||||||||||||
| (1) | The amounts reported in the Option Awards column represent the grant date fair value of the stock options granted to the named executive officers during 2012 as computed in accordance with Financial Accounting Standards Board Accounting Standards Codification Topic 718. The assumptions used in calculating the grant date fair value of the stock options reported in the Option Awards column are set forth in Note 8 to the consolidated financial statements included in this prospectus. The amounts reported in this column reflect the accounting cost for these stock options and do not correspond to the actual economic value that may be received by the named executive officers for the stock options. |
| (2) | The amount reported in All Other Compensation column for Mr. Kunze represents payments for certain health insurance premiums. |
Outstanding Equity Awards at Fiscal Year-End Table – 2012
The following table summarizes, for each of the Named Executive Officers, the number of shares of our common stock underlying outstanding stock options held as of December 31, 2012.
| Name |
Number
of Securities Underlying Unexercised Options (#) Exercisable(1) |
Number
of Securities Underlying Unexercised Options (#) Unexercisable |
Vesting Commencement Date |
Option Exercise Price ($) |
Option Expiration Date (10 yrs After Grant Date) |
|||||||||||||||
| John Kunze |
1,275,000 | (2) | — | 7/21/2006 | 0.68 | 7/21/2016 | ||||||||||||||
| 160,031 | (3) | — | 4/24/2008 | 1.00 | 4/24/2018 | |||||||||||||||
| 312,500 | (4) | — | 4/20/2010 | 4.48 | 4/20/2020 | |||||||||||||||
| 500,000 | (5) | — | 3/15/2012 | 6.84 | 3/15/2022 | |||||||||||||||
| Julian King |
25,000 | (2) | — | 5/1/2007 | 1.00 | 5/1/2017 | ||||||||||||||
| 71,250 | (2) | — | 4/24/2008 | 1.00 | 4/24/2018 | |||||||||||||||
| 187,500 | (4) | — | 4/20/2010 | 4.48 | 4/20/2020 | |||||||||||||||
| 140,000 | (5) | — | 3/15/2012 | 6.84 | 3/15/2022 | |||||||||||||||
| Ryno Blignaut |
42,500 | (2) | — | 10/3/2005 | 0.68 | 10/3/2015 | ||||||||||||||
| 51,540 | (2) | — | 10/18/2006 | 0.68 | 10/18/2016 | |||||||||||||||
| 49,710 | (2) | — | 5/1/2007 | 1.00 | 5/1/2017 | |||||||||||||||
| 96,250 | (2) | — | 4/24/2008 | 1.00 | 4/24/2018 | |||||||||||||||
| 187,500 | (4) | — | 4/20/2010 | 4.48 | 4/20/2020 | |||||||||||||||
| 140,000 | (5) | — | 3/15/2012 | 6.84 | 3/15/2022 | |||||||||||||||
96
Table of Contents
| (1) | These stock options are immediately exercisable in full as of the date of grant, with the underlying option shares subject to a right of repurchase in favor of the company at the option exercise price. This right of repurchase lapses with respect to each stock option as described hereafter. |
| (2) | The right of repurchase associated with this stock option has expired. Accordingly, this stock option is fully vested. |
| (3) | The right of repurchase associated with this stock option expires over a four-year period at the rate of 1/48th of the shares of common stock underlying the option each month following the Vesting Commencement Date. |
| (4) | The right of repurchase associated with these stock options expires over a five-year period at the rate of 20% of the shares of common stock underlying the options on the first anniversary of the Vesting Commencement Date and 1/60th of the shares of common stock underlying the options each month thereafter. |
| (5) | The right of repurchase associated with these stock options expires over a five-year period at the rate of 20% of the shares of common stock underlying the options on each yearly anniversary of the Vesting Commencement Date. |
Employment Agreements and Termination of Employment Arrangements
Each of our executive officers serves at the pleasure of our board of directors. We initially entered into offer letters or employment agreements with each of the Named Executive Officers in connection with his employment with the company, and replaced the offer letters or employment agreements with our Named Executive Officers with new employment agreements during 2011, which were later amended and restated in 2012. With the exception of his own arrangement which was negotiated by the board of directors, each of these employment agreements was negotiated on our behalf by our Chief Executive Officer, with the oversight and approval of our board of directors.
These agreements provided for “at will” employment and set forth the terms and conditions of employment of each Named Executive Officer, including base salary, target annual bonus opportunity and standard employee benefit plan participation. Each Named Executive Officer has also entered into our standard confidential information and invention assignment agreement.
These agreements also contain provisions that provide for certain payments and benefits in the event of a termination of employment, including an involuntary termination of employment following a change in control of the company. In addition, the Named Executive Officers may be entitled to accelerated vesting of certain of their outstanding and unvested awards in certain circumstances.
Involuntary Termination of Employment
Pursuant to their employment agreements, each Named Executive Officer is eligible to receive certain payments and benefits in the event his employment is terminated by the company without “cause” (as defined in his employment agreement) or in the event he terminates his employment with “good reason” (as defined in his employment agreement). In addition to his accrued benefits (consisting of unpaid expense reimbursements, accrued but unused vacation to the extent such payment is required by law or company policy, any vested benefits that he may have under any of our employee benefit plans and any earned but unpaid base salary payable through the date of termination), upon the timely execution of a fully effective general release of claims in favor of the company, each Named Executive Officer is eligible to receive the following payments and benefits:
| • | a lump-sum cash severance payment equal to 6 months (12 months in the case of Mr. Kunze) of his base salary; and |
| • | if the Named Executive Officer was participating in a cash bonus plan at the time of such termination, a pro rata portion of the cash bonus payable under such cash bonus plan for the year in which the termination of employment occurs, based on the number of days in such year completed prior to the date of termination and determined assuming that all applicable performance targets are attained at the 100% level. |
Change in Control of the Company
Pursuant to their employment agreements, in the event of a “change in control” of the company (as defined in their employment agreements), 25%, in the case of Mr. Kunze, or 100%, in the case of Messrs. King and
97
Table of Contents
Blignaut of the total number of shares of our common stock subject to outstanding and unvested stock options granted to such Named Executive Officers prior to March 22, 2012 will immediately accelerate, vest, and become fully exercisable or non-forfeitable as of the effective date of the change in control.
Involuntary Termination of Employment in Connection with a Change in Control of the Company
Pursuant to their employment agreements, the remaining portion of any outstanding and unvested equity awards will continue to vest and become exercisable in accordance with their original vesting schedule following a change in control; provided, however, that any unvested portion of such outstanding stock options and other stock-based awards will immediately accelerate, vest, and become fully exercisable or non-forfeitable if, within 12 months after the change in control of the company:
| • | the Named Executive Officer’s employment is terminated by the company without “cause” (as defined in his employment agreement); or |
| • | the Named Executive Officer terminates his employment with “good reason” (as defined in his employment agreement). |
In addition, each Named Executive Officer is also eligible to receive the cash payments and benefits described above under “Involuntary Termination of Employment,” in the event of an involuntary termination of their employment following a change in control of the company, plus an additional lump sum payment of 6 months of his base salary (12 months in the case of Mr. Kunze) for a total of 12 months of base salary (24 months in the case of Mr. Kunze).
Excise Tax Considerations
The payments and benefits provided under the employment agreements of the Named Executive Officers in connection with a change in control of the company may be subject to an excise tax under Section 4999 of the Internal Revenue Code of 1986, as amended, or the Code. These payments and benefits also may not be eligible for a federal income tax deduction pursuant to Section 280G of the Code. If any of these payments or benefits are subject to such excise taxes, they will be reduced (but not below zero) to the extent necessary so that the sum of all payments and benefits will not trigger such excise tax, if such reduction would result in a better net after-tax benefit to the affected Named Executive Officer.
Definitions
For purposes of the employment agreements, “cause” means:
| • | conduct by an executive officer constituting a material act of misconduct in connection with the performance of his duties, including, without limitation, misappropriation of funds or property of the company or any of its subsidiaries or affiliates other than the occasional, customary, or de minimis use of company property for personal purposes; |
| • | the commission by an executive officer of any felony or a misdemeanor involving moral turpitude, deceit, dishonesty or fraud; |
| • | continued non-performance by an executive officer of his duties under the employment agreement (other than by reason of the executive officer’s physical or mental illness, incapacity, or disability) that has continued for more than 30 days following written notice from the company of such non-performance; |
| • | a breach by an executive officer of any of the provisions of the employment agreement, or our proprietary information agreement, or the nondisclosure agreement; |
| • | a material violation by an executive officer of our written employment policies; |
| • | acceptance of a position with a competitive entity; or |
98
Table of Contents
| • | failure to cooperate with a bona fide internal investigation or an investigation by regulatory or law enforcement authorities, after being instructed by the company to cooperate, or the willful destruction or failure to preserve documents or other materials known to be relevant to such investigation or the inducement of others to fail to cooperate or to produce documents or other materials in connection with such investigation. |
For purposes of the employment agreements, “good reason” means the failure of the company to cure any of the following events within 30 days after receiving written notice from the executive officer:
| • | a demotion or any material diminution of an executive officer’s position, authority, duties, or responsibilities and that will include (but not be limited to) the executive officer’s having a position, authority, duties or responsibilities after a change in control of the company with respect to a division or line of business, rather than a substantially comparable position, authority, duties, or responsibilities with respect to our successor or acquirer; |
| • | a requirement that an executive officer report to work more than 30 miles from our existing headquarters (not including normal business travel required by the executive officer’s position and that is substantially comparable to the business travel historically required of the executive officer); |
| • | a material reduction in an executive officer’s base salary, bonus opportunity or benefits, except for an across-the-board reduction affecting all or substantially all senior executives of the company and that is implemented before a change in control of the company occurs; or |
| • | the material breach of the employment agreement by the company. |
For purposes of the employment agreements, a “change in control” of the company means the consummation of any of the following:
| • | the sale of all or substantially all of the assets of the company on a consolidated basis to an unrelated person or entity; |
| • | a merger, reorganization, or consolidation involving the company in which the shares of voting stock outstanding immediately prior to such transaction represent or are converted into or exchanged for securities of the surviving or resulting entity immediately upon completion of such transaction that represent less than 50% of the outstanding voting power of such surviving or resulting entity; |
| • | the acquisition of all or a majority of the outstanding voting stock of the company in a single transaction or a series of related transactions by a person or group of persons; or |
| • | any other acquisition of the business of the company, as determined by the board of directors. |
Director Compensation
The following table presents the total compensation for each person who served as a non-employee member of our board of directors during 2012. Other than as set forth in the table and described more fully below, we did not pay any compensation, reimburse any expense of, make any equity awards or non-equity awards to, or pay any other compensation to any of the other non-employee members of our board of directors in 2012. Mr. Kunze, who is our President and Chief Executive Officer, receives no compensation for his service as a director and, consequently, is not included in this table. The compensation received by Mr. Kunze as an employee of the company is presented in “Summary Compensation Table.”
99
Table of Contents
Director Compensation Table — 2012
| Director Name |
Fees Earned or Paid in Cash ($) |
Option
Awards(1)(2) ($) |
Total ($) |
|||||||||
| Roelof Frederik Botha |
— | — | — | |||||||||
| Alison Davis |
$ | 30,000 | — | $ | 30,000 | |||||||
| Murray Demo(3) |
$ | 20,000 | $ | 724,057 | $ | 744,057 | ||||||
| Kevin E. Hartz |
— | — | — | |||||||||
| C. Richard Kramlich |
— | — | — | |||||||||
| Anne Mitchell |
— | — | — | |||||||||
| Keith Rabois(3) |
— | $ | 540,725 | $ | 540,725 | |||||||
| Matthew Roberts(3) |
$ | 20,000 | $ | 391,200 | $ | 411,200 | ||||||
| (1) | The amounts reported in the Option Awards column represent the grant date fair value of the stock options granted to the non-employee members of our board of directors during 2012 as computed in accordance with Financial Accounting Standards Board Accounting Standards Codification Topic 718. The assumptions used in calculating the grant date fair value of the stock options reported in the Option Awards column are set forth in Note 8 to the consolidated financial statements included in this prospectus. The amounts reported in this column reflect the accounting cost for these stock options and do not correspond to the actual economic value that may be received by the non-employee members of our board of directors for the stock options. |
| (2) | As of December 31, 2012, Ms. Davis, Mr. Demo, Mr. Rabois and Mr. Roberts held unexercised stock options covering 118,750, 142,500, 95,000 and 139,321 shares of common stock, respectively. None of the other non-employee members of our board of directors held stock options or any other unvested stock-based awards as of that date. |
| (3) | Murray Demo and Matthew Roberts joined our board of directors in 2012 and, following their elections, were granted stock options covering 142,500 and 139,321 shares of common stock, respectively. |
Historically, we generally did not provide our non-employee directors, in their capacities as such, with any cash, equity or other compensation, other than those disclosed in the table above and a $30,000 cash retainer paid to Ms. Davis in 2011 and 2012. In December 2012, our board of directors approved the following annual cash and equity retainers for our non-employee directors based on the recommendation of our Chief Executive Officer and the compensation committee of our board of directors:
| Cash Retainer(1) |
||||
| Annual Retainer for Non-Employee Directors |
$ | 25,000 | ||
| Additional Annual Retainer for Board Chairperson |
$ | 15,000 | ||
| Annual Retainer for Audit Committee Chairperson |
$ | 15,000 | ||
| Annual Retainer for Compensation Committee Chairperson |
$ | 10,000 | ||
| Annual Retainer for Nominating and Corporate Governance Committee Chairperson |
$ | 5,000 | ||
| Annual Retainer for Compliance Committee Chairperson(2) |
$ | 5,000 | ||
| Annual Retainer for Audit Committee Non-Chairperson Members |
$ | 5,000 | ||
| Annual Retainer for Compensation Committee Non-Chairperson Members |
$ | 3,500 | ||
| Annual Retainer for Nominating and Corporate Governance Committee Non-Chairperson Members |
$ | 2,500 | ||
| (1) | In lieu of receiving a cash retainer, a director may elect to receive shares of common stock of the company with a fair market value equal to the cash retainer. |
| (2) | The current Compliance Committee Chairperson is an employee of the company so no retainer will be paid to the Chairperson at this time. |
| Fair Market Value on Date of Grant of Stock Options |
||||
| Annual Retainer for Non-Employee Directors for 2013, or the Initial Grant |
$ | 180,000 | ||
| Annual Retainer for Non-Employee Directors for 2014, or the Annual Grant |
$ | 90,000 | ||
The Initial Grant was made to our non-employee directors in July 2013. All shares subject to an Initial Grant for a non-employee director shall vest annually over three years, provided such non-employee director continues to be a director on each such vesting date.
100
Table of Contents
The Annual Grant will be made to our non-employee directors then serving on our board of directors on the date of the annual meeting of stockholders, beginning with the annual meeting of stockholders to be held in 2014. All shares subject to an Annual Grant for a non-employee director shall vest on the one-year anniversary of the grant date, provided such non-employee director continues to be a director on such date.
Employee Stock Plans
2010 Stock Option and Grant Plan
Our 2010 Stock Option and Grant Plan, or the 2010 Plan, was adopted by our board of directors and subsequently approved by our stockholders. The 2010 Plan was an amendment and restatement of our prior option plan. As of December 31, 2012, we have reserved 8,187,500 shares of our common stock for issuance under the 2010 Plan. This number is subject to adjustment in the event of a stock split, stock dividend or other changes in our capitalization.
The 2010 Plan is administered by our board of directors. Our board of directors has the authority to delegate its authority to administer the 2010 Plan to one or more committees of the board, to select the individuals to whom awards will be granted, to make any combination of awards to participants, to accelerate the exercisability or vesting of any award, to provide substitute awards and to determine the specific terms and conditions of each award.
The 2010 Plan permits us to make grants of incentive stock options and non-qualified stock options and direct awards or sales of shares of restricted common stock to officers, employees, directors, consultants and other key persons (including prospective employees but conditioned on their employment).
Upon a change in control in which all awards are not assumed, substituted with awards issued by the successor entity, or substituted with cash consideration, the 2010 Plan and awards issued thereunder will be subject to accelerated vesting and, in the case of stock options, full exercisability, followed by the cancellation of such awards.
All employee stock option awards are covered by a stock option agreement and vest in accordance with the vesting schedule set forth in such stock option agreement. Our board of directors may choose to accelerate the vesting schedule, and some employees are entitled to acceleration upon a change of control. We have not engaged in any option repricing or other modification to any outstanding equity awards.
Our board of directors has determined not to grant any further awards under the 2010 Plan and future awards will be made under the 2012 Plan.
2012 Stock Option and Incentive Plan
In December 2012, our board of directors, upon the recommendation of the compensation committee of the board of directors, adopted our 2012 Stock Option and Incentive Plan, or the 2012 Plan, which was subsequently approved by our stockholders. The 2012 Plan replaced the 2010 Plan. Our 2012 Plan provides flexibility to our compensation committee to use various equity-based incentive awards as compensation tools to motivate our workforce.
We initially reserved 3,000,000 shares of our common stock for the issuance of awards under the 2012 Plan. The 2012 Plan provides that the number of shares reserved and available for issuance under the plan will automatically increase each January 1, beginning on January 1, 2014, by 4% of the outstanding number of shares of our common stock on the immediately preceding December 31 or such lesser number of shares as determined by our compensation committee. This number is subject to adjustment in the event of a stock split, stock dividend or other change in our capitalization.
101
Table of Contents
The shares of common stock underlying any awards that are forfeited, cancelled, held back upon exercise or settlement of an award to satisfy the exercise price or tax withholding, reacquired by us prior to vesting, satisfied without any issuance of stock, expire or are otherwise terminated (other than by exercise) under the 2012 Plan and 2010 Plan will be added back to the shares of common stock available for issuance under the 2012 Plan.
The 2012 Plan is administered by our compensation committee. Our compensation committee has full power to select, from among the individuals eligible for awards, the individuals to whom awards will be granted, to make any combination of awards to individuals, and to determine the specific terms and conditions of each award, subject to the provisions of the 2012 Plan. Individuals eligible to participate in the 2012 Plan will be those full- or part-time officers, employees, non-employee directors and other key persons (including consultants and prospective employees) as selected from time to time by our compensation committee in its discretion.
The 2012 Plan permits the granting of both options to purchase common stock intended to qualify as incentive stock options under Section 422 of the Code and options that do not so qualify. The option exercise price of each option will be determined by our compensation committee but may not be less than 100% of the fair market value of our common stock on the date of grant. The term of each option will be fixed by our compensation committee and may not exceed 10 years from the date of grant. Our compensation committee will determine at what time or times each option may be exercised.
Our compensation committee may award stock appreciation rights subject to such conditions and restrictions as we may determine. Stock appreciation rights entitle the recipient to shares of common stock, or cash, equal to the value of the appreciation in our stock price over the exercise price. The exercise price is the fair market value of the common stock on the date of grant.
Our compensation committee may award restricted shares of common stock and restricted stock units to participants subject to such conditions and restrictions as we may determine. These conditions and restrictions may include the achievement of certain performance goals and/or continued employment with us through a specified vesting period. Our compensation committee may also grant shares of common stock that are free from any restrictions under the 2012 Plan. Unrestricted stock may be granted to participants in recognition of past services or other valid consideration and may be issued in lieu of cash compensation due to such participant.
Our compensation committee may grant performance share awards to participants that entitle the recipient to receive shares of common stock upon the achievement of certain performance goals and such other conditions as our compensation committee shall determine.
Our compensation committee may grant cash bonuses under the 2012 Plan to participants, subject to the achievement of certain performance goals.
Our compensation committee may grant awards of restricted stock, restricted stock units, performance shares or cash-based awards under the 2012 Plan that are intended to qualify as “performance-based compensation” under Section 162(m) of the Code. Those awards would only vest or become payable upon the attainment of performance goals that are established by our compensation committee and related to one or more performance criteria. The performance criteria that would be used with respect to any such awards include: earnings before interest, taxes, depreciation and amortization; net income (loss) (either before or after interest, taxes, depreciation and/or amortization); changes in the market price of our common stock; economic value-added; funds from operations or similar measure; sales or revenue; acquisitions or strategic transactions; operating income (loss), cash flow (including, but not limited to, operating cash flow and free cash flow), return on capital, assets, equity, or investment; stockholder returns; return on sales; gross or net profit levels; productivity; expense; margins; operating efficiency; customer satisfaction; working capital; earnings (loss) per share of stock; sales or market shares and number of customers; any of which may be measured either in absolute terms or as compared to any incremental increase or as compared to results of a peer group. From and after the time that we become subject to Section 162(m) of the Code, the maximum award that is intended to qualify as
102
Table of Contents
“performance-based compensation” under Section 162(m) of the Code that may be made to any one employee during any one calendar year period is 1,500,000 shares of common stock with respect to a stock-based award and $2,000,000 with respect to a cash-based award.
The 2012 Plan provides that in the case of, and subject to, the consummation of a “sale event” as defined in the 2012 Plan, all outstanding awards will be assumed, substituted or otherwise continued by the successor entity. To the extent that the successor entity does not assume, substitute or otherwise continue such awards, then all stock options and stock appreciation rights will automatically become fully exercisable and the restrictions and conditions on all other awards with time-based conditions will automatically be deemed waived, and awards with conditions and restrictions relating to the attainment of performance goals may become vested and nonforfeitable in connection with a sale event in the Compensation Committee’s discretion and, upon the effectiveness of the sale event, all stock options and stock appreciation rights and other awards will automatically terminate. In the event of such termination, individuals holding options and stock appreciation rights will be permitted to exercise such options and stock appreciation rights prior to the sale event. In addition, in connection with a sale event, we may make or provide for a cash payment to participants holding options and stock appreciation rights equal to the difference between the per share cash consideration payable to stockholders in the sale event and the exercise price of the options or stock appreciation rights.
Our board of directors may amend or discontinue the 2012 Plan and our compensation committee may amend or cancel outstanding awards for purposes of satisfying changes in law or any other lawful purpose, but no such action may adversely affect rights under an individual’s award without the individual’s consent. Certain amendments to the 2012 Plan require the approval of our stockholders.
No awards may be granted under the 2012 Plan after the date that is 10 years from the date of stockholder approval.
Section 401(k) Plan
We maintain a tax-qualified retirement plan that provides eligible employees with an opportunity to save for retirement on a tax-advantaged basis. All participants’ interests in their contributions are 100% vested when contributed. Historically, we have not made any matching contributions to the Section 401(k) plan. Pre-tax contributions are allocated to each participant’s individual account and are then invested in selected investment alternatives according to the participants’ directions. The retirement plan is intended to qualify under Sections 401(a) and 501(a) of the Code.
103
Table of Contents
CERTAIN RELATIONSHIPS AND RELATED PERSON TRANSACTIONS
In addition to the director and executive officer compensation arrangements discussed above under “Compensation,” the following is a description of transactions, or series of related transactions, since January 1, 2010, to which we were or will be a party in which the amount involved exceeded or will exceed $120,000 and in which the other parties included or will include our directors, executive officers, holders of more than 5% of our voting securities, each a Beneficial Owner, or any member of the immediate family of any of the foregoing persons.
Private Placements of Securities
Series F Preferred Stock Financing
From December 2009 to November 2011, we sold 5,087,608 shares of our Series F preferred stock at a price of $11.45 per share for an aggregate price of $58,250,010. Of that amount, we sold 3,755,659 shares of our Series F preferred stock for an aggregate price of $43,000,004 to investors that were our affiliates at such time, including entities affiliated with Sequoia Capital, New Enterprise Associates, Agilus Ventures, T. Rowe Price and DAG Ventures.
Investors’ Rights Agreement
In December 2009, in connection with the initial closing of our Series F preferred stock financing, we entered into a Fourth Amended and Restated Investor’s Rights Agreement, which was subsequently amended, or Investor’s Rights Agreement, with the holders of our outstanding preferred stock, including entities with which certain of our directors are affiliated, and our co-founders. In February 2010, we entered into Amendment No. 1 to the Investors’ Rights Agreement, the Third Amended and Restated Voting Agreement and the Fourth Amended and Restated Right of First Refusal and Co-Sale Agreement, with new and existing holders of our preferred stock, including entities with which certain of our directors are affiliated, and our co-founders. As of June 30, 2013, after giving effect to the sale by existing holders of shares in this offering, the holders of shares of our common stock are entitled to rights with respect to the registration of their shares under the Securities Act. See “Description of Capital Stock—Registration Rights” for more information regarding these registration rights.
Right of First Refusal and Co-Sale Agreement
In December 2009, in connection with the initial closing of our Series F preferred stock financing, we entered into a Fourth Amended and Restated Right of First Refusal and Co-Sale Agreement, which was subsequently amended in February 2010, with the holders of our outstanding preferred stock, including entities with which certain of our directors are affiliated, and our co-founders, which imposed restrictions on the transfer of our capital stock. The right of first refusal and co-sale agreement terminated upon the closing of our initial public offering and the restrictions on the transfer of our capital stock set forth in this agreement no longer apply.
Voting Agreement
In December 2009, in connection with the initial closing of our Series F preferred stock financing, we entered into a Third Amended and Restated Voting Agreement, which was subsequently amended in February 2010, with the holders of our outstanding preferred stock, including entities with which certain of our directors are affiliated, and our co-founders, under which such parties agreed to vote their shares on certain matters, including with respect to the election of directors. The voting agreement terminated upon the closing of our initial public offering and none of our stockholders have any special rights regarding the election or designation of members of our board of directors or the voting of capital stock of the company.
104
Table of Contents
Transactions With Our Executive Officers, Directors and Beneficial Owners
Employment Agreements
We have entered into employment agreements with our executive officers. These agreements provide for severance benefits and acceleration of the vesting of stock options. See “Compensation—Employment Agreements and Termination of Employment Arrangements” for more information regarding these agreements.
Indemnification Agreements
We have entered into indemnification agreements governed by Delaware law with each of our directors and executive officers. These agreements require us to indemnify these individuals and, in certain cases, affiliates of such individuals, to the fullest extent permitted under Delaware law against liabilities that may arise by reason of their service to us, and to advance expenses incurred as a result of any proceeding against them as to which they could be indemnified.
Stock Option Awards
For information regarding stock option awards granted to our Named Executive Officers and directors, see “Compensation—Executive Compensation Design Overview,” “Compensation—Compensation Tables,” “Compensation—Employment Agreements and Termination of Employment Arrangements” and “Compensation—Director Compensation.”
Limitation of Liability and Indemnification of Officers and Directors
Our amended and restated certificate of incorporation contains provisions that limit the liability of our directors for monetary damages to the fullest extent permitted by Delaware law. Consequently, our directors will not be personally liable to us or our stockholders for monetary damages for any breach of fiduciary duties as directors, except liability for the following:
| • | any breach of their duty of loyalty to our company or our stockholders; |
| • | any act or omission not in good faith or that involves intentional misconduct or a knowing violation of law; |
| • | unlawful payments of dividends or unlawful stock repurchases or redemptions as provided in Section 174 of the Delaware General Corporation Law; or |
| • | any transaction from which they derived an improper personal benefit. |
Any amendment to, or repeal of, these provisions will not eliminate or reduce the effect of these provisions in respect of any act, omission or claim that occurred or arose prior to that amendment or repeal. If the Delaware General Corporation Law is amended to provide for further limitations on the personal liability of directors of corporations, then the personal liability of our directors will be further limited to the greatest extent permitted by the Delaware General Corporation Law.
In addition, our amended and restated bylaws provide that we will indemnify, to the fullest extent permitted by law, any person who is or was a party or is threatened to be made a party to any action, suit or proceeding by reason of the fact that he or she is or was one of our directors or officers or is or was serving at our request as a director or officer of another corporation, partnership, joint venture, trust, or other enterprise. Our amended and restated bylaws provide that we may indemnify to the fullest extent permitted by law any person who is or was a party or is threatened to be made a party to any action, suit, or proceeding by reason of the fact that he or she is or was one of our employees or agents or is or was serving at our request as an employee or agent of another corporation, partnership, joint venture, trust, or other enterprise. Our amended and restated bylaws also provide that we must advance expenses incurred by or on behalf of a director or officer in advance of the final disposition of any action or proceeding, subject to very limited exceptions.
105
Table of Contents
Further, we have entered into indemnification agreements with each of our directors and executive officers that may be broader than the specific indemnification provisions contained in the Delaware General Corporation Law. These indemnification agreements require us, among other things, to indemnify our directors and executive officers against liabilities that may arise by reason of their status or service. These indemnification agreements also require us to advance all expenses incurred by the directors and executive officers in investigating or defending any such action, suit, or proceeding. We believe that these agreements are necessary to attract and retain qualified individuals to serve as directors and executive officers.
The limitation of liability and indemnification provisions that are included in our amended and restated certificate of incorporation, amended and restated bylaws and indemnification agreements with our directors and executive officers may discourage stockholders from bringing a lawsuit against our directors and executive officers for breach of their fiduciary duties. They may also reduce the likelihood of derivative litigation against our directors and executive officers, even though an action, if successful, might benefit us and other stockholders. Further, a stockholder’s investment may be adversely affected to the extent that we pay the costs of settlement and damage awards against directors and executive officers as required by these indemnification provisions. At present, we are not aware of any pending litigation or proceeding involving any person who is or was one of our directors, officers, employees or other agents or is or was serving at our request as a director, officer, employee or agent of another corporation, partnership, joint venture, trust or other enterprise, for which indemnification is sought, and we are not aware of any threatened litigation that may result in claims for indemnification. We have obtained insurance policies under which, subject to the limitations of the policies, coverage is provided to our directors and executive officers against loss arising from claims made by reason of breach of fiduciary duty or other wrongful acts as a director or executive officer, including claims relating to public securities matters, and coverage is provided to us with respect to payments that may be made by us to these directors and executive officers pursuant to our indemnification obligations or otherwise as a matter of law.
Certain of our non-employee directors may, through their relationships with their employers, be insured and/ or indemnified against certain liabilities incurred in their capacity as members of our board of directors. The underwriting agreement provides for indemnification by the underwriters of us and our officers, directors and employees for certain liabilities arising under the Securities Act, or otherwise.
Insofar as indemnification for liabilities arising under the Securities Act may be permitted to directors, officers or persons controlling the company pursuant to the foregoing provisions, we have been informed that, in the opinion of the SEC, such indemnification is against public policy as expressed in the Securities Act and is therefore unenforceable.
Review, Approval and Ratification of Transactions with Related Parties
Our board of directors reviews and approves transactions with directors, officers and Beneficial Owners, each of whom is a related party. Prior to our board of directors’ consideration of a transaction with a related party, the material facts as to the related party’s relationship or interest in the transaction are disclosed to our board of directors, and the transaction will not be approved by our board of directors unless a majority of the directors who are not interested in the transaction approve the transaction. We have put into place a related party transactions policy which requires, among other items, that such transactions must be approved by our audit committee or another independent body of our board of directors.
106
Table of Contents
PRINCIPAL AND SELLING STOCKHOLDERS
The following table sets forth information with respect to the beneficial ownership of our common stock, as of June 30, 2013, the most recent practicable date, and as adjusted to reflect the sale of common stock offered by us and the selling stockholders in this offering, for:
| • | each beneficial owner of more than 5% of our outstanding common stock; |
| • | each of our Named Executive Officers and directors; |
| • | all of our executive officers and directors as a group; and |
| • | each of the selling stockholders. |
Beneficial ownership is determined in accordance with the rules of the SEC. These rules generally attribute beneficial ownership of securities to persons who possess sole or shared voting power or investment power with respect to those securities and include shares of common stock issuable upon the exercise of stock options that are immediately exercisable or exercisable within 60 days. Except as otherwise indicated, all of the shares reflected in the table are shares of common stock and all persons listed below have sole voting and investment power with respect to the shares beneficially owned by them, subject to applicable community property laws. The information is not necessarily indicative of beneficial ownership for any other purpose.
Percentage ownership calculations for beneficial ownership prior to this offering are based on 32,994,080 shares outstanding as of June 30, 2013. Percentage ownership calculations for beneficial ownership after this offering includes our sale of shares of common stock in this offering, and percentage ownership of our common stock after this offering assuming the full exercise of the underwriters’ option to purchase additional shares includes our sale of an additional shares of common stock in this offering. In both instances, we assume no purchases of shares by our executive officers, directors or 5% stockholders and no exercise of outstanding options after June 30, 2013. Except as otherwise indicated in the table below, addresses of named beneficial owners are in care of Xoom Corporation, 100 Bush Street, Suite 300, San Francisco, California 94104.
In computing the number of shares of common stock beneficially owned by a person and the percentage ownership of that person, we deemed outstanding shares of common stock subject to options held by that person that are currently exercisable or exercisable within 60 days of June 30, 2013. We did not deem these shares outstanding, however, for the purpose of computing the percentage ownership of any other person.
107
Table of Contents
| Shares Beneficially Owned Prior to the Offering |
Number
of Shares Being Offered in the Offering |
Shares Beneficially Owned After the Offering |
Number of Shares Being Offered in Option to Purchase Additional Shares |
Shares Beneficially Owned After this Offering if Option to Purchase Additional Shares is Exercised in Full | ||||||||||||||||
| Name of Beneficial Owner |
Shares | Percentage | Shares | Percentage | Shares | Percentage | ||||||||||||||
| Named Executive Officers and Directors: |
||||||||||||||||||||
| John Kunze(1) |
2,285,031 | 6.5 | % | |||||||||||||||||
| Ryno Blignaut(2) |
537,500 | 1.6 | % | |||||||||||||||||
| Julian King(3) |
533,813 | 1.6 | % | |||||||||||||||||
| Roelof Frederik Botha |
2,623 | * | ||||||||||||||||||
| Alison Davis(4) |
118,750 | * | ||||||||||||||||||
| Murray J. Demo(5) |
142,500 | * | ||||||||||||||||||
| Kevin E. Hartz(6) |
1,285,221 | 3.9 | % | |||||||||||||||||
| C. Richard Kramlich |
1,676 | * | ||||||||||||||||||
| Anne Mitchell |
1,757 | * | ||||||||||||||||||
| Keith Rabois(7) |
147,500 | * | ||||||||||||||||||
| Matthew Roberts(8) |
139,321 | * | ||||||||||||||||||
| All executive officers and directors as a Group (12 persons)(9) |
5,456,528 | 14.8 | % | |||||||||||||||||
| Other 5% or Greater Stockholders: |
||||||||||||||||||||
| Entities affiliated with Sequoia Capital(10) |
5,741,552 | 17.4 | % | |||||||||||||||||
| Entities affiliated with New Enterprise Associates(11) |
5,052,935 | 15.3 | % | |||||||||||||||||
| Entities affiliated with Agilus Ventures(12) |
3,487,102 | 10.6 | % | |||||||||||||||||
| Entities affiliated with T. Rowe Price(13) |
3,603,422 | 10.9 | % | |||||||||||||||||
| Entities affiliated with DAG Ventures(14) |
2,219,054 | 6.7 | % | |||||||||||||||||
| * | Represents beneficial ownership of less than 1% of the shares of common stock. |
| (1) | Includes options to purchase 2,247,531 shares of common stock that are exercisable within 60 days of June 30, 2013. |
| (2) | Includes options to purchase 537,500 shares of common stock that are exercisable within 60 days of June 30, 2013. |
| (3) | Includes options to purchase 423,750 shares of common stock that are exercisable within 60 days of June 30, 2013. |
| (4) | Includes options to purchase 118,750 shares of common stock that are exercisable within 60 days of June 30, 2013. |
| (5) | Includes options to purchase 142,500 shares of common stock that are exercisable within 60 days of June 30, 2013. |
| (6) | All shares are held by the Hartz Family Revocable Trust (or the Hartz Trust). Kevin E. Hartz, as a trustee, shares voting and dispositive power over the shares held by the Hartz Trust. |
| (7) | Includes options to purchase 95,000 shares of common stock that are exercisable within 60 days of June 30, 2013. |
108
Table of Contents
| (8) | Includes options to purchase 139,321 shares of common stock that are exercisable within 60 days of June 30, 2013. |
| (9) | Includes (i) 9,828,547 shares held of record by current directors and executive officers and (ii) options to purchase 3,865,188 shares of common stock that are exercisable within 60 days of June 30, 2013. |
| (10) | Includes (i) 5,036,306 shares held by Sequoia Capital XI, LP (ii) 545,439 shares held by Sequoia Capital XI Principals Fund, LLC and (iii) 159,807 shares held by Sequoia Technology Partners XI, LP (collectively, the Sequoia Capital Funds). SC XI Management, LLC is the general partner of Sequoia Capital XI, LP and Sequoia Technology Partners XI, LP and is the managing member of Sequoia Capital XI Principals Fund, LLC. The managing members of SC XI Management, LLC are Michael Goguen, Douglas Leone, and Michael Moritz. As a result, and by virtue of the relationships described in this footnote, each of the managing members of SC XI Management, LLC may be deemed to share beneficial ownership of the shares held by the Sequoia Capital Funds. Such individuals expressly disclaim any such beneficial ownership. The address of each of the entities identified in this footnote is 3000 Sand Hill Road, Suite 4-250, Menlo Park, California 94025. |
| (11) | Includes (i) 569,900 shares held of record by New Enterprise Associates 9, Limited Partnership (NEA 9), (ii) 4,478,770 shares held of record by New Enterprise Associates 11, Limited Partnership (NEA 11) and (iii) 4,265 shares held of record by NEA Ventures 2004, L.P. (NEA 2004). The shares held by NEA 9 are indirectly held by NEA Partners 9, Limited Partnership (NEA Partners 9), the sole general partner of NEA 9, and the individual general partners of NEA Partners 9. The individual general partners of NEA Partners 9 are Peter J. Barris and John M. Nehra. The shares directly held by NEA 11 are indirectly held by NEA Partners 11, Limited Partnership (NEA Partners 11), the sole general partner of NEA 11, NEA 11 GP, LLC (NEA 11 LLC), the sole general partner of NEA Partners 11 and each of the individual managers of NEA 11 LLC. The managers of NEA 11 LLC are M. James Barrett, Peter J. Barris, Forest Baskett, Ryan D. Drant, Krishna Kolluri, and Scott D. Sandell. The shares held by NEA 2004 are indirectly held by J. Daniel Moore, the general partner of NEA 2004. NEA Partners 9 and the individual general partners of NEA Partners 9 share voting and dispositive power with regard to the shares held by NEA 9. NEA Partners 11, NEA 11 LLC and the individual managers of NEA 11 LLC, share voting and dispositive power with regard to the shares held by NEA 11. J. Daniel Moore, the general partner of NEA 2004, has voting and dispositive power with regard to the shares held by NEA 2004. All of the above indirect owners disclaim beneficial ownership of such shares except to the extent of their pecuniary interest therein. The principal address of New Enterprise Associates, Inc. is 1954 Greenspring Drive, Suite 600, Timonium, Maryland 21093. |
| (12) | Includes (i) 3,126,701 shares held of record by Agilus Ventures IV Limited Partnership, (ii) 57,571 shares held of record by Agilus Ventures Principals IV Limited Partnership, (iii) 61,300 shares held of record by Fidelity Advisor Series I: Fidelity Advisor Equity Growth Fund, (iv) 16,800 shares held of record by Fidelity Hastings Street Trust: Fidelity Growth Discovery Fund, (v) 151,300 shares held of record by Fidelity Select Portfolios: IT Services Portfolio, and (vi) 73,430 shares held of record by Variable Insurance Products Fund: Growth Portfolio. Northern Neck Investors LLC, a Delaware limited liability company, is the ultimate general partner and investment adviser of Agilus Ventures IV Limited Partnership and Agilus Ventures Principals IV Limited Partnership, and is registered under Section 203 of the Investment Advisers Act of 1940. Northern Neck Investors LLC is owned, directly or indirectly, by various shareholders and employees of FMR LLC, including certain members of the family of Edward C. Johnson 3d. Fidelity Management & Research Company (Fidelity), a wholly-owned subsidiary of FMR LLC and an investment adviser registered under Section 203 of the Investment Advisers Act of 1940, is the beneficial owner of 302,830 shares as a result of acting as investment adviser to investment companies registered under Section 8 of the Investment Company Act of 1940 and described in clauses (iii) through (vi) above (the Fidelity Funds). Edward C. Johnson 3d and FMR LLC, through its control of Fidelity and the Fidelity Funds, each has sole power to dispose of the 302,830 shares owned by the Fidelity Funds. Members of the family of Edward C. Johnson 3d, Chairman of FMR LLC, are the predominant owners, directly or through trusts, of Series B voting common shares of FMR LLC, representing 49% of the voting power of FMR LLC. The Johnson family group and all other Series B shareholders have entered into a shareholders’ voting agreement under which all Series B voting common shares will be voted in accordance with the majority vote of Series B voting common shares. Accordingly, through their ownership of voting common shares and |
109
Table of Contents
| the execution of the shareholders’ voting agreement, members of the Johnson family may be deemed, under the Investment Company Act of 1940, to form a controlling group with respect to FMR LLC. Neither FMR LLC nor Edward C. Johnson 3d, chairman of FMR LLC, has the sole power to vote or direct the voting of the shares owned directly by the Fidelity Funds, which power resides with the Funds’ Boards of Trustees. Fidelity carries out the voting of the shares under written guidelines established by the Funds’ Boards of Trustees. The address for Fidelity is 245 Summer Street, Boston, Massachusetts 02210. |
| (13) | Certain T. Rowe Price mutual funds and institutional clients advised by T. Rowe Price Associates, Inc. held, in the aggregate, 3,603,422 shares of common stock. T. Rowe Price Associates, Inc. serves as investment adviser with power to direct investments and/or sole power to vote the securities owned by the T. Rowe Price entities. T. Rowe Price Investment Services, Inc., or TRPIS, a registered broker-dealer, is a subsidiary of T. Rowe Price Associates, Inc. TRPIS was formed primarily for the limited purpose of acting as the principal distributor of shares of the funds in the T. Rowe Price fund family. TRPIS does not engage in underwriting or market-making activities involving individual securities. T. Rowe Price provides brokerage services through this subsidiary primarily to complement the other services provided to shareholders of the T. Rowe Price funds. For purposes of reporting requirements of the Exchange Act, T. Rowe Price Associates, Inc. may be deemed to be the beneficial owner of all of the shares listed herein; however, T. Rowe Price Associates, Inc. expressly disclaims that it is, in fact, the beneficial owner of such securities. T. Rowe Price Associates, Inc. is a wholly-owned subsidiary of T. Rowe Price Group, Inc., which is a publicly-traded financial services holding company. The principal address of T. Rowe Price Associates, Inc. is 100 East Pratt Street, Baltimore, Maryland 21202. |
| (14) | Includes (i) 1,590,766 shares held of record by DAG Ventures III-QP, L.P., (ii) 283,941 shares held of record by DAG Ventures III-A, LLC, (iii) 170,364 shares held of record by DAG Ventures III-O, LLC, (iv) 149,639 shares held of record by DAG Ventures III, L.P., (v) 22,715 shares held of record by DAG Ventures III-Q, LLC and (vi) 1,629 shares held of record by DAG Ventures GP Fund III, LLC (collectively, DAG Ventures). John J. Cadeddu and R. Thomas Goodrich, as managing members of DAG Ventures Management III, LLC, the general partner of DAG Ventures III, L.P. and DAG Ventures III-QP, L.P., and the manager of DAG Ventures GP Fund III, LLC, DAG Ventures III-A, LLC and DAG Ventures III-Q, LLC, have sole voting and dispositive power with respect to the shares held by DAG Ventures. The principal address of DAG Ventures is 251 Lytton Avenue, Palo Alto, California 94301. |
110
Table of Contents
The following description summarizes certain important terms of our capital stock. Because it is only a summary, it does not contain all the information that may be important to you. For a complete description of the matters set forth in this “Description of Capital Stock,” you should refer to our amended and restated certificate of incorporation and amended and restated bylaws and investor rights agreement, which are included as exhibits to the registration statement of which this prospectus forms a part, and to the applicable provisions of Delaware law.
General
Our authorized capital stock consists of 500,000,000 shares of common stock, par value $0.0001 per share, and 25,000,000 shares of preferred stock, par value $0.0001 per share, all of which shares of preferred stock are undesignated.
As of June 30, 2013, 32,994,080 shares of our common stock were outstanding, held by 139 stockholders of record, and no shares of our preferred stock were outstanding. In addition, as of June 30, 2013, we had outstanding options to purchase 6,730,461 shares of our common stock under our 2010 and 2012 Plans, at a weighted average exercise price of $5.98 per share, 3,694,041 of which were vested and exercisable.
Common Stock
The holders of our common stock are entitled to one vote for each share held on all matters submitted to a vote of the stockholders. The holders of our common stock do not have any cumulative voting rights. Holders of our common stock are entitled to receive ratably any dividends declared by the board of directors out of funds legally available for that purpose, subject to any preferential dividend rights of any outstanding preferred stock. Our common stock has no preemptive rights, conversion rights or other subscription rights or redemption or sinking fund provisions.
In the event of our liquidation, dissolution or winding up, holders of our common stock will be entitled to share ratably in all assets remaining after payment of all debts and other liabilities and any liquidation preference of any outstanding preferred stock. The shares to be issued by us in this offering will be, when issued and paid for, validly issued, fully paid and non-assessable.
Preferred Stock
Our board of directors may, subject to any limitations prescribed by law, without stockholder approval, to issue from time to time up to an aggregate of 25,000,000 shares of preferred stock, in one or more series, each series to have such rights and preferences, including voting rights, dividend rights, conversion rights, redemption privileges and liquidation preferences as our board of directors determines. The rights of the holders of common stock will be subject to, and may be adversely affected by, the rights of holders of any preferred stock that may be issued in the future. Immediately prior to the closing of this offering, we will have no shares of preferred stock outstanding and we have no present plans to issue any shares of preferred stock.
Registration Rights
Upon the completion of this offering, the holders of an aggregate of shares of our common stock, including shares issuable upon the conversion of preferred stock or their permitted transferees, are entitled to rights with respect to the registration of these shares under the Securities Act. These rights are provided under the terms of the Investor’s Rights Agreement between us and the holders of these shares, and include demand registration rights, short-form registration rights and piggyback registration rights. All fees, costs and expenses of underwritten registrations will be borne by us and all selling expenses, including underwriting discounts and selling commissions, will be borne by the holders of the shares being registered.
111
Table of Contents
Demand Registration Rights. Upon the completion of this offering, the holders of an aggregate of shares of our common stock, including shares issuable upon the conversion of preferred stock or their permitted transferees, are entitled to demand registration rights. Under the terms of the Investor’s Rights Agreement, we will be required, upon the written request of holders of forty percent (40%) or more of these shares, to use our best efforts to file a registration statement and use reasonable, diligent efforts to effect the registration of all or a portion of these shares for public resale. We are required to effect only two registrations pursuant to this provision of the Investors’ Rights Agreement.
Short Form Registration Rights. Upon the completion of this offering, the holders of an aggregate of shares of our common stock, including shares issuable upon the conversion of preferred stock or their permitted transferees, are also entitled to short form registration rights. If we are eligible to file a registration statement on Form S-3, upon the written request of any of these holders to sell registrable securities at an aggregate price of at least $1,000,000, we will be required to use our best efforts to effect a registration of such shares. We are required to effect only two registrations in any twelve month period pursuant to this provision of the Investor’s Rights Agreement.
Piggyback Registration Rights. Upon the completion of this offering, the holders of an aggregate of shares of our common stock, including shares issuable upon the conversion of preferred stock or their permitted transferees, are entitled to piggyback registration rights. If we register any of our securities either for our own account or for the account of other security holders, the holders of these shares are entitled to include their shares in the registration. Subject to certain exceptions, we and the underwriters may limit the number of shares included in the underwritten offering if the underwriters believe that including these shares would adversely affect the offering.
Indemnification. Our Investor’s Rights Agreement contains customary cross-indemnification provisions, under which we are obligated to indemnify holders of registrable securities in the event of material misstatements or omissions in the registration statement attributable to us, and they are obligated to indemnify us for material misstatements or omissions attributable to them.
Expiration of Registration Rights. The registration rights granted under the Investor’s Rights Agreement will terminate on the fifth anniversary of the completion of our initial public offering.
Anti-Takeover Effects of Our Certificate of Incorporation and Bylaws and Delaware Law
Our certificate of incorporation and bylaws include a number of provisions that may have the effect of delaying, deferring or preventing another party from acquiring control of us and encouraging persons considering unsolicited tender offers or other unilateral takeover proposals to negotiate with our board of directors rather than pursue non-negotiated takeover attempts. These provisions include the items described below.
Board Composition and Filling Vacancies. Our certificate of incorporation provides for the division of our board of directors into three classes serving staggered three-year terms, with one class being elected each year. Our certificate of incorporation also provides that directors may be removed only for cause and then only by the affirmative vote of the holders of 66 2/3% or more of the shares then entitled to vote at an election of directors. Furthermore, any vacancy on our board of directors, however occurring, including a vacancy resulting from an increase in the size of our board, may only be filled by the affirmative vote of a majority of our directors then in office even if less than a quorum. The classification of directors, together with the limitations on removal of directors and treatment of vacancies, has the effect of making it more difficult for stockholders to change the composition of our board of directors.
No Written Consent of Stockholders. Our certificate of incorporation provides that all stockholder actions are required to be taken by a vote of the stockholders at an annual or special meeting, and that stockholders may not take any action by written consent in lieu of a meeting. This limit may lengthen the amount of time required to take stockholder actions and would prevent the amendment of our bylaws or removal of directors by our stockholders without holding a meeting of stockholders.
112
Table of Contents
Meetings of Stockholders. Our certificate of incorporation and bylaws provide that only a majority of the members of our board of directors then in office may call special meetings of stockholders and only those matters set forth in the notice of the special meeting may be considered or acted upon at a special meeting of stockholders. Our bylaws limit the business that may be conducted at an annual meeting of stockholders to those matters properly brought before the meeting.
Advance Notice Requirements. Our bylaws establish advance notice procedures with regard to stockholder proposals relating to the nomination of candidates for election as directors or new business to be brought before meetings of our stockholders. These procedures provide that notice of stockholder proposals must be timely given in writing to our corporate secretary prior to the meeting at which the action is to be taken. Generally, to be timely, notice must be received at our principal executive offices not less than 90 days nor more than 120 days prior to the first anniversary date of the annual meeting for the preceding year. Our bylaws specify the requirements as to form and content of all stockholders’ notices. These requirements may preclude stockholders from bringing matters before the stockholders at an annual or special meeting.
Amendment to Certificate of Incorporation and Bylaws. Any amendment of our certificate of incorporation must first be approved by a majority of our board of directors, and if required by law or our certificate of incorporation, must thereafter be approved by a majority of the outstanding shares entitled to vote on the amendment and a majority of the outstanding shares of each class entitled to vote thereon as a class, except that the amendment of the provisions relating to stockholder action, board composition, limitation of liability and the amendment of our certificate of incorporation must be approved by not less than 66 2/3% of the outstanding shares entitled to vote on the amendment, and not less than 66 2/3% of the outstanding shares of each class entitled to vote thereon as a class. Our bylaws may be amended by the affirmative vote of a majority of the directors then in office, subject to any limitations set forth in the bylaws; and may also be amended by the affirmative vote of at least 66 2/3% of the outstanding shares entitled to vote on the amendment, or, if our board of directors recommends that the stockholders approve the amendment, by the affirmative vote of the majority of the outstanding shares entitled to vote on the amendment, in each case voting together as a single class.
Undesignated Preferred Stock. Our certificate of incorporation provides for 25,000,000 authorized shares of preferred stock. The existence of authorized but unissued shares of preferred stock may enable our board of directors to render more difficult or to discourage an attempt to obtain control of us by means of a merger, tender offer, proxy contest or otherwise. For example, if in the due exercise of its fiduciary obligations, our board of directors were to determine that a takeover proposal is not in the best interests of our stockholders, our board of directors could cause shares of preferred stock to be issued without stockholder approval in one or more private offerings or other transactions that might dilute the voting or other rights of the proposed acquirer or insurgent stockholder or stockholder group. In this regard, our certificate of incorporation grants our board of directors broad power to establish the rights and preferences of authorized and unissued shares of preferred stock. The issuance of shares of preferred stock could decrease the amount of earnings and assets available for distribution to holders of shares of common stock. The issuance may also adversely affect the rights and powers, including voting rights, of these holders and may have the effect of delaying, deterring or preventing a change in control of us.
Section 203 of the Delaware General Corporation Law
We are subject to the provisions of Section 203 of the Delaware General Corporation Law. In general, Section 203 prohibits a publicly held Delaware corporation from engaging in a “business combination” with an “interested stockholder” for a three-year period following the time that this stockholder becomes an interested stockholder, unless the business combination is approved in a prescribed manner. Under Section 203, a business combination between a corporation and an interested stockholder is prohibited unless it satisfies one of the following conditions:
| • | before the stockholder became interested, our board of directors approved either the business combination or the transaction which resulted in the stockholder becoming an interested stockholder; |
113
Table of Contents
| • | upon consummation of the transaction which resulted in the stockholder becoming an interested stockholder, the interested stockholder owned at least 85% of the voting stock of the corporation outstanding at the time the transaction commenced, excluding for purposes of determining the voting stock outstanding, shares owned by persons who are directors and also officers, and employee stock plans, in some instances, but not the outstanding voting stock owned by the interested stockholder; or |
| • | at or after the time the stockholder became interested, the business combination was approved by our board of directors and authorized at an annual or special meeting of the stockholders by the affirmative vote of at least two-thirds of the outstanding voting stock which is not owned by the interested stockholder. |
Section 203 defines a business combination to include:
| • | any merger or consolidation involving the corporation and the interested stockholder; |
| • | any sale, transfer, lease, pledge or other disposition involving the interested stockholder of 10% or more of the assets of the corporation; |
| • | subject to exceptions, any transaction that results in the issuance of transfer by the corporation of any stock of the corporation to the interested stockholder; |
| • | subject to exceptions, any transaction involving the corporation that has the effect of increasing the proportionate share of the stock of any class or series of the corporation beneficially owned by the interested stockholder; and |
| • | the receipt by the interested stockholder of the benefit of any loans, advances, guarantees, pledges or other financial benefits provided by or through the corporation. |
In general, Section 203 defines an interested stockholder as any entity or person beneficially owning 15% or more of the outstanding voting stock of the corporation and any entity or person affiliated with or controlling or controlled by the entity or person.
Exchange Listing
Our common stock is listed on the NASDAQ Global Select Market under the trading symbol “XOOM.”
Transfer Agent and Registrar
The transfer agent and registrar for our common stock is Wells Fargo Bank, N.A. The transfer agent and registrar’s address is Wells Fargo Shareowner Services, 1110 Centre Pointe Curve, Suite 101, Mendota Heights, Minnesota 55120.
114
Table of Contents
SHARES ELIGIBLE FOR FUTURE SALE
Future sales of substantial amounts of shares of our common stock, including shares issued upon the exercise of outstanding options, in the public market after this offering, or the perception that such sales may occur, could adversely affect the market price of our common stock.
Upon completion of this offering, we will have outstanding an aggregate of shares of common stock, assuming no exercise of the underwriters’ option to purchase additional shares and no exercise of outstanding stock options, except for those to be exercised and sold in connection with this offering. Of these shares, all shares of common stock sold in this offering by us and the selling stockholders and all 7,273,750 shares of common stock sold in our initial public offering will be freely tradable without restriction or further registration under the Securities Act, except for any shares held by our “affiliates,” as that term is defined in Rule 144 under the Securities Act, whose sales would be subject to certain limitations and restrictions described below. The remaining shares of common stock held by existing stockholders will be restricted securities as that term is defined in Rule 144 under the Securities Act. Restricted securities may be sold in the public market only if registered or it they qualify for exemption under Rules 144 or 701 under the Securities Act, which rules are summarized below, or another exemption.
As a result of the lock-up agreements described below and the provisions of Rule 144 and Rule 701 under the Securities Act, the shares of our common stock (excluding the shares sold in this offering) that will be available for sale in the public market are as follows:
| Date of Availability of Sale |
Approximate Number of Shares | |
| As of the date of this prospectus |
||
| At various times beginning more than 60 days after the date of this prospectus, although a portion of such shares held by our affiliates will be subject to volume limitations pursuant to Rule 144 |
Stock Plans
We filed a registration statement on Form S-8 under the Securities Act to register shares that may be issued pursuant to our 2010 Plan and our 2012 Plan, and shares covered by the registration statement are now eligible for sale in the open market, subject to the Rule 144 limitations applicable to affiliates, vesting restrictions and any applicable lock-up agreements and market standoff agreements.
Lock-Up Agreements
We, our executive officers and directors and the selling stockholders have agreed with the underwriters, subject to certain exceptions, not to dispose of or hedge any of their common stock or securities convertible into or exchangeable for shares of common stock during the period from the date of this prospectus continuing through the date 60 days after the date of this prospectus, except with the prior written consent of Barclays Capital Inc. and the company. This consent may be given at any time. There are no agreements between Barclays Capital Inc., the company and any of our securityholders or affiliates releasing them from these lock-up agreements prior to the expiration of the 60-day period.
Rule 144
In general, under Rule 144, a person who is not our affiliate and has not been our affiliate at any time during the preceding three months and who is not a party to a lock-up agreement as described above will be entitled to sell any shares of our common stock that such person has beneficially owned for at least six months, including the holding period of any prior owner other than one of our affiliates, without regard to volume limitations. These sales of our common stock by any such person would be subject to the availability of current public information about us if the shares to be sold were beneficially owned by such person for less than one year.
115
Table of Contents
In addition, under Rule 144, a person may sell shares of our common stock acquired from us immediately upon the closing of this offering, without regard to volume limitations or the availability of public information about us, if:
| • | the person is not our affiliate and has not been our affiliate at any time during the preceding three months; and |
| • | the person has beneficially owned the shares to be sold for at least one year, including the holding period of any prior owner other than one of our affiliates. |
Our affiliates who have beneficially owned shares of our common stock for at least six months, including the holding period of any prior owner other than one of our affiliates, are entitled to sell within any three-month period a number of shares that does not exceed the greater of:
| • | 1% of the number of shares of our common stock then outstanding, which will equal approximately shares immediately after this offering; and |
| • | the average weekly trading volume in our common stock on the NASDAQ Global Select Market during the four calendar weeks preceding the date of filing of a Notice of Proposed Sale of Securities Pursuant to Rule 144 with respect to the sale. |
Sales under Rule 144 by our affiliates are also subject to manner of sale provisions and notice requirements and to the availability of current public information about us.
Rule 701
In general, under Rule 701, any of our employees, directors, officers, consultants or advisors who purchase shares from us in connection with a compensatory stock or option plan or other written agreement before the effective date of this offering is entitled to sell such shares 90 days after the effective date of this offering in reliance on Rule 144, without having to comply with the holding period requirements of Rule 144 and, in the case of non-affiliates, without having to comply with the holding period, public information, volume limitation or notice filing provisions of Rule 144.
Registration Rights
Upon the completion of this offering, the holders of shares of our common stock are entitled to rights with respect to the registration of such shares under the Securities Act. Upon the effectiveness of a registration statement covering these shares, the shares would become freely tradable. See “Description of Capital Stock Registration Rights.”
116
Table of Contents
CERTAIN MATERIAL U.S. FEDERAL INCOME TAX CONSIDERATIONS
The following is a summary of certain material U.S. federal income tax considerations relating to the acquisition, ownership and disposition of our common stock issued pursuant to this offering. This summary deals only with common stock held as a capital asset by a stockholder, and does not discuss the U.S. federal income tax considerations applicable to a stockholder that is subject to special treatment under U.S. federal income tax laws, including: a dealer in securities or currencies; a financial institution; a regulated investment company; a real estate investment trust; a tax-exempt organization; an insurance company; a person holding common stock as part of a hedging, integrated, conversion or straddle transaction or a person deemed to sell common stock under the constructive sale provisions of the Code; a trader in securities that has elected the mark-to-market method of accounting; an entity that is treated as a partnership for U.S. federal income tax purposes; a person that received such common stock in connection with services provided to the company or any of its affiliates; a U.S. person whose “functional currency” is not the U.S. dollar; a “controlled foreign corporation”; a “passive foreign investment company”; or a U.S. expatriate.
This summary is based upon provisions of the Code, and applicable regulations, rulings and judicial decisions in effect as of the date hereof. Those authorities may be changed, perhaps retroactively, or may be subject to differing interpretations, so as to result in U.S. federal income tax consequences different from those discussed below. No assurance can be given that the Internal Revenue Service, or IRS, would not assert, or that a court would not sustain, a position contrary to any of the tax consequences described below. We have not sought and will not seek an advance ruling from the IRS regarding any matter discussed herein. This summary does not address all aspects of U.S. federal income tax, does not deal with all tax considerations that may be relevant to stockholders in light of their personal circumstances and does not address any state, local, foreign, gift, estate or alternative minimum tax considerations.
For purposes of this discussion, a “U.S. holder” is a beneficial holder of common stock that is: an individual citizen or resident of the United States for U.S. federal income tax purposes; a corporation (or any other entity treated as a corporation for U.S. federal income tax purposes) created or organized in or under the laws of the United States, any state thereof or the District of Columbia; an estate the income of which is subject to U.S. federal income taxation regardless of its source; a trust if it (1) is subject to the primary supervision of a court within the United States and one or more U.S. persons have the authority to control all substantial decisions of the trust or (2) has a valid election in effect under applicable U.S. Treasury regulations to be treated as a U.S. person.
For purposes of this discussion, a “non-U.S. holder” is a beneficial holder of common stock (other than a partnership or any other entity or arrangement that is treated as a partnership for U.S. federal income tax purposes) that is not a U.S. holder.
If a partnership (or an entity or arrangement that is treated as a partnership for U.S. federal income tax purposes) holds common stock, the tax treatment of a partner will generally depend upon the status of the partner and the activities of the partnership. A partner of a partnership holding common stock is particularly urged to consult its own tax advisors.
Holders of common stock are urged to consult their own tax advisors concerning their particular U.S. federal income tax consequences in light of their specific situations, as well as the tax consequences arising under the laws of any other taxing jurisdiction, including any state, local and foreign income and other tax laws.
117
Table of Contents
U.S. Holders
The following discussion is a summary of certain U.S. federal income tax considerations relevant to a U.S. holder of common stock.
Distributions. Distributions with respect to common stock, if any, will be includible in the gross income of a U.S. holder as ordinary dividend income to the extent paid out of current or accumulated earnings and profits, as determined for U.S. federal income tax purposes. Any portion of a distribution in excess of current or accumulated earnings and profits would be treated as a return of the holder’s adjusted tax basis in its common stock (to the extent thereof) and as such would not be taxable to a U.S. holder. To the extent that such distribution exceeds the adjusted tax basis of a U.S. holder’s common stock, such excess will be taxable as capital gain from the sale or exchange of the common stock. If certain requirements are met (including certain holding period requirements), any dividends paid to a holder of common stock who is a U.S. individual will generally be subject to U.S. federal income tax at favorable capital gain rates applicable to the individual. Treatment of dividends as long term capital gain will not apply to dividends received to the extent that the U.S. holder elects to treat dividends as “investment income,” which may be offset by investment expense.
Distributions constituting dividends for U.S. federal income tax purposes that are paid to U.S. holders that are corporate stockholders may qualify for the 70% dividends received deduction, or DRD, which is generally available to corporate stockholders that own less than 20% of the voting power or value of the outstanding stock of the distributing corporation. A U.S. holder that is a corporate stockholder holding 20% or more of the distributing corporation (by vote and value) may be eligible for an 80% DRD with respect to any such dividends. No assurance can be given that we will have sufficient earnings and profits (as determined for U.S. federal income tax purposes) to cause any distributions to be treated as dividends eligible for a DRD. In addition, a DRD is available only if certain other requirements are satisfied, and a DRD may be subject to limitations in certain circumstances, which are not discussed here.
Sale, Exchange, Redemption or Certain Other Taxable Dispositions of our Common Stock. A U.S. holder of common stock will generally recognize gain or loss on the taxable sale, exchange, redemption (provided the redemption is treated as a sale or exchange), or other taxable disposition of such stock in an amount equal to the difference between such U.S. holder’s amount realized on the sale and its tax basis in the common stock sold. A U.S. holder’s amount realized should equal the amount of cash and the fair market value of any property received in consideration of its stock. The gain or loss will be capital gain or loss, and will be long-term capital gain or loss if the common stock is held for more than one year at the time of disposition. Capital loss can generally only be used to offset capital gain (individuals may also offset excess capital losses against up to $3,000 of ordinary income per tax year). In general, long-term capital gain recognized by an individual U.S. holder is subject to U.S. federal income tax at favorable capital gain rates applicable to the individual. Any gain recognized by a U.S. holder of common stock will be short-term capital gain and will be taxed at ordinary income rates if the stock is held for one year or less at the time of disposition.
If a stockholder recognizes a loss upon a disposition of common stock in an amount that exceeds a prescribed threshold, it is possible that the provisions of Treasury Regulations involving “reportable transactions” could apply, with a resulting requirement to separately disclose the loss-generating transaction to the IRS. These regulations, though directed towards “tax shelters,” are broadly written, and apply to transactions that would not typically be considered tax shelters. The Code imposes significant penalties for failure to comply with these requirements. Stockholders should consult their own tax advisors concerning any possible disclosure obligation with respect to the receipt or disposition of the common stock.
New Medicare Tax Legislation. An additional 3.8% Medicare tax will be imposed on certain net investment income of certain U.S. stockholders that are individuals, estates and trusts that do not fall into a special class of trusts that is exempt from such tax to the extent that such person’s “modified adjusted gross income” (in the case of an individual) or “adjusted gross income” (in the case of an estate or trust) exceeds a threshold amount. Net investment income generally includes dividends and net gains from the disposition of our common stock, unless
118
Table of Contents
such dividend or net gains are derived in the ordinary course of the conduct of a trade or business (other than a trade or business that consists of certain passive or trading activities). U.S. stockholders that are individuals, estates or trusts should consult their tax advisors regarding the effect, if any, of the Medicare Tax on their ownership and disposition of our common stock.
Information Reporting and Backup Withholding Tax. When required, we or our paying agent will report to our U.S. holders and the IRS the amounts paid on or with respect to our common stock during each calendar year, and the amount of any tax withheld from such payments. Under U.S. federal income tax law, dividends and proceeds from the sale of our common stock may, under certain circumstances, be subject to “backup” withholding at the then applicable rate. Backup withholding generally applies to a U.S. holder if the holder (i) fails to furnish to us or our paying agent a correct social security number or other taxpayer identification number, or TIN, or fails to furnish a certification of exempt status, (ii) has been notified by the IRS that it is subject to backup withholding as a result of the failure to properly report payments of interest or dividends or (iii) under certain circumstances, fails to provide a certified statement, signed under penalty of perjury, that the TIN provided is its correct number and that it is a U.S. person that is not subject to backup withholding. A U.S. holder may be eligible for an exemption from backup withholding by providing a properly completed IRS Form W-9 to us or our paying agent. Backup withholding is not an additional tax but merely an advance payment, which may be refunded to the extent it results in an overpayment of tax and the appropriate information is supplied to the IRS. Certain U.S. persons are exempt from backup withholding, including corporations, and in certain circumstances, financial institutions.
Non-U.S. Holders
The following is a summary of certain U.S. federal tax considerations applicable to a non-U.S. holder of common stock.
Distributions. Distributions treated as dividends for U.S. federal income tax purposes that are paid to a non-U.S. holder, if any, with respect to shares of common stock will be subject to U.S. federal withholding tax at a 30% rate (or lower applicable income tax treaty rate) unless the dividends are effectively connected with the non-U.S. holder’s conduct of a trade or business in the United States. If a non-U.S. holder is engaged in a trade or business in the United States and dividends with respect to the common stock are effectively connected with the conduct of that trade or business and, if required by an applicable income tax treaty, are attributable to a U.S. permanent establishment or fixed base, then the non-U.S. holder will be subject to U.S. federal income tax on those dividends on a net income basis in the same manner as if received by a U.S. person as defined under the Code (although the dividends will be exempt from the 30% U.S. federal withholding tax, provided certain certification requirements are satisfied). Any such effectively connected income received by a foreign corporation may, under certain circumstances, be subject to an additional branch profits tax at a 30% rate (or lower applicable income tax treaty rate). To claim the exemption from withholding with respect to any such effectively connected income, the non-U.S. holder must generally furnish to us or our transfer agent a properly executed IRS Form W-8ECI (or applicable successor form).
A non-U.S. holder who wishes to claim the benefit of an exemption or reduced rate of U.S. federal withholding tax under an applicable treaty must furnish to us or our transfer agent a valid IRS Form W-8BEN (or applicable successor form) certifying such holder’s qualification for the exemption or reduced rate. If a non-U.S. holder is eligible for a reduced rate of U.S. federal withholding tax pursuant to an income tax treaty, it may obtain a refund of any excess amounts withheld by filing an appropriate claim for refund with the IRS.
A non-U.S. holder will not incur tax on a distribution in excess of our current and accumulated earnings and profits if the excess portion of the distribution does not exceed the adjusted basis of the non-U.S. holder’s common stock. Instead, the excess portion of the distribution will reduce the adjusted basis of that stock. A non-U.S. holder will be subject to tax on a distribution that exceeds both our current and accumulated earnings and profits and the adjusted basis of its stock, if the non-U.S. stockholder otherwise would be subject to tax on gain
119
Table of Contents
from the sale or disposition of its stock, as described below. If we are not able to determine whether or not a distribution will exceed current and accumulated earnings and profits at the time the distribution is made, we may withhold tax on the entire amount of any distribution at the same rate as we would withhold on a dividend. However, a non-U.S. holder may obtain a refund of amounts that we withhold to the extent that the distribution in fact exceeded our current and accumulated earnings and profits.
Sale, Exchange, Redemption or Certain Other Taxable Dispositions of Our Common Stock. Non-U.S. holders may recognize gain upon the sale, exchange, redemption (provided the redemption is treated as a sale or exchange) or other taxable disposition of common stock. Such gain generally will not be subject to U.S. federal income tax unless: (i) the gain is effectively connected with the conduct of a trade or business in the United States (and, if required by an applicable income tax treaty, is attributable to a U.S. permanent establishment or a fixed base), by a non-U.S. holder; (ii) the non-U.S. holder is a non-resident alien individual who is present in the United States for 183 days or more in the taxable year of that disposition, and certain other conditions are met; or (iii) we are or have been a “U.S. real property holding corporation” for U.S. federal income tax purposes. We believe that we are not and we do not anticipate becoming a “U.S. real property holding corporation” for U.S. federal income tax purposes.
If a non-U.S. holder is an individual described in clause (i) of the preceding paragraph, the non-U.S. holder will generally be subject to tax on the net gain at regular graduated U.S. federal income tax rates. If the non-U.S. holder is an individual described in clause (ii) of the preceding paragraph, the non-U.S. holder will generally be subject to a flat 30% tax on the gain, which may be offset by U.S. source capital losses even though the non-U.S. holder is not considered a resident of the United States. If a non-U.S. holder is a foreign corporation that falls under clause (i) of the preceding paragraph, it will be subject to tax on its net gain in the same manner as if it were a U.S. person as defined under the Code and, in addition, the non-U.S. holder may be subject to the branch profits tax at a rate equal to 30% of its effectively connected earnings and profits or at such lower rate as may be specified by an applicable income tax treaty. If a non-U.S. holder is eligible for the benefits of a tax treaty between the United States and its country of residence, any gain will be subject to U.S. federal income tax in the manner specified by the treaty. To claim the benefit of a treaty, a non-U.S. holder must properly submit an IRS Form W-8BEN (or suitable successor or substitute form).
Information Reporting and Backup Withholding Tax. When required, we or our paying agent will report to our non-U.S. holders of common stock and the IRS the amounts paid on or with respect to our common stock during each calendar year, and the amount of any tax withheld. These information reporting requirements apply even if no withholding was required because the distributions were effectively connected with the non-U.S. holder’s conduct of a United States trade or business, or withholding was reduced or eliminated by an applicable income tax treaty. This information also may be made available under a specific treaty or agreement with the tax authorities in the country in which the non-U.S. holder resides or is established. Backup withholding, however, generally will not apply to distributions to a non-U.S. holder of our common stock provided the non-U.S. holder furnishes to us or our transfer agent the required certification as to its non-U.S. status, such as by providing a valid IRS Form W-8BEN or IRS Form W-8ECI, or certain other requirements are met. Notwithstanding the foregoing, backup withholding may apply if either we or our transfer agent has actual knowledge, or reason to know, that the holder is a U.S. person that is not an exempt recipient. Any amounts withheld under the backup withholding rules will be allowed as a refund or a credit against a holder’s U.S. federal income tax liability provided the required information is provided to the IRS.
Foreign Account Tax Compliance Act
Under the Foreign Account Tax Compliance Act, or FATCA, a 30% withholding tax will generally apply to dividends on, or gross proceeds from the sale or other disposition of, common stock paid to a foreign financial institution unless the foreign financial institution enters into an agreement with the U.S. Treasury to, among other things, undertake to identify accounts held by certain U.S. persons or U.S.-owned foreign entities, annually report certain information about such accounts, and withhold 30% on payments to account holders whose actions
120
Table of Contents
prevent it from complying with these reporting and other requirements. In addition, FATCA imposes a 30% withholding tax on the same types of payments to a foreign non-financial entity unless the entity certifies that it does not have any substantial U.S. owners or furnishes identifying information regarding each substantial U.S. owner. Such payments would include U.S.-source dividends and the gross proceeds from the sale or other disposition of stock that can produce U.S.-source dividends. By its terms, FATCA generally applies to payments of dividends on, or gross proceeds from the sale or disposition of, common stock made after December 31, 2012. However, the Treasury Department and the IRS have issued guidance that defers the application of FATCA’s withholding obligations to payments of dividends made on or after July 1, 2014, and payments of gross proceeds made on or after January 1, 2017.
Investors should consult their tax advisors regarding the possible impact of the FATCA rules on their investment in our common stock, including, without limitation, the process and deadlines for meeting the applicable requirements to prevent the imposition of the 30% withholding tax under FATCA.
121
Table of Contents
We, the selling stockholders and the underwriters named below have entered into an underwriting agreement with respect to the shares being offered. Subject to certain conditions, each underwriter has severally agreed to purchase the number of shares indicated in the following table. Barclays Capital Inc. is the representative of the underwriters.
| Underwriters |
Number of Shares | |
| Barclays Capital Inc. |
||
| Needham & Company, LLC |
||
| Total |
The underwriters are committed to take and pay for all of the shares being offered by us and the selling stockholders, if any are taken, other than the shares covered by the option described below unless and until this option is exercised.
If the underwriters sell more shares than the total number set forth in the table above, the underwriters have an option to buy up to an additional shares from us. They may exercise that option for 30 days. If any shares are purchased pursuant to this option, the underwriters will severally purchase shares in approximately the same proportion as set forth in the table above.
The following table shows the per share and total underwriting discounts and commissions to be paid to the underwriters by us and the selling stockholders. Such amounts are shown assuming both no exercise and full exercise of the underwriters’ option to purchase additional shares.
Paid by the Company
| No Exercise | Full Exercise | |||||||
| Per Share |
$ | $ | ||||||
| Total |
$ | $ | ||||||
Paid by the Selling Stockholders
| No Exercise | Full Exercise | |||||||
| Per Share |
$ | $ | ||||||
| Total |
$ | $ | ||||||
Shares sold by the underwriters to the public will initially be offered at the offering price set forth on the cover of this prospectus. Any shares sold by the underwriters to securities dealers may be sold at a discount of up to $ per share from the offering price. After the offering of the shares, the representative may change the offering price and the other selling terms. The offering of the shares by the underwriters is subject to receipt and acceptance and subject to the underwriters’ right to reject any order in whole or in part.
We, our executive officers and directors and the selling stockholders have agreed with the underwriters, subject to certain exceptions, not to dispose of or hedge any of their common stock or securities convertible into or exchangeable for shares of common stock during the period from the date of this prospectus continuing through the date 60 days after the date of this prospectus, except with the prior written consent of the representative and the company. There are no agreements between the representative and any of our stockholders or affiliates releasing them from these lock-up agreements prior to the expiration of the 60-day period. See “Shares Eligible for Future Sale” for a discussion of certain transfer restrictions.
Our common stock is listed on the NASDAQ Global Select Market under the symbol “XOOM.”
122
Table of Contents
In connection with the offering, the underwriters may purchase and sell shares of common stock in the open market. These transactions may include short sales, stabilizing transactions and purchases to cover positions created by short sales. Short sales involve the sale by the underwriters of a greater number of shares than they are required to purchase in the offering and a short position represents the amount of such sales that have not been covered by subsequent purchases. A “covered short position” is a short position that is not greater than the amount of additional shares for which the underwriters’ option described above may be exercised. The underwriters may cover any covered short position by either exercising their option to purchase additional shares or purchasing shares in the open market. In determining the source of shares to cover the covered short position, the underwriters will consider, among other things, the price of shares available for purchase in the open market as compared to the price at which they may purchase additional shares pursuant to the option described above. “Naked” short sales are any short sales that create a short position greater than the amount of additional shares for which the option described above may be exercised. The underwriters must cover any naked short position by purchasing shares in the open market. A naked short position is more likely to be created if the underwriters are concerned that there may be downward pressure on the price of the common stock in the open market after pricing that could adversely affect investors who purchase in the offering. Stabilizing transactions consist of various bids for or purchases of common stock made by the underwriters in the open market prior to the completion of the offering.
The underwriters may also impose a penalty bid. This occurs when a particular underwriter repays to the underwriters a portion of the underwriting discount received by it because the representative has repurchased shares sold by or for the account of such underwriter in stabilizing or short covering transactions.
Purchases to cover a short position and stabilizing transactions, as well as other purchases by the underwriters for their own accounts, may have the effect of preventing or retarding a decline in the market price of our stock, and together with the imposition of the penalty bid, may stabilize, maintain or otherwise affect the market price of the common stock. As a result, the price of the common stock may be higher than the price that otherwise might exist in the open market. The underwriters are not required to engage in these activities and may end any of these activities at any time. These transactions may be effected on the NASDAQ Global Select Market, in the over-the-counter market or otherwise.
In the ordinary course of our business, we have an agreement with Barclays Bank PLC, the parent entity of one of our underwriters, Barclays Capital Inc. Pursuant to this agreement, Barclays Bank PLC acts as our disbursement partner for money transfers to the U.K. and for providing these services. The expenses we have incurred in connection with the agreement with Barclays Bank PLC have been non-material.
A prospectus in electronic format may be made available on web sites maintained by one or more underwriters. Other than the prospectus in electronic format, the information on any underwriter’s web site and any information contained in any other web site maintained by an underwriter is not part of the prospectus or the registration statement of which the prospectus forms a part.
We estimate that the total expenses of the offering, excluding underwriting discounts and commissions, will be approximately $ million.
We will pay all such expenses. We and the selling stockholders have agreed to indemnify the several underwriters against certain liabilities, including liabilities under the Securities Act.
The underwriters and their respective affiliates are full service financial institutions engaged in various activities, which may include sales and trading, commercial and investment banking, advisory, investment management, investment research, principal investment, hedging, market making, brokerage and other financial and non-financial activities and services. Certain of the underwriters and their respective affiliates have provided, and may in the future provide, a variety of these services to us and to persons and entities with relationships with us, for which they received or will receive customary fees and expenses.
123
Table of Contents
In the ordinary course of their various business activities, the underwriters and their respective affiliates, officers, directors and employees may purchase, sell or hold a broad array of investments and actively traded securities, derivatives, loans, commodities, currencies, credit default swaps and other financial instruments (including bank loans) for their own account and for the accounts of their customers, and such investment and trading activities may involve or relate to assets, securities and/or instruments of the issuer (directly, as collateral securing other obligations or otherwise) and/or persons and entities with relationships with the issuer. The underwriters and their respective affiliates may also communicate independent investment recommendations, market color or trading ideas and/or publish or express independent research views in respect of such assets, securities or instruments and may at any time hold, or recommend to clients that they should acquire, long and/or short positions in such assets, securities and instruments.
Passive Market Making
In connection with the offering, underwriters and selling group members may engage in passive market making transactions in the common stock on the NASDAQ Global Select Market in accordance with Rule 103 of Regulation M under the Exchange Act during the period before the commencement of offers or sales of common stock and extending through the completion of distribution. A passive market maker must display its bids at a price not in excess of the highest independent bid of the security. However, if all independent bids are lowered below the passive market maker’s bid, that bid must be lowered when specified purchase limits are exceeded.
European Economic Area
In relation to each Member State of the European Economic Area which has implemented the Prospectus Directive (each, a Relevant Member State), each underwriter has represented and agreed that with effect from and including the date on which the Prospectus Directive is implemented in that Relevant Member State (the Relevant Implementation Date) it has not made and will not make an offer of shares to the public in that Relevant Member State prior to the publication of a prospectus in relation to the shares which has been approved by the competent authority in that Relevant Member State or, where appropriate, approved in another Relevant Member State and notified to the competent authority in that Relevant Member State, all in accordance with the Prospectus Directive, except that it may, with effect from and including the Relevant Implementation Date, make an offer of shares to the public in that Relevant Member State at any time:
(a) to legal entities which are authorized or regulated to operate in the financial markets or, if not so authorized or regulated, whose corporate purpose is solely to invest in securities;
(b) to any legal entity which has two or more of (1) an average of at least 250 employees during the last financial year; (2) a total balance sheet of more than €43,000,000 and (3) an annual net turnover of more than €50,000,000, as shown in its last annual or consolidated accounts;
(c) to fewer than 100 natural or legal persons (other than qualified investors as defined in the Prospectus Directive) subject to obtaining the prior consent of the representative for any such offer; or
(d) in any other circumstances which do not require the publication by us of a prospectus pursuant to Article 3 of the Prospectus Directive.
For the purposes of this provision, the expression an “offer of shares to the public” in relation to any shares in any Relevant Member State means the communication in any form and by any means of sufficient information on the terms of the offer and the shares to be offered so as to enable an investor to decide to purchase or subscribe for the shares, as the same may be varied in that Relevant Member State by any measure implementing the Prospectus Directive in that Relevant Member State and the expression Prospectus Directive means Directive 2003/71/EC and includes any relevant implementing measure in each Relevant Member State.
124
Table of Contents
United Kingdom
Each underwriter has represented and agreed that:
| (a) | it has only communicated or caused to be communicated and will only communicate or cause to be communicated an invitation or inducement to engage in investment activity (within the meaning of Section 21 of the FSMA) received by it in connection with the issue or sale of the shares in circumstances in which Section 21(1) of the FSMA does not apply to us; and |
| (b) | it has complied and will comply with all applicable provisions of the FSMA with respect to anything done by it in relation to the shares in, from or otherwise involving the United Kingdom. |
Hong Kong
The shares may not be offered or sold by means of any document other than (i) in circumstances which do not constitute an offer to the public within the meaning of the Companies Ordinance (Cap. 32, Laws of Hong Kong), or (ii) to “professional investors” within the meaning of the Securities and Futures Ordinance (Cap. 571, Laws of Hong Kong) and any rules made thereunder, or (iii) in other circumstances which do not result in the document being a “prospectus” within the meaning of the Companies Ordinance (Cap. 32, Laws of Hong Kong), and no advertisement, invitation or document relating to the shares may be issued or may be in the possession of any person for the purpose of issue (in each case whether in Hong Kong or elsewhere), which is directed at, or the contents of which are likely to be accessed or read by, the public in Hong Kong (except if permitted to do so under the laws of Hong Kong) other than with respect to shares which are or are intended to be disposed of only to persons outside Hong Kong or only to “professional investors” within the meaning of the Securities and Futures Ordinance (Cap. 571, Laws of Hong Kong) and any rules made thereunder.
Singapore
This prospectus has not been registered as a prospectus with the Monetary Authority of Singapore. Accordingly, this prospectus and any other document or material in connection with the offer or sale, or invitation for subscription or purchase, of the shares may not be circulated or distributed, nor may the shares be offered or sold, or be made the subject of an invitation for subscription or purchase, whether directly or indirectly, to persons in Singapore other than (i) to an institutional investor under Section 274 of the Securities and Futures Act, Chapter 289 of Singapore, or the SFA, (ii) to a relevant person, or any person pursuant to Section 275(1A), and in accordance with the conditions, specified in Section 275 of the SFA or (iii) otherwise pursuant to, and in accordance with the conditions of, any other applicable provision of the SFA.
Where the shares are subscribed or purchased under Section 275 by a relevant person which is: (a) a corporation (which is not an accredited investor) the sole business of which is to hold investments and the entire share capital of which is owned by one or more individuals, each of whom is an accredited investor; or (b) a trust (where the trustee is not an accredited investor) whose sole purpose is to hold investments and each beneficiary is an accredited investor, shares, debentures and units of shares and debentures of that corporation or the beneficiaries’ rights and interest in that trust shall not be transferable for 6 months after that corporation or that trust has acquired the shares under Section 275 except: (1) to an institutional investor under Section 274 of the SFA or to a relevant person, or any person pursuant to Section 275(1A), and in accordance with the conditions, specified in Section 275 of the SFA; (2) where no consideration is given for the transfer; or (3) by operation of law.
125
Table of Contents
Japan
The securities have not been and will not be registered under the Financial Instruments and Exchange Law of Japan (the Financial Instruments and Exchange Law) and each underwriter has agreed that it will not offer or sell any securities, directly or indirectly, in Japan or to, or for the benefit of, any resident of Japan (which term as used herein means any person resident in Japan, including any corporation or other entity organized under the laws of Japan), or to others for re-offering or resale, directly or indirectly, in Japan or to a resident of Japan, except pursuant to an exemption from the registration requirements of, and otherwise in compliance with, the Financial Instruments and Exchange Law and any other applicable laws, regulations and ministerial guidelines of Japan.
126
Table of Contents
The validity of the shares of common stock offered by this prospectus will be passed upon for us by Goodwin Procter LLP, Menlo Park, California. Certain legal matters will be passed upon for the underwriters by Gibson, Dunn & Crutcher LLP, San Francisco, California.
The consolidated financial statements of Xoom Corporation and its subsidiary as of December 31, 2011 and 2012, and for each of the years in the three-year period ended December 31, 2012, have been included herein in reliance upon the report of KPMG LLP, independent registered public accounting firm, appearing elsewhere herein, and upon the authority of said firm as experts in accounting and auditing.
WHERE YOU CAN FIND MORE INFORMATION
We filed a registration statement on Form S-1 with the SEC with respect to the registration of the common stock offered for sale with this prospectus. This prospectus does not contain all of the information set forth in the registration statement and the exhibits to the registration statement. For further information about us, the common stock we are offering by this prospectus and related matters, you should review the registration statement, including the exhibits filed as a part of the registration statement. Statements contained in this prospectus about the contents of any contract or any other document that is filed as an exhibit to the registration statement are not necessarily complete, and we refer you to the full text of the contract or other document filed as an exhibit to the registration statement. A copy of the registration statement and the exhibits that were filed with the registration statement may be inspected without charge at the public reference facilities maintained by the SEC at 100 F Street, N.E., Washington, D.C. 20549, and copies of all or any part of the registration statement may be obtained from the Securities and Exchange Commission upon payment of the prescribed fee. Information on the operation of the public reference facilities may be obtained by calling the SEC at 1-800-SEC-0330. The SEC maintains a website that contains reports, proxy and information statements, and other information regarding registrants that file electronically with the SEC. The address of the site is http://www.sec.gov.
We are subject to the information and periodic reporting requirements of the Exchange Act, and, in accordance with such requirements, file periodic reports, proxy statements, and other information with the SEC. These periodic reports, proxy statements, and other information are available for inspection and copying at the regional offices, public reference facilities, and web site of the SEC referred to above. We also maintain a website at http://www.xoom.com. You may access our annual reports on Form 10-K, quarterly reports on Form 10-Q, current reports on Form 8-K and amendments to those reports filed or furnished pursuant to Section 13(a) or 15(d) of the Exchange Act with the SEC free of charge at our website as soon as reasonably practicable after such material is electronically filed with, or furnished to, the SEC. The information contained in, or that can be accessed through, our website is not part of this prospectus.
127
Table of Contents
Index to the Consolidated Financial Statements
F-1
Table of Contents
Report of Independent Registered Public Accounting Firm
The Board of Directors and Stockholders
Xoom Corporation:
We have audited the accompanying consolidated balance sheets of Xoom Corporation and subsidiary (the Company) as of December 31, 2011 and 2012, and the related consolidated statements of operations, comprehensive income (loss), stockholders’ equity and cash flows for each of the years in the three-year period ended December 31, 2012. These consolidated financial statements are the responsibility of the Company’s management. Our responsibility is to express an opinion on these consolidated financial statements based on our audits.
We conducted our audits in accordance with the standards of the Public Company Accounting Oversight Board (United States). Those standards require that we plan and perform the audit to obtain reasonable assurance about whether the financial statements are free of material misstatement. An audit includes examining, on a test basis, evidence supporting the amounts and disclosures in the financial statements. An audit also includes assessing the accounting principles used and significant estimates made by management, as well as evaluating the overall financial statement presentation. We believe that our audits provide a reasonable basis for our opinion.
In our opinion, the consolidated financial statements referred to above present fairly, in all material respects, the financial position of the Company as of December 31, 2011 and 2012, and the results of their operations and their cash flows for each of the years in the three-year period ended December 31, 2012, in conformity with U.S. generally accepted accounting principles.
/s/ KPMG LLP
San Francisco, California
February 1, 2013 except for Note 13 which is as of August 9, 2013
F-2
Table of Contents
Consolidated Balance Sheets
(in Thousands, Except Share and Per Share Data)
| December 31, | ||||||||
| 2011 | 2012 | |||||||
| Assets |
||||||||
| Current assets: |
||||||||
| Cash and cash equivalents |
$ | 48,248 | $ | 45,077 | ||||
| Disbursement prefunding |
9,004 | 15,070 | ||||||
| Short-term investments |
20,385 | 25,125 | ||||||
| Customer funds receivable |
17,187 | 9,318 | ||||||
| Prepaid expenses and other current assets |
1,328 | 4,934 | ||||||
|
|
|
|
|
|||||
| Total current assets |
96,152 | 99,524 | ||||||
| Non-current assets: |
||||||||
| Property, equipment and software, net |
2,185 | 3,884 | ||||||
| Restricted cash |
1,730 | 9,337 | ||||||
| Other assets |
123 | 348 | ||||||
|
|
|
|
|
|||||
| Total assets |
$ | 100,190 | $ | 113,093 | ||||
|
|
|
|
|
|||||
| Liabilities and Stockholders’ Equity |
||||||||
| Current liabilities: |
||||||||
| Accounts payable and accrued expenses |
$ | 5,137 | $ | 7,150 | ||||
| Customer liabilities |
8,192 | 8,536 | ||||||
| Line of credit |
26,500 | 15,000 | ||||||
|
|
|
|
|
|||||
| Total current liabilities |
39,829 | 30,686 | ||||||
| Non-current liabilities: |
||||||||
| Non-current portion of line of credit |
— | 25,000 | ||||||
| Other non-current liabilities |
— | 87 | ||||||
|
|
|
|
|
|||||
| Total liabilities |
39,829 | 55,773 | ||||||
|
|
|
|
|
|||||
| Stockholders’ equity: |
||||||||
| Convertible preferred stock, $0.0001 par value. Authorized 86,726,665 shares at December 31, 2011 and 2012; issued and outstanding 21,444,251 shares at December 31, 2011 and 2012; aggregate liquidation preference $115,404 at December 31, 2011 and 2012 |
2,144 | 2,144 | ||||||
| Common stock, $0.0001 par value. Authorized 135,000,000 shares at December 31, 2011 and 2012; issued and outstanding 5,027,249 and 5,083,616 shares at December 31, 2011 and 2012, respectively |
503 | 508 | ||||||
| Additional paid-in capital |
115,236 | 118,035 | ||||||
| Accumulated other comprehensive income (loss) |
(10 | ) | (1 | ) | ||||
| Accumulated deficit |
(57,512 | ) | (63,366 | ) | ||||
|
|
|
|
|
|||||
| Total stockholders’ equity |
60,361 | 57,320 | ||||||
|
|
|
|
|
|||||
| Total liabilities and stockholders’ equity |
$ | 100,190 | $ | 113,093 | ||||
|
|
|
|
|
|||||
See accompanying notes to consolidated financial statements.
F-3
Table of Contents
Consolidated Statements of Operations
(in Thousands, Except Per Share Data)
| Year Ended December 31, | ||||||||||||
| 2010 | 2011 | 2012 | ||||||||||
| Revenue |
$ | 32,837 | $ | 50,020 | $ | 80,016 | ||||||
| Cost of revenue |
12,231 | 18,075 | 26,779 | |||||||||
|
|
|
|
|
|
|
|||||||
| Gross profit |
20,606 | 31,945 | 53,237 | |||||||||
|
|
|
|
|
|
|
|||||||
| Marketing |
11,608 | 14,314 | 21,496 | |||||||||
| Technology and development |
6,046 | 9,431 | 15,950 | |||||||||
| Customer service and operations |
5,257 | 7,321 | 10,964 | |||||||||
| General and administrative |
3,728 | 4,957 | 9,135 | |||||||||
|
|
|
|
|
|
|
|||||||
| Total operating expense |
26,639 | 36,023 | 57,545 | |||||||||
|
|
|
|
|
|
|
|||||||
| Loss from operations |
(6,033 | ) | (4,078 | ) | (4,308 | ) | ||||||
| Other income (expense): |
||||||||||||
| Interest expense |
(108 | ) | (370 | ) | (1,504 | ) | ||||||
| Interest income |
44 | 29 | 85 | |||||||||
| Other income (expense) |
140 | 49 | (125 | ) | ||||||||
|
|
|
|
|
|
|
|||||||
| Loss before provision for income taxes |
(5,957 | ) | (4,370 | ) | (5,852 | ) | ||||||
| Provision for income taxes |
2 | 2 | 2 | |||||||||
|
|
|
|
|
|
|
|||||||
| Net loss |
$ | (5,959 | ) | $ | (4,372 | ) | $ | (5,854 | ) | |||
|
|
|
|
|
|
|
|||||||
| Basic and diluted net loss per share |
$ | (1.25 | ) | $ | (0.88 | ) | $ | (1.16 | ) | |||
|
|
|
|
|
|
|
|||||||
| Weighted-average shares used to compute per share amounts – basic and diluted |
4,752 | 4,956 | 5,049 | |||||||||
|
|
|
|
|
|
|
|||||||
See accompanying notes to consolidated financial statements.
F-4
Table of Contents
Consolidated Statements of Comprehensive Income (Loss)
(in Thousands)
| Year Ended December 31, | ||||||||||||
| 2010 | 2011 | 2012 | ||||||||||
| Net loss |
$ | (5,959 | ) | $ | (4,372 | ) | $ | (5,854 | ) | |||
| Other comprehensive (loss) income |
||||||||||||
| Unrealized (loss) gain on marketable securities, net of taxes |
— | (11 | ) | 9 | ||||||||
|
|
|
|
|
|
|
|||||||
| Other comprehensive (loss) income |
— | (11 | ) | 9 | ||||||||
|
|
|
|
|
|
|
|||||||
| Total comprehensive loss |
$ | (5,959 | ) | $ | (4,383 | ) | $ | (5,845 | ) | |||
|
|
|
|
|
|
|
|||||||
See accompanying notes to consolidated financial statements.
F-5
Table of Contents
Consolidated Statements of Stockholders’ Equity
(in Thousands, Except Share Data)
| Convertible Preferred Stock |
Common Stock | Additional Paid-in Capital |
Accumulated Other Comprehensive Income (loss) |
Accumulated Deficit |
Total Shareholders’ Equity |
|||||||||||||||||||||||||||
| Shares | Amount | Shares | Amount | |||||||||||||||||||||||||||||
| Balance at December 31, 2009 |
17,383,535 | $ | 1,738 | 4,726,723 | $ | 472 | $ | 70,393 | $ | 1 | $ | (47,181 | ) | $ | 25,423 | |||||||||||||||||
| Issuance of preferred stock |
1,593,971 | 160 | — | — | 17,326 | — | — | 17,486 | ||||||||||||||||||||||||
| Exercise of preferred stock warrants |
283,223 | 28 | — | — | 968 | — | — | 996 | ||||||||||||||||||||||||
| Exercise of common stock options |
— | — | 166,964 | 17 | 144 | — | — | 161 | ||||||||||||||||||||||||
| Stock-based compensation |
— | — | — | — | 550 | — | — | 550 | ||||||||||||||||||||||||
| Total comprehensive loss |
— | — | — | — | — | — | (5,959 | ) | (5,959 | ) | ||||||||||||||||||||||
|
|
|
|
|
|
|
|
|
|
|
|
|
|
|
|
|
|||||||||||||||||
| Balance at December 31, 2010 |
19,260,729 | 1,926 | 4,893,687 | 489 | 89,381 | 1 | (53,140 | ) | 38,657 | |||||||||||||||||||||||
|
|
|
|
|
|
|
|
|
|
|
|
|
|
|
|
|
|||||||||||||||||
| Issuance of preferred stock, net of issuance costs |
2,183,522 | 218 | — | — | 24,764 | — | — | 24,982 | ||||||||||||||||||||||||
| Exercise of common stock options |
— | — | 118,116 | 12 | 144 | — | — | 156 | ||||||||||||||||||||||||
| Exercise of common stock warrants |
— | — | 15,446 | 2 | 1 | — | — | 3 | ||||||||||||||||||||||||
| Settlement of common stock warrants |
— | — | — | — | (3 | ) | — | — | (3 | ) | ||||||||||||||||||||||
| Stock-based compensation |
— | — | — | — | 949 | — | — | 949 | ||||||||||||||||||||||||
| Total comprehensive loss |
— | — | — | — | — | (11 | ) | (4,372 | ) | (4,383 | ) | |||||||||||||||||||||
|
|
|
|
|
|
|
|
|
|
|
|
|
|
|
|
|
|||||||||||||||||
| Balance at December 31, 2011 |
21,444,251 | 2,144 | 5,027,249 | 503 | 115,236 | (10 | ) | (57,512 | ) | 60,361 | ||||||||||||||||||||||
|
|
|
|
|
|
|
|
|
|
|
|
|
|
|
|
|
|||||||||||||||||
| Issuance costs for preferred stock |
— | — | — | — | (6 | ) | — | — | (6 | ) | ||||||||||||||||||||||
| Exercise of common stock options |
— | — | 56,367 | 5 | 141 | — | — | 146 | ||||||||||||||||||||||||
| Stock-based compensation |
— | — | — | — | 2,445 | — | — | 2,445 | ||||||||||||||||||||||||
| Issuance of common stock warrants |
— | — | — | — | 219 | — | — | 219 | ||||||||||||||||||||||||
| Total comprehensive income (loss) |
— | — | — | — | — | 9 | (5,854 | ) | (5,845 | ) | ||||||||||||||||||||||
|
|
|
|
|
|
|
|
|
|
|
|
|
|
|
|
|
|||||||||||||||||
| Balance at December 31, 2012 |
21,444,251 | $ | 2,144 | 5,083,616 | $ | 508 | $ | 118,035 | $ | (1 | ) | $ | (63,366 | ) | $ | 57,320 | ||||||||||||||||
|
|
|
|
|
|
|
|
|
|
|
|
|
|
|
|
|
|||||||||||||||||
See accompanying notes to consolidated financial statements.
F-6
Table of Contents
Consolidated Statements of Cash Flows
(in Thousands)
| Year Ended December 31, | ||||||||||||
| 2010 | 2011 | 2012 | ||||||||||
| Cash flows from operating activities: |
||||||||||||
| Net loss |
$ | (5,959 | ) | $ | (4,372 | ) | $ | (5,854 | ) | |||
| Adjustments to reconcile net loss to net cash used in operating activities: |
||||||||||||
| Stock-based compensation |
550 | 949 | 2,445 | |||||||||
| Depreciation and amortization |
276 | 548 | 1,495 | |||||||||
| Loss on disposal of property and equipment |
1 | 92 | 2 | |||||||||
| Discount/premium on investments |
338 | 223 | 517 | |||||||||
| Amortization of warrant issuance costs |
— | — | 73 | |||||||||
| Changes in operating assets and liabilities: |
||||||||||||
| Disbursement prefunding |
(617 | ) | (2,281 | ) | (6,066 | ) | ||||||
| Customer funds receivable |
(2,989 | ) | (13,023 | ) | 7,869 | |||||||
| Prepaid expenses and other current assets |
(169 | ) | (406 | ) | (2,797 | ) | ||||||
| Other assets |
(12 | ) | 70 | (189 | ) | |||||||
| Customer liabilities |
398 | 4,148 | 344 | |||||||||
| Transaction loss reserves |
(788 | ) | 479 | (227 | ) | |||||||
| Accounts payable and accrued expenses |
659 | 1,513 | 1,551 | |||||||||
| Other non-current liabilities |
— | — | 87 | |||||||||
|
|
|
|
|
|
|
|||||||
| Net cash used in operating activities |
(8,312 | ) | (12,060 | ) | (750 | ) | ||||||
|
|
|
|
|
|
|
|||||||
| Cash flows from investing activities: |
||||||||||||
| Purchase of property, equipment and software |
(894 | ) | (1,735 | ) | (3,206 | ) | ||||||
| Purchase of short-term investments |
(30,651 | ) | (23,131 | ) | (37,470 | ) | ||||||
| Proceeds from sales and maturities of short-term investments |
20,178 | 14,742 | 32,222 | |||||||||
| Change in restricted cash |
(1,020 | ) | (150 | ) | (7,607 | ) | ||||||
|
|
|
|
|
|
|
|||||||
| Net cash used in investing activities |
(12,387 | ) | (10,274 | ) | (16,061 | ) | ||||||
|
|
|
|
|
|
|
|||||||
| Cash flows from financing activities: |
||||||||||||
| Net proceeds from issuance of preferred stock |
17,486 | 24,982 | (6 | ) | ||||||||
| Proceeds from exercise of preferred stock warrants |
996 | — | — | |||||||||
| Proceeds from exercise of common stock options |
161 | 156 | 146 | |||||||||
| Net borrowings under line of credit |
900 | 24,750 | 13,500 | |||||||||
|
|
|
|
|
|
|
|||||||
| Net cash provided by financing activities |
19,543 | 49,888 | 13,640 | |||||||||
|
|
|
|
|
|
|
|||||||
| Net increase (decrease) in cash and cash equivalents |
(1,156 | ) | 27,554 | (3,171 | ) | |||||||
| Cash and cash equivalents, beginning of year |
21,850 | 20,694 | 48,248 | |||||||||
|
|
|
|
|
|
|
|||||||
| Cash and cash equivalents, end of year |
$ | 20,694 | $ | 48,248 | $ | 45,077 | ||||||
|
|
|
|
|
|
|
|||||||
| Supplemental disclosures of cash flow information: |
||||||||||||
| Cash paid for taxes |
$ | 2 | $ | 2 | $ | 2 | ||||||
| Cash paid for interest |
$ | 162 | $ | 443 | $ | 1,659 | ||||||
| Purchases of property and equipment in accounts payable and accrued expenses |
$ | 17 | $ | 56 | $ | 46 | ||||||
| Deferred offering costs not yet paid |
$ | — | $ | — | $ | 699 | ||||||
| Issuance of common stock warrants |
$ | — | $ | — | $ | 219 | ||||||
F-7
Table of Contents
Notes to Consolidated Financial Statements
(1) Organization and Description of Business
Xoom Corporation and its subsidiary (together, Xoom or the Company) is a pioneer and leader in the digital consumer-to-consumer international money transfer industry. Xoom’s customers send money to family and friends in 30 countries.
Xoom was formed on June 15, 2001 and the Company’s corporate headquarters are located in San Francisco, California.
(2) Summary of Significant Accounting Policies
(a) Principles of Consolidation
The accompanying consolidated financial statements include the accounts of Xoom and its wholly-owned subsidiary. All significant intercompany accounts and transactions have been eliminated.
(b) Use of Estimates
The preparation of consolidated financial statements is in conformity with accounting principles generally accepted in the United States of America (GAAP). This requires management to make estimates and assumptions that affect the reported amounts of assets and liabilities and disclosures of contingent assets and liabilities at the date of the financial statements and the reported amounts of revenue and expenses during the reporting period. Significant items subject to such estimates and assumptions include, but are not limited to, reserve for transaction losses, valuation of stock-based compensation, fair value of marketable securities, certain accrued expenses and realizability of deferred tax assets. Actual results could differ from those estimates.
(c) Capital Structure
On December 7, 2012, the Board approved a 1-for-4 reverse stock split of the Company’s preferred stock and common stock to be effective prior to the effectiveness of the registration statement for the Company’s initial public offering. Upon the reverse stock split, every four shares of outstanding preferred stock and common stock will decrease to one share of preferred stock and common stock, respectively, the number of shares of common stock into which each outstanding option and warrant to purchase common stock is exercisable will decrease on a 1-for-4 basis and the exercise price of each outstanding option and warrant to purchase common stock will proportionately increase. All of the share numbers, share prices and exercise prices have been adjusted within the consolidated financial statements, on a retroactive basis, to reflect this 1-for-4 reverse stock split.
On December 7, 2012, the Board also approved the Company’s Amended and Restated Certificate of Incorporation to be effective immediately prior to the closing of the Company’s initial public offering. Under the Amended and Restated Certificate of Incorporation, authorized capital stock will consist of 500,000,000 shares of common stock, par value $0.0001 per share, and 25,000,000 shares of preferred stock, par value $0.0001 per share, all of which shares of preferred stock will be undesignated.
(d) Segments
The Company’s chief operating decision maker (CODM), its Chief Executive Officer, reviews financial information for the Company on a consolidated basis. The Company manages its business on the basis of one operating segment. The Company’s principal operations and decision-making functions are located in the United States.
F-8
Table of Contents
Xoom Corporation
Notes to Consolidated Financial Statements
(e) Revenue Recognition
The Company recognizes revenue when (i) persuasive evidence of an arrangement exists, (ii) services have been rendered to the customer, (iii) the fee is fixed or determinable and (iv) collectability is reasonably assured. The Company’s revenue is derived from transaction fees charged to customers and foreign exchange spreads on transactions where the payout currency is other than U.S. dollars. Revenue is derived from each transaction and may vary based on the size of the transaction, the funding method used, the currency to be ultimately disbursed and the countries to which the funds are transferred. Revenue is recognized when the transaction is processed by the Company and is net of cancellations and refunds.
(f) Cost of Revenue
Cost of revenue includes fees paid to disbursement partners for paying funds to the recipient and fees paid to payment processors for funding transactions. In addition, cost of revenue includes provisions for transaction losses and the costs of certain promotional activities to acquire new customers.
(g) Reserve for Transaction Losses
The Company is exposed to transaction losses due to fraud, as well as nonperformance of third parties and customers. The Company establishes reserves for such losses based on historical trends and any specific risks identified in processing customer transactions. Recoveries are reflected as a reduction in the reserve for transaction losses when the recovery occurs. This reserve is included in accounts payable and accrued expenses on the accompanying consolidated balance sheets. The following table summarizes the Company’s reserve for transaction losses for the following years (in thousands):
| Balance at Beginning of Year |
Additions to Expense |
Losses Incurred |
Balance at End of Year |
|||||||||||||
| December 31, 2010 |
$ | 1,084 | $ | 1,823 | $ | (2,611 | ) | $ | 296 | |||||||
| December 31, 2011 |
296 | 5,372 | (4,894 | ) | 774 | |||||||||||
| December 31, 2012 |
774 | 7,722 | (7,949 | ) | 547 | |||||||||||
During 2010, the Company revised the percentage with which it was recording its reserve, which resulted in a reduction of $0.9 million in the provision for transaction losses in the accompanying consolidated statements of operations. This revision was a result of lower than expected transaction losses. This revision was accounted for as a change in estimate.
(h) Marketing
Marketing expense consists of business development costs, television, print, online and promotional advertising, as well as employee compensation and related costs to support the marketing process. The Company expenses advertising costs in the period in which they are incurred. Advertising costs amounted to $9.4 million, $11.6 million and $17.9 million for the years ended December 31, 2010, 2011 and 2012, respectively.
During 2011, the Company introduced a new Refer-A-Friend incentive program where the referrer receives either a cash-type or non-cash award and the referee receives a non-cash award. Cash-type awards are considered to be cash-type because the referrer could use them as cash. The amount related to the referee is classified as cost of revenue for non-cash awards. Awards provided to the referrer are recorded in marketing expense as these payments are a reward for bringing a new customer to Xoom.
F-9
Table of Contents
Xoom Corporation
Notes to Consolidated Financial Statements
(i) Technology and Development
Technology and development expense includes employee compensation and related costs, professional services and consulting expenses, costs associated with the development of new technologies and the enhancement of existing technologies and amortization of capitalized internally developed software.
(j) Customer Service and Operations
Customer service and operations expense includes costs for outsourced customer call centers, compensation for the Company’s employees who support customer service calls, costs incurred for fraud detection, compliance operations and maintenance costs related to the Company’s outsourced customer call centers.
(k) Stock-Based Compensation
Stock-based compensation expense is measured at the grant date based on the fair value of the award and is recognized on a straight-line basis over the requisite service period of the award, which is the vesting period.
(l) Net Loss Per Share
Basic net loss per share is computed by dividing the net loss by the weighted-average number of shares of common stock outstanding during the period. Diluted net loss per share is computed by giving effect to all potential shares of common stock, including stock options, warrants and convertible preferred stock, to the extent dilutive. Due to net losses for all the years presented, basic and diluted loss per share were the same, as the effect of potentially dilutive securities would have been anti-dilutive.
(m) Cash and Cash Equivalents
Cash equivalents consist of highly liquid short-term investments with original maturities of three months or less at the time of purchase.
(n) Restricted Cash
The Company has relationships with certain payment processors. These processors are responsible for processing the Company’s ACH and credit card payments and are distinct from the Company’s disbursement partners discussed in Note 2 (p) below. These processors require the Company to maintain certain restricted cash balances as collateral throughout the term of the processor arrangement. During 2012, the Company integrated a new ACH payment processor and increased the gross sending volume with an existing ACH payment processor which required the Company to restrict an additional $7.0 million of its cash as collateral.
The Company is also required to maintain a restricted cash balance in connection with its license to operate in India. In accordance with the licensing rules in India, this balance is legally restricted and is held at a large financial institution in India. During 2012, the Company was required to restrict an additional $600,000 of its cash as collateral in India.
(o) Disbursement Prefunding
The Company maintains relationships with disbursement partners in various countries. These partners are responsible for disbursing funds to recipients and are distinct from the payment processors discussed in Note 2(o) above. The Company maintains prefunding balances with these disbursement partners so they are able to satisfy the Company’s customer liabilities. The Company does not earn interest on these balances. The balances are not compensating balances and are not legally restricted.
F-10
Table of Contents
Xoom Corporation
Notes to Consolidated Financial Statements
(p) Short-term Investments
Short-term investments consist of certificates of deposit, commercial paper, corporate bonds, U.S. Treasury and Agency Notes with original maturities of 12 months or less. All of the Company’s short-term investments other than certificates of deposit are accounted for as marketable securities and are considered to be available-for-sale and are recorded at fair value. Unrealized gains and losses are recorded as part of other comprehensive income (loss). Realized gains and losses and declines in value judged to be other-than-temporary on available-for-sale securities and credit losses are recorded in interest income in the consolidated statements of operations when incurred. Gains and losses on sale of securities are determined on the specific-identification method. The Company’s certificates of deposit are accounted for as a cash deposit with an original maturity in excess of 90 days and are recorded as a short-term investment.
(q) Customer Funds Receivable
When customers fund their transactions using their bank accounts or credit or debit cards, there is a clearing period before the cash is received from the payment processors by the Company, usually one to two business days. Hence, these funds are treated as a receivable until the cash is received by the Company. The Company does not maintain a reserve for doubtful accounts as historical losses have not been material.
(r) Property, Equipment and Software
Property, equipment and software is stated at cost, less accumulated depreciation and amortization. Depreciation and amortization expense is computed over the estimated economic useful life of the assets, between two to five years, using the straight-line method. Leasehold improvements are stated at cost and are amortized on a straight-line basis over the shorter of their estimated useful life or the lease term.
(s) Website and Internal-Use Software Development Costs
The Company’s capitalization of website and internal-use software development costs begins in the application development stage and ends when the asset is placed into service. The Company amortizes such costs using the straight-line method over estimated useful lives, which generally approximates two to three years. Amortization of website and internal-use software development costs is included in technology and development in the accompanying consolidated statements of operations. These costs are a combination of internal compensation costs of the Company’s engineering time and costs of outside consultants and primarily relate to the development of specific enhancements such as the development of the Company’s mobile application. The Company capitalized $256,000 and $594,000 in website and internal-use software development costs for the years ended December 31, 2011 and 2012, respectively. Prior to 2011, costs incurred during the application development stage were not significant and were expensed as incurred.
(t) Customer Liabilities
The Company recognizes transactions processed from customers but not yet confirmed as disbursed to the recipient by its disbursement partners as customer liabilities on the accompanying consolidated balance sheets.
(u) Income Taxes
The Company uses the asset and liability method to account for income taxes, which requires the recognition of deferred tax assets and liabilities for the expected future income tax consequences of events that have been recognized in the Company’s consolidated financial statements or tax returns. Deferred tax assets and liabilities are recognized based on temporary differences between the financial statement carrying amounts and
F-11
Table of Contents
Xoom Corporation
Notes to Consolidated Financial Statements
the tax bases of assets and liabilities using enacted tax rates in effect in the years in which the temporary differences are expected to reverse. Valuation allowances are established for deferred tax assets when the likelihood of the deferred tax assets not being realized exceeds the more likely than not criterion. The Company also provides reserves as necessary for uncertain tax positions taken on its tax filings. First, the Company determines if a tax position is more likely than not to be sustained upon audit solely based on technical merits, including resolution of related appeals or litigation processes, if any. Second, based on the largest amount of benefit, which is more likely than not to be realized on ultimate settlement, the Company recognizes any such differences as a liability. The Company includes in income tax expense any interest and penalties related to uncertain tax positions. For all periods presented, there are no uncertain tax positions.
(v) Concentration Risk
Financial instruments, which potentially subject the Company to concentration of credit risk, consist primarily of cash and cash equivalents, disbursement prefunding, customer funds receivable, restricted cash and short-term investments. The Company’s assets are placed with financial institutions throughout the world, which management assesses to be of high credit quality, in order to limit the exposure of each investment.
A relatively limited number of countries, as determined based on location of the recipient of the funds disbursed, account for a large percentage of the Company’s total revenue. For 2011 and 2012, the Philippines accounted for approximately 42% and 35% of the Company’s revenue, respectively. For the six months ended June 30, 2013, India accounted for approximately 34% of the Company’s revenue. The top three countries, India, Mexico and the Philippines, in the aggregate represented approximately 71%, 74%, 74% and 77% of the Company’s revenue for 2011, 2012, and the six months ended June 30, 2012 and 2013, respectively.
(w) Reclassification
Certain items in the prior years’ consolidated financial statements have been reclassified to conform to the current year’s presentation. These reclassifications did not impact any prior amounts of reported total assets, total liabilities, stockholders’ equity, or results of operations.
(x) Recently Issued and Adopted Accounting Pronouncements
There have been no new accounting pronouncements not yet effective that have significance, or potential significance, to the Company’s consolidated financial statements.
(3) Short-term Investments
Marketable securities, classified as available-for-sale, are stated at fair value. There were no other-than-temporary losses during any of the periods presented.
As of December 31, 2011, the Company’s short-term investments were $20.4 million, consisting of certificates of deposit of $1.6 million and marketable securities measured at fair value as follows (in thousands):
| December 31, 2011 | ||||||||||||||||
| Amortized Cost |
Unrealized Gains |
Unrealized Loss |
Fair Value |
|||||||||||||
| U.S. Treasury Notes |
$ | 403 | $ | — | $ | — | $ | 403 | ||||||||
| U.S. Agency Notes |
3,441 | — | — | 3,441 | ||||||||||||
| Corporate bonds |
10,210 | 1 | (12 | ) | 10,199 | |||||||||||
| Commercial paper |
4,693 | 1 | (1 | ) | 4,693 | |||||||||||
|
|
|
|
|
|
|
|
|
|||||||||
| Total Marketable Securities |
$ | 18,747 | $ | 2 | $ | (13 | ) | $ | 18,736 | |||||||
|
|
|
|
|
|
|
|
|
|||||||||
F-12
Table of Contents
Xoom Corporation
Notes to Consolidated Financial Statements
As of December 31, 2012, the Company’s short-term investments were $25.1 million, consisting of certificates of deposit of $1.0 million and marketable securities measured at fair value as follows (in thousands):
| December 31, 2012 | ||||||||||||||||
| Amortized Cost |
Unrealized Gains |
Unrealized Loss |
Fair Value |
|||||||||||||
| U.S. Treasury Notes |
$ | 3,856 | $ | 1 | $ | — | $ | 3,857 | ||||||||
| U.S. Agency Notes |
11,128 | 1 | (3 | ) | 11,126 | |||||||||||
| Corporate bonds |
9,142 | — | — | 9,142 | ||||||||||||
|
|
|
|
|
|
|
|
|
|||||||||
| Total Marketable Securities |
$ | 24,126 | $ | 2 | $ | (3 | ) | $ | 24,125 | |||||||
|
|
|
|
|
|
|
|
|
|||||||||
As of December 31, 2011 and 2012, there were no short-term investments with maturity dates greater than one year.
(4) Fair Value Measurements
Fair value is an exit price, the amount that would be received from the sale of an asset or paid to transfer a liability in an orderly transaction between market participants. The authoritative guidance on fair value measurements establishes a consistent framework for measuring fair value on either a recurring or nonrecurring basis whereby inputs, used in valuation techniques, are assigned a hierarchical level. The Company’s marketable securities are stated at fair value utilizing the same hierarchy.
The following are the three levels of inputs used to measure fair value:
Level 1: Quoted prices in active markets for identical assets or liabilities.
Level 2: Observable inputs other than Level 1 prices such as quoted prices for similar assets or liabilities; quoted prices in markets that are not active; or other inputs that are observable or can be corroborated by observable market data for substantially the full term of the assets or liabilities.
Level 3: Unobservable inputs that are supported by little or no market activity and that are significant to the fair value of the assets or liabilities. Level 3 assets and liabilities include items where the determination of fair value requires significant management judgment or estimation.
The book value of the Company’s financial instruments not measured at fair value, including cash, certificates of deposit, restricted cash, disbursement prefunding, customer funds receivables, line of credit and customer liabilities approximates fair value due to the relatively short maturity, cash repayments or market interest rates of such instruments. The fair value of such financial instruments are determined using the income approach based on the present value of estimated future cash flows. The fair value of all of these instruments would be categorized as Level 2 of the fair value hierarchy, with the exception of cash and cash equivalents which would be categorized as Level 1.
F-13
Table of Contents
Xoom Corporation
Notes to Consolidated Financial Statements
The Company’s cash equivalents and marketable securities that are measured at fair value on a recurring basis are classified as follows (in thousands):
| December 31, 2011 | December 31, 2012 | |||||||||||||||||||||||
| Level 1 | Level 2 | Level 3 | Level 1 | Level 2 | Level 3 | |||||||||||||||||||
| Cash Equivalents: |
||||||||||||||||||||||||
| Money market funds |
$ | 19,107 | $ | — | $ | — | $ | 14,055 | $ | — | $ | — | ||||||||||||
| U.S. Agency notes |
— | 125 | — | — | — | — | ||||||||||||||||||
| Corporate bonds |
— | 505 | — | — | 150 | — | ||||||||||||||||||
| Commercial paper |
— | — | — | — | 1,400 | — | ||||||||||||||||||
| Marketable Securities: |
||||||||||||||||||||||||
| U.S. Treasury notes |
403 | — | — | — | — | — | ||||||||||||||||||
| U.S. Agency notes |
— | 3,441 | — | — | 3,857 | — | ||||||||||||||||||
| Corporate bonds |
— | 10,199 | — | — | 11,126 | — | ||||||||||||||||||
| Commercial paper |
— | 4,693 | — | — | 9,142 | — | ||||||||||||||||||
|
|
|
|
|
|
|
|
|
|
|
|
|
|||||||||||||
| $ | 19,510 | $ | 18,963 | $ | — | $ | 14,055 | $ | 25,675 | $ | — | |||||||||||||
|
|
|
|
|
|
|
|
|
|
|
|
|
|||||||||||||
Financial instruments, which are traded in active markets, using quoted market prices for identical instruments are assigned a Level 1 under the fair value hierarchy. The Company obtains the fair value of its Level 2 financial instruments from a professional pricing service, which may use quoted market prices for identical or comparable instruments, or inputs other than quoted prices that are observable either directly or indirectly. The professional pricing service gathers quoted market prices and observable inputs for the Company’s financial instruments from a variety of industry data providers. The valuation techniques used to measure the fair value of Level 2 financial instruments were derived from nonbinding market consensus prices that are corroborated by observable market data, quoted market prices for similar instruments, or pricing models such as discounted cash flow techniques. There were no changes in the valuation techniques during any of the years presented.
To validate the reasonableness of fair values obtained from a professional pricing service, the Company performs several controls including periodic meetings with the pricing service and the Company’s custodians, obtaining the internal control reports of the pricing service and investigating any significant realized or unrealized gains or losses on its short-term investments. The Company believes that these controls coupled with the Company’s investment policy and the nature of its short-term investments sufficiently mitigate the Company’s valuation risk.
There were no transfers between Level 1 and Level 2 assets during any of the years presented.
F-14
Table of Contents
Xoom Corporation
Notes to Consolidated Financial Statements
(5) Property, Equipment and Software, Net
The following is a summary of property, equipment and software at cost, less accumulated depreciation and amortization (in thousands):
| December 31, | ||||||||
| 2011 | 2012 | |||||||
| Office furniture and equipment |
$ | 1,795 | $ | 3,517 | ||||
| Software |
1,939 | 2,932 | ||||||
| Leasehold improvements |
161 | 365 | ||||||
|
|
|
|
|
|||||
| 3,895 | 6,814 | |||||||
| Less: accumulated depreciation |
(1,710 | ) | (2,930 | ) | ||||
|
|
|
|
|
|||||
| $ | 2,185 | $ | 3,884 | |||||
|
|
|
|
|
|||||
Depreciation and amortization expense of $276,000, $548,000 and $1,495,000 was recorded for the years ended December 31, 2010, 2011 and 2012, respectively.
(6) Line of Credit
On October 8, 2009, the Company entered into a loan and security agreement (the Loan Agreement) with Silicon Valley Bank (SVB), which is also a stockholder of the Company. The Loan Agreement permitted the Company to borrow through October 7, 2010 up to $3.0 million. On October 29, 2010, the Company amended the Loan Agreement to permit the Company to borrow through October 6, 2011 up to $10.0 million. On August 2, 2011, October 27, 2011 and April 30 2012, the Company further amended this Loan Agreement to permit the Company to borrow through April 30, 2014 up to $20.0 million, $40.0 million and $60.0 million, respectively. On September 19, 2012, the Company amended the Loan Agreement to add Chinatrust Bank U.S.A. as a second lender and to permit the Company to borrow through September 2014 up to $80.0 million. The Loan Agreement bears interest at the greater of prime plus 1.25% or 4.50%. The interest rate at December 31, 2011 and 2012 was 4.50%. In 2012, the Company paid a commitment fee of $296,000. The Loan Agreement contains a $1.0 million early termination fee.
As part of the September 2012 amendment, the Company is required to pay monthly interest on the greater of the actual borrowings or $25.0 million. Since the Company’s intent is not to repay below the $25.0 million in the next twelve months, the Company has classified the $25.0 million of its line of credit as a non-current liability.
SVB also issued a standby letter of credit which satisfied the additional collateral requirement to maintain a license to operate in India. The standby letter of credit amount reduces the $80.0 million the Company is permitted to borrow under the Loan Agreement at December 31, 2012. In July 2012, the Company increased the outstanding standby letter of credit from $5.5 million to $10.0 million.
At December 31, 2012, the Company had $30.0 million available under this facility, reflecting $40.0 million outstanding under the line of credit and $10.0 million reserved under the standby letter of credit.
F-15
Table of Contents
Xoom Corporation
Notes to Consolidated Financial Statements
(7) Income Taxes
The provision for income taxes for each of the years ended December 31, 2010, 2011 and 2012 was $2,000.
The components of provision for income taxes for all years presented were as follows (in thousands):
| Year Ended December 31, | ||||||||||||
| 2010 | 2011 | 2012 | ||||||||||
| Current tax provision: |
||||||||||||
| Federal |
$ | — | $ | — | $ | — | ||||||
| State |
2 | 2 | 2 | |||||||||
| Deferred tax provision: |
— | — | — | |||||||||
| Federal |
— | — | — | |||||||||
|
|
|
|
|
|
|
|||||||
| State |
$ | 2 | $ | 2 | $ | 2 | ||||||
|
|
|
|
|
|
|
|||||||
A reconciliation of the statutory federal income tax rate of 34% to the actual tax rate is as follows (in thousands):
| Year Ended December 31, | ||||||||||||
| 2010 | 2011 | 2012 | ||||||||||
| Tax computed at the statutory U.S. federal income tax rate |
$ | (2,026 | ) | $ | (1,486 | ) | $ | (2,008 | ) | |||
| Net operating loss carrryforwards |
1,938 | 1,376 | 1,488 | |||||||||
| Stock-based compensation |
79 | 109 | 517 | |||||||||
| Other |
11 | 3 | 5 | |||||||||
|
|
|
|
|
|
|
|||||||
| $ | 2 | $ | 2 | $ | 2 | |||||||
|
|
|
|
|
|
|
|||||||
Deferred income taxes reflect the net tax effects of temporary differences between the carrying amounts of assets and liabilities for financial reporting purposes and the amounts used for income tax purposes. The components of the Company’s deferred tax assets were as follows (in thousands):
| Year Ended December 31, | ||||||||
| 2011 | 2012 | |||||||
| Assets: |
||||||||
| Net operating loss carryforwards |
$ | 20,978 | $ | 22,331 | ||||
| Stock based compensation |
378 | 663 | ||||||
| Other |
517 | 497 | ||||||
|
|
|
|
|
|||||
| Gross deferred tax assets |
21,873 | 23,491 | ||||||
| Valuation allowance |
(21,873 | ) | (23,458 | ) | ||||
|
|
|
|
|
|||||
| Total deferred tax assets |
— | 33 | ||||||
| Liabilities: |
||||||||
| Property, equipment and software, net |
— | (33 | ) | |||||
|
|
|
|
|
|||||
| Net deferred tax assets |
$ | — | $ | — | ||||
|
|
|
|
|
|||||
The Company has deferred tax assets comprised primarily of net operating losses, stock-based compensation, accruals and reserves. The Company has not benefited from any of its deferred tax assets and has established a full valuation allowance. In assessing the realizability of deferred tax assets, management considers
F-16
Table of Contents
Xoom Corporation
Notes to Consolidated Financial Statements
whether it is more likely than not that some portion or all of the deferred tax assets will not be realized. The ultimate realization of deferred tax assets is dependent upon the generation of future taxable income during the periods in which those temporary differences become deductible. Management believes it is more likely than not that the deferred tax assets will not be realized; accordingly, a full valuation allowance has been established and no deferred tax asset and related tax benefit have been recognized in the accompanying consolidated financial statements.
As of December 31, 2012, the Company had net operating loss carryforwards for federal and state income tax purposes of approximately $56.6 million and $54.2 million, respectively. These net operating losses can be utilized to reduce future taxable income, if any. The federal net operating loss carryforwards expire beginning in 2022 through 2032 and the state net operating loss carryforwards begin to expire in 2013 through 2032. Utilization of the net operating loss carryforwards may be subject to substantial annual limitations due to ownership change provisions of the Internal Revenue Code of 1986, as amended and similar state provisions. The annual limitations may result in the expiration of net operating loss carryforwards before utilization.
As of December 31, 2012, the Company had no unrecognized tax benefits. No significant interest or penalties were recorded during the years ended December 31, 2010, 2011 and 2012.
Tax years from 2001 and forward remain open to examinations by federal and state authorities due to net operating loss carryforwards. The Company is currently not under examinations by the Internal Revenue Service or any other taxing authorities.
(8) Stockholders’ Equity
(a) Convertible Preferred Stock
In November 2011, the Company amended and restated its Articles of Incorporation to authorize an increase in the authorized number of Series F Preferred Stock and to change the number of authorized shares of its preferred and common stock.
Authorized and outstanding Series A, Series B, Series C, Series C-1, Series D, Series E and Series F convertible preferred stock (collectively, preferred stock) as of December 31, 2012 are as follows:
| Shares | ||||||||||||
| Convertible Preferred Stock |
Net Carrying Amount (In Thousands) |
Authorized | Issued and Outstanding |
|||||||||
| Series A |
$ | 30 | 181,722 | 45,430 | ||||||||
| Series B |
4,744 | 10,411,625 | 2,602,903 | |||||||||
| Series C |
11,931 | 13,650,896 | 3,412,719 | |||||||||
| Series C-1 |
4,725 | 5,682,948 | 1,420,730 | |||||||||
| Series D |
14,910 | 17,062,711 | 4,265,676 | |||||||||
| Series E |
20,210 | 18,436,763 | 4,609,185 | |||||||||
| Series F |
56,718 | 21,300,000 | 5,087,608 | |||||||||
|
|
|
|
|
|
|
|||||||
| $ | 113,268 | 86,726,665 | 21,444,251 | |||||||||
|
|
|
|
|
|
|
|||||||
Each share of preferred stock is currently convertible into one common share. Each share of Series A, Series B, Series C, Series C-1, Series D, Series E and Series F preferred stock carries a liquidation preference of $0.80, $1.86, $3.52, $3.52, $3.52, $4.40 and $11.45 per share, respectively.
F-17
Table of Contents
Xoom Corporation
Notes to Consolidated Financial Statements
Dividends on the preferred stock of 8% of the per share liquidation preference are payable when and if declared by the Board of Directors. Dividends are not cumulative. The dividend requirements of the preferred stock must be satisfied prior to the payment of any dividends or distributions with respect to the Company’s common stock. Dividend rights for Series F, Series E and Series D (as a group) are senior to Series C-1 and Series C (as a group). Series C-1 and Series C (as a group) are senior to Series B, which is senior to Series A. Holders of preferred stock are entitled to voting rights equivalent to the number of common shares into which their shares are convertible. All preferred shares convert automatically to common shares immediately prior to the closing of a firm commitment underwritten initial public offering of the Company’s common stock that results in aggregate net proceeds of at least $20,000,000 or upon the written request from the holders of a majority of the preferred stock then outstanding.
Upon any liquidation event, the holders of Series F, Series E and Series D (as a group) shall be entitled to receive, on a pro-rata basis, any distribution of Company assets prior and in preference to Series C-1 and Series C (as a group), followed by Series B, then Series A, and then common stock.
In the event the assets of the Company are insufficient to permit payment to the holders, the assets available for liquidations will be distributed with equal priority and pro-rata first among the holders of Series F, Series E and Series D (as a group) in proportion to the full amount they would otherwise be entitled to receive, followed by Series C-1 and Series C (as a group), then Series B, then Series A. After the payment or setting aside for payment to the holders of preferred stock of the full amounts, the entire remaining assets of the Company available for distribution shall be distributed pro-rata to holders of the common stock.
None of the series of preferred stock is redeemable.
(b) Common Stock
In November 2011, the Company amended and restated its Articles of Incorporation to increase the authorized number of common shares to 135,000,000. Of these shares, 5,083,616 are issued and outstanding as of December 31, 2012.
(c) Election Rights
Election of the Board of Directors is divided among the outstanding classes of stock. The holders of Series D, voting as a separate class, are entitled to elect one member of the Board of Directors. The holders of Series C-1 and holders of Series C, voting as a single class, are entitled to elect one member of the Board of Directors. The holders of Series B, voting as a separate class, are entitled to elect one member of the Board of Directors. The holders of Series A and common stockholders, voting together as a single class, are entitled to elect one member of the Board of Directors. The holders of preferred stock and the holders of common stock, voting together as a single class, are entitled to elect one member of the Board of Directors. The common stockholders, voting as a separate class, are entitled to elect two members of the Board of Directors. Any additional members of the Board of Directors are elected by the common stockholders and preferred stockholders, voting together as a single class.
(d) Stock Option Plan
Under the 2010 Stock Option Plan (the 2010 Plan), which was an amendment and restatement of the Company’s prior option plan, the Company may grant incentive and nonqualified stock options to employees, directors and consultants of the Company at an option price not less than 85% of the fair value of the common stock at the date of grant. The fair value of the common stock is determined by the Board of Directors taking into account any independent third-party valuations performed during the period. Options vest according to the grant
F-18
Table of Contents
Xoom Corporation
Notes to Consolidated Financial Statements
document. Options currently outstanding generally vest in equal amounts over periods not to exceed four or five years and have a maximum life of ten years. As of December 31, 2012, the Company was authorized to grant up to 8,187,500 shares underlying equity awards. There were 46,190 shares available for future grant as of December 31, 2012.
The weighted-average grant date fair value of options granted was $2.16, $1.76, and $3.92 per option for the years ended December 31, 2010, 2011 and 2012, respectively. No stock-based compensation cost was capitalized for any of the years presented as it was insignificant for all years presented.
No current income tax benefit has been recognized relating to stock-based compensation expense and no tax benefits realized from exercised stock options.
The Company utilizes the Black-Scholes model for valuing its stock options. This model utilizes several inputs including volatility, expected term, risk free interest rate and dividend yield. Volatility is based on an average of the historical volatilities of an index fund and industry peers with characteristics similar to those of the Company. The expected term of the options is determined using the “simplified” method due to the lack of sufficient historical exercise data to provide a reasonable basis upon which to otherwise estimate the expected life of the stock options. The risk-free interest rate is based on the implied yield of U.S. Treasury zero coupon bonds with a term comparable to the expected option term. Since the Company currently has no history or expectation of paying dividends on its common stock, a dividend yield of zero was used. Expected forfeitures are based on the Company’s historical experience.
The following table presents the weighted-average assumptions used to estimate the fair value of the stock options granted in the Company’s consolidated financial statements:
| Year Ended December 31, | ||||||||||||
| 2010 | 2011 | 2012 | ||||||||||
| Expected term (in years) |
6.2 | 5.8 | 6.3 | |||||||||
| Risk-free interest rate |
2.90 | % | 1.73 | % | 1.26 | % | ||||||
| Dividend yield |
None | None | None | |||||||||
| Volatility rate |
47 | % | 39 | % | 42 | % | ||||||
The Company’s stock option activity and related information under the 2010 Plan was as follows:
| Options Outstanding |
Weighted Average Exercise Price |
Options Exercisable |
Exercisable Weighted Average Exercise Price |
|||||||||||||
| Outstanding at December 31, 2011 |
4,278,806 | $ | 2.57 | 2,716,392 | $ | 1.56 | ||||||||||
| Granted |
2,578,821 | 9.28 | ||||||||||||||
| Exercised |
(56,367 | ) | 2.58 | |||||||||||||
| Forfeited |
(70,740 | ) | 6.12 | |||||||||||||
|
|
|
|||||||||||||||
| Outstanding at December 31, 2012 |
6,730,520 | $ | 5.10 | 3,352,116 | $ | 2.20 | ||||||||||
|
|
|
|||||||||||||||
F-19
Table of Contents
Xoom Corporation
Notes to Consolidated Financial Statements
The summary of options outstanding as of December 31, 2012 is shown below:
| Outstanding Options | Options Exercisable | |||||||||||||||
| Exercise Price |
Number Outstanding |
Weighted Average Remaining Contractual Life (Years) |
Number Exercisable |
Weighted Average Remaining Contractual Life (Years) |
||||||||||||
| $ 0.20 |
15,000 | 1.93 | 15,000 | 1.93 | ||||||||||||
| 0.40 |
8,750 | 2.17 | 8,750 | 2.17 | ||||||||||||
| 0.68 |
1,397,665 | 3.68 | 1,397,665 | 3.68 | ||||||||||||
| 1.00 |
653,066 | 5.08 | 653,066 | 5.08 | ||||||||||||
| 2.00 |
64,984 | 5.85 | 63,706 | 5.84 | ||||||||||||
| 2.64 |
107,500 | 6.65 | 88,953 | 6.64 | ||||||||||||
| 4.48 |
1,937,809 | 7.59 | 1,029,280 | 7.41 | ||||||||||||
| 6.84 |
1,620,746 | 9.15 | 74,915 | 8.93 | ||||||||||||
| 12.72 |
353,750 | 9.39 | 20,781 | 9.39 | ||||||||||||
| 14.12 |
571,250 | 9.63 | — | — | ||||||||||||
|
|
|
|
|
|||||||||||||
| 6,730,520 | 7.13 | 3,352,116 | 5.36 | |||||||||||||
|
|
|
|
|
|||||||||||||
As of December 31, 2012, there were 6,663,152 options that had vested or were expected to vest with a weighted-average exercise price of $5.08 and a weighted-average contractual life of 7.1 years.
The aggregate intrinsic value of options that had vested or were expected to vest was $17.1 million as of December 31, 2011. The aggregate intrinsic value of options that had vested or were expected to vest was $60.3 million as of December 31, 2012.
The aggregate intrinsic value of options outstanding was $18.3 million and the aggregate intrinsic value of options exercisable was $14.3 million as of December 31, 2011. The aggregate intrinsic value of options outstanding was $60.7 million and the aggregate intrinsic value of options exercisable was $40.0 million as of December 31, 2012.
The aggregate intrinsic value of options exercised was approximately $571,000, $373,000 and $503,000 for 2010, 2011 and 2012, respectively. The total fair value of options vested was approximately $347,000, $1,035,000, and $1,415,000 for 2010, 2011 and 2012, respectively.
As of December 31, 2012, there was $10.1 million of total unrecognized compensation expense related to option grants, which is expected to be recognized over a weighted-average period of 3.48 years.
The 2010 Plan permits certain option holders to exercise their options in advance of vesting. In the event that the employee fails to satisfy the required conditions for vesting of the option, as established in the original option award, the Company maintains the right to repurchase any nonvested shares at such time. Such shares are repurchased at a price equal to the exercise price paid. As of December 31, 2012, there were no such shares.
In December 2012, the Company’s board of directors and stockholders approved and adopted the 2012 Stock Option and Incentive Plan (the 2012 Plan). The 2012 Plan will be effective, and the 2010 Plan will be terminated, as of the closing of the Company’s initial public offering. The Company has initially reserved a number of shares of common stock for the issuance of awards under the 2012 Plan equal to the sum of (i) 3,000,000 shares, (ii) any remaining authorized but unissued shares in the 2010 Plan before such plan is terminated, and (iii) shares underlying grants issued under the 2010 Plan that are, after the termination of the 2010 Plan, forfeited, canceled or otherwise terminated.
F-20
Table of Contents
Xoom Corporation
Notes to Consolidated Financial Statements
(e) Stock Reserved
As of December 31, 2012, the Company has reserved 21,444,251 common shares for issuance on the conversion of preferred stock and an additional 6,812,488 common shares for issuance on the exercise of warrants or options to purchase common stock and for the options still available for grant.
(9) Warrants
During the year ended December 31, 2005, the Company issued warrants to purchase 284,378 shares of the Company’s Series C-l preferred stock, in association with the issue of Series C-1 preferred stock. The warrants had an exercise price of $3.52 per share and expired if not exercised by November 17, 2010. During the year ended December 31, 2010, the Company issued 283,223 shares of Series C-1 preferred stock upon the exercise of warrants, while the remaining 1,155 warrants expired unexercised.
During the year ended December 31, 2004, the Company issued warrants to purchase 26,946 shares of the Company’s common stock. The warrants have an exercise price of $0.20 per share and were scheduled to expire on November 15, 2011. During 2009, in connection with the Loan Agreement, the Company extended the expiration date of 10,778 of these common stock warrants to October 29, 2015. This extension resulted in $26,519 being recorded as prepaid fees to be amortized into expense over the line of credit term of one year. The Company has classified the warrants as equity in the consolidated balance sheet. During 2011, the Company issued 15,446 shares of common stock in connection with a cashless exercise of warrants.
In connection with the April amendment and extension of the Loan Agreement with SVB, the Company issued a warrant to purchase 25,000 shares of common stock at an exercise price of $6.84 per share in April 2012. The warrant has an expiration date of April 30, 2022. This resulted in $219,000 being recorded as prepaid fees to be amortized into expense over the line of credit term of two years. The Company has classified the value of the warrants within equity on the consolidated balance sheet.
As of December 31, 2012, there were warrants to purchase 35,778 shares of common stock outstanding.
(10) Net Loss Per Share
Basic net loss per share is computed by dividing the net loss by the weighted-average number of shares of common stock outstanding during the period. Diluted loss per share is the same as basic loss per share for all years presented because the effects of potentially dilutive items were anti-dilutive given the Company’s net loss.
The following table presents the calculation of basic and diluted net loss per share (in thousands, except per share data):
| Year Ended December 31, 2011 | ||||||||||||
| 2010 | 2011 | 2012 | ||||||||||
| Numerator: |
||||||||||||
| Net loss |
$ | (5,959 | ) | $ | (4,372 | ) | $ | (5,854 | ) | |||
|
|
|
|
|
|
|
|||||||
| Denominator: |
||||||||||||
| Weighted-average common shares |
4,752 | 4,956 | 5,049 | |||||||||
| Basic and diluted loss per share |
$ | (1.25 | ) | $ | (0.88 | ) | $ | (1.16 | ) | |||
|
|
|
|
|
|
|
|||||||
F-21
Table of Contents
Xoom Corporation
Notes to Consolidated Financial Statements
The following securities have been excluded from the calculation of diluted net income per share of common stock for the years presented because including them would have been anti-dilutive (in thousands):
| Year Ended December 31, | ||||||||||||
| 2010 | 2011 | 2012 | ||||||||||
| Common shares from convertible preferred stock |
19,260 | 21,444 | 21,444 | |||||||||
| Common shares from common stock warrants |
27 | 11 | 36 | |||||||||
| Stock options outstanding |
3,739 | 4,278 | 6,731 | |||||||||
|
|
|
|
|
|
|
|||||||
| Total common stock equivalents |
23,026 | 25,733 | 28,211 | |||||||||
|
|
|
|
|
|
|
|||||||
(11) Employee Benefit Plan
Effective January 1, 2005, the Company implemented a 401(k) Plan for all employees over the age of 21. Participants may contribute up to 100% of their salary (during 2012, up to a maximum of $17,000 or $22,500 for participants over 50 years of age). Company matching is at the discretion of the Board of Directors.
The employee benefit plan also provides a profit sharing component where the Company can make a discretionary contribution to the 401(k) Plan, which is allocated based on the compensation of eligible employees. The 401(k) Plan also provides for qualified non-elective contributions where the Company can make a discretionary contribution in order to pass various nondiscretionary tests for the 401(k) portion of the employee benefit plan. This contribution is allocated to eligible non-highly compensated employee in reverse order based on compensation. No Company contributions were made to the 401(k) Plan in 2010, 2011 or 2012.
(12) Commitments and Contingencies
(a) Operating Leases
The Company conducts operations from leased facilities under operating leases, which extend through October 31, 2016.
Future minimum lease payments under the noncancelable operating leases at December 31, 2012 were as follows (in thousands):
| 2013 |
$ | 1,233 | ||
| 2014 |
1,302 | |||
| 2015 |
1,314 | |||
| 2016 |
1,103 |
Rental expense for 2010, 2011 and 2012 amounted to $442,000, $524,000 and $876,000, respectively.
(b) Litigation
On February 23, 2011, the Company filed a lawsuit in federal court in the Northern District of California against Motorola Mobility, Inc. and other affiliated companies (together, Motorola) alleging trademark infringement and other related claims, stemming from Motorola’s use of the name “XOOM” in connection with its wireless tablet devices and related accessories. Following the filing of the complaint, the Company and Motorola engaged in confidential settlement discussions. On October 28, 2011, the Company formally served Motorola with the complaint.
The Company is not a party to any other material pending legal proceedings. The Company is also involved from time to time in various legal proceedings in the normal course of business that individually or in the aggregate would not have a material effect on its results of operations or financial position.
F-22
Table of Contents
Xoom Corporation
Notes to Consolidated Financial Statements
(13) Subsequent Event
The Company further amended its line of credit in August 2013 to increase the available borrowing amounts temporarily from $80.0 million to $100.0 million until December 31, 2013.
F-23
Table of Contents
Consolidated Balance Sheets
(in Thousands, Except Share and Per Share Data)
| December 31, 2012 |
June 30, 2013 |
|||||||
| (derived from audited financial statements) |
(unaudited) | |||||||
| Assets | ||||||||
| Current assets: |
||||||||
| Cash and cash equivalents |
$ | 45,077 | $ | 91,072 | ||||
| Disbursement prefunding |
15,070 | 14,236 | ||||||
| Short-term investments |
25,125 | 61,571 | ||||||
| Customer funds receivable |
9,318 | 47,456 | ||||||
| Prepaid expenses and other current assets |
4,934 | 4,283 | ||||||
|
|
|
|
|
|||||
| Total current assets |
99,524 | 218,618 | ||||||
| Non-current assets: |
||||||||
| Property, equipment and software, net |
3,884 | 3,787 | ||||||
| Restricted cash |
9,337 | 10,351 | ||||||
| Other assets |
348 | 264 | ||||||
|
|
|
|
|
|||||
| Total assets |
$ | 113,093 | $ | 233,020 | ||||
|
|
|
|
|
|||||
| Liabilities and Stockholders’ Equity | ||||||||
| Current liabilities: |
||||||||
| Accounts payable and accrued expenses |
$ | 7,150 | $ | 8,236 | ||||
| Customer liabilities |
8,536 | 23,642 | ||||||
| Line of credit |
15,000 | 24,000 | ||||||
|
|
|
|
|
|||||
| Total current liabilities |
30,686 | 55,878 | ||||||
| Non-current liabilities: |
||||||||
| Non-current portion of line of credit |
25,000 | 25,000 | ||||||
| Other non-current liabilities |
87 | 91 | ||||||
|
|
|
|
|
|||||
| Total liabilities |
55,773 | 80,969 | ||||||
|
|
|
|
|
|||||
| Stockholders’ equity: |
||||||||
| Convertible preferred stock, $0.0001 par value. Authorized 0 and 86,726,665 shares; issued and outstanding 0 and 21,444,251 shares; aggregate liquidation preference $0 and $115,404 at June 30, 2013 and December 31, 2012, respectively |
2 | — | ||||||
| Common stock, $0.0001 par value. Authorized 500,000,000 and 135,000,000 shares; issued and outstanding 32,994,080 and 5,083,616 shares at June 30, 2013 and December 31, 2012, respectively |
1 | 3 | ||||||
| Additional paid-in capital |
120,684 | 211,433 | ||||||
| Accumulated other comprehensive income (loss) |
(1 | ) | (30 | ) | ||||
| Accumulated deficit |
(63,366 | ) | (59,355 | ) | ||||
|
|
|
|
|
|||||
| Total stockholders’ equity |
57,320 | 152,051 | ||||||
|
|
|
|
|
|||||
| Total liabilities and stockholders’ equity |
$ | 113,093 | $ | 233,020 | ||||
|
|
|
|
|
|||||
See accompanying notes to condensed consolidated financial statements.
F-24
Table of Contents
Consolidated Statements of Operations
(in Thousands, Except Per Share Data)
| Six Months Ended June 30, |
||||||||
| 2012 | 2013 | |||||||
| (unaudited) | ||||||||
| Revenue |
$ | 37,953 | $ | 57,808 | ||||
| Cost of revenue |
12,842 | 17,638 | ||||||
|
|
|
|
|
|||||
| Gross profit |
25,111 | 40,170 | ||||||
|
|
|
|
|
|||||
| Marketing |
10,417 | 12,599 | ||||||
| Technology and development |
7,654 | 10,310 | ||||||
| Customer service and operations |
4,977 | 6,342 | ||||||
| General and administrative |
3,872 | 5,962 | ||||||
|
|
|
|
|
|||||
| Total operating expense |
26,920 | 35,213 | ||||||
|
|
|
|
|
|||||
| Income (loss) from operations |
(1,809 | ) | 4,957 | |||||
| Other income (expense): |
||||||||
| Interest expense |
(602 | ) | (946 | ) | ||||
| Interest income |
44 | 77 | ||||||
| Other income |
263 | 57 | ||||||
|
|
|
|
|
|||||
| Income (loss) before provision for income taxes |
(2,104 | ) | 4,145 | |||||
| Provision for income taxes |
2 | 134 | ||||||
|
|
|
|
|
|||||
| Net income (loss) |
$ | (2,106 | ) | $ | 4,011 | |||
|
|
|
|
|
|||||
| Net income (loss) per share: |
||||||||
| Basic |
$ | (0.42 | ) | $ | 0.15 | |||
| Diluted |
$ | (0.42 | ) | $ | 0.11 | |||
| Weighted-average shares used to compute net income (loss) per share: |
||||||||
| Basic |
5,035 | 26,046 | ||||||
|
|
|
|
|
|||||
| Diluted |
5,035 | 35,865 | ||||||
|
|
|
|
|
|||||
See accompanying notes to condensed consolidated financial statements.
F-25
Table of Contents
Consolidated Statements of Comprehensive Income (Loss)
(in Thousands)
| Six Months Ended June 30, | ||||||||
| 2012 | 2013 | |||||||
| (unaudited) | ||||||||
| Net income (loss) |
$ | (2,106 | ) | $ | 4,011 | |||
| Unrealized (loss) gain on marketable securities, net of taxes of $0 |
6 | (29 | ) | |||||
|
|
|
|
|
|||||
| Total comprehensive income (loss) |
$ | (2,100 | ) | $ | 3,982 | |||
|
|
|
|
|
|||||
See accompanying notes to condensed consolidated financial statements.
F-26
Table of Contents
Consolidated Statements of Cash Flows
(in Thousands)
| Six Months Ended June 30, | ||||||||
| 2012 | 2013 | |||||||
| (unaudited) | ||||||||
| Cash flows from operating activities: |
||||||||
| Net income (loss) |
$ | (2,106 | ) | $ | 4,011 | |||
| Adjustments to reconcile net loss to net cash used in operating activities: |
||||||||
| Stock-based compensation |
1,008 | 1,737 | ||||||
| Depreciation and amortization |
613 | 972 | ||||||
| Loss on disposal of fixed assets |
1 | — | ||||||
| Discount/premium on investments |
274 | 409 | ||||||
| Amortization of warrant issuance costs |
18 | 55 | ||||||
| Changes in operating assets and liabilities: |
||||||||
| Disbursement prefunding |
(2,365 | ) | 834 | |||||
| Customer funds receivable |
(12,038 | ) | (38,138 | ) | ||||
| Prepaid expenses and other current assets |
(579 | ) | 651 | |||||
| Other assets |
(114 | ) | 84 | |||||
| Customer liabilities |
5,240 | 15,106 | ||||||
| Transaction loss reserves |
211 | 302 | ||||||
| Accounts payable and accrued expenses |
922 | 707 | ||||||
| Other non-current liabilities |
— | 4 | ||||||
|
|
|
|
|
|||||
| Net cash used in operating activities |
(8,915 | ) | (13,266 | ) | ||||
|
|
|
|
|
|||||
| Cash flows from investing activities: |
||||||||
| Purchase of property, equipment and software |
(1,760 | ) | (798 | ) | ||||
| Purchase of marketable securities |
(14,260 | ) | (60,939 | ) | ||||
| Proceeds from sales and maturities of marketable securities |
11,026 | 24,055 | ||||||
| Change in restricted cash |
(7,000 | ) | (1,014 | ) | ||||
|
|
|
|
|
|||||
| Net cash used in investing activities |
(11,994 | ) | (38,696 | ) | ||||
|
|
|
|
|
|||||
| Cash flows from financing activities: |
||||||||
| Net proceeds from issuance of preferred stock |
(5 | ) | — | |||||
| Proceeds from exercise of common stock options |
47 | 535 | ||||||
| Net borrowings under line of credit |
11,500 | 9,000 | ||||||
| Proceeds from initial public offering, net of costs |
— | 88,422 | ||||||
|
|
|
|
|
|||||
| Net cash provided by financing activities |
11,542 | 97,957 | ||||||
|
|
|
|
|
|||||
| Net increase (decrease) in cash and cash equivalents |
(9,367 | ) | 45,995 | |||||
| Cash and cash equivalents, beginning of period |
48,248 | 45,077 | ||||||
|
|
|
|
|
|||||
| Cash and cash equivalents, end of period |
$ | 38,881 | $ | 91,072 | ||||
|
|
|
|
|
|||||
| Supplemental disclosures of cash flow information: |
||||||||
| Cash paid for taxes |
$ | 2 | $ | 2 | ||||
| Cash paid for interest |
$ | 410 | $ | 706 | ||||
| Purchases of property and equipment in accounts payable and accrued expenses |
$ | 12 | $ | 123 | ||||
| Deferred offering costs not yet paid |
$ | 1,489 | $ | 9 | ||||
See accompanying notes to condensed consolidated financial statements.
F-27
Table of Contents
Notes to Consolidated Financial Statements
(unaudited)
(1) Business and Basis of Presentation
Xoom Corporation and its subsidiary (together, “Xoom” or the “Company”) is a pioneer and leader in the digital consumer-to-consumer international money transfer industry. Xoom provides its customers with fast and convenient ways to send money to friends and family in 30 countries using their bank account, credit card, or debit card.
Xoom was incorporated in California in June 2001 and reincorporated in Delaware in November 2012. The Company’s corporate headquarters is located in San Francisco, California.
On February 21, 2013, Xoom completed its initial public offering (“IPO”) whereby 7,273,750 shares of common stock were sold to the public (inclusive of 948,750 shares of common stock sold by the Company pursuant to the full exercise of an overallotment option granted to the underwriters and 1,104,107 shares of common stock sold by selling stockholders) at a price of $16.00 per share. The aggregate net proceeds received by the Company from the offering were $88.4 million, net of underwriting discounts and commissions and offering expenses payable by Xoom. Immediately prior to the closing of the IPO, all shares of the Company’s outstanding convertible preferred stock automatically converted into 21,444,251 shares of common stock.
The accompanying unaudited condensed consolidated financial statements have been prepared in accordance with accounting principles generally accepted in the United States (“GAAP”) and applicable rules and regulations of the Securities and Exchange Commission (“SEC”) regarding interim financial reporting. Accordingly, they do not include all of the information and notes required by GAAP for annual financial statements. In the opinion of management, all adjustments consisting of normal and recurring entries considered necessary for a fair presentation of the results for the interim periods presented have been included. All significant intercompany balances and transactions have been eliminated. The preparation of financial statements in conformity with GAAP requires management to make estimates and assumptions that affect reported amounts in the financial statements and accompanying notes. These estimates are based on information available as of the date of the unaudited condensed consolidated financial statements. Therefore, actual results could differ from those estimates. Interim results are not necessarily indicative of the results for a full year. These unaudited condensed consolidated financial statements should be read in conjunction with the consolidated financial statements and notes included herein. There have been no changes in the significant accounting policies from those that were disclosed in the audited consolidated financial statements for 2012 included in the Prospectus.
Certain items in the prior period’s consolidated financial statements have been reclassified to conform to the current period’s presentation. These reclassifications did not impact any prior amounts of reported total assets, total liabilities, stockholders’ equity or results of operations.
(2) Recently Issued Accounting Pronouncements
In February 2013, the Financial Accounting Standards Board amended the authoritative guidance related to comprehensive income. This update requires companies to provide information about the amounts reclassified out of accumulated other comprehensive income by component. The update is effective for fiscal years and interim periods beginning after December 15, 2012. The adoption of this new standard does not currently have a material impact on the Company’s consolidated financial statements.
(3) Short-term Investments
Marketable securities, classified as available for sale, are stated at fair value. There were no other-than-temporary losses during any of the periods presented.
F-28
Table of Contents
Xoom Corporation
Notes to Consolidated Financial Statements
(unaudited)
As of December 31, 2012, the Company’s short-term investments were $25.1 million, consisting of certificates of deposit of $1.0 million and marketable securities measured at fair value as follows (in thousands):
| December 31, 2012 | ||||||||||||||||
| Amortized cost |
Unrealized gains |
Unrealized loss |
Fair value |
|||||||||||||
| (unaudited) | ||||||||||||||||
| U.S. Agency notes |
$ | 3,856 | $ | 1 | $ | — | $ | 3,857 | ||||||||
| Corporate bonds |
11,128 | 1 | (3 | ) | 11,126 | |||||||||||
| Commercial paper |
9,142 | — | — | 9,142 | ||||||||||||
|
|
|
|
|
|
|
|
|
|||||||||
| Total Marketable Securities |
$ | 24,126 | $ | 2 | $ | (3 | ) | $ | 24,125 | |||||||
|
|
|
|
|
|
|
|
|
|||||||||
As of June 30, 2013, the Company’s short-term investments were $61.6 million, consisting of certificates of deposit of $1.0 million and marketable securities measured at fair value as follows (in thousands):
| June 30, 2013 | ||||||||||||||||
| Amortized cost |
Unrealized gains |
Unrealized loss |
Fair value |
|||||||||||||
| (unaudited) | ||||||||||||||||
| U.S. Agency notes |
$ | 20,530 | $ | 1 | $ | (6 | ) | $ | 20,525 | |||||||
| Corporate bonds |
28,554 | 2 | (28 | ) | 28,528 | |||||||||||
| Commercial paper |
11,518 | — | — | 11,518 | ||||||||||||
|
|
|
|
|
|
|
|
|
|||||||||
| Total Marketable Securities |
$ | 60,602 | $ | 3 | $ | (34 | ) | $ | 60,571 | |||||||
|
|
|
|
|
|
|
|
|
|||||||||
As of June 30, 2013 and December 31, 2012, there were no short-term investments with maturity dates greater than one year.
(4) Fair Value Measurements
Fair value is an exit price, the amount that would be received from the sale of an asset or paid to transfer a liability in an orderly transaction between market participants. The authoritative guidance on fair value measurements establishes a consistent framework for measuring fair value on either a recurring or nonrecurring basis whereby inputs, used in valuation techniques, are assigned a hierarchical level. The Company’s marketable securities are stated at fair value utilizing the same hierarchy.
The following three levels of inputs are used to measure fair value:
Level 1: Quoted prices in active markets for identical assets or liabilities.
Level 2: Observable inputs other than Level 1 prices such as quoted prices for similar assets or liabilities; quoted prices in markets that are not active; or other inputs that are observable or can be corroborated by observable market data for substantially the full term of the assets or liabilities.
Level 3: Unobservable inputs that are supported by little or no market activity and that are significant to the fair value of the assets or liabilities. Level 3 assets and liabilities include items where the determination of fair value requires significant management judgment or estimation.
The book value of the Company’s financial instruments not measured at fair value on a recurring basis, including cash, restricted cash, disbursement prefunding, customer funds receivables, line of credit and customer
F-29
Table of Contents
Xoom Corporation
Notes to Consolidated Financial Statements
(unaudited)
liabilities, approximates fair value due to the relatively short maturity, cash repayments or market interest rates of such instruments. The fair value of such financial instruments is determined using the income approach based on the present value of estimated future cash flows. The fair value of all of these instruments would be categorized as Level 2 of the fair value hierarchy, with the exception of cash which would be categorized as Level 1.
The Company’s cash equivalents and marketable securities that are measured at fair value on a recurring basis are classified as follows (in thousands):
| December 31, 2012 | June 30, 2013 | |||||||||||||||||||||||
| Level 1 | Level 2 | Level 3 | Level 1 | Level 2 | Level 3 | |||||||||||||||||||
| (unaudited) | ||||||||||||||||||||||||
| Cash and Cash Equivalents: |
||||||||||||||||||||||||
| Money market funds |
$ | 14,055 | $ | — | $ | — | $ | 35,832 | $ | — | $ | — | ||||||||||||
| U.S. Agency notes |
— | 150 | — | — | — | — | ||||||||||||||||||
| Corporate bonds |
— | 1,400 | — | — | — | — | ||||||||||||||||||
| Commercial paper |
— | — | — | — | 1,300 | — | ||||||||||||||||||
| Marketable Securities: |
||||||||||||||||||||||||
| U.S. Agency notes |
— | 3,857 | — | — | 20,525 | — | ||||||||||||||||||
| Corporate bonds |
— | 11,126 | — | — | 28,528 | — | ||||||||||||||||||
| Commercial paper |
9,142 | 11,518 | ||||||||||||||||||||||
|
|
|
|
|
|
|
|
|
|
|
|
|
|||||||||||||
| $ | 14,055 | $ | 25,675 | $ | — | $ | 35,832 | $ | 61,871 | $ | — | |||||||||||||
|
|
|
|
|
|
|
|
|
|
|
|
|
|||||||||||||
Financial instruments, which are traded in active markets, using quoted market prices for identical instruments are assigned a Level 1 under the fair value hierarchy. The Company obtains the fair value of its Level 2 financial instruments from a professional pricing service, which may use quoted market prices for identical or comparable instruments, or inputs other than quoted prices that are observable either directly or indirectly. The professional pricing service gathers quoted market prices and observable inputs for the Company’s financial instruments from a variety of industry data providers. The valuation techniques used to measure the fair value of Level 2 financial instruments were derived from nonbinding market consensus prices that are corroborated by observable market data, quoted market prices for similar instruments, or pricing models such as discounted cash flow techniques. There were no changes in the valuation techniques during any of the periods presented. To validate the reasonableness of fair values obtained from a professional pricing service, the Company performs several controls including periodic meetings with the pricing service and the Company’s custodians, obtaining the internal control reports of the pricing service and investigating any significant realized or unrealized gains or losses on its short-term investments. The Company believes that these controls coupled with the Company’s investment policy and the nature of its short-term investments sufficiently mitigate the Company’s valuation risk.
There were no transfers between Level 1 and Level 2 assets during any of the periods presented.
F-30
Table of Contents
Xoom Corporation
Notes to Consolidated Financial Statements
(unaudited)
(5) Property, Equipment and Software, Net
The following is a summary of property, equipment and software at cost, less accumulated depreciation and amortization (in thousands):
| December 31, 2012 |
June 30, 2013 |
|||||||
| (unaudited) | ||||||||
| Office furniture and equipment |
$ | 3,517 | $ | 3,858 | ||||
| Software |
2,932 | 3,441 | ||||||
| Leasehold improvements |
365 | 371 | ||||||
|
|
|
|
|
|||||
| 6,814 | 7,670 | |||||||
| Less: accumulated depreciation |
(2,930 | ) | (3,883 | ) | ||||
|
|
|
|
|
|||||
| $ | 3,884 | $ | 3,787 | |||||
|
|
|
|
|
|||||
(6) Accounts Payable and Accrued Expenses
The following is a summary of accounts payable and accrued expenses (in thousands):
| December 31, 2012 |
June 30, 2013 |
|||||||
| (unaudited) | ||||||||
| Accounts payable |
$ | 1,076 | $ | 1,411 | ||||
| Accrued processing and disbursement costs |
1,055 | 1,720 | ||||||
| Accrued marketing expense |
708 | 1,448 | ||||||
| Other accrued expenses |
4,311 | 3,657 | ||||||
|
|
|
|
|
|||||
| $ | 7,150 | $ | 8,236 | |||||
|
|
|
|
|
|||||
The Company is exposed to transaction losses due to fraud, as well as nonperformance of third parties and customers. The Company establishes reserves for such losses based on historical trends and any specific risks identified in processing customer transactions. Recoveries are reflected as a reduction in the reserve for transaction losses when the recovery occurs. This reserve is included in accounts payable and accrued expenses on the accompanying condensed consolidated balance sheets. The following table summarizes the Company’s reserve for transaction losses for the following period (in thousands, unaudited):
| Balance at |
Additions to Expense |
Losses Incurred |
Balance at June 30, 2013 |
|||||||||
| $547 | $ | 6,159 | $ | (5,857 | ) | $ | 849 | |||||
(7) Line of Credit
During the six months ended June 30, 2013, the Company borrowed $313.0 million and repaid $304.0 million under its line of credit. During the six months ended June 30, 2012, the Company borrowed $311.0 million and repaid $299.5 million under its line of credit.
In May 2013, the Company increased the outstanding letter of credit from $10.0 million to $15.0 million.
F-31
Table of Contents
Xoom Corporation
Notes to Consolidated Financial Statements
(unaudited)
At June 30, 2013, the Company had $16.0 million available under its $80.0 million line of credit, reflecting $49.0 million outstanding under the line of credit and $15.0 million reserved under the standby letter of credit. The interest rate at June 30, 2013 and December 31, 2012 was 4.5%.
(8) Income Taxes
The income tax provision for the six months ended June 30, 2013 and 2012 was $134,000 and $2,000, respectively. The change is primarily due to increased amounts of income which puts the Company into a U.S. federal minimum tax. The Company provides for income taxes using an asset and liability approach, under which deferred income taxes are provided based upon enacted tax laws and rates applicable to periods in which the taxes become payable.
The Company is subject to income tax in U.S. federal and various state jurisdictions. Presently, there are no ongoing income tax examinations in the jurisdictions where the Company operates.
As of June 30, 2013, the Company remains on a full valuation allowance deferred tax asset position. The realization of the Company’s deferred tax assets depends primarily on its ability to generate sufficient U.S. taxable income in future periods. The amount of deferred tax assets considered realizable may increase or decrease in subsequent quarters as management reevaluates the underlying basis for the estimates of future domestic taxable income.
(9) Stock-based Compensation
The fair value for options granted was estimated at the date of the grant using a Black-Scholes option-pricing model. The weighted-average grant date fair value of options granted was $8.98 and $3.35 for the six months ended June 30, 2013 and 2012, respectively. The following table presents the weighted-average assumptions for options granted during the periods presented:
| Six Months Ended June 30, |
||||||||
| 2012 | 2013 | |||||||
| (unaudited) | ||||||||
| Expected term (in years) |
6.3 | 6.2 | ||||||
| Risk-free interest rate |
1.37 | % | 1.02 | % | ||||
| Dividend yield |
None | None | ||||||
| Volatility rate |
42 | % | 44 | % | ||||
The following table presents the effects of stock based compensation on the Company’s condensed consolidated statement of operations during the periods presented (in thousands):
| Six Months Ended June 30, |
||||||||
| 2012 | 2013 | |||||||
| (unaudited) | ||||||||
| Stock-based compensation expense: |
||||||||
| Marketing |
$ | 117 | $ | 198 | ||||
| Technology and development |
318 | 522 | ||||||
| Customer service and operations |
109 | 184 | ||||||
| General and administrative |
464 | 833 | ||||||
F-32
Table of Contents
Xoom Corporation
Notes to Consolidated Financial Statements
(unaudited)
Stock option activity and related information during the period indicated was as follows (unaudited):
| Options Outstanding |
Weighted- Average Exercise Price |
Options Exercisable |
Exercisable Weighted- Average Exercise Price |
|||||||||||||
| Outstanding at December 31, 2012 |
6,730,520 | $ | 5.10 | 3,352,116 | $ | 2.20 | ||||||||||
| Granted |
354,250 | 20.82 | ||||||||||||||
| Exercised |
(265,560 | ) | 2.02 | |||||||||||||
| Forfeited |
(88,749 | ) | 10.34 | |||||||||||||
|
|
|
|||||||||||||||
| Outstanding at June 30, 2013 |
6,730,461 | $ | 5.98 | 3,694,041 | $ | 2.94 | ||||||||||
|
|
|
|||||||||||||||
On May 31, 2013, the Company granted 6,056 shares of unrestricted stock to certain non-employee directors of the Company who elected to receive their annual retainer in the form of Company stock in accordance with the Company’s Non-Employee Director Compensation Policy. These unrestricted stock awards were granted under the 2012 Stock Option and Incentive Plan and were fully vested on the date of grant.
As of June 30, 2013, there were 6,669,575 options that had vested and are expected to vest with a weighted-average exercise price of $5.95 and a weighted-average contractual life of 6.8 years. As of December 31, 2012, there were 6,663,152 options that had vested and were expected to vest with a weighted-average exercise price of $5.08 and a weighted-average contractual life of 7.1 years.
The aggregate intrinsic value of options outstanding was $114.0 million and the aggregate intrinsic value of options exercisable was $73.8 million as of June 30, 2013.
The total intrinsic value of options exercised was approximately $4.0 million and $86,000 for the six months ended June 30, 2013 and 2012, respectively.
The total fair value of options vested was approximately $1.9 million and $563,000 for the six months ended June 30, 2013 and 2012, respectively.
As of June 30, 2013, there was $11.3 million of total unrecognized compensation expense related to option grants, which is expected to be recognized over a weighted-average period of 3.22 years.
(10) Warrants
As of December 31, 2012, the Company had outstanding warrants to purchase 35,778 shares of common stock at a weighted-average exercise price of $4.84 per share. The warrants contained a customary cashless exercise feature, which allowed the warrant holder to pay the exercise price of the warrant by forfeiting a portion of the exercised warrant shares with a value equal to the aggregate exercise price. As part of the IPO, the warrants were exchanged for 24,955 shares of the Company’s common stock in a cashless exercise. As of June 30, 2013, the Company had no outstanding warrants.
(11) Earnings (Loss) Per Share
Basic earnings (loss) per share is computed by dividing the net income (loss) by the weighted-average number of shares of common stock outstanding during the period. Diluted earnings (loss) per share is computed using the weighted-average number shares of common stock outstanding during the period and, when dilutive, potential common shares outstanding during the period. Potential common shares consist of incremental shares
F-33
Table of Contents
Xoom Corporation
Notes to Consolidated Financial Statements
(unaudited)
issuable upon the assumed exercise of stock options, preferred stock and warrants. Diluted earnings (loss) per share is the same as basic earnings (loss) per share for the six months ended June 30, 2012 because the effects of potentially dilutive items were anti-dilutive given the Company’s net loss in each of those periods.
The following table presents the calculation of earnings (loss) per share (in thousands, except per share data):
| Six Months Ended June 30, |
||||||||
| 2012 | 2013 | |||||||
| (unaudited) | ||||||||
| Basic earnings (loss) per share: |
||||||||
| Numerator |
||||||||
| Net income (loss) |
$ | (2,106 | ) | $ | 4,011 | |||
|
|
|
|
|
|||||
| Denominator |
||||||||
| Weighted-average common shares |
5,035 | 26,046 | ||||||
|
|
|
|
|
|||||
| Basic earnings (loss) per share |
$ | (0.42 | ) | $ | 0.15 | |||
|
|
|
|
|
|||||
| Diluted earnings (loss) per share: |
||||||||
| Numerator: |
||||||||
| Net income (loss) |
$ | (2,106 | ) | $ | 4,011 | |||
|
|
|
|
|
|||||
| Denominator: |
||||||||
| Weighted-average common shares |
5,035 | 26,046 | ||||||
|
|
|
|
|
|||||
| Weighted-average shares from convertible preferred stock |
— | 5,331 | ||||||
| Effect of dilutive securities |
— | 4,488 | ||||||
|
|
|
|
|
|||||
| Weighted-average common shares and equivalents |
5,035 | 35,865 | ||||||
|
|
|
|
|
|||||
| Diluted earnings (loss) per share |
$ | (0.42 | ) | $ | 0.11 | |||
|
|
|
|
|
|||||
The following securities have been excluded from the calculation of diluted net earnings (loss) per share of common stock for the periods presented because including them would have been anti-dilutive (in thousands):
| Six Months Ended June 30, |
||||||||
| 2013 | 2012 | |||||||
| (unaudited) | ||||||||
| Common shares from convertible preferred stock |
— | 21,444 | ||||||
| Common shares from common stock warrants |
— | 36 | ||||||
| Stock options outstanding |
355 | 6,242 | ||||||
|
|
|
|
|
|||||
| Total common stock equivalents |
355 | 27,722 | ||||||
|
|
|
|
|
|||||
(12) Legal Proceedings
In February 2011, the Company filed a lawsuit in federal court in the Northern District of California against Motorola Mobility, Inc. and other affiliated companies (together, “Motorola”) alleging trademark infringement and other related claims, stemming from Motorola’s use of the name “XOOM” in connection with its wireless
F-34
Table of Contents
Xoom Corporation and Subsidiary
Notes to Condensed Consolidated Financial Statements
(unaudited)
tablet devices and related accessories. In July 2013, the Company and Motorola (together, the “Parties”) entered into a confidential settlement agreement. As a result of the settlement, the matter has been resolved to the satisfaction of the Parties, and Motorola will phase out its use of the “XOOM” brand. The settlement did not have a significant impact on the financial position of the Company or its financial statements.
The Company is not a party to any other material pending legal proceedings. The Company may also be involved from time to time in various legal proceedings in the normal course of business.
F-35
Table of Contents
Table of Contents
Shares
Common Stock
Prospectus
, 2013
Barclays
Needham & Company
Table of Contents
PART II
INFORMATION NOT REQUIRED IN PROSPECTUS
| Item 13. | Other Expenses of Issuance and Distribution. |
The expenses (other than underwriting discounts and commissions) payable by us in connection with this offering are as follows:
| Amount | ||||
| SEC registration fee |
$ | 9,548 | ||
| Financial Industry Regulatory Authority, Inc. fee |
$ | 11,000 | ||
| Additional NASDAQ Global Select Market listing fee |
* | |||
| Accountants’ fees and expenses |
* | |||
| Legal fees and expenses |
* | |||
| Transfer Agent’s fees and expenses |
* | |||
| Printing expenses |
* | |||
| Miscellaneous |
* | |||
|
|
|
|||
| Total Expenses |
$ | * | ||
|
|
|
|||
| * | To be completed by amendment. |
All expenses are estimated except for the SEC fee and the Financial Industry Regulatory Authority, Inc. fee.
| Item 14. | Indemnification of Directors and Officers. |
Section 145 of the Delaware General Corporation Law (the “DGCL”) authorizes a corporation to indemnify its directors and officers against liabilities arising out of actions, suits and proceedings to which they are made or threatened to be made a party by reason of the fact that they have served or are currently serving as a director or officer to a corporation. The indemnity may cover expenses (including attorneys’ fees) judgments, fines and amounts paid in settlement actually and reasonably incurred by the director or officer in connection with any such action, suit or proceeding. Section 145 permits corporations to pay expenses (including attorneys’ fees) incurred by directors and officers in advance of the final disposition of such action, suit or proceeding. In addition, Section 145 provides that a corporation has the power to purchase and maintain insurance on behalf of its directors and officers against any liability asserted against them and incurred by them in their capacity as a director or officer, or arising out of their status as such, whether or not the corporation would have the power to indemnify the director or officer against such liability under Section 145.
Provisions in our certificate of incorporation and bylaws limit or eliminate the personal liability of our directors to the fullest extent permitted by the DGCL, as it now exists or may in the future be amended. Consequently, a director will not be personally liable to us or our stockholders for monetary damages or breach of fiduciary duty as a director, except for liability for:
| • | any breach of the director’s duty of loyalty to us or our stockholders; |
| • | any act or omission not in good faith or that involves intentional misconduct or a knowing violation of law; |
| • | any unlawful payments related to dividends or unlawful stock purchases, redemptions or other distributions; or |
| • | any transaction from which the director derived an improper personal benefit. |
These limitations of liability do not alter director liability under the federal securities laws and do not affect the availability of equitable remedies such as an injunction or rescission.
II-1
Table of Contents
In addition, our bylaws provide that:
| • | we will indemnify our directors, officers and, in the discretion of our board of directors, certain employees to the fullest extent permitted by the DGCL, as it now exists or may in the future be amended; and |
| • | we will advance reasonable expenses, including attorneys’ fees, to our directors and, in the discretion of our board of directors, to our officers and certain employees, in connection with legal proceedings relating to their service for or on behalf of us, subject to limited exceptions. |
We have entered into indemnification agreements with each of our directors and certain of our executive officers. These agreements provide that we will indemnify each of our directors, certain of our executive officers and, at times, their affiliates to the fullest extent permitted by Delaware law. We will advance expenses, including attorneys’ fees (but excluding judgments, fines and settlement amounts), to each indemnified director, executive officer or affiliate in connection with any proceeding in which indemnification is available and we will indemnify our directors and officers for any action or proceeding arising out of that person’s services as a director or officer brought on behalf of the Company and/ or in furtherance of our rights. Additionally, each of our directors may have certain rights to indemnification, advancement of expenses and/or insurance provided by their affiliates, which indemnification relates to and might apply to the same proceedings arising out of such director’s services as a director referenced herein. Nonetheless, we have agreed in the indemnification agreements that the Company’s obligations to those same directors are primary and any obligation of the affiliates of those directors to advance expenses or to provide indemnification for the expenses or liabilities incurred by those directors are secondary.
We also maintain general liability insurance which covers certain liabilities of our directors and officers arising out of claims based on acts or omissions in their capacities as directors or officers, including liabilities under the Securities Act.
The underwriting agreement filed as Exhibit 1.1 to this registration statement provides for indemnification of us and our directors and officers by the underwriters against certain liabilities under the Securities Act and the Exchange Act.
| Item 15. | Recent Sales of Unregistered Securities. |
Since January 1, 2010, we made sales of the following unregistered securities:
| • | We granted to our employees, directors, consultants and other service providers options to purchase an aggregate of 4,807,090 shares of common stock under our 2010 Plan at exercise prices ranging from $4.48 to $14.12 per share. |
| • | In October and November 2010, we issued 283,223 shares of preferred stock to certain accredited investors upon the exercise of outstanding warrants at an exercise price of $3.52 per share. |
| • | In August 2011, we issued 15,446 shares of common stock to an accredited investor upon the cashless exercise of an outstanding warrant at an exercise price of $0.20 per share. |
| • | From January 2010 to November 2011, we sold 3,840,556 shares of our Series F preferred stock at a price of $11.45 per share for an aggregate price of $43,972,049. |
We believe these transactions were exempt from registration under the Securities Act in reliance upon Section 4(2) of the Securities Act or Regulation D promulgated thereunder, or Rule 701 promulgated under Section 3(b) of the Securities Act as transactions by an issuer not involving any public offering or pursuant to benefit plans and contracts relating to compensation as provided under Rule 701. The recipients of the securities in each of these transactions represented their intentions to acquire the securities for investment only and not with a view to or for sale in connection with any distribution thereof, and appropriate legends were placed upon the stock certificates issued in these transactions. All recipients had adequate access, through their relationships with us, to information about Xoom.
II-2
Table of Contents
| Item 16. | Exhibits and Financial Statement Schedules. |
(a) Exhibits
See the Exhibit Index on the page immediately following the signature page for a list of exhibits filed as part of this registration statement on Form S-1, which Exhibit Index is incorporated herein by reference.
(b) Schedules
All schedules are omitted because the required information is either not present, not present in material amounts or is presented within the consolidated financial statements included in the prospectus that is part of this registration statement.
| Item 17. | Undertakings. |
The undersigned registrant hereby undertakes to provide to the underwriter at the closing specified in the underwriting agreements, certificates in such denominations and registered in such names as required by the underwriter to permit prompt delivery to each purchaser.
Insofar as indemnification for liabilities arising under the Securities Act of 1933, as amended, may be permitted to directors, officers and controlling persons of the registrant pursuant to the foregoing provisions, or otherwise, the registrant has been advised that in the opinion of the Securities and Exchange Commission such indemnification is against public policy as expressed in the Act, and is, therefore, unenforceable. In the event that a claim for indemnification against such liabilities (other than the payment by the registrant of expenses incurred or paid by a director, officer or controlling person of the registrant in the successful defense of any action, suit or proceeding) is asserted by such director, officer or controlling person in connection with the securities being registered, the registrant will, unless in the opinion of its counsel the matter has been settled by the controlling precedent, submit to a court of appropriate jurisdiction the question whether such indemnification by it is against public policy as expressed in the Act and will be governed by the final adjudication of such issue.
The undersigned registrant hereby undertakes that:
| • | For purposes of determining any liability under the Securities Act, the information omitted from the form of prospectus filed as part of this registration statement in reliance upon Rule 430A and contained in a form of prospectus filed by the registrant pursuant to Rule 424(b)(1) or (4), or 497(h) under the Securities Act shall be deemed to be part of this registration statement as of the time it was declared effective. |
| • | For the purpose of determining any liability under the Securities Act, each post-effective amendment that contains a form of prospectus shall be deemed to be a new registration statement relating to the securities offered therein and the offering of such securities at that time shall be deemed to be the initial bona fide offering thereof. |
II-3
Table of Contents
SIGNATURES
Pursuant to the requirements of the Securities Act of 1933, as amended, the registrant has duly caused this registration statement to be signed on its behalf by the undersigned, thereunto duly authorized, in the City of San Francisco, State of California, on this 12th day of August, 2013.
| Xoom Corporation | ||
| By: |
/s/ John Kunze | |
| John Kunze, Chief Executive Officer | ||
POWER OF ATTORNEY
KNOW ALL MEN BY THESE PRESENTS, that each person whose signature appears below constitutes and appoints John Kunze and Ryno Blignaut, and each of them, his or her true and lawful attorneys in fact and agents, each with full power of substitution and resubstitution, for him or her and in his or her name, place and stead, in any and all capacities, to sign any and all amendments, including post-effective amendments, to this Registration Statement, and any registration statement relating to the offering covered by this Registration Statement and filed pursuant to Rule 462(b) under the Securities Act of 1933, as amended, and to file the same, with exhibits thereto and other documents in connection therewith, with the SEC, granting unto said attorneys-in-fact and agents, and each of them, full power and authority to do and perform each and every act and thing requisite and necessary to be done, as fully to all intents and purposes as he or she might or could do in person, hereby ratifying and confirming all that each of said attorneys in fact and agents or their substitute or substitutes may lawfully do or cause to be done by virtue hereof.
Pursuant to the requirements of the Securities Act of 1933, as amended, this Registration Statement has been signed by the following persons in the capacities and on the dates indicated.
| Signature |
Title |
Date | ||
| /s/ John Kunze John Kunze |
President, Chief Executive Officer and Director (Principal Executive Officer) | August 12, 2013 | ||
| /s/ Ryno Blignaut Ryno Blignaut |
Chief Financial Officer (Principal Financial and Accounting Officer) | August 12, 2013 | ||
| /s/ Roelof Frederik Botha Roelof Frederik Botha |
Director | August 12, 2013 | ||
| /s/ Alison Davis Alison Davis |
Director | August 12, 2013 | ||
| /s/ Murray J. Demo Murray J. Demo |
Director | August 12, 2013 | ||
| /s/ Kevin E. Hartz Kevin E. Hartz |
Director | August 12, 2013 | ||
| /s/ C. Richard Kramlich C. Richard Kramlich |
Director | August 12, 2013 | ||
| /s/ Anne Mitchell Anne Mitchell |
Director | August 12, 2013 | ||
| /s/ Keith Rabois Keith Rabois |
Director | August 12, 2013 | ||
| /s/ Matthew Roberts Matthew Roberts |
Director | August 12, 2013 | ||
II-4
Table of Contents
EXHIBIT LIST
| Number |
Description |
Incorporated by Reference From Form |
Incorporated by Reference From Number |
Date Filed | ||||
| 1.1 | Form of Underwriting Agreement | |||||||
| 3.1 | Amended and Restated Certificate of Incorporation of the Registrant | S-1 | 3.3 | January 11, 2013 | ||||
| 3.2 | Amended and Restated Bylaws of the Registrant | S-1 | 3.5 | January 11, 2013 | ||||
| 4.1 | Form of Common Stock certificate of the Registrant | S-1 | 4.1 | January 11, 2013 | ||||
| 4.2 | Fourth Amended and Restated Investor’s Rights Agreement by and between the Registrant and certain of its stockholders dated December 21, 2009 | S-1 | 4.2 | January 11, 2013 | ||||
| 4.3 | Amendment No. 1 to the Fourth Amended and Restated Investor’s Rights Agreement, the Third Amended and Restated Voting Agreement and the Fourth Amended and Restated Right of First Refusal and Co-Sale Agreement by and between the Registrant and certain of its stockholders dated February 24, 2010 | S-1 | 4.3 | January 11, 2013 | ||||
| 5.1* | Opinion of Goodwin Procter LLP | |||||||
| 10.1# | Amended and Restated 2010 Stock Option and Grant Plan (which amended and restated the 2001 Stock Plan) and forms of agreements thereunder | S-1 | 10.1 | January 11, 2013 | ||||
| 10.2# | 2012 Stock Option and Incentive Plan and forms of agreements thereunder | S-1 | 10.2 | January 11, 2013 | ||||
| 10.3# | Senior Executive Cash Incentive Bonus Plan | S-1 | 10.3 | January 11, 2013 | ||||
| 10.4 | Form of Indemnification Agreement | S-1 | 10.4 | January 11, 2013 | ||||
| 10.5# | Executive Agreement by and between the Registrant and John Kunze dated November 27, 2012 | S-1 | 10.5 | January 11, 2013 | ||||
| 10.6# | Form of Executive Agreement with other executive officers | S-1 | 10.6 | January 11, 2013 | ||||
| 10.7 | Office Lease by and between the Registrant and 100 Bush Corporation dated August 15, 2008, as amended | S-1 | 10.7 | January 11, 2013 | ||||
| 10.8 | Credit Agreement by and between the Registrant, the several lenders from time to time parties thereto and Silicon Valley Bank dated September 19, 2012 | S-1 | 10.8 | January 11, 2013 | ||||
| 10.9 | Guarantee and Collateral Agreement by and between the Registrant and Silicon Valley Bank dated September 19, 2012 | S-1 | 10.9 | January 11, 2013 | ||||
| 10.10† | Money Transfer Agreement by and between the Registrant’s subsidiary and Punjab National Bank dated August 7, 2006, as amended | S-1 | 10.10 | January 11, 2013 | ||||
| 21.1 | Subsidiary of the Registrant | S-1 | 21.1 | January 11, 2013 | ||||
| 23.1 | Consent of KPMG LLP, Independent Registered Public Accounting Firm | |||||||
| 23.3* | Consent of Goodwin Procter LLP (included in Exhibit 5.1) | |||||||
| 24.1 | Power of Attorney (included in page II-4) | |||||||
| * | To be filed by amendment. |
| # | Indicates management contract or compensatory plan, contract or agreement. |
| † | Portions of this agreement have been granted confidential treatment by the Securities and Exchange Commission. |