Attached files
| file | filename |
|---|---|
| 8-K - FORM 8-K - JONES LANG LASALLE INC | d579404d8k.htm |
 Investor Presentation
August 2013
50,000 employees
200 offices
70 countries
1 global platform
1
Exhibit 99.1 |
 Table of Contents
I.
Company Description
II.
Global Growth Strategy
III.
Financial Overview
IV.
Appendix
2 |
 Company
Description 3 |
 Creating real value for clients and our firm
4
Shareholder opportunity
•
Leading global market positions
•
Consolidator in a consolidating industry
•
Productivity and margin expansion
Premier global investment manager
•
LaSalle Investment Management provides outstanding
performance for global real estate investors
•
Investment expertise including core, value-add,
opportunistic investing across property types
•
More than 300 institutional clients worldwide
Global real estate services
•
Strategic, fully integrated services for real estate
owners, occupiers and investors
•
Productivity and cost solutions for corporate clients
•
Industry leader recognized for deep
market knowledge
and execution
Shareholder value
•
Strong cash-generating business model
•
Revenue growth
•
Investment-grade balance sheet
•
Effective tax and interest expense management |
 Jones
Lang Wootton founded
1783
1968
1997
1999
LaSalle Partners
founded
LaSalle Partners initial
public offering
LaSalle Partners and Jones
Lang Wootton merge to create
Jones Lang LaSalle
Integrated global platform
(NYSE ticker “JLL”)
Strategic M&A establishes premier market position
2008
The Staubach Company and
Jones Lang LaSalle combine operations
Largest merger in JLL history transforms
U.S. local markets position
King Sturge (est. 1760) and Jones Lang LaSalle merge EMEA operations
Enhances strength and depth of service capabilities in the UK and EMEA
1760
2011
5
14% compound annual
revenue growth rate since
1999 merger |
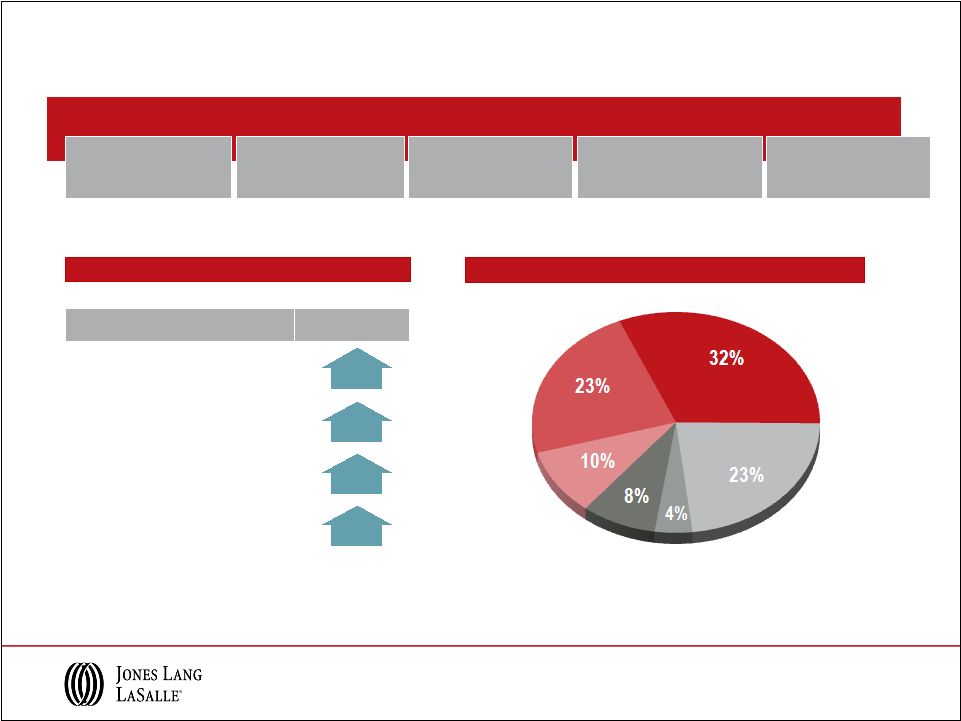
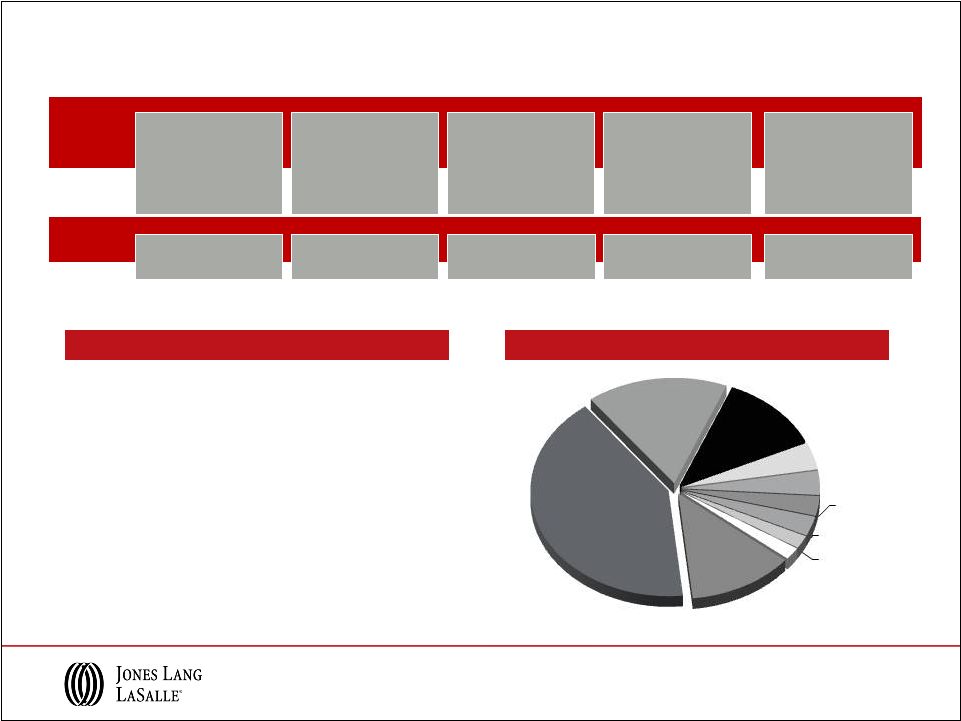
 Delivering integrated services globally
2012 Fee Revenue = $3.6B
Global Distribution
Leasing
Advisory
& Other
LaSalle Inv. Mgmt.
Property & Facility
Mgmt.
Project &
Development
Services
Capital Markets
Other
United Kingdom
France
Germany
Other
Europe
Japan
Greater China
(incl. Hong Kong)
Australia
India
Singapore
EMEA
Asia Pacific
Americas
43%
5%
3%
4%
6%
7%
10%
13%
4%
3%
2%
United
States
6 |
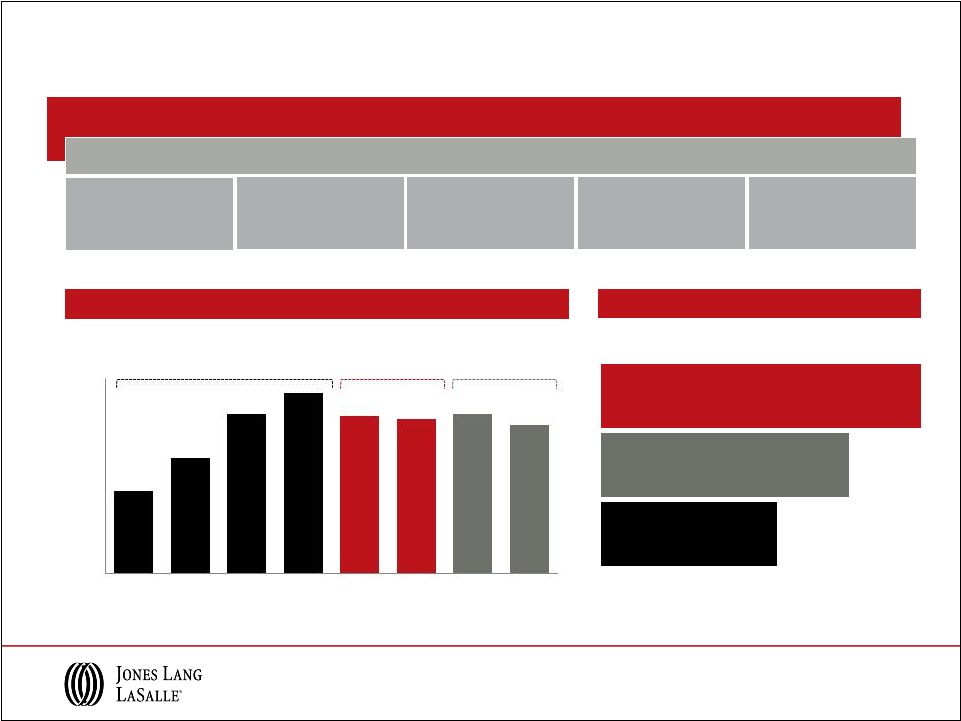
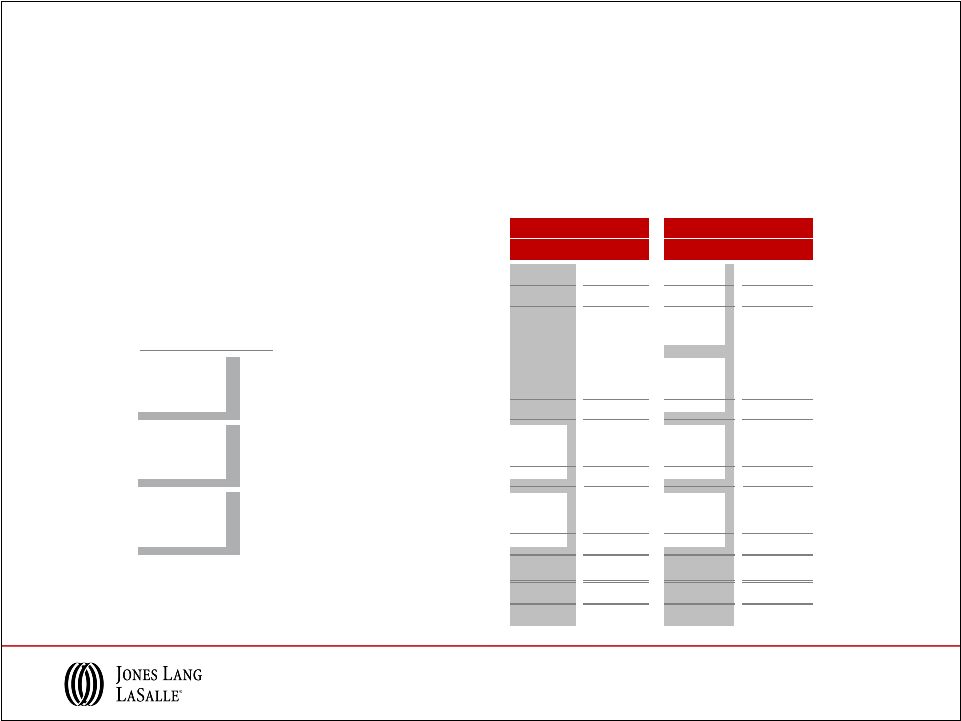
 Repositioning Creates Opportunity: Trends from 2002 to 2012
Growth in a consolidating industry
Jones Lang LaSalle ($ in millions)
Fee Revenue
Adjusted Operating Income
Market Cap
1
~4x
$3,640
$860
2002
2012
~5x
$340
$67
2002
2012
~5x
$3,836
$786
2002
2012
(1) Based on peak share price in each year
Opportunity
Trend
Toward centralized decisions
Toward larger, global service providers
Toward cross-border investing
Toward market share growth for established brands
7
Complex corporate real estate portfolio decisions benefit from
JLL’s expertise
Few players possess JLL’s breadth of service
and reach
Global platform and deep research create opportunities for
cross-border investor clients
High-quality brand, reputation and platform attract
and retain top talent |
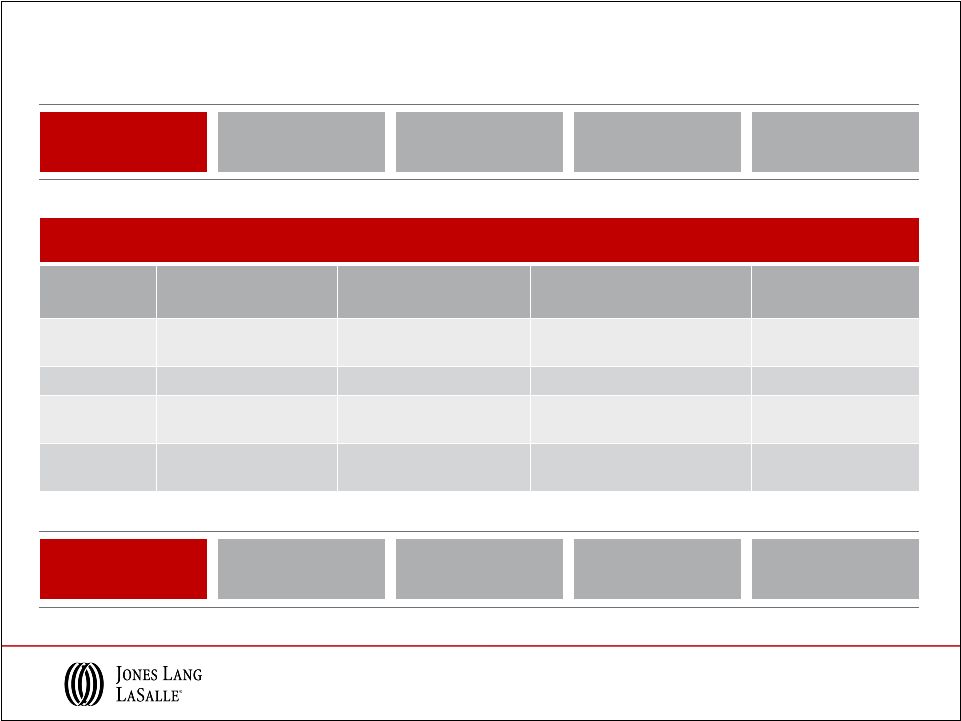
 JLL
3-Year Performance Market Trends
Emerging markets to
lead global expansion
Demand for
local and global services
Outsourcing growth
continues
Top asset managers win
investor mandates
Industry
consolidation
(1)
Other Financing Activities include change in working capital, debt issue costs and
share activity related to taxes on stock awards Market share
expansion drives growth and cash generation 3-Year Cash from Earnings =
$962M New
Acquisitions
Deferred Acquisition
Obligations
Co-Investment
Other Financing
Activities¹
Dividends
CapEx
8
Metric
Growth
Revenue
34%
Adjusted Net Income
48%
Adjusted EBITDA
29%
Adjusted EPS
45% |
 Global
Growth Strategy 9 |
           G5
CONNECTIONS:
Differentiate and Sustain
G5 global growth strategy
G4
G2
G3
G1
Build our local and
regional leasing
and capital
markets business
Capture the leading
share of global
capital flows for
investment sales
Strengthen our winning
positions in Corporate
Solutions
Grow LaSalle Investment
Management’s leadership
position
10 |
 Full-Year Capital Markets & Leasing Markets Volumes
Q2 2013 v. Q2 2012
FY 2013 v. FY 2012
Gross Absorption
Gross Absorption
Leasing
Americas (U.S. only)
-3%
0-5%
EMEA (Europe only)
-3%
Flat
Asia Pacific (select markets)
-25%
-10-15%
Total
-5%
Flat
Q2 2013 v. Q2 2012
FY 2013 v. FY 2012
Market Volumes
Market Volumes
Capital Markets
Americas
11%
10-15%
EMEA
2%
Flat
Asia Pacific
18%
10-15%
Total
10%
5-10%
2013 Leasing volumes predicted flat to 2012
Projected 2013 Capital Markets volumes: $450 -
$500 Billion
11 |
 +15-20%
0
50
100
150
200
250
300
350
Americas
EMEA
Asia Pacific
2005
2006
2007
2008
2009
2010
2011
2012
2013 Projection
Flat
+10-15%
($ in billions)
Global capital flows for investment sales
* EMEA: In US$ terms, unchanged in Euro terms.
Source: Jones Lang LaSalle, July 2013
Direct Commercial Real Estate Investment, 2005-2013
2013 Capital Markets volumes projected up 5-10% on 2012
Projection updates as of Q2:
Americas: Previous forecast was up 15-20% EMEA:
Unchanged
Asia Pacific: Unchanged
Consolidated: Previous forecast was up 10-15%
12 |
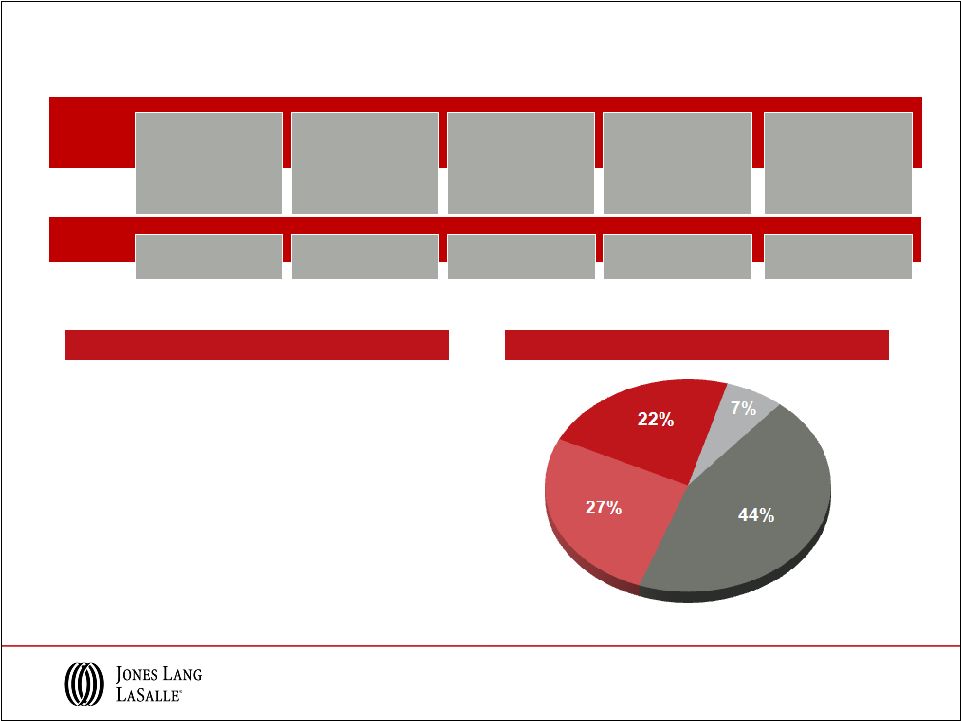
 Asia
Pacific EMEA
Americas
$593
$781
$753
$1,000
$1,188
$1,278
$557
$317
$203
$306
$460
*
$513
Leasing
Capital Markets
Scale and leadership in Leasing and Capital Markets
Market Outlook
Overall, Leasing volumes projected flat to 2012 levels
2013 Capital Markets volumes projected up
5%-10% on 2012
JLL Revenue
($ in millions)
**
*
* July 2008: Staubach Company acquired, annual revenue = $375 million
**May 2011: King Sturge acquired, annual revenue -
$260 million
13 |
 Global outsourcing propels Corporate Solutions
Competitive Advantages
Global
Position
Transformational
outsourcing
Space
optimization
Portfolio transparency
Energy
management
Expertise across services & geographies to capitalize on market trends
JLL’s world-class capabilities
2012 JLL Client Wins
Scalable platform
Integrated Service
Wins
58
Wins
48
Expansions
39
Renewals
47
Large Corporations
Middle Market
14
Transaction
management
Energy &
sustainability
Single point of
accountability |
 $228
$245
$238
$242
$278
$245
$178
$128
Competitive Advantages
Diversified global
platform
Core, Value Add,
Opportunistic,
Public Equity
300+
institutional clients
Consistent client
services delivery model
Financial backing
of well-capitalized
parent company
Proven performance history with long-standing client relationships
($ millions)
2005 to 2012 Advisory Fees
Assets Under Management
Q2 2013 AUM = $46B
Performance drives LaSalle Investment Management
Building Advisory Fees in
Healthy Markets
Global Financial
Crisis
Stabilized
Advisory Fees
($ billions)
Fund Management $14.6
Public Securities $10.3
Separate Accounts $21.4
15
$0
$100
$200
$300
2005
2006
2007
2008
2009
2010
2011
2012 |
 Consolidating industry leads to JLL opportunity
Transformative Results
The Staubach
Company
King Sturge
Meghraj
Trinity Funds
Management
Strategy
Establish leading U.S. local
market tenant rep position
Strengthen local market
scale, particularly in the UK
Augment India corporate business
with leading local presence
Gain scale and credibility
in Australia for LaSalle
Purchase Price
$613 million
£197 million
$60 million
A$9 million
Payment
Structure
36% upfront;
64% deferred over 5 years
50% upfront;
50% deferred over 5 years
50% upfront:
50% deferred over 5 years
100% upfront
EBITDA
multiple
8.0x notional,
7.0x on PV basis
7.5x notional,
7.0x on PV basis
7.5x
4.0x
Strategic
Align with
G5 strategy
Enhance service
delivery for clients
Cultural
alignment
Meet
financial goals
Financial
Profit growth to
shareholders
Neutral to accretive
EBITDA multiples
EPS accretive within
12-18 months
Maintain investment
grade strength
16 |
 Financial Overview
17 |
 Note:
2012 and 2011 adjusted for restructuring and intangible amortization. 2012
Fee
Revenue
Adjusted
Net Income
$245M
Adjusted
EPS
$5.48
Adjusted
EBITDA
$436M
Adjusted EBITDA
Margin
12.0%
Gross revenue : $3.9B
2011
$215M
$4.83
$395M
11.7%
$3.4B
US GAAP: $164M
US GAAP: $3.70
EBITDA: $339M
EBITDA margin: 9.5%
Gross Revenue: $3.6B
US GAAP: $208M
US GAAP: $4.63
EBITDA: $391M
EBITDA margin: 9.9%
Continued solid fee revenue growth with 7% increase
for the second quarter and YTD
Capital Markets & Hotels outperformed markets in all
regions
Healthy corporate outsourcing pipeline; transitioning
new clients from previous wins
Focus on market share growth and improved
productivity across the firm
$3.6B
Consolidated earnings scorecard
H1 2013 Performance & Priorities
2012 Revenue Contribution
Americas
LIM
Asia Pacific
EMEA
18
Margin is calculated on a fee revenue basis. |
 YTD 2013 Real Estate Services Revenue
($ in millions; % change in USD
over YTD 2012)
Note: Segment and Consolidated Real Estate Services (“RES”) operating
revenue exclude Equity earnings (losses). Fee revenue presentation of
Property & Facility Management, Project & Development Services and Total RES Operating Revenue excludes
gross contract costs.
Leasing
$350.1
4%
$109.1
(4%)
$68.6
(13%)
$527.8
0%
Capital Markets & Hotels
$92.1
32%
$121.5
36%
$64.7
43%
$278.3
36%
Property & Facility
Management
$218.6
7%
$89.7
5%
$200.5
6%
$508.8
6%
Fee Revenue
$175.7
5%
$82.5
0%
$164.7
10%
$422.9
6%
Project & Development
Services
$80.7
(5%)
$112.1
9%
$41.2
13%
$234.0
4%
Fee Revenue
$80.1
(5%)
$51.6
3%
$31.6
2%
$163.3
(1%)
Advisory,
Consulting & Other
$51.5
4%
$80.7
0%
$43.3
7%
$175.5
2%
Total RES Operating
Revenue
$793.0
7%
$513.1
9%
$418.3
7%
$1,724.4
7%
Fee Revenue
$749.5
6%
$445.4
7%
$372.9
8%
$1,567.8
6%
Americas
EMEA
Asia Pacific
Total RES
19 |
 2012
Fee
Revenue
Operating Income
$168M
Operating Income
Margin
10.1%
EBITDA
$210M
EBITDA Margin
12.7%
Gross revenue : $1.7B
2011
$163M
10.8%
$201M
13.4%
$1.5B
Leasing and Capital Markets both outpaced market
volumes; strong transaction pipelines for remainder
of 2013
Growing Property & Facility Management revenue
from new outsourcing assignments;
transitioning
new clients to generate revenue growth in second
half of 2013
Actively managing cost base to drive performance,
particularly in challenging economies such as
Brazil
$1.7B
Americas Real Estate Services
H1 2013 Performance & Priorities
2012 Revenue Contribution
Note:
Margin
is
calculated
on
a
fee
revenue
basis.
See
Appendix
for
calculation
of
fee
revenue.
EBITDA
margin
for
2012
and
2011
would
have
been
~13.0%
after
adjusting
2012
compensation
expense
for
the
Staubach
acquisition
payment
and
adjusting
2011
compensation expense for the elimination of SOP.
20
United
States
92%
Brazil 3%
Canada 2%
Mexico 1%
Other
Americas 2% |
 2012
Fee
Revenue
Operating Income
$58M
Operating Income
Margin
6.2%
EBITDA
$75M
EBITDA Margin
8.0%
Gross revenue : $1.0B
2011
$39M
4.4%
$57M
6.5%
$888M
UK, France and Spain drove a 28% increase in
Capital Markets & Hotels revenue in the second
quarter, up 37% YTD 2013
Project & Development Services; Tetris fit-out
business continues to grow, expanding offer to
hotel and retail clients
EMEA operating margins up significantly for the
first half of 2013 versus 2012, reflecting strong
performance in flat overall markets
$936M
EMEA Real Estate Services
H1 2013 Performance & Priorities
2012 Revenue Contribution
Note: Operating income has been adjusted to exclude $5 million of King Sturge
intangibles amortization. Margin is calculated on a fee revenue
basis. See Appendix for calculation of fee revenue. 21
U.K. 41%
France 17%
Germany
12%
Russia 4%
Spain 4%
Netherlands
3%
Belgium 3%
Italy 2%
MENA 2%
Other EMEA
12% |
 2012
Fee
Revenue
Operating Income
$65M
Operating Income
Margin
8.4%
EBITDA
$78M
EBITDA Margin
10.0%
Gross revenue : $876M
2011
$66M
9.3%
$78M
11.0%
$731M
Revenue growth of 11% in first half of 2013 led by 44%
transactional growth in Capital Markets & Hotels, well
above market volume increases
Leasing revenue down 12% in H1, but outperformed
market volumes that were down 21%, reflecting
hesitancy among corporate clients to make space
decisions
Winning Corporate Solutions business continues to
generate profitable, recurring revenue; Property & Facility
Management revenue up 14% YTD 2013
$781M
Asia Pacific Real Estate Services
H1 2013 Performance & Priorities
2012 Revenue Contribution
Note:
Margin
is
calculated
on
a
fee
revenue
basis.
See
Appendix
for
calculation
of
fee
revenue.
22 |
 2012
Fee
Revenue
Operating Income
$72M
Operating Income
Margin
25.2%
EBITDA
$74M
EBITDA Margin
25.9%
2011
$57M
20.7%
$60M
21.7%
$275M
$1.8B of capital was raised during the quarter, $2.4
billion YTD 2013
Improved investment activity and capital raising will
generate growth in AUM and in advisory fees as
the capital is invested
Expect lower incentive fees for FY 2013 compared
with FY 2012
Equity earnings of $15 million YTD 2013 reflects
continued positive investment performance for our
clients
$285M
LaSalle Investment Management
H1 2013 Performance & Priorities
Q2 2013 Assets Under Management
($ in billions)
Note: AUM data reported on a one-quarter lag.
23 |
 Strong balance sheet position
Investment
grade
balance
sheet;
Baa2
/
BBB-
(Stable)
–
–
–
Healthy
net
debt
position
entering
historically
strong
second
half
–
Net debt reduction of $37 million during Q2; consistent with previous
seasonal borrowing pattern
Semi-annual dividend increased by 10% to $0.22 per share from
$0.20 per share
–
Paid June 14, 2013
Q2 Capital Spending primarily on Deferred Acquisition Payments
and Earn Outs
Q2 2013
Q2 2012
–
Cap Ex
$ 18M
$ 13M
–
New M&A Payment
$ 2M
$ 0M
–
Deferred Acquisition Payments/ Earn Outs
$ 72M
$ 41M
–
Co-Investment
($10M)
($20M)
Q2 2013 Highlights
24
Balance Sheet
Q2
Q1
Q4
$ millions
2013
2013
2012
Cash
$ 122
$ 133
$ 152
51
38
32
Credit Facility
479
470
169
Net Bank Debt
$ 408
$ 375
$ 49
LT Senior Notes
275
275
275
Deferred Acquisition
Obligations
150
220
214
Total Net Debt
$ 833
$ 870
$ 538
Low debt cost: Q2 2013 net interest expense of $9.0M
Credit
facility
capacity
of
$1.1B
Diversified funding sources with $275M, 4.4% coupon Long Term
Senior Notes issued in Q4 2012
Short Term Borrowings |
 Jones
Lang LaSalle Integrated global
services
Industry-leading
research and market
expertise
Superior client
relationship
management
Strong
brand
Investment-grade
balance sheet
Solid performance in growth opportunities
JLL actions for continued success
Optimism returning to global markets
Leverage global positions to grow market share and
continue client success in local markets
Increase productivity and manage costs to improve margin
Continue to invest strategically to capitalize
on market consolidation
Maintain financial strength and flexibility to respond to
opportunities and challenges
On-going industry consolidation
trends continue
Continuing growth in
corporate outsourcing
Steady institutional capital flows
into global real estate
25 |
 Appendix
26 |
 as of
Q2 2013 Leasing Values
Source: Jones Lang LaSalle
Asia Pacific
EMEA
Americas
as of Q2 2013
Capital Values
JLL Property Clocks
SM
Chicago
Hong
Kong
Singapore
Brussels
Dallas, Frankfurt
Houston
San Francisco
Toronto
Rental Value
growth slowing
Rental Value
growth
accelerating
Rental Values
bottoming out
Rental Values
falling
Los
Angeles, Seoul, Shanghai
Tokyo
Washington, DC
Mexico
City
Sao Paulo
Paris
Mumbai, Boston
Madrid
New York
Istanbul, Dubai
London
Berlin, Moscow
Stockholm
Amsterdam
Johannesburg
Milan
Capital Value
growth slowing
Capital Value
growth
accelerating
Capital Values
bottoming out
Capital Values
falling
Boston, Chicago
San Francisco, Houston, Berlin
Washington DC, Amsterdam
Toronto
Sao
Paulo, Paris
Mexico
City, Frankfurt
Dallas, Singapore
New York, Los Angeles, Stockholm
Beijing
Shanghai
Mumbai
Seoul, Tokyo
Sydney
Milan
Madrid
Brussels
London
Moscow
Hong Kong
Beijing
Sydney
27 |
 Q2 2013 Real Estate Services Revenue
($ in millions; % change in USD
over Q2 2012)
Note: Segment and Consolidated Real Estate Services (“RES”) operating
revenue exclude Equity earnings (losses). Fee revenue presentation of
Property & Facility Management, Project & Development Services and Total RES Operating Revenue excludes
gross contract costs.
Leasing
$197.8
6%
$60.2
(9%)
$40.6
(11%)
$298.6
0%
Capital Markets & Hotels
$53.4
27%
$63.2
27%
$41.0
72%
$157.6
36%
Property & Facility
Management
$110.1
8%
$46.9
9%
$100.5
8%
$257.5
8%
Fee Revenue
$86.3
5%
$42.0
0%
$82.3
10%
$210.6
6%
Project & Development
Services
$42.7
(5%)
$56.2
7%
$21.4
11%
$120.3
3%
Fee Revenue
$42.3
(6%)
$27.6
7%
$16.2
(1%)
$86.1
(1%)
Advisory,
Consulting & Other
$27.5
3%
$41.6
(3%)
$25.0
10%
$94.1
2%
Total RES Operating
Revenue
$431.5
7%
$268.1
5%
$228.5
12%
$928.1
8%
Fee Revenue
$407.3
6%
$234.6
4%
$205.1
12%
$847.0
6%
Americas
EMEA
Asia Pacific
Total RES
28 |
 FY 2012 Real Estate Services revenue
($
in
millions;
%
change
in
USD
over
FY
2011)
Note: Segment and Consolidated Real Estate Services (“RES”) operating
revenue exclude Equity earnings (losses). Fee revenue presentation of
Property & Facility Management, Project & Development Services and Total RES Operating Revenue excludes gross
contract costs.
Leasing
$829.6
9%
$250.0
6%
$198.2
3%
$1,277.8
7%
Capital Markets & Hotels
$168.5
24%
$235.1
3%
$109.3
15%
$512.9
12%
Property & Facility
Management
$458.7
31%
$155.2
5%
$398.4
9%
$1,012.3
17%
Fee Revenue
$375.0
14%
$155.2
5%
$319.9
12%
$850.1
12%
Project & Development
Services
$182.9
3%
$219.8
21%
$83.5
3%
$486.2
10%
Fee Revenue
$182.1
2%
$106.5
11%
$67.2
13%
$355.8
7%
Advisory,
Consulting & Other
$107.0
9%
$189.1
6%
$86.1
6%
$382.2
7%
Total RES Operating
Revenue
$1,746.7
15%
$1,049.2
8%
$875.5
7%
$3,671.4
11%
Fee Revenue
$1,662.2
11%
$935.9
5%
$780.7
10%
$3,378.8
8%
Americas
EMEA
Asia Pacific
Total RES
29 |
          Fee revenue / expense reconciliation
•
Reimbursable vendor, subcontractor and out-of-pocket costs reported as revenue
and expense in JLL financial statements have been steadily increasing
•
Margins diluted as gross-accounting requirements increase revenue and costs without
corresponding profit •
Business managed on a “fee”
basis to focus on margin expansion in the base business
($ in millions)
2013
2012
2013
2012
Consolidated Revenue
989.4
$
921.3
$
1,845.4
$
1,734.7
$
Consolidated Operating Expenses
917.0
846.7
1,749.7
1,636.4
Adjusted Operating Income Margin
7.4%
8.3%
5.2%
5.9%
Gross Contract Costs:
Property & Facility Management
23.8
19.9
42.9
35.7
Project & Development Services
0.4
0.2
0.6
0.3
Total Gross Contract Costs
24.2
20.1
43.5
36.0
Property & Facility Management
4.9
1.4
7.2
2.7
Project & Development Services
28.6
26.6
60.5
53.0
Total Gross Contract Costs
33.5
28.0
67.7
55.7
Property & Facility Management
18.2
18.1
35.8
40.3
Project & Development Services
5.2
2.9
9.6
5.6
Total Gross Contract Costs
23.4
21.0
45.4
45.9
Consolidated Fee Revenue
908.3
$
852.2
$
1,688.8
$
1,597.1
$
Consolidated Fee-based Operating Expenses
835.9
$
777.6
$
1,593.1
$
1,498.8
$
Adjusted Operating Income Margin ("fee"-based)
8.0%
9.0%
5.7%
6.4%
Asia Pacific
Americas
EMEA
Q2
YTD
Note: Consolidated revenue and fee revenue exclude equity earnings (losses).
Restructuring and acquisition charges are excluded from operating
expenses. Restructuring and acquisition charges as well as intangible
amortization related to the King Sturge acquisition are excluded from operating
expenses when calculating adjusted operating income margin. 30
|
   2013
2012
2013
2012
46.3
$
37.2
$
59.4
$
51.2
$
45,141
44,847
45,091
44,726
1.03
$
0.83
$
1.32
$
1.14
$
46.3
$
37.2
$
59.4
$
51.2
$
5.0
12.4
7.4
19.1
0.4
1.2
0.8
2.8
51.7
$
50.8
$
67.6
$
73.1
$
45,141
44,847
45,091
44,726
1.15
$
1.13
$
1.50
$
1.63
$
Adjusted earnings per share
Three Months Ended
June 30,
Six Months Ended
June 30,
($ in millions)
GAAP Net income attributable to common
shareholders
Shares (in 000s)
GAAP earnings per share
GAAP Net income attributable to common
shareholders
Restructuring and acquisition charges, net
Intangible amortization, net
Adjusted net income
Shares (in 000s)
Reconciliation of GAAP net income to adjusted net income and
calculations of earnings per share
31 |
   Reconciliation of GAAP operating income to adjusted operating
income and net income to adjusted EBITDA
2013
2012
2013
2012
65.8
$
58.1
$
85.9
$
72.7
$
6.6
16.6
9.8
25.6
0.6
1.6
1.1
3.8
73.0
76.3
96.8
102.1
49.5
$
37.7
$
62.7
$
51.9
$
9.0
7.5
17.0
14.9
16.4
12.8
20.8
17.7
20.2
20.0
39.2
39.6
95.1
$
78.0
$
139.7
$
124.1
$
6.6
16.6
9.8
25.6
101.7
$
94.6
$
149.5
$
149.7
$
Adjusted EBITDA
Three Months
Ended June 30,
Six Months Ended
June 30,
($ in millions)
GAAP Net income
Interest expense, net of interest income
Provision for income taxes
Depreciation and amortization
EBITDA
Restructuring and acquisition charges
Operating Income
Restructuring and acquisition charges
Intangible amortization
Adjusted Operating Income
32 |
 Forward-looking statements
Statements in this presentation regarding, among other things, future financial results
and performance, achievements, plans and objectives and dividend payments may be
considered forward-looking statements within the meaning of the Private
Securities Litigation Reform Act of 1995. Such statements involve known and
unknown risks, uncertainties and other factors which may cause actual results,
performance, achievements, plans and objectives of Jones Lang LaSalle to be
materially different from those expressed or implied by such forward-looking
statements. Factors that could cause actual results to differ materially include those discussed
under
“Business,”
“Risk
Factors,”
“Management’s
Discussion
and
Analysis
of
Financial
Condition
and
Results
of
Operations,”
“Quantitative
and
Qualitative
Disclosures
about
Market
Risk,”
“Cautionary
Note
Regarding
Forward-
Looking
Statements”
and
elsewhere
in
Jones
Lang
LaSalle’s
Annual
Report
on
Form
10-K
for
the
year
ended
December 31, 2012, in the Quarterly Report on Form 10-Q for the quarter ended June
30, 2013 and in other reports filed with the Securities and Exchange Commission.
There can be no assurance that future dividends will be declared since the actual
declaration of future dividends, and the establishment of record and payment dates,
remains
subject
to
final
determination
by
the
Company’s
Board
of
Directors.
Statements
speak
only
as
of
the
date of this presentation. Jones Lang LaSalle expressly disclaims any obligation or
undertaking to update or revise any forward-looking statements contained
herein to reflect any change in Jones Lang LaSalle’s expectations or results,
or any change in events. ©
Jones Lang LaSalle IP, Inc. 2013. All rights reserved. No part of this publication may be
reproduced by any means, whether graphically, electronically, mechanically or
otherwise howsoever, including without limitation photocopying and recording on
magnetic tape, or included in any information store and/or retrieval system
without prior written permission of Jones Lang LaSalle IP, Inc.
33 |