Attached files
| file | filename |
|---|---|
| 8-K - 8-K - CommunityOne Bancorp | a8kfor2q2013earningspresen.htm |

CommunityOne Bancorp August 12, 2013 Second Quarter 2013
Presenters Brian Simpson Chief Executive Officer David Nielsen Chief Financial Officer Neil Machovec Chief Credit Officer 2

Forward Looking Statements & Other Information Forward Looking Statements This presentation contains certain forward-looking statements within the safe harbor rules of the federal securities laws. These statements generally relate to COB’s financial condition, results of operations, plans, objectives, future performance or business. They usually can be identified by the use of forward-looking terminology, such as “believes,” “expects,” or “are expected to,” “plans,” “projects,” “goals,” “estimates,” “may,” “should,” “could,” “would,” “intends to,” “outlook” or “anticipates,” or variations of these and similar words, or by discussions of strategies that involve risks and uncertainties. Forward looking statements are subject to risks and uncertainties, including but not limited to, those risks described in COB’s Annual Report on Form 10-K for the year ended December 31, 2012 under the section entitled “Item 1A, Risk Factors,” and in the Quarterly Reports of Form 10-Q and other reports that are filed by COB with the Securities and Exchange Commission. You are cautioned not to place undue reliance on these forward-looking statements, which are subject to numerous assumptions, risks and uncertainties, and which change over time. These forward-looking statements speak only as of the date of this presentation. Actual results may differ materially from those expressed in or implied by any forward looking statements contained in this presentation. We assume no duty to revise or update any forward-looking statements, except as required by applicable law. Non-GAAP Financial Measures In addition to the results of operations presented in accordance with Generally Accepted Accounting Principles (GAAP), COB management uses and this presentation contains or references, certain non-GAAP financial measures, such as core earnings, core noninterest expense, core noninterest income, net interest income on a fully taxable equivalent basis, pro forma total ALL and fair value mark, Granite purchased impaired loan ALL and FV mark, Granite purchased contractual loan ALL and FV mark and tangible shareholders’ equity. COB believes these non-GAAP financial measures provide information useful to investors in understanding our underlying operational performance and our business and performance trends as they facilitate comparisons with the performance of others in the financial services industry; however, these non-GAAP financial measures should not be considered an alternative to GAAP. The non- GAAP financial measures contained within this presentation should be read in conjunction with the audited financial statements and analysis as presented in COB’s Annual Report on Form 10-K as well as the unaudited financial statements and analyses as presented in COB’s Quarterly Reports on Form 10-Q. A reconciliation of non-GAAP measures to the most directly comparable GAAP measure is included within tables in the presentation or with the appendix to this presentation. 3

Quarterly Operating Highlights 2Q 2013 net loss from continuing operations of $3.2 million – $1.4 million better than 1Q 2013 – $1.1 million ALL recovery on Granite portfolio Net loss per common share of $0.15 per share, compared to net loss of $0.21 in 1Q 2013 Core earnings were $2.1 million in 2Q, up from $0.1 million in 1Q Net interest margin in 2Q improved to 3.27% in 2Q vs 3.20% in 1Q and 3.06% in 2Q 2012 Core noninterest expense to average assets reduced to 3.54% from 3.65% in 1Q 2013 4 Quarterly Performance Metrics Dollars in thousands except per share data 2Q 2012 3Q 2012 4Q 2012 1Q 2013 2Q 2013 Net loss before taxes from continuing operations (18,112)$ (4,789)$ (7,207)$ (2,743)$ (2,947)$ Net loss from continuing operations, net of taxes (18,138) (4,712) (6,296) (4,596) (3,183) Net loss to common shareholders (18,138) (4,712) (6,296) (4,596) (3,183) (0.86) (0.22) (0.29) (0.21) (0.15) Net loss to common shareholders per share (0.86) (0.22) (0.29) (0.21) (0.15) Return on average assets (3.13%) (0.83%) (1.14%) (0.88%) (0.62%) Return on average equity (60.99%) (17.42%) (23.86%) (19.30%) (14.50%) Net interest margin 3.06% 2.95% 2.96% 3.20% 3.27% Core noninterest expense to average assets 1 3.38% 3.37% 3.14% 3.65% 3.54% 1 Non-GAAP measure. See Appendix for reconciliation to GAAP presentation. Net loss from continuing operations to common shareholders per share Quarterly Results Results of Operations Dollars in thousands, except per share data 2Q 2012 3Q 2012 4Q 2012 1Q 2013 2Q 2013 Net interest income 16,049$ 15,202$ 14,849$ 15,173$ 15,414$ Provision for loan losses (7,778) (32) (3,172) (110) 1,057 Noninterest incom 6,532 4,643 6,957 6,533 5,247 Noninterest expense (32,915) (24,602) (25,841) (24,339) (24,665) Net loss from continuing operations, net of taxes (18,138) (4,712) (6,296) (4,596) (3,183) Net loss to common shareholders (18,138) (4,712) (6,296) (4,596) (3,183) 911$ 936$ 2,328$ 93$ 2,083$ 1 Non-GAAP measure. See Appendix for reconciliation to GAAP presentation. Core Earnings 1
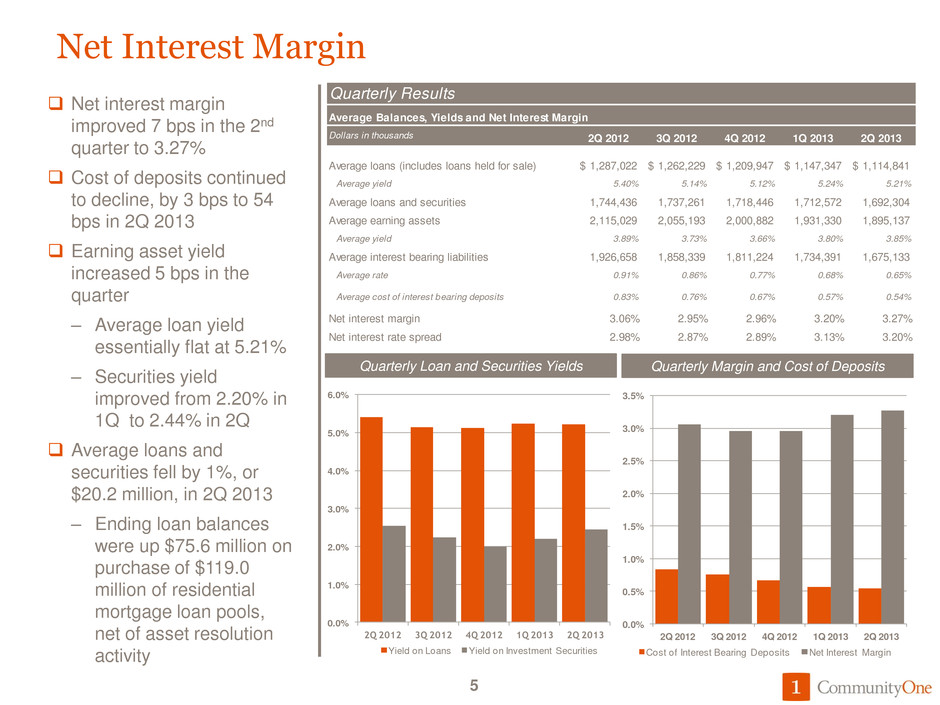
0.0% 0.5% 1.0% 1.5% 2.0% 2.5% 3.0% 3.5% 2Q 2012 3Q 2012 4Q 2012 1Q 2013 2Q 2013 Cost of Interest Bearing Deposits Net Interest Margin 0.0% 1.0% 2.0% 3.0% 4.0% 5.0% 6.0% 2Q 2012 3Q 2012 4Q 2012 1Q 2013 Q 2013 Yield on Loans Yield on Investment Securities Net Interest Margin Net interest margin improved 7 bps in the 2nd quarter to 3.27% Cost of deposits continued to decline, by 3 bps to 54 bps in 2Q 2013 Earning asset yield increased 5 bps in the quarter – Average loan yield essentially flat at 5.21% – Securities yield improved from 2.20% in 1Q to 2.44% in 2Q Average loans and securities fell by 1%, or $20.2 million, in 2Q 2013 – Ending loan balances were up $75.6 million on purchase of $119.0 million of residential mortgage loan pools, net of asset resolution activity 5 Quarterly Loan and Securities Yields Quarterly Results Average Balances, Yields and Net Interest Margin Dollars in thousands 2Q 2012 3Q 2012 4Q 2012 1Q 2013 2Q 2013 Average loans (includes loans held for sale) 1,287,022$ 1,262,229$ 1,209,947$ 1,147,347$ 1,114,841$ Average yield 5.40% 5.14% 5.12% 5.24% 5.21% Average loans and securities 1,744,436 1,737,261 1,718,446 1,712,572 1,692,304 Average earning assets 2,115,029 2,055,193 2,000,882 1,931,330 1,895,137 Average yield 3.89% 3.73% 3.66% 3.80% 3.85% Average interest bearing liabilities 1,926,658 1,858,339 1,811,224 1,734,391 1,675,133 Average rate 0.91% 0.86% 0.77% 0.68% 0.65% Average cost of interest bearing deposits 0.83% 0.76% 0.67% 0.57% 0.54% Net interest margin 3.06% 2.95% 2.96% 3.20% 3.27% Net interest rate spread 2.98% 2.87% 2.89% 3.13% 3.20% Quarterly Margin and Cost of Deposits

Quarterly Noninterest Income Core noninterest income increased $0.7 million (18%) to $4.9 million from 1Q 2013 Strong noninterest income quarter – Service charge income rebounded in 2Q post conversion and expiration of the service charge waiver – Strongest quarter since recap for Wealth with revenue up $153 thousand over 1Q – Mortgage loan income up $177 thousand over 1Q Nonrecurring securities gains of $0.3 million in 2Q compared to $2.4 million in 1Q 6 Quarterly Results Noninterest Income Dollars in thousands 2Q 2012 3Q 2012 4Q 2012 1Q 2013 2Q 2013 Service charges on deposit accounts 1,830$ 1,778$ 1,656$ 1,376$ 1,681$ Mortgage loan income 287 728 1,014 744 921 Cardholder and merchant services income 1,176 1,119 1,143 1,069 1,174 Trust and investment services 256 234 344 241 394 Bank-owned life insurance 314 290 285 263 276 Other service charges, commissions and fees 271 252 351 258 337 Securities gains/(losses), net 2,002 (33) 2,198 2,377 345 Other income/(loss) 396 275 (34) 205 119 Total noninterest income 6,532$ 4,643$ 6,957$ 6,533$ 5,247$ Less: Securities gains/(losses), net 2,002 (33) 2,198 2,377 345 Core noninterest income 1 4,530$ 4,676$ 4,759$ 4,156$ 4,902$ 1 Non-GAAP measure. Reconciliation included in this table.

Quarterly Noninterest Expense Core NIE decreased in 2Q 2013 by $1 million, or 5% – $0.7 million decrease in professional expenses Non-Core NIE increased by $1.3 million from 1Q 2013 – Accelerated reappraisal of all OREO drove expenses of $2.4 million vs 1Q – Merger-related expenses increased $0.5 million in 2Q - now complete Expect Core NIE to trend downward for remainder of year – Consolidated 6 branches in bank merger – Closed 2 branches on June 28 – Reduced ending FTE count to 607 at June 30 7 Quarterly Results Noninterest Expense Dollars in thousands 2Q 2012 3Q 2012 4Q 2012 1Q 2013 2Q 2013 Personnel expense 10,581$ 9,744$ 9,700$ 10,679$ 10,807$ Net occupancy expense 1,608 1,716 1,576 1,831 1,671 Furniture, equipment and data processing expense 2,141 2,182 2,326 2,368 2,094 Professional fees 1,250 1,473 1,001 1,493 760 Stationery, printing and supplies 153 152 191 186 187 Advertising and marketing 125 166 537 665 179 Other real estate owned expense 12,473 3,602 6,289 883 3,332 Credit/debit card expense 437 432 438 425 473 FDIC insurance 1,225 1,056 620 670 664 Loan collection expense 514 1,119 895 1,572 1,408 Merger-related expense (840) 939 884 1,509 1,989 Core deposit intangible amortization 352 352 351 352 352 Other expense 2,896 1,669 1,033 1,706 749 Total noninterest expense 32,915$ 24,602$ 25,841$ 24,339$ 24,665$ Less: Other real estate owned expense 12,473$ 3,602$ 6,289$ 883$ 3,332$ Merger-related expense (840) 939 884 1,509 1,989 Loan collection expense 514 1,119 895 1,572 1,408 Branch closure and restructuring expenses - - 96 587 15 Granite Mortgage and litigation accruals 1,100 - - - (370) Rebranding expense - - 397 552 58 Core noninterest expense 1 19,668$ 18,942$ 17,280$ 19,236$ 18,233$ Average Quarterly FTE Employees 634 637 627 633 628 1 Non-GAAP measure. Reconciliation included in this table.
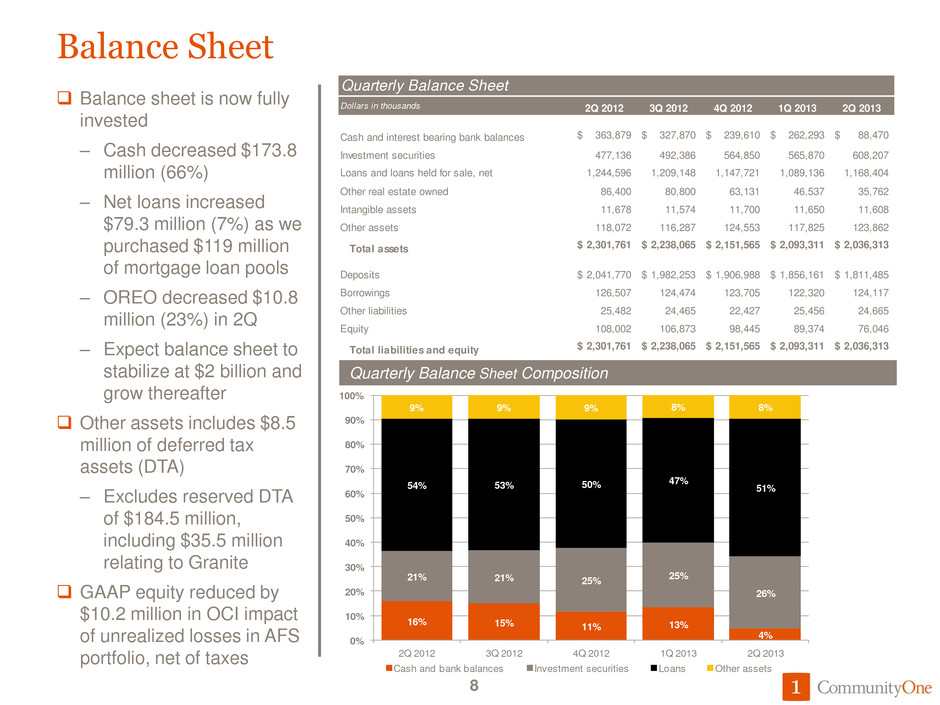
Quarterly Balance Sheet Dollars in thousands 2Q 2012 3Q 2012 4Q 2012 1Q 2013 2Q 2013 Cash and interest bearing bank balances 363,879$ 327,870$ 239,610$ 262,293$ 88,470$ Investment securities 477,136 492,386 564,850 565,870 608,207 Loans and loans held for sale, net 1,244,596 1,209,148 1,147,721 1,089,136 1,168,404 Other real estate owned 86,400 80,800 63,131 46,537 35,762 Intangible assets 11,678 11,574 11,700 11,650 11,608 Other assets 118,072 116,287 124,553 117,825 123,862 Total assets 2,301,761$ 2,238,065$ 2,151,565$ 2,093,311$ 2,036,313$ Deposits 2,041,770$ 1,982,253$ 1,906,988$ 1,856,161$ 1,811,485$ Borrowings 126,507 124,474 123,705 122,320 124,117 25,482 24,465 22,427 25,456 24,665 Equity 108,002 106,873 98,445 89,374 76,046 Total liabilities and equity 2,301,761$ 2,238,065$ 2,151,565$ 2,093,311$ 2,036,313$ Other liabilities 16% 15% 11% 13% 4% 21% 21% 25% 25% 26% 54% 53% 50% 47% 51% 9% 9% 9% 8% 8% 0% 10% 20% 30% 40% 50% 60% 70% 80% 90% 100% 2Q 2012 3Q 2012 4Q 2012 1Q 2013 2Q 2013 Cash and bank balances Investment securities Loans Other assets Balance Sheet Balance sheet is now fully invested – Cash decreased $173.8 million (66%) – Net loans increased $79.3 million (7%) as we purchased $119 million of mortgage loan pools – OREO decreased $10.8 million (23%) in 2Q – Expect balance sheet to stabilize at $2 billion and grow thereafter Other assets includes $8.5 million of deferred tax assets (DTA) – Excludes reserved DTA of $184.5 million, including $35.5 million relating to Granite GAAP equity reduced by $10.2 million in OCI impact of unrealized losses in AFS portfolio, net of taxes 8 Quarterly Balance Sheet Composition
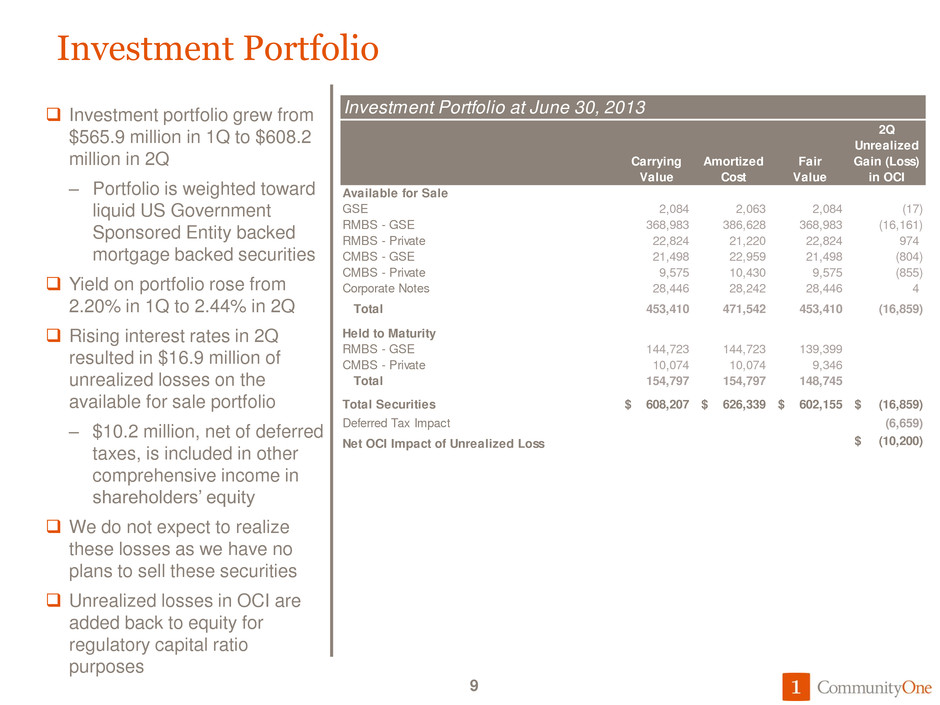
Investment Portfolio Investment portfolio grew from $565.9 million in 1Q to $608.2 million in 2Q – Portfolio is weighted toward liquid US Government Sponsored Entity backed mortgage backed securities Yield on portfolio rose from 2.20% in 1Q to 2.44% in 2Q Rising interest rates in 2Q resulted in $16.9 million of unrealized losses on the available for sale portfolio – $10.2 million, net of deferred taxes, is included in other comprehensive income in shareholders’ equity We do not expect to realize these losses as we have no plans to sell these securities Unrealized losses in OCI are added back to equity for regulatory capital ratio purposes 9 Investment Portfolio at June 30, 2013 Carrying Value Amortized Cost Fair Value 2Q Unrealized Gain (Loss) in OCI Available for Sale GSE 2,084 2,063 2,084 (17) RMBS - GSE 368,983 386,628 368,983 (16,161) RMBS - Private 22,824 21,220 22,824 974 CMBS - GSE 21,498 22,959 21,498 (804) CMBS - Private 9,575 10,430 9,575 (855) Corporate Notes 28,446 28,242 28,446 4 Total 453,410 471,542 453,410 (16,859) Held to Maturity RMBS - GSE 144,723 144,723 139,399 CMBS - Private 10,074 10,074 9,346 Total 154,797 154,797 148,745 Total Securities 608,207$ 626,339$ 602,155$ (16,859)$ Deferred Tax Impact (6,659) Net OCI Impact of Unrealized Loss (10,200)$
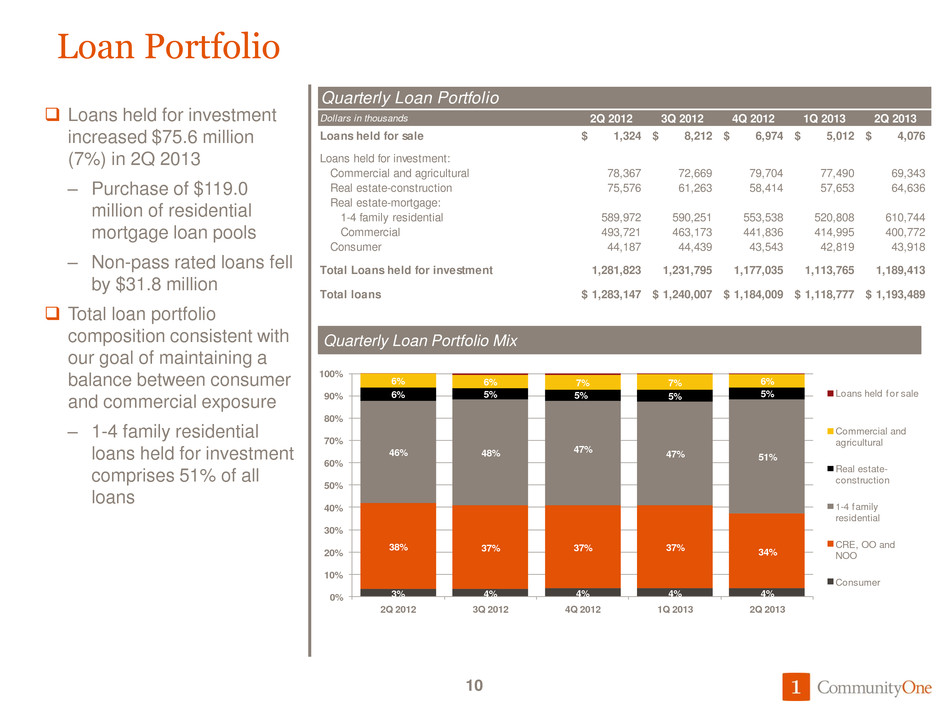
3% 4% 4% 4% 4% 38% 37% 37% 37% 34% 46% 48% 47% 47% 51% 6% 5% 5% 5% 5% 6% 6% 7% 7% 6% 0% 10% 20% 30% 40% 50% 60% 70% 80% 90% 100% 2Q 2012 3Q 2012 4Q 2012 1Q 2013 2Q 2013 Loans held for sale Commercial and agricultural Real estate- construction 1-4 family residential CRE, OO and NOO Consumer Loan Portfolio Loans held for investment increased $75.6 million (7%) in 2Q 2013 – Purchase of $119.0 million of residential mortgage loan pools – Non-pass rated loans fell by $31.8 million Total loan portfolio composition consistent with our goal of maintaining a balance between consumer and commercial exposure – 1-4 family residential loans held for investment comprises 51% of all loans 10 Quarterly Loan Portfolio Mix Quarterly Loan Portfolio Dollars in thousands 2Q 2012 3Q 2012 4Q 2012 1Q 2013 2Q 2013 Loans held for sale 1,324$ 8,212$ 6,974$ 5,012$ 4,076$ Loans held for investment: Commercial and agricultural 78,367 72,669 79,704 77,490 69,343 Real estate-construction 75,576 61,263 58,414 57,653 64,636 Real estate-mortgage: 1-4 family residential 589,972 590,251 553,538 520,808 610,744 Commercial 493,721 463,173 441,836 414,995 400,772 Consumer 44,187 44,439 43,543 42,819 43,918 Total Loans held for investment 1,281,823 1,231,795 1,177,035 1,113,765 1,189,413 Total loans 1,283,147$ 1,240,007$ 1,184,009$ 1,118,777$ 1,193,489$

13% 13% 13% 14% 17% 17% 18% 19% 20% 18% 4% 4% 4% 4% 4% 22% 23% 24% 25% 24% 23% 23% 22% 21% 20% 5% 3% 3% 3% 3% 17% 16% 15% 14% 13% 0% 20% 40% 60% 80% 100% 2Q 2012 3Q 2012 4Q 2012 1Q 2013 2Q 2013 Noninterest-bearing demand Interest-bearing demand Savings Money market Time deposits < $100,000 Brokered Time deposits > $100,000 Deposits Low cost core deposits increased from 82% at year end 2012 to 84% of the total at 2Q 2013 Deposit mix profile continues to improve – Indeterminate term core now represents 64% of deposits, up from 63% last quarter – Time deposits, including brokered deposits, declined to 36% from 37% last quarter Cost of interest bearing deposits fell to 54 bps and the cost of all deposits fell to 47 bps Deposits declined by $45.1 million (2%), virtually all in higher cost CDs 11 Quarterly Deposit Mix Co re N o n -Co re Quarterly Deposits Dollars in thousands 2Q 2012 3Q 2012 4Q 2012 1Q 2013 2Q 2013 Noninterest-bearing demand 262,087$ 264,370$ 251,235$ 265,455$ 304,992$ Interest-bearing demand 353,586 358,376 362,406 364,282 334,087 Savings 72,925 73,382 74,436 79,895 80,682 Money market 441,824 450,164 455,734 455,337 442,720 Brokered 96,747 63,455 55,590 47,339 47,220 Time deposits < $100,000 471,366 449,542 417,421 386,087 360,874 Time deposits > $100,000 343,235 322,964 290,166 258,166 240,910 Total deposits 2,041,770$ 1,982,253$ 1,906,988$ 1,856,561$ 1,811,485$
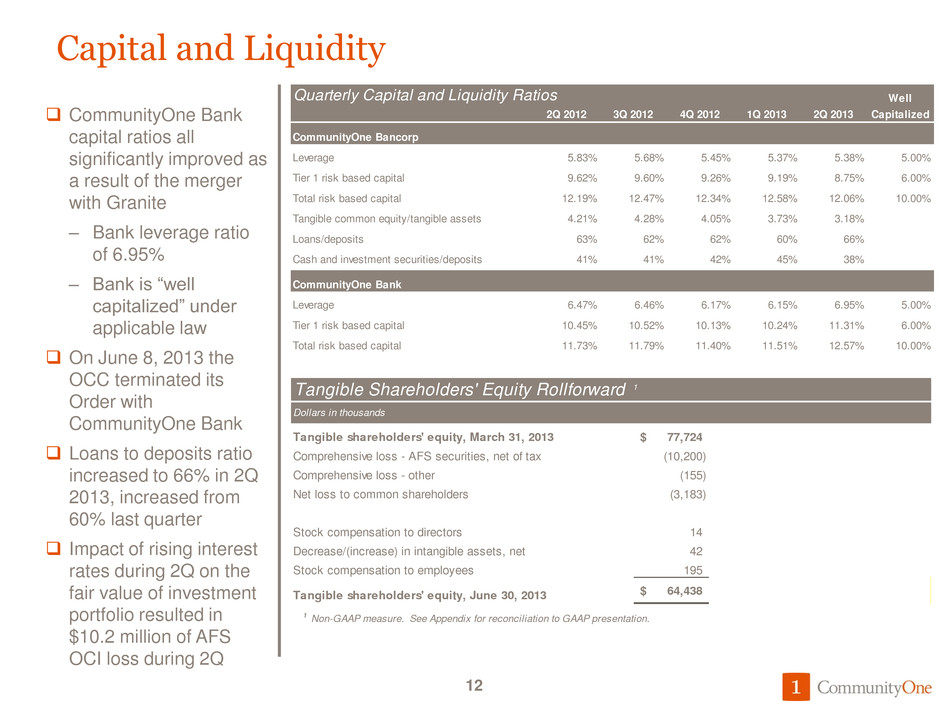
Capital and Liquidity CommunityOne Bank capital ratios all significantly improved as a result of the merger with Granite – Bank leverage ratio of 6.95% – Bank is “well capitalized” under applicable law On June 8, 2013 the OCC terminated its Order with CommunityOne Bank Loans to deposits ratio increased to 66% in 2Q 2013, increased from 60% last quarter Impact of rising interest rates during 2Q on the fair value of investment portfolio resulted in $10.2 million of AFS OCI loss during 2Q 12 Quarterly Capital and Liquidity Ratios Well 2Q 2012 3Q 2012 4Q 2012 1Q 2013 2Q 2013 Capitalized CommunityOne Bancorp Leverage 5.83% 5.68% 5.45% 5.37% 5.38% 5.00% Tier 1 risk based capital 9.62% 9.60% 9.26% 9.19% 8.75% 6.00% Total risk based capital 12.19% 12.47% 12.34% 12.58% 12.06% 10.00% Tangible common equity/tangible assets 4.21% 4.28% 4.05% 3.73% 3.18% Loans/deposits 63% 62% 62% 60% 66% Cash and investment securities/deposits 41% 41% 42% 45% 38% CommunityOne Bank Leverage 6.47% 6.46% 6.17% 6.15% 6.95% 5.00% Tier 1 risk based capital 10.45% 10.52% 10.13% 10.24% 11.31% 6.00% Total risk based capital 11.73% 11.79% 11.40% 11.51% 12.57% 10.00% T gible Shareholders' Equity Rollforward 1 Dollars in thousands Tangible shareholders' equity, March 31, 2013 77,724$ o prehensive loss - AFS securities, net of tax (10,200) Comprehensive loss - other (155) N t loss to common shareholders (3,183) Stock compensation to directors 14 Decrease/(increase) in intangible assets, net 42 Stock compensation to employees 195 Tangible shareholders' equity, June 30, 2013 64,438$ 1 Non-GAAP measure. See Appendix for reconciliation to GAAP presentation.

$96 $86 $79 $71 $59 $86 $81 $63 $47 $36 $0 $20 $40 $60 $80 $100 $120 $140 $160 $180 $200 2Q 2012 3Q 2012 4Q 2012 1Q 2013 2Q 2013 M ill io ns o f D ol la rs Nonperforming loans OREO and foreclosed assets $92 $82 $72 $63 $47 $192 $170 $153 $137 $121 $0 $50 $100 $150 $200 $250 $300 $350 2Q 2012 3 12 4 12 1 13 2 13 M ill io ns o f D ol la rs Special Mention Classif ied Asset Quality We continued to improve asset quality in 2Q – Classified loans decreased by $16.2 million (12%) – Special Mention loans decreased by $15.6 million (25%) The ALL has been reduced to $25.1 million from $29.3 million at year end 2012, reflecting the improved asset quality ALL is 2.11% of loans held for investment – ALL is 3.6x the YTD charge off rate and 1.7x the 2Q charge off rate The remaining FV mark on the Granite portfolio fell by $3.9 million as a result of accretion and realization of expected loss content 13 Quarterly Problem Asset Trends Quarterly Asset Quality 1 Dollars in thousands 2Q 2012 3Q 2012 4Q 2012 1Q 2013 2Q 2013 Allowance for loan losses (ALL) 38,551$ 30,859$ 29,314$ 29,641$ 25,085$ Remaining fair value (FV) mark on Granite portfolio 14,767 10,851 7,824 6,150 2,278 Nonperforming loans / Total loans 7.5% 7.0% 6.8% 6.3% 5.0% Nonperforming assets / Total assets 7.9% 7.5% 6.6% 5.6% 4.7% Annualized net charge-offs / Average loans 2.83% 2.46% 1.94% -0.07% 1.26% All wance for loan loss / Total loans 3.01% 2.51% 2.49% 2.66% 2.11% Pr forma ALL and FV mark / Total loans 1 4.16% 3.39% 3.16% 3.21% 2.30% 1 Non-GAAP presentation, see Appendix. Includes remaining fair value marks on purchased Granite loans.

Nonperforming Assets Nonperforming loans fell by $11.6 million (16%) in 2Q Resolution of troubled real estate construction loans continues with a 17% reduction in 2Q OREO dispositions have been outpacing foreclosure additions. OREO was reduced by $10.8 million (23%) in the 2Q As of June 30, 2013, an additional $4.5 million of OREO (13%) was under contract for sale and carried at the sales price net of costs to sell Non-performing assets fell by $22.3 million (19%) during the quarter, and $47.8 million (34%) since year end 2012 14 Quarterly Nonperforming Loan Composition Nonperforming Loans and OREO Dollars in thousands 2Q 2012 3Q 2012 4Q 2012 1Q 2013 2Q 2013 Commercial and agricultural 2,934$ 3,147$ 2,796$ 2,350$ 1,654$ Real estate - construction 24,853 18,506 14,297 11,762 9,783 Real estate - mortgage: 1-4 family residential 22,300 22,131 18,372 19,166 15,917 Commercial 44,817 42,133 43,798 37,217 31,380 Consumer 633 226 206 63 269 Total nonperforming loans 95,537 86,143 79,469 70,558 59,003 OREO, other foreclosed assets and disc ops assets 86,400 80,800 63,131 46,537 35,762 Total nonperforming assets 181,937$ 166,943$ 142,600$ 117,095$ 94,765$ 0% 20% 40% 60% 80% 100% 2Q 2012 3Q 2012 4Q 2012 1Q 2013 2Q 2013 Consumer Real estate - construction Commercial and agricultural RE - Commercial RE - 1-4 Family

-$200 $0 $200 $400 $600 $800 $1,000 $1,200 2Q 2012 3Q 2012 4Q 2012 1Q 2013 2Q 2013 M ill io ns o f D ol la rs Originated loans Originated loan ALL Granite purchased impaired (PI) loans Granite PI FV Mark and ALL Granite purchased contractual (PC) loans Granite PC FV Mark and ALL Portfolio and Allowance for Loan Losses Originated loans (ASC 310- 20) – ALL established via provision and losses via charge-offs – 2Q ALL of $20.4 million Granite PC loans (ASC 310- 20) – ALL added as FV mark is accreted – Total ALL and remaining unaccreted FV mark of $1.6 million at 2Q Granite PI loans (ASC 310- 30 or SOP-03-3) – $5.3 million remaining FV mark and ALL at 2Q 2013 – Remaining projected accretion of $28.7 million Credit costs for 2Q of $3.5 million in net charge-offs and $3.0 million of net OREO write-downs 15 Loan Portfolio and ALL by Origination Type Quarterly Loan Portfolio, ALL and Fair Value Marks 1 2Q 2012 3Q 2012 4Q 2012 1Q 2013 2Q 2013 Or ginated loans 958,075 944,493 913,799 876,301 971,086 Granite purchased impaired (PI) loans 287,092 252,205 228,392 205,884 189,160 Granite purchased contractual (PC) loans 36,656 35,097 34,844 31,580 29,167 Total loans 1,281,823$ 1,231,795$ 1,177,035$ 1,113,765$ 1,189,413$ Originated loan ALL (34,756) (27,282) (23,633) (23,432) (20,413) Granite PI loa ALL and fair value (FV) mark 1 (16,510) (12,718) (11,921) (10,390) (5,347) Granite PC loan ALL and fair v lue FV) mark 1 (2,052) (1,710) (1,584) (1,969) (1,603) Pro forma total ALL and FV marks 1 (53,318)$ (41,710)$ (37,138)$ (35,791)$ (27,363)$ Originated loan ALL / Originated loans (3.63%) (2.89%) (2.59%) (2.67%) (2.10%) Granite PI ALL and FV mark / Granite PI loans 1 (5.75%) (5.04%) (5.22%) (5.05%) (2.83%) Granite PC ALL and FV mark / Granite PC loans 1 (5.60%) (4.87%) (4.55%) (6.23%) (5.50%) 1 Non-GAAP presentation, see Appendix. Includes remaining fair value marks on purchased Granite loans.
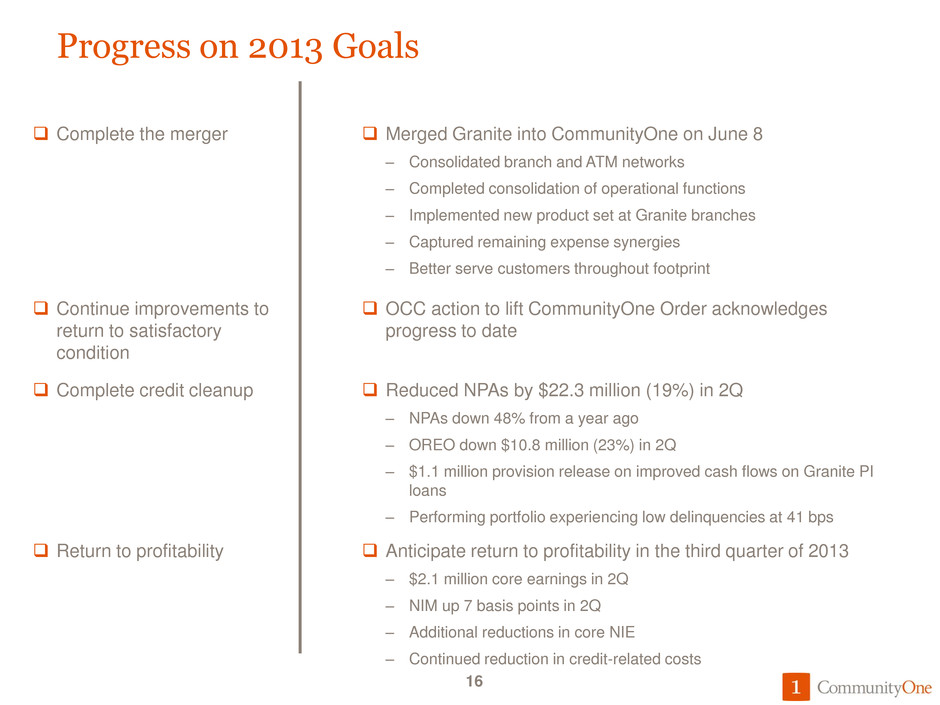
16 Complete the merger Merged Granite into CommunityOne on June 8 – Consolidated branch and ATM networks – Completed consolidation of operational functions – Implemented new product set at Granite branches – Captured remaining expense synergies – Better serve customers throughout footprint OCC action to lift CommunityOne Order acknowledges progress to date Continue improvements to return to satisfactory condition 2013 Goals Reduced NPAs by $22.3 million (19%) in 2Q – NPAs down 48% from a year ago – OREO down $10.8 million (23%) in 2Q – $1.1 million provision release on improved cash flows on Granite PI loans – Performing portfolio experiencing low delinquencies at 41 bps Complete credit cleanup Anticipate return to profitability in the third quarter of 2013 – $2.1 million core earnings in 2Q – NIM up 7 basis points in 2Q – Additional reductions in core NIE – Continued reduction in credit-related costs Return to profitability Progress on 2013 Goals 16

Appendix 17
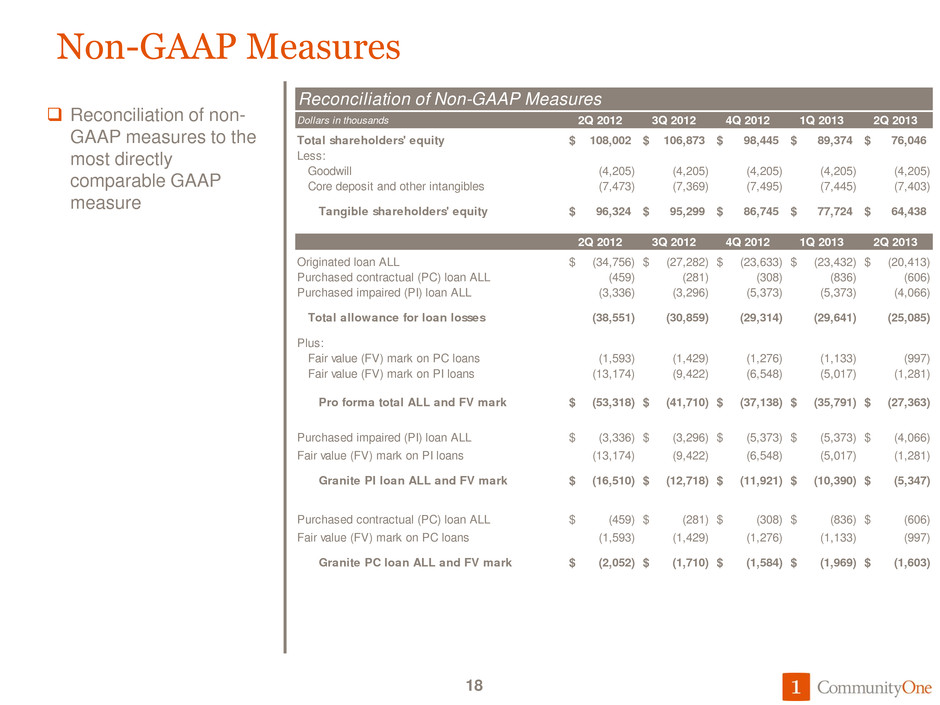
Non-GAAP Measures Reconciliation of non- GAAP measures to the most directly comparable GAAP measure 18 Reconciliation of Non-GAAP Measures Dollars in thousands 2Q 2012 3Q 2012 4Q 2012 1Q 2013 2Q 2013 Total shareholders' equity 108,002$ 106,873$ 98,445$ 89,374$ 76,046$ Less: Goodwill (4,205) (4,205) (4,205) (4,205) (4,205) Core deposit and other intangibles (7,473) (7,369) (7,495) (7,445) (7,403) Tangible shareholders' equity 96,324$ 95,299$ 86,745$ 77,724$ 64,438$ 2Q 2012 3Q 2012 4Q 2012 1Q 2013 2Q 2013 Originated loan ALL (34,756)$ (27,282)$ (23,633)$ (23,432)$ (20,413)$ Purchased contractual (PC) loan ALL (459) (281) (308) (836) (606) Purchased impaired (PI) loan ALL (3,336) (3,296) (5,373) (5,373) (4,066) Total allowance for loan losses (38,551) (30,859) (29,314) (29,641) (25,085) Plus: Fair value (FV) mark on PC loans (1,593) (1,429) (1,276) (1,133) (997) Fair value (FV) mark on PI loans (13,174) (9,422) (6,548) (5,017) (1,281) Pro forma total ALL and FV mark (53,318)$ (41,710)$ (37,138)$ (35,791)$ (27,363)$ Purchased impaired (PI) loan ALL (3,336)$ (3,296)$ (5,373)$ (5,373)$ (4,066)$ Fair value (FV) mark on PI loans (13,174) (9,422) (6,548) (5,017) (1,281) Granite PI loan ALL and FV mark (16,510)$ (12,718)$ (11,921)$ (10,390)$ (5,347)$ Purchased contractual (PC) loan ALL (459)$ (281)$ (308)$ (836)$ (606)$ Fair value (FV) mark on PC loans (1,593) (1,429) (1,276) (1,133) (997) Granite PC loan ALL and FV mark (2,052)$ (1,710)$ (1,584)$ (1,969)$ (1,603)$

Non-GAAP Measures Reconciliation of non- GAAP measures to the most directly comparable GAAP measure 19 Reconciliation of Non-GAAP Measures Dollars in thousands except per share data 2Q 2012 3Q 2012 4Q 2012 1Q 2013 2Q 2013 Net loss to common shareholders (18,138)$ (4,712)$ (6,296)$ (4,596)$ (3,183)$ Less taxes, credit costs and nonrecurring items: TaxesIncome tax benefit (expense) (26) 77 911 (1,853) (236) Other real estate owned expenseGain on sales of securiti s 2,002 (33) 2,198 2,377 345 Provision expenseOther real estate owned expense (12,473) (3,602) (6,289) (883) (3,332) Merger related expenseProvision for loan losses (7,778) (32) (3,172) (110) 1,057 Granite and litigation accruals (1,100) - - - 370 Loan collection expense (514) (1,119) (895) (1,572) (1,408) Branch closure and restructuring expenses - - (96) (587) (15) Rebranding expense - - (397) (552) (58) Merger-related expense 840 (939) (884) (1,509) (1,989) Core Earnings 911$ 936$ 2,328$ 93$ 2,083$
