Attached files
| file | filename |
|---|---|
| 8-K - FORM 8-K - RED MOUNTAIN RESOURCES, INC. | d582744d8k.htm |
 Exhibit 99.1 |
 2
Disclaimer
This
presentation
does
not
constitute
an
offer
to
sell
or
a
solicitation
of
an
offer
to
buy
securities
nor
does
it
constitute
an
offer
or
solicitation
In
any
jurisdiction
in
which
such
offer,
solicitation
or
sale
would
be
unlawful
prior
to
registration
or
qualification
under
the
securities
laws
of
any
such
jurisdiction.
Any
such
offer
may
only
be
made
pursuant
to
a
registration
statement
or
pursuant
to
an
exemption
from
registration,
if
available.
No
general
solicitation
whatsoever
is
made
or intended hereby.
Cautionary and Forward-Looking Statements
In
addition
to
statements
of
historical
fact,
this
presentation
contains
forward-looking
statements.
The
presentation
of
outlooks,
projections,
estimates,
targets
and
other
forward-looking
information
in
this
presentation
is
subject
to
a
number
of
risks
and
uncertainties
that
could
cause
actual
results
to
differ
materially
from
those
reflected
in
such
statements.
Readers
are
cautioned
not
to
place
undue
reliance
on
these
forward-looking
statements,
which
reflect
management’s
analysis
only
as
of
the
date
hereof.
Without
limiting
the
generality
of
the
foregoing,
words
such
as
“may,”
“will,”
“expect,”
“believe,”
“anticipate,”
“intend,”
or
“could”
or
the
negative
variations
thereof
or
comparable
terminology
are
intended
to
identify forward-looking
statements.
These
forward-looking
statements
are
subject
to
numerous
assumptions,
risks
and
uncertainties
that
may
cause
actual
results
to
be
materially
different
from
any
future
results
expressed
or
implied
in
those
statements.
Risks
and
uncertainties
that
could
prevent
the
Company
from
achieving
any
stated
goals
include,
but
are
not
limited
to,
the
following:
a.
volatility or decline of our stock price;
b.
potential fluctuation in annual or quarterly results;
c.
dilution related to additional issuances of securities;
d.
declines or volatility in the prices we receive for our oil and natural gas;
e.
general economic conditions, whether internationally, nationally
or in the regional and local market areas in which we do business;
f.
our ability to generate sufficient cash flow from operations, borrowings or other
sources to enable us to fully develop our oil and natural gas properties;
g.
risks associated with drilling, including completion risks, cost
overruns and the drilling of non-economic wells or dry holes;
h.
uncertainties associated with estimates of proved oil and natural gas reserves;
i.
the
presence
or
recoverability
of
estimated
oil
and
natural
gas
reserves
and
the
actual
future
production
rates
and
associated
costs;
j.
risks and liabilities associated with acquired companies and properties;
k.
risks related to integration of acquired companies and properties;
l.
potential defects in title to our properties;
m.
our
ability
to
raise
additional
capital
to
fund
future
capital
expenditures;
n.
cost and availability of drilling rigs, equipment, supplies, personnel and oilfield
services; o.
geological concentration of our reserves;
p.
environmental
or
other
governmental
regulations,
including
legislation
of
hydraulic
fracture
stimulation
and
elimination
of
income
tax
incentives
available
to
our
industry;
q.
our
ability
to
secure
firm
transportation
for
oil
and
natural
gas
we
produce
and
to
sell
the
oil
and
natural
gas
at
market
prices;
r.
exploration and development risks;
s.
management’s ability to execute our plans to meet our goals;
t.
our ability to retain key members of our management team;
u.
weather conditions;
v.
actions or inactions of third-party operators of our properties;
w.
costs and liabilities associated with environmental, health and safety laws;
x.
ability to find and retain skilled personnel;
y.
operating hazards attendant to the oil and natural gas business;
and
z.
competition in the oil and natural gas industry.
The
Company
undertakes
no
obligation
to
publicly
revise
these
forward-looking
statements
to
reflect
events
or
circumstances
that
arise
after
the
date
hereof,
except
as
required
by
applicable
law.
The
financial
and
operating
projections
contained
in
this
presentation
represent
our
reasonable
estimates
as
of
the
date
of
this
presentation.
Neither
our
auditors
nor
any
other
third
party
has
examined,
reviewed
or
compiled
the
projections
and,
accordingly,
none
of
the
foregoing
expresses
an
opinion
or
other
form
of
assurance
with
respect
thereto.
The
assumptions
upon
which
the
projections
are
based
are
described
in
more
detail
herein.
Some
of
these
assumptions
inevitably
will
not
materialize,
and
unanticipated
events
may
occur
that
could
affect
our
results.
Therefore,
our
actual
results
achieved
during
the
periods
covered
by
the
projections
will
vary
from
the
projected
results.
Prospective
investors
are
cautioned
not
to place undue
reliance on the projections included herein.
Pro
forma
production
data
reflects
the
acquisition
of
Cross
Border
Resources,
Inc.
(OTCQB:XBOR)
(“Cross
Border”)
as
if
it
occurred
on
June
1,
2012.
As
of
May
31,
2013,
RMR
owned
83.3%
of
the
outstanding
common
stock
of
Cross
Border. |
 3
Corporate Overview
Red Mountain Resources, Inc. (“RMR”)
Listing (OTCQB)
RDMP
Share Price
$0.75
Common Shares Outstanding (MM)
126.0
Market Cap (MM)
$94.5
Total Debt (MM)
$24.1
Cash (MM)
$5.8
Enterprise Value (MM)
$112.8
Management and Insider Ownership
10+%
Company Auditor
Hein & Associates LLP; Darilek, Butler & Associates, PLLC (Cross
Border)
Independent Reserve Engineer Auditor
Cawley, Gillespie & Associates, Inc.
Market data as of close on August 5, 2013 |
 4
Company Overview
Pro Forma Production¹ : 886 (BOE/D) –
53% oil
Reserves²: 3.5 MMBOE (as of 6/1/13)
53% Proved Developed
Drilling Inventory: 450 gross (369 net) potential
locations
1
Average net daily production sold for the twelve months ended May 31, 2013.
Includes net production sold represented by the 17% of Cross Border’s common
stock not owned by RMR.
2
As
of
June
1,
2013.
Includes
reserves
represented
by
the
17%
of
Cross
Border’s
common
stock
not
owned
by
RMR.
Acreage Chart
Gross
Net
Developed Permian
11,108
5,237
Undeveloped Permian
325,743
25,774
Undeveloped
Southwest
NM
5
Minerals
536,340
268,170
Developed South Texas
4,776
1,405
Kansas
6,656
6,656
TOTAL
884,623
307,242
98% of Acreage Either Owned Mineral Rights or
Leases Held by Production as of May 31, 2013
3
3
Includes acreage represented by the 17% of Cross Border’s common stock not owned
by RMR
4
Includes mineral ownership.
5
Reflects mineral ownership.
Summary of Combined Properties of RMR,
Cross Border, and Bamco
4 |
 5
Strategic Growth Oriented Business Plan
2013E
2014E/2015E
Exit rate daily production to exceed
1,500+ Boepd
Exit rate daily production to exceed
3,000+ Boepd
Uplist on NYSE MKT, potential reverse
stock split
Increase shareholder awareness and
institutional investor base
Target debt service coverage ratio
greater than 5x
Target debt/EBITDA ratio below 3x
Hedging program in place to limit
downside and ensure adequate cash
flows to perpetuate growth
Conventional balance sheet and capital structure
Increase liquidity of stock
Organic growth through the drill bit
RMR completes reverse merger with
Black Rock Capital, acquiring
property assets and 13.2% share in
Cross Border
June 2011
RMR closes private placement raise of
$22.2MM; executes $4MM
secured note; closes $2.75MM conv.
debt
Nov./Dec. 2011
RMR successfully drills and
completes Madera 24-2H with peak
24-hour flow rate of 1,144 Bbls and
772 Mcf for a total of 1,273 Boe;
increases Cross Border ownership to
29.9%
January 2012
Jan./Feb. 2013
RMR increases ownership stake in
Cross Border to 80%, triggering
consolidation; RMR obtains $100MM
credit facility and completes $6MM
equity financing; consolidates debt of
Cross Border and RMR; completion of
cross conveyance with Chevron on
Madera prospect
April/May 2013
RMR consolidates financials
of Cross Border and
completes private placement
of additional $3MM of
equity; RMR increases Cross
Border ownership to 83%
May 2013
July 2013
RMR drills and completes
Madera 24-3H well with
initial production rate of
1,491 Boe (81% oil)
RMR launches $11.25MM
Unit Offering |
 6
Board and Management Team
10+ years experience
within the energy industry,
CEO since June 2011
Significant oil & gas
experience, including
management, operations,
finance and corporate
development
Highly experienced team with 10% equity stake
Key Team Members
45+ years experience
within energy industry;
owner of RK Ford &
Associates, Inc. and partner
in Western Drilling, Inc.
Geographical experience in
18 U.S. states and 12
countries
ALAN W. BARKSDALE
Chairman, President, CEO
RANDELL K. FORD
Director
DAVID M. HEIKKINEN
Director
RICHARD Y. ROBERTS
Director
PAUL N. VASSILAKOS
Director
15+ years experience
within energy industry;
CEO of Heikkinen Energy
Advisors, LLC.
Served as Head of E&P
Research for Tudor,
Pickering, Holt & Co. and
as Exploration and
Production Analyst for
Capital One Southcoast,
Inc.
Co-founded Roberts,
Raheb & Gradler LLC, a
regulatory/legislative
consulting firm
From 1990 to 1995 was a
commissioner of the
Securities and Exchange
Commission, during which
time he was actively
involved in a wide range of
subjects affecting the
capital markets
Served as interim
President & CEO of RMR
from February-March
2011
Serves as asst. treasurer
of Cullen Agricultural
Holding Corp. and founder
of Petrina Advisors, Inc., a
privately held advisory
firm
MICHAEL R. UFFMAN
Chief Financial Officer
10+ years of experience in
the financial sector of the
energy industry
Prior experience includes
Global Hunter Securities,
LLC, Dahlman Rose & Co.,
Capital One Southcoast,
Inc., and KPMG LLP
TOMMY W. FOLSOM
EVP, Director of Exp. & Prod.
40+ years of experience in
the energy industry
Prior experience includes
Enerstar Resources O & G,
LLC, Murchison Oil and
Gas, Inc., Vision Energy,
Inc., and Santa Fe Energy,
Inc.
HILDA D. KOUVELIS
Chief Accounting Officer
25+ years of experience in
the financial sector of the
energy industry
Prior experience includes
TransAtlantic Petroleum
Ltd., Sky Petroleum Inc.,
Ascent Energy, Inc., and
PetroFina S.A.
EARL M. SEBRING
Sr. Consulting Geologist,
Interim President Cross Border
35+ years experience
within energy industry;
owner of Sebring
Exploration Texas, Inc.
Geographical experience
in Permian Basin, Gulf
Coast, Oklahoma, and
numerous countries
JACK C. BRADLEY
Vice President, Director of
Business Development
9+ years experience within
energy industry at The
StoneStreet Group and
Sebring Exploration Texas,
Inc.
Extensive experience in
Permian Basin, Val Verde
Basin, South Texas |
 7
Capex Plan and Data
2014 Capital Expenditure Plan
2014 Capital Expenditure By Percent
Gross Wells
CAPEX
(in millions)
Percent
Tom Tom Workovers
18
$4.0
10%
Tom Tom New Wells
18
$13.0
33%
Cowden
3
$2.5
6%
Madera
5
$18.5
47%
Shafter Lake
1
$0.5
1%
Non Op
10
$1.0
3%
TOTAL
55
$39.5
100% |
 |
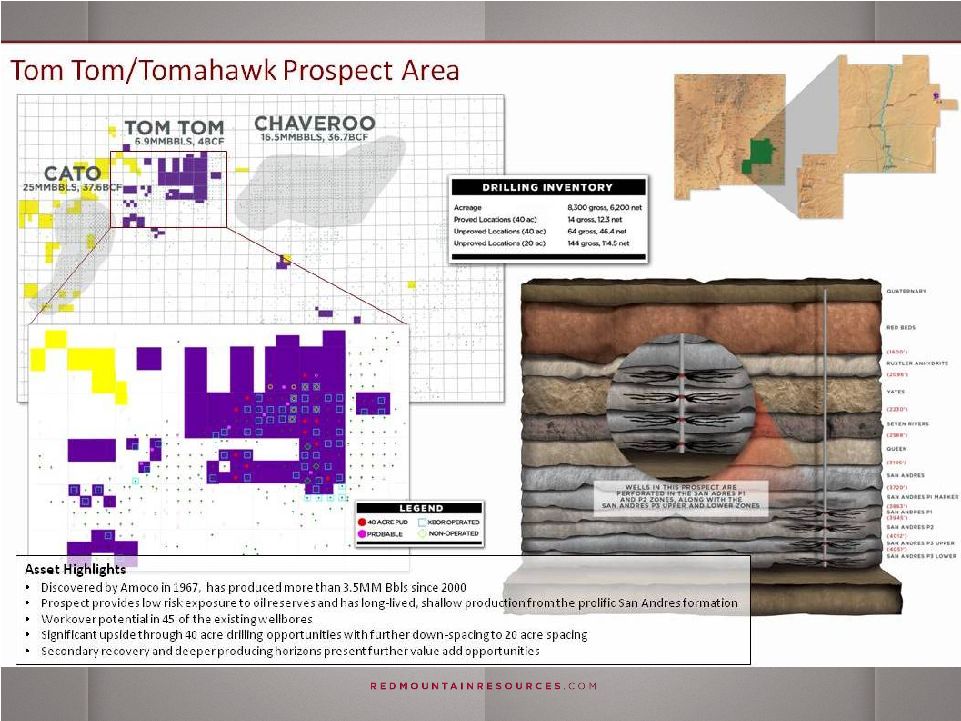
 9
Permian Basin Focus
Property Overview
300,000 net acres in West Texas and New Mexico
30,000 net acres classified as Permian Basin
Acreage position provides opportunity for reserve adds and
production growth with exposure to:
Large acreage position creates long-term upside
98% of acreage either owned mineral rights or leases held by
production
Significant operating experience and aligned with premier
operating partners on non-operated assets
Uniquely positioned ownership and team provides access to
services and basin-wide well data |
 10
|
 11
Madera Short-Lateral Economics
High
Base
Low
EUR (Mboe)
467
400
333
PV-10 ($M)
$6,980
$5,074
$3,051
IRR (%)
89%
60%
36%
Payback (Years)
1.3
1.7
2.4
Gross Well Cost ($M)
$6,500
$6,500
$6,500
IP (Boe/d)
807
700
587
B-factor
1.2
1.2
1.2
Sensitivity Case Assumptions (4,620’
Lateral Length)
Representative Base Type Curve / Development Economics
WTI Oil
Price ($/bbl)
PV-10 ($M)
Payout (yrs)
IRR (%)
HIGH CASE
$80
$5,431
1.6
65%
$90
$6,980
1.3
89%
$100
$8,530
1.1
119%
BASE CASE
$80
$3,731
2.1
43%
$90
$5,074
1.7
60%
$100
$6,418
1.4
80%
LOW CASE
$80
$1,927
3.1
25%
$90
$3,051
2.4
36%
$100
$4,177
1.9
48%
Sensitivity to Oil Price -
IRR
Oil Price Sensitivity
* Base case calculated with $90 WTI oil and $3.50 Henry Hub gas,
adjusted
prices are $83.37/bbl and $4.88/mcf |
 12
Madera Long-Lateral Economics
High
Base
Low
EUR (Mboe)
667
567
467
PV-10 ($M)
$11,769
$8,706
$5,880
IRR (%)
163%
101%
61%
Payback (Years)
1.1
1.4
1.8
Gross Well Cost ($M)
$7,500
$7,500
$7,500
IP (Boe/d)
1140
967
807
B-factor
1.2
1.2
1.2
Sensitivity Case Assumptions (6,930’
Lateral Length)
Representative Base Type Curve / Development Economics
WTI Oil
Price ($/bbl)
PV-10 ($M)
Payout (yrs)
IRR (%)
HIGH CASE
$80
$9,603
1.3
117%
$90
$11,769
1.1
163%
$100
$13,935
1.0
221%
BASE CASE
$80
$6,870
1.6
74%
$90
$8,706
1.4
101%
$100
$10,542
1.2
136%
LOW CASE
$80
$4,349
2.2
44%
$90
$5,880
1.8
61%
$100
$7,411
1.5
81%
Sensitivity to Oil Price -
IRR
Oil Price Sensitivity |
 13
Significant Exposure to Low-Risk San Andres Reserves
The
San
Andres
formation
is
an
oil
and
gas
bearing
member
of
the
Upper
Permian
occurring
in
the
geologic
provinces
of
West
Texas
and
Southeast
New
Mexico
•
The
San
Andres
and
Grayburg
formations
have
contributed
the
most
growth
of
oil
reserves
in
recent
decades
•
Already
achieved
high
recovery
efficiencies
with
extensive
use
of
water
flood
and
CO2
recovery
programs
in
these
formations
Source: U.S. Geologic Survey dated April 2012
Of the 3.25 billion barrels of oil reserves
expected to be produced from the
Permian Basin through 2015, the
Northwest shelf San Andres platform
carbonate composes 21% of this total,
or 680 MMBBLS.
Source: American Association of Petroleum Geologist
Bulletin dated May 2005
San Andres Overview
Northwest Shelf San Andres Potential |
 14
|
 15
San Andres Area Economics
High
Base
Low
EUR (Mboe)
60
50
40
PV-10 ($M)
$1,335
$1,004
$673
IRR (%)
98%
70%
46%
Payback (Years)
1.5
1.8
2.3
Gross Well Cost ($M)
$800
$800
$800
IP (Boe/d)
47
40
33
B-factor
1
1
1
Sensitivity Case Assumptions
Representative Base Type Curve / Development Economics
WTI Oil
Price ($/bbl)
PV-10 ($M)
Payout (yrs)
IRR (%)
HIGH CASE
$80
$1,070
1.7
75%
$90
$1,335
1.5
98%
$100
$1,600
1.3
126%
BASE CASE
$80
$779
2.1
53%
$90
$1,004
1.8
70%
$100
$1,229
1.5
89%
LOW CASE
$80
$487
2.7
34%
$90
$673
2.3
46%
$100
$858
1.9
59%
Sensitivity to Oil Price -
IRR
Oil Price Sensitivity |
 16
Non-Operated New Mexico
LUSK
Well Name
Well Type
Operator
IP Date
Oil IP
Gas IP
Cum Oil
Cum Gas
WI
Southeast Lusk 33
Federal 2H
Horizontal
Cimarex
3/7/2012
301
598
76,215
76,105
37.50%
Southeast Lusk 33
Federal 3H
Horizontal
Cimarex
2/29/2012
634
483
103,041
108,167
37.50%
Fecta 33 Fed 1H
Horizontal
Oxy
5/2/2012
623
1,053
103,847
91,407
12.49%
South Lusk 28
Federal 1
Vertical
Apache
6/22/2012*
165
275
9,364
21,423
33.75%
TURKEY TRACK
Well Name
Well Type
Operator
IP Date
Oil IP
Gas IP
Cum Oil
Cum Gas
WI
Zircon 2 St Com 1H
Horizontal
Mewbourne
1/13/2012
297
202
70,127
141,424
12.50%
Bradley 30 Fed 3H
Horizontal
Mewbourne
12/4/2012
286
215
10,737
14,473
4.49%
Zircon 2 EH St 1H
Horizontal
Mewbourne
1/12/2013
241
359
4,696
5,491
12.50%
2
nd
Bone Spring Wells
Operating Partners Within the Area
* Test date of recompletion
RED LAKE
Well Name
Well Type
Operator
IP Date
Oil IP
Gas IP
Cum Oil
Cum Gas
WI
Southern Union 30
State 1
Vertical
Lime Rock
7/23/2012
99
154
9,607
19,895
12.5%
Roo 22 State 2
Vertical
Oxy
8/21/2012
278
523
1,798
3,303
3.13%
Roo 22 State 1
Vertical
Oxy
10/6/2012
264
228
N/A
N/A
3.13%
HENSHAW
Well Name
Well Type
Operator
IP Date
Oil IP
Gas IP
Cum Oil
Cum Gas
WI
High Lonesome 26
Fed Com 1
Vertical
Concho
12/1/2008
610
3,198
67,040
619,709
3.13%
Yeso Wells
Abo Wells |
 17
Central Kansas Properties
•
6,656 gross and net acres
•
100% working interest; 80% NRI
•
Target zones: Arbuckle, Lansing Kansas City, Penn,
Reagan, and Granite Wash
•
Established and growing acreage position
•
Expected economics from vertical Arbuckle: 50 MBOE
and well cost of approximately $400,000
Asset Highlights |
 18
Offering Exposure to the Permian at a Discount
(EV/Acre in the Permian Basin)
*Calculated after assigning value to production and acreage value in areas outside the
Permian. See appendix for derivation. **No value assigned to RDMP for SW New
Mexico acreage where mineral rights are owned. |
 19
Investment Highlights
Uniquely positioned property set
•
Large acreage position, geographically focused in Permian, Kansas, and onshore Gulf Coast of
Texas •
98% of the acreage consists of either owned mineral rights or leases held by production
Potential reserves and production base
•
Pro forma average daily net production sold of 886 Boe/d¹
•
1,500+ potential gross locations
Strong production profile to execute development plans
•
Significant free cash flow from existing assets to invest in development plan
•
Significant PUD inventory for further free cash flow growth
Experienced management and technical team
•
Successful track record of creating value
•
Cost-effective operator with significant operating experience
More than 300 years of combined experience in our core areas
1
Average
net
daily
production
sold
for
the
twelve
months
ended
May
31,
2013,
includes
net
production
sold
represented
by
the
17%
of
Cross
Border’s
common
stock
not
owned
by
RMR. |
 |
 21
Permian Adjusted Enterprise Value Derivation
Company
Ticker
Market Cap
Total Debt
Cash
Enterprise Value
Laredo Petroleum Holdings Inc
LPI
$3,181.6
$1,364.1
$43.6
$4,502.0
Approach Resources Inc
AREX
$998.8
$154.5
$55.3
$1,098.0
Concho Resources Inc
CXO
$9,849.1
$3,298.7
$1.0
$13,146.8
Energen Corp
EGN
$4,802.1
$2,000.0
$20.3
$4,783.8
Pioneer Natural Resources Co
PXD
$25,000.3
$3,037.7
$695.6
$27,342.4
Diamondback Energy Inc
FANG
$1,711.9
$41.3
$81.9
$1,671.2
Cimarex Energy Co
XEC
$10,079.0
$872.6
$4.5
$10,947.1
Red Mountain Resources Inc
RDMP
$94.5
$24.1
$5.8
$112.8
LPI
AREX
CXO
EGN
PXD
FANG
RDMP
Enterprise Value
$ 4,502,032,560
$ 1,097,980,305
$ 13,146,805,550
$ 6,781,788,840
$ 27,342,419,320
$ 1,671,234,539
$ 112,771,298
Production Value
Most Recent Avg Daily Production (BBLS)
15,617
3,780
57,456
28,484
75,073
4,914
470
x $80,000 per flowing BBLS
$ 80,000
$ 80,000
$ 80,000
$ 80,000
$ 80,000
$ 80,000
$ 80,000
$ 1,249,360,000
$ 302,400,000
$ 4,596,480,000
$ 2,278,720,000
$ 6,005,840,000
$ 393,120,000
$ 37,600,000
Most Recent Avg Daily Production (MCF)
119,262
31,320
202,464
256,350
606,828
10,056
2,496
x $6,000 per flowing MCF
$ 6,000
$ 6,000
$ 6,000
$ 6,000
$ 6,000
$ 6,000
$ 6,000
$ 715,572,000
$ 187,920,000
$ 1,214,784,000
$ 1,538,100,000
$ 3,640,968,000
$ 60,336,000
$ 14,376,000
Acreage Adjustment
Location
San Juan Basin
Eagleford Shale
Kansas
Net Acres
140,000
117,000
6,656
Other Acreage $/Acre
$ 4,000
$ 10,000
$ 150
Other Acreage Adjustment
$ -
$ -
$ -
$ 560,000,000
$ 1,170,000,000
$ -
$ 998,400
Location
Black Warrior Basin
Barnett Shale
S. Texas
Net Acres
147,000
114,000
1,405
Other Acreage $/Acre
$ 100
$ 1,000
$ 100
Other Acreage Adjustment
$ -
$ -
$ -
$ 14,700,000
$ 114,000,000
$ -
$ 140,500
Location
Other
Net Acres
733,000
Other Acreage $/Acre
$ 100
Other Acreage Adjustment
$ -
$ -
$ -
$ -
$ 73,300,000
$ -
$ -
Total Acreage Adjustment
$ -
$ -
$ -
$ 574,700,000
$ 1,357,300,000
$ -
$ 1,138,900
Permian Acreage Value
$ 2,537,100,560
$ 607,660,305
$ 7,335,541,550
$ 2,390,268,840
$ 16,338,311,320
$ 1,217,778,539
$ 59,056,398
Net Permian Acres
200,600
152,000
626,192
300,000
900,000
54,142
31,011
EV / Net Permian Acre
$12,648/acre
$3,998/acre
$11,715/acre
$7,968/acre
$18,154/acre
$22,492/acre
$1,904/acre
Source: Company Documents and Filings, Bloomberg, PLS. Note: Acreage values based on recent
transactions of nearby properties. (In $ millions) |