Attached files
| file | filename |
|---|---|
| 8-K - TMUS FORM 8-K - T-Mobile US, Inc. | tmus06302013form8k.htm |
| EX-99.1 - TMUS EXHIBIT 99.1 - T-Mobile US, Inc. | tmus06302013ex991.htm |
| EX-99.2 - TMUS EXHIBIT 99.2 - T-Mobile US, Inc. | tmus06302013ex992.htm |
T-Mobile US Q2 2013
Disclaimer This presentation contains “forward-looking” statements within the meaning of the U.S. federal securities laws. For those statements, we claim the protection of the safe harbor for forward-looking statements contained in the Private Securities Litigation Reform Act of 1995. Any statements made herein that are not statements of historical fact, including statements about T-Mobile US, Inc.'s plans, outlook, beliefs, opinions, projections, guidance, strategy, expected network modernization and other advancements, are forward-looking statements. Generally, forward-looking statements may be identified by words such as "anticipate," "expect," "suggests," "plan," “project,” "believe," "intend," "estimates," "targets," "views," "may," "will," "forecast," and other similar expressions. The forward-looking statements speak only as of the date made, are based on current assumptions and expectations, and involve a number of risks and uncertainties. Important factors that could affect future results and cause those results to differ materially from those expressed in the forward- looking statements include, among others, the following: our ability to compete in the highly competitive U.S. wireless telecommunications industry; adverse conditions in the U.S. and international economies and markets; our significant capital commitments and the capital expenditures required to effect our business plan; our ability to adapt to future changes in technology, enhance existing offerings, and introduce new offerings to address customers' changing demands; changes in legal and regulatory requirements, including any change or increase in restrictions on our ability to operate our network; our ability to successfully maintain and improve our network, and the possibility of incurring additional costs in doing so; major equipment failures; severe weather conditions or other force majeure events; and other risks described in our filings with the Securities and Exchange Commission, including those described in our Current Report on Form 8-K filed with the Securities and Exchange Commission on May 8, 2013. You should not place undue reliance on these forward-looking statements. We do not undertake to update forward-looking statements, whether as a result of new information, future events or otherwise, except as required by law. As required by SEC rules, we have provided a reconciliation of the non-GAAP financial measures included in this presentation to the most directly comparable GAAP measures in materials on our website at http://investor.t-mobile.com. Proprietary and Confidential 2
Agenda Proprietary and Confidential Financial results Operating highlights and key initiatives Q&A Braxton Carter, CFO John Legere, President and CEO 3
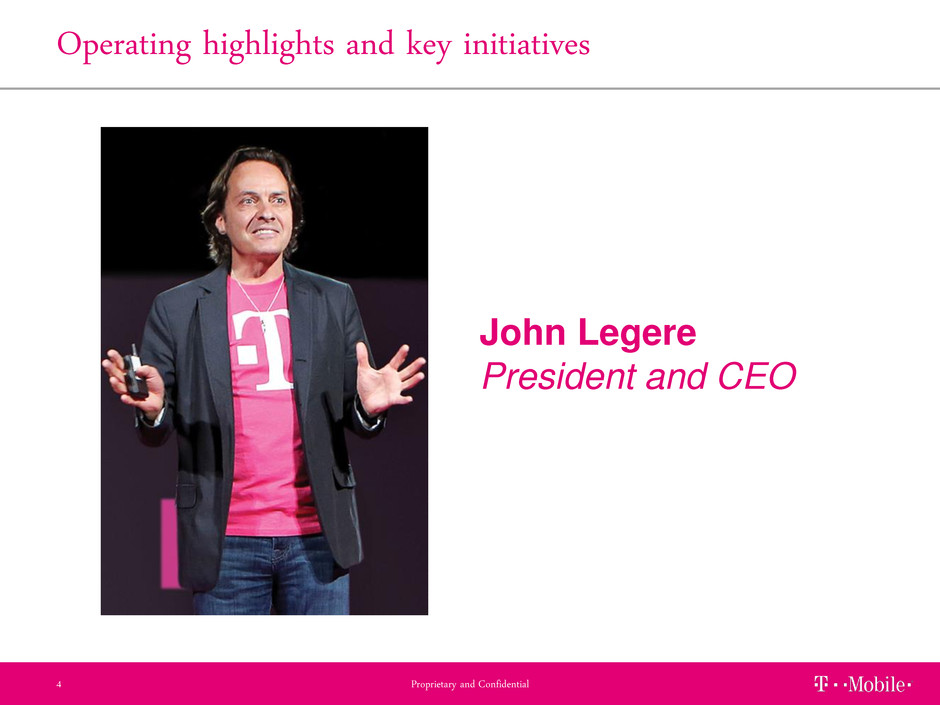
Operating highlights and key initiatives John Legere President and CEO Proprietary and Confidential 4
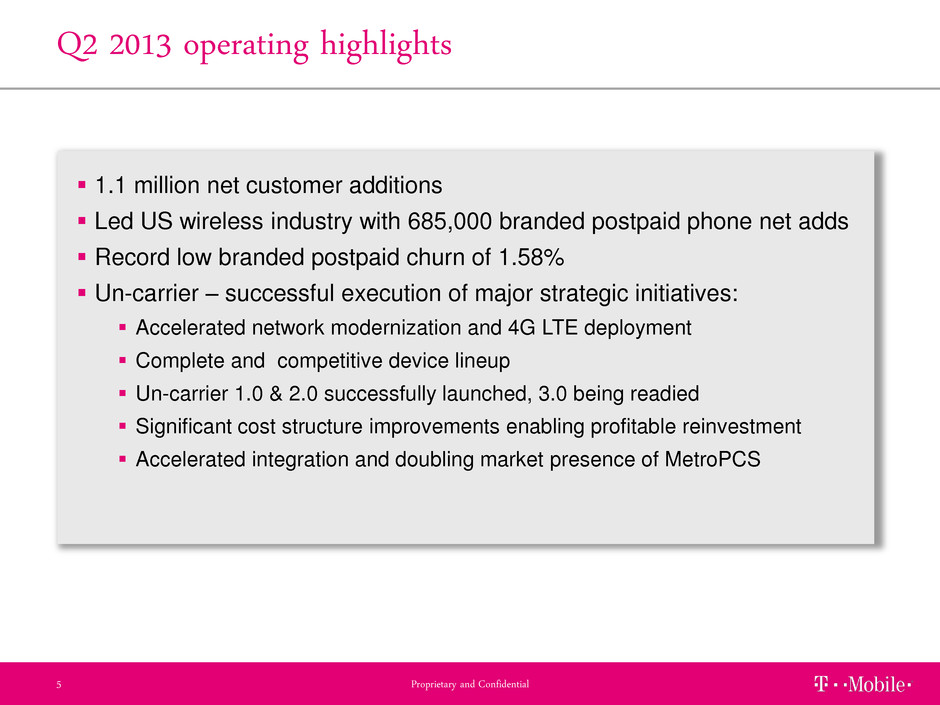
Q2 2013 operating highlights Proprietary and Confidential 5 1.1 million net customer additions Led US wireless industry with 685,000 branded postpaid phone net adds Record low branded postpaid churn of 1.58% Un-carrier – successful execution of major strategic initiatives: Accelerated network modernization and 4G LTE deployment Complete and competitive device lineup Un-carrier 1.0 & 2.0 successfully launched, 3.0 being readied Significant cost structure improvements enabling profitable reinvestment Accelerated integration and doubling market presence of MetroPCS
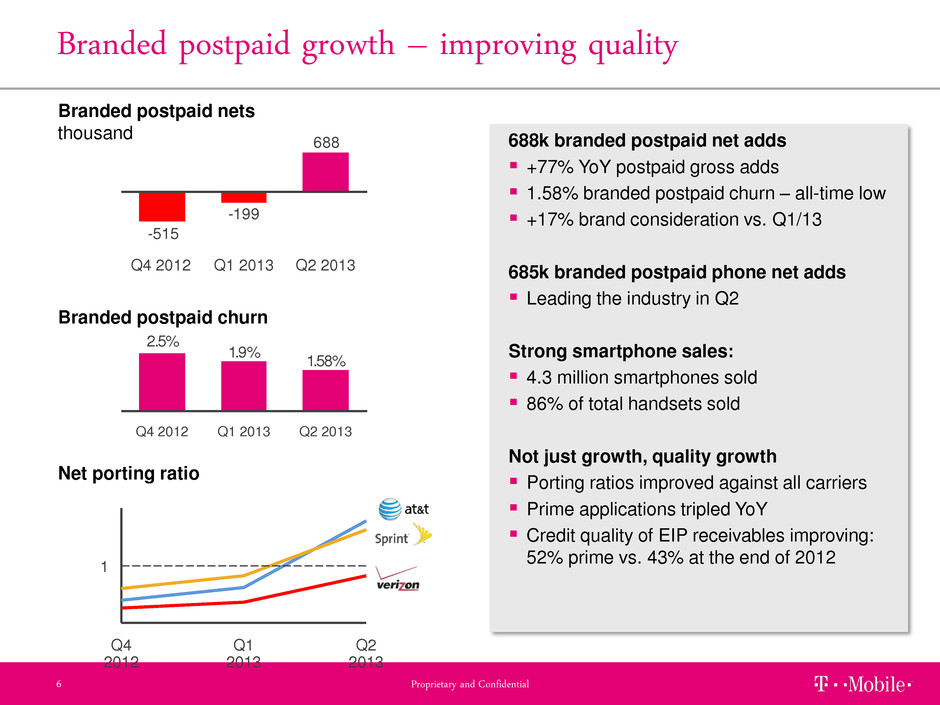
Branded postpaid growth – improving quality Proprietary and Confidential 6 Net porting ratio 1 Q2 2013 Q1 2013 Q4 2012 688 -199 -515 Q2 2013 Q1 2013 Q4 2012 Branded postpaid nets thousand 688k branded postpaid net adds +77% YoY postpaid gross adds 1.58% branded postpaid churn – all-time low +17% brand consideration vs. Q1/13 685k branded postpaid phone net adds Leading the industry in Q2 Strong smartphone sales: 4.3 million smartphones sold 86% of total handsets sold Not just growth, quality growth Porting ratios improved against all carriers Prime applications tripled YoY Credit quality of EIP receivables improving: 52% prime vs. 43% at the end of 2012 1.58% 1.9% 2.5% Q4 2012 Q2 2013 Q1 2013 Branded postpaid churn

Net adds Strong total branded growth Proprietary and Confidential 7 688 -199 -515 Q1 2013 Q2 2013 Q4 2012 Branded postpaid Branded prepaid Total branded Churn 1.58%1.9% 2.5% Q1 2013 Q4 2012 Q2 2013 4.9%4.4%4.9% Q2 2013 Q1 2013 Q4 2012 -87 310 73 Q2 2013 Q1 2013 Q4 2012 thousand Back to growth in postpaid 685k branded postpaid phone net adds +77% YoY branded postpaid gross adds - +53% QoQ Prepaid losses driven by qualified upgrades to postpaid Positive net adds before qualified upgrades Strong total branded growth Demonstrates success of Un-carrier strategy and Simple Choice plan 601 111 -442 Q4 2012 Q1 2013 Q2 2013 Note: All figures are pro forma combined results (incl. MetroPCS results for full quarter and prior quarters). QoQ change 887 397 QoQ change (bps) 50 32 490
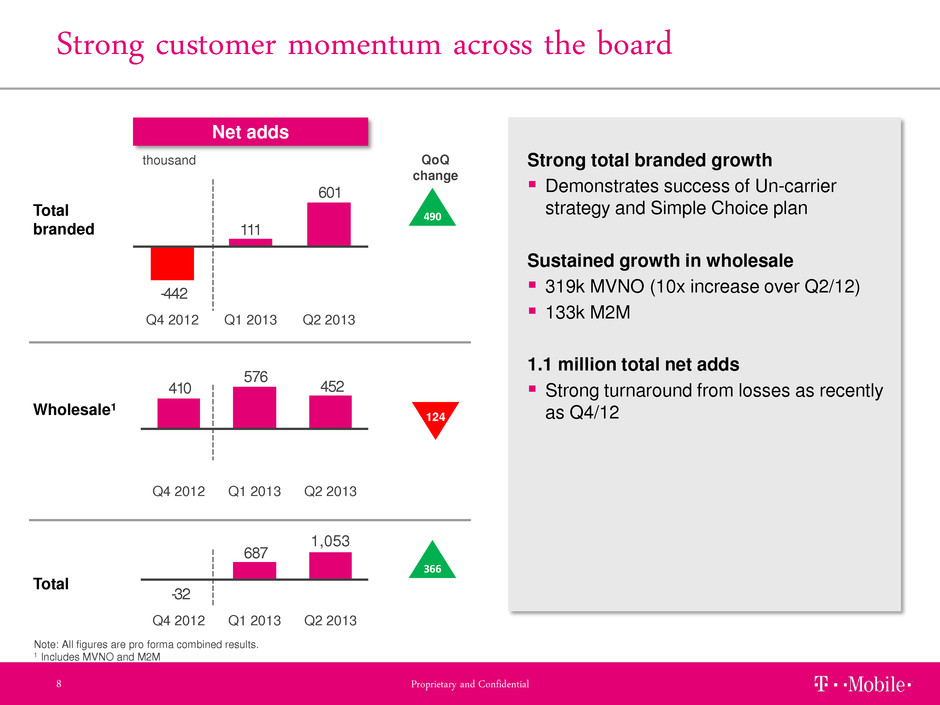
Net adds Strong customer momentum across the board Proprietary and Confidential 8 601 111 -442 Q2 2013 Q1 2013 Q4 2012 Total branded Wholesale1 Total 452 576 410 Q2 2013 Q1 2013 Q4 2012 thousand Strong total branded growth Demonstrates success of Un-carrier strategy and Simple Choice plan Sustained growth in wholesale 319k MVNO (10x increase over Q2/12) 133k M2M 1.1 million total net adds Strong turnaround from losses as recently as Q4/12 687 -32 Q4 2012 Q1 2013 Q2 2013 1,053 Note: All figures are pro forma combined results. 1 Includes MVNO and M2M QoQ change 490 124 366
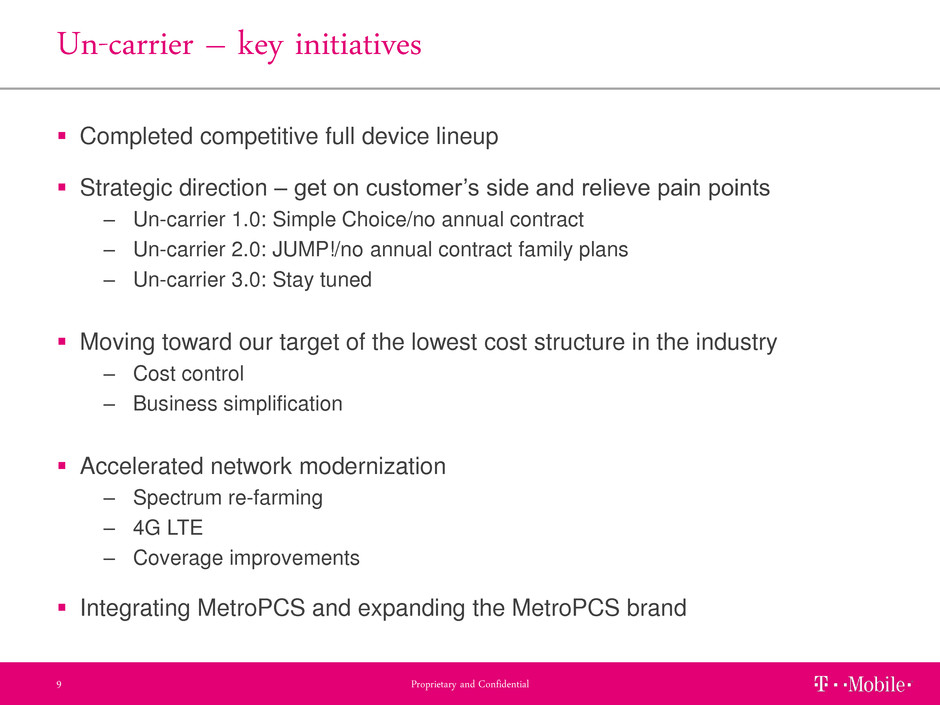
Un-carrier – key initiatives Proprietary and Confidential 9 Completed competitive full device lineup Strategic direction – get on customer’s side and relieve pain points – Un-carrier 1.0: Simple Choice/no annual contract – Un-carrier 2.0: JUMP!/no annual contract family plans – Un-carrier 3.0: Stay tuned Moving toward our target of the lowest cost structure in the industry – Cost control – Business simplification Accelerated network modernization – Spectrum re-farming – 4G LTE – Coverage improvements Integrating MetroPCS and expanding the MetroPCS brand
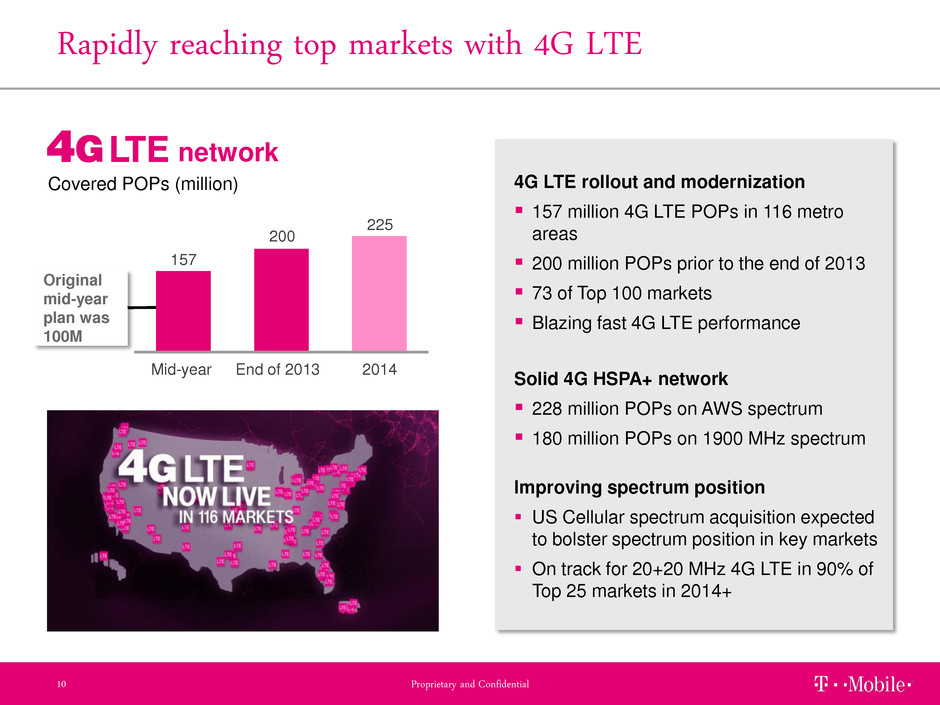
Rapidly reaching top markets with 4G LTE Proprietary and Confidential 10 4G LTE rollout and modernization 157 million 4G LTE POPs in 116 metro areas 200 million POPs prior to the end of 2013 73 of Top 100 markets Blazing fast 4G LTE performance Solid 4G HSPA+ network 228 million POPs on AWS spectrum 180 million POPs on 1900 MHz spectrum Improving spectrum position US Cellular spectrum acquisition expected to bolster spectrum position in key markets On track for 20+20 MHz 4G LTE in 90% of Top 25 markets in 2014+ 157 200 225 Mid-year End of 2013 2014 Covered POPs (million) Original mid-year plan was 100M network
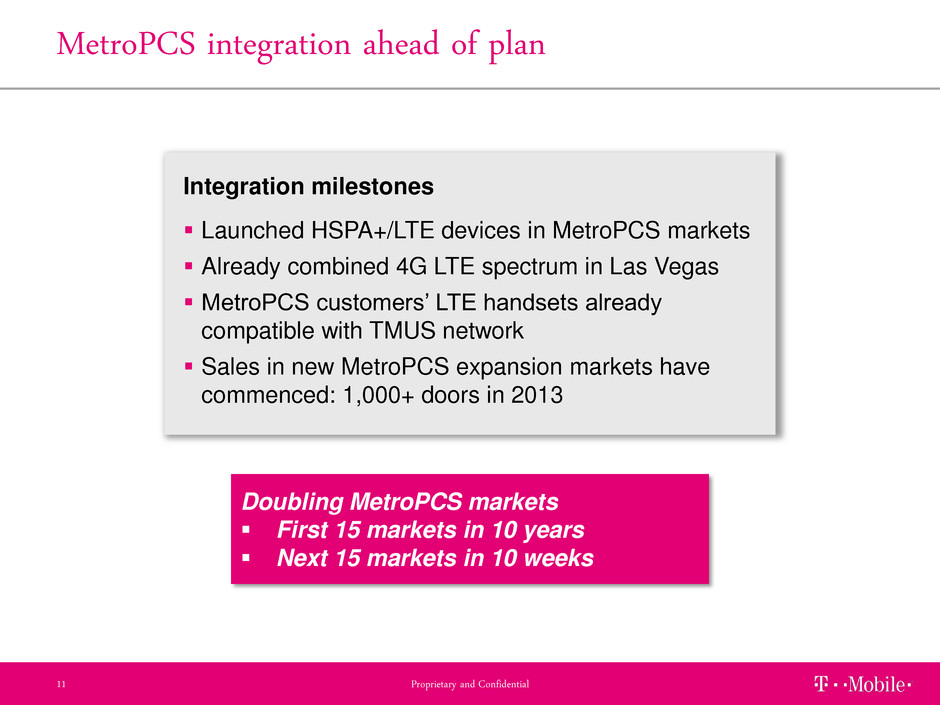
MetroPCS integration ahead of plan Proprietary and Confidential 11 Integration milestones Launched HSPA+/LTE devices in MetroPCS markets Already combined 4G LTE spectrum in Las Vegas MetroPCS customers’ LTE handsets already compatible with TMUS network Sales in new MetroPCS expansion markets have commenced: 1,000+ doors in 2013 Doubling MetroPCS markets First 15 markets in 10 years Next 15 markets in 10 weeks
Financial results Proprietary and Confidential 12 Braxton Carter CFO
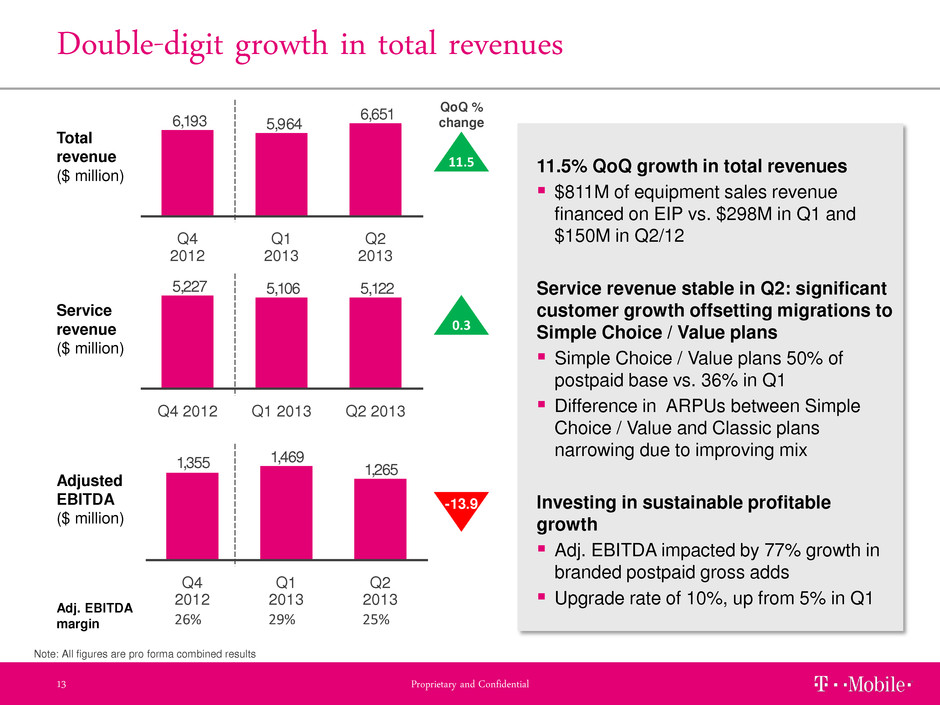
Note: All figures are pro forma combined results 5,1225,1065,227 Q2 2013 Q1 2013 Q4 2012 Double-digit growth in total revenues Proprietary and Confidential 13 Total revenue ($ million) Service revenue ($ million) Adjusted EBITDA ($ million) 26% 29% 25% Adj. EBITDA margin 11.5% QoQ growth in total revenues $811M of equipment sales revenue financed on EIP vs. $298M in Q1 and $150M in Q2/12 Service revenue stable in Q2: significant customer growth offsetting migrations to Simple Choice / Value plans Simple Choice / Value plans 50% of postpaid base vs. 36% in Q1 Difference in ARPUs between Simple Choice / Value and Classic plans narrowing due to improving mix Investing in sustainable profitable growth Adj. EBITDA impacted by 77% growth in branded postpaid gross adds Upgrade rate of 10%, up from 5% in Q1 6,651 5,9646,193 Q2 2013 Q1 2013 Q4 2012 1,265 1,4691, 55 Q2 2013 Q1 2013 Q4 2012 QoQ % change 11.5 -13.9 0.3

Stabilizing branded postpaid ARPU trend Proprietary and Confidential 14 ARPU decline from migration to Simple Choice / Value plans partly offset by strong smartphone growth Sequential decline of $0.47 (-0.9%) vs. $1.40 (-2.5%) in Q1 Simple Choice / Value plans 77% of branded postpaid gross adds vs. 57% in Q1 Smartphones at 72% of total branded postpaid base vs. 54% in Q2/12. Slightly increasing branded prepaid ARPU Branded postpaid ($/month) Branded prepaid ($/month) QoQ % change 0.3 -0.9 35.9735.8735.71 Q2 2013 Q4 2012 Q1 2013 53.6054.0755.47 Q2 2013 Q4 2012 Q1 2013 Note: All figures are pro forma combined results
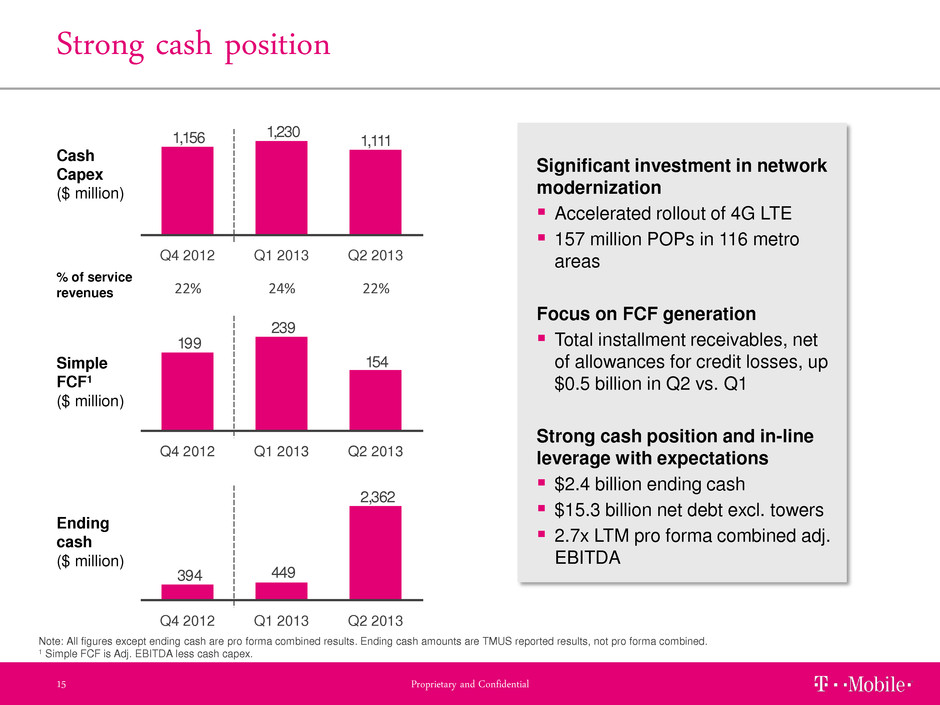
2,362 449394 Q2 2013 Q1 2013 Q4 2012 Strong cash position Proprietary and Confidential 15 Cash Capex ($ million) Ending cash ($ million) Simple FCF1 ($ million) Significant investment in network modernization Accelerated rollout of 4G LTE 157 million POPs in 116 metro areas Focus on FCF generation Total installment receivables, net of allowances for credit losses, up $0.5 billion in Q2 vs. Q1 Strong cash position and in-line leverage with expectations $2.4 billion ending cash $15.3 billion net debt excl. towers 2.7x LTM pro forma combined adj. EBITDA 1,111 1,2301,156 Q4 2012 Q1 2013 Q2 2013 154 239 199 Q2 2013 Q1 2013 Q4 2012 Note: All figures except ending cash are pro forma combined results. Ending cash amounts are TMUS reported results, not pro forma combined. 1 Simple FCF is Adj. EBITDA less cash capex. 22% 24% 22% % of service revenues
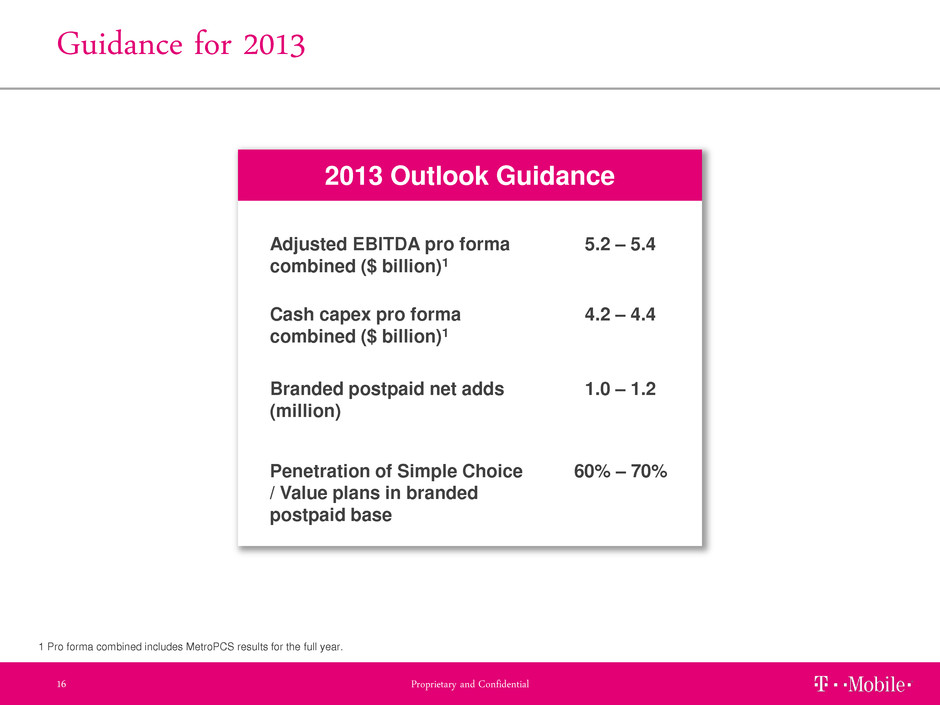
Guidance for 2013 Proprietary and Confidential 16 2013 Outlook Guidance Adjusted EBITDA pro forma combined ($ billion)1 Cash capex pro forma combined ($ billion)1 Branded postpaid net adds (million) 5.2 – 5.4 4.2 – 4.4 1.0 – 1.2 Penetration of Simple Choice / Value plans in branded postpaid base 60% – 70% 1 Pro forma combined includes MetroPCS results for the full year.
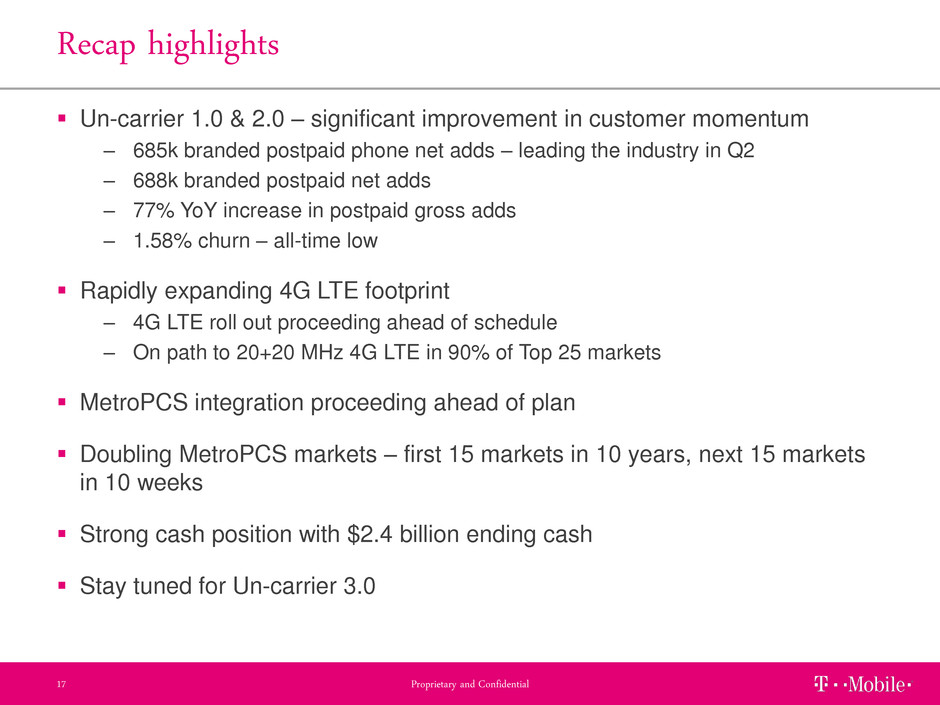
Recap highlights Proprietary and Confidential 17 Un-carrier 1.0 & 2.0 – significant improvement in customer momentum – 685k branded postpaid phone net adds – leading the industry in Q2 – 688k branded postpaid net adds – 77% YoY increase in postpaid gross adds – 1.58% churn – all-time low Rapidly expanding 4G LTE footprint – 4G LTE roll out proceeding ahead of schedule – On path to 20+20 MHz 4G LTE in 90% of Top 25 markets MetroPCS integration proceeding ahead of plan Doubling MetroPCS markets – first 15 markets in 10 years, next 15 markets in 10 weeks Strong cash position with $2.4 billion ending cash Stay tuned for Un-carrier 3.0
