Attached files
| file | filename |
|---|---|
| 8-K - 8-K - STIFEL FINANCIAL CORP | d581804d8k.htm |
| EX-99.1 - EX-99.1 - STIFEL FINANCIAL CORP | d581804dex991.htm |
 2
nd
Quarter 2013
Financial Results Presentation
August 8, 2013
Exhibit 99.2 |
 1
Disclaimer
Forward-Looking Statements
This
presentation
may
contain
“forward-looking
statements”
within
the
meaning
of
the
Private
Securities
Litigation
Reform
Act
of
1995
that
involve
significant
risks,
assumptions,
and
uncertainties,
including
statements
relating
to
the
market
opportunity
and
future
business
prospects
of
Stifel
Financial
Corp.,
as
well
as
Stifel,
Nicolaus
&
Company,
Incorporated
and
its
subsidiaries
(collectively,
“SF”
or
the
“Company”).
These
statements
can
be
identified
by
the
use
of
the
words
“may,”
“will,”
“should,”
“could,”
“would,”
“plan,”
“potential,”
“estimate,”
“project,”
“believe,”
“intend,”
“anticipate,”
“expect,”
and
similar
expressions.
In
particular,
these
statements
may
refer
to
our
goals,
intentions,
and
expectations,
our
business
plans
and
growth
strategies,
our
ability
to
integrate
and
manage
our
acquired
businesses,
estimates
of
our
risks
and
future
costs
and
benefits,
and
forecasted
demographic
and
economic
trends
relating
to
our
industry.
You
should
not
place
undue
reliance
on
any
forward-looking
statements,
which
speak
only
as
of
the
date
they
were
made.
We
will
not
update
these
forward-looking
statements,
even
though
our
situation
may
change
in
the
future,
unless
we
are
obligated
to
do
so
under
federal
securities laws.
Actual
results
may
differ
materially
and
reported
results
should
not
be
considered
as
an
indication
of
future
performance.
Factors
that
could
cause
actual
results
to
differ
are
included
in
the
Company’s
annual
and
quarterly
reports
and
from
time
to
time
in
other
reports
filed
by
the
Company
with
the
Securities
and
Exchange
Commission
and
include,
among
other
things,
changes
in
general
economic
and
business
conditions,
actions
of
competitors,
regulatory
and
legal
actions,
changes
in
legislation,
and
technology
changes.
Use
of
Non-GAAP
Financial
Measures
The
Company
utilized
non-GAAP
calculations
of
presented
net
revenues,
compensation
and
benefits,
non-compensation
operating
expenses,
income
before
income
taxes,
provision
for
income
taxes,
net
income,
compensation
and
non-compensation
operating
expense
ratios,
pre-tax
margin
and
diluted
earnings
per
share
as
an
additional
measure
to
aid
in
understanding
and
analyzing
the
Company’s
financial
results
for
the
three
and
six
months
ended
June
30,
2013.
Specifically,
the
Company
believes
that
the
non-GAAP
measures
provide
useful
information
by
excluding
certain
items
that
may
not
be
indicative
of
the
Company’s
core
operating
results
and
business
outlook.
The
Company
believes
that
these
non-GAAP
measures
will
allow
for
a
better
evaluation
of
the
operating
performance
of
the
business
and
facilitate
a
meaningful
comparison
of
the
Company’s
results
in
the
current
period
to
those
in
prior
periods
and
future
periods.
Reference
to
these
non-GAAP
measures
should
not
be
considered
as
a
substitute
for
results
that
are
presented
in
a
manner
consistent
with
GAAP.
These
non-GAAP
measures
are
provided
to
enhance
investors'
overall
understanding
of
the
Company’s
financial
performance. |
 2
Chairman’s Comments
“We
are
pleased
to
announce
record
revenues
for
the
second
quarter
and
for
the
first
six
months
of
2013
in
both
the
Global
Wealth
Management
and
the
Institutional
Group,
especially
against
the
challenging
market
conditions
in
the
quarter.
We
are
very
encouraged
with
our
investment
banking
results,
which
demonstrate
the
breadth
of
our
capabilities.
The
merger
with
KBW
continues
to
exceed
our
expectations,
and
we
are
gaining
market
share
in
the
financial
institutions
space.
Thi
s quarter,
we
look
forward
to
the
contributions
from
the
institutional
fixed
income
sales
and
trading
professionals
who
joined
us
from
Knight
Capital
Group.” |
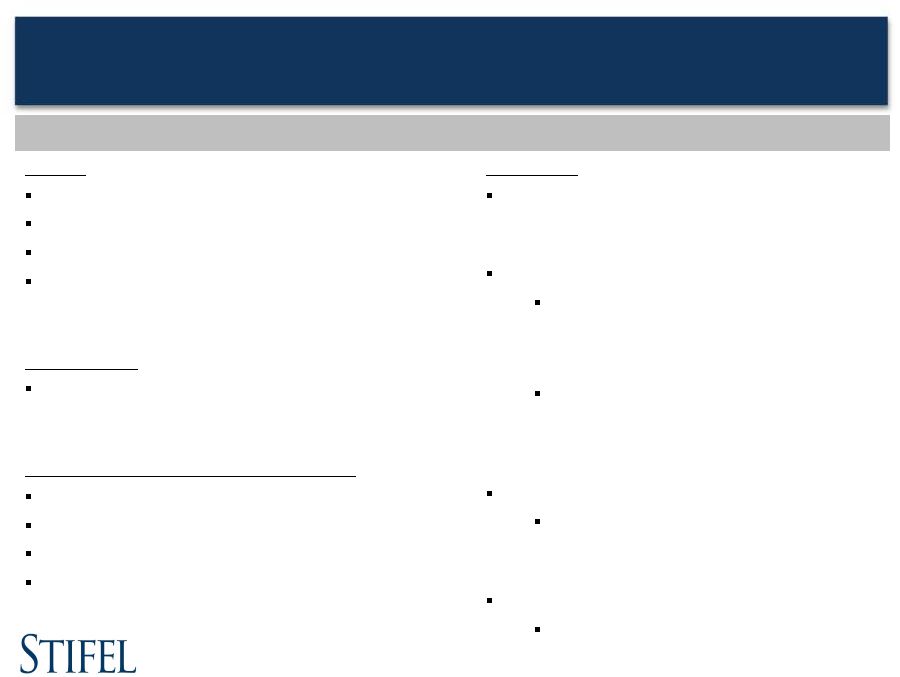 KBW Update
First Half Performance
Advisory
#1 by number of FIG mergers
#1 by number of Bank mergers
#1 by Bank deal value
Representative of the acquirer or seller on 7 out of the 10
largest bank deals
Capital Markets
Bookrunner on all four bank initial public offerings in the
first half
Notable Q2 Capital Markets Bookrun Offerings
Zions Bancorporation -
$301 million preferred offering
First PacTrust Bancorp -
$40 million preferred offering
First NBC Bank -
$115 million initial public offering
Fidelity Southern Corporation -
$69 million follow-on
offering
KBW Equities
Superior recognition in Greenwich Associates
rankings for Research, Sales and Trading
Improving equity trading market share:
Market share in adv. volume for KBW
Regional Bank Index (KRX) components was
4.6% for 1H 2013, compared to 3.1% for 1H
2012
Market share in adv. volume for small-cap
banks was 8.4% for 1H 2013, compared to
5.2% for 1H 2012
Successful July Community Bank Conference:
Record attendance with over 700 attendees
and over 1,500 investor meetings organized
Stifel / KBW fixed income:
Integration efforts underway
M&A Statistics Source: SNL Financial; Includes transactions announced since 1/1/2013; Data
as of 7/1/2013 Note:
Includes
only
whole
institution
transactions
in
the
United
States
Capital markets offerings inclusive of select Stifel transactions pre-closing
Small-cap
banks
includes
the
largest
50
banks
under
KBW
Research
coverage
sub-$1bn
market
cap. |
 Financial
Results
Results |
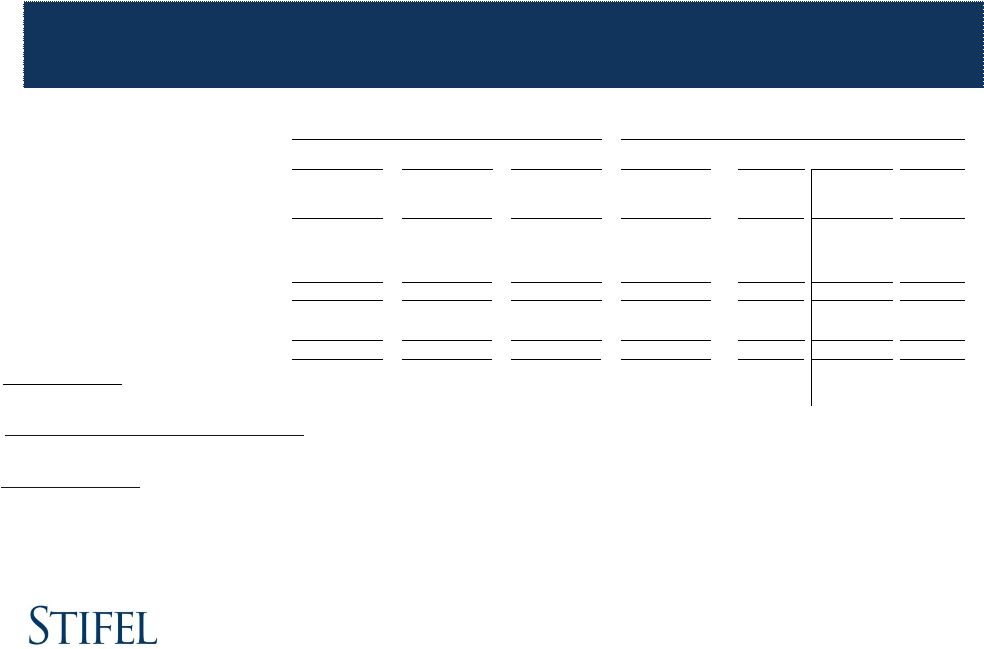 Stifel Financial
Corp. Results Three months ended June 30, 2013
5
($ in thousands, except per share amounts)
GAAP
Non-Core
Non-GAAP
6/30/12
% Change
3/31/13
% Change
Total revenues
511,421
$
1,736
$
513,157
$
384,264
$
33.5%
453,240
$
13.2%
Interest expense
12,685
-
12,685
9,857
28.7%
11,460
10.7%
Net revenues
498,736
1,736
500,472
374,407
33.7%
441,780
$
13.3%
Compensation and benefits
321,331
(6,018)
315,313
239,374
31.7%
281,941
11.8%
Non-comp operating expenses
126,207
(14,974)
111,233
91,159
22.0%
96,155
15.7%
Total non-interest expenses
447,538
(20,992)
426,546
330,533
29.0%
378,096
12.8%
Income before income taxes
51,198
22,728
73,926
43,874
68.5%
63,684
16.1%
Provision for income taxes
21,763
7,807
29,570
17,738
66.7%
23,808
24.2%
Net income
29,435
$
14,921
$
44,356
$
26,136
$
69.7%
39,876
$
11.2%
Earnings per share:
Diluted
0.40
$
0.60
$
0.42
$
42.9%
0.58
$
3.4%
Weighted average number of shares outstanding:
Diluted
74,090
74,090
62,678
18.2%
69,189
7.1%
Ratios to net revenues:
Compensation and benefits
64.4%
63.0%
63.9%
63.8%
Non-comp operating expenses
25.3%
22.2%
24.4%
21.8%
Income before income taxes
10.3%
14.8%
11.7%
14.4%
Three Months Ended June 30, 2013
Three Months Ended
(1)
Non-core adjustments consist of merger-related revenues and expenses associated with
our acquisitions of KBW, the Knight Capital Fixed Income business and Miller Buckfire.
_________________________________________________________
(1) |
 6
Three Months Ended
($ in thousands)
9/30/13
12/31/13
Estimate
Actual
Estimate
Estimate
Operating expenses:
Compensation
6,200
$
6,000
$
2,500
$
400
$
Non-Compensation Operating Expenses
6,800
15,000
5,000
7,100
Total estimated non-core operating expenses
13,000
21,000
7,500
7,500
Retention - KFI
-
-
22,000
-
Total estimated non-core operating expenses - Acquisition-related
13,000
$
21,000
$
29,500
$
7,500
$
6/30/13
Non-Core Expense Projections
Acquisition-Related Expenses |
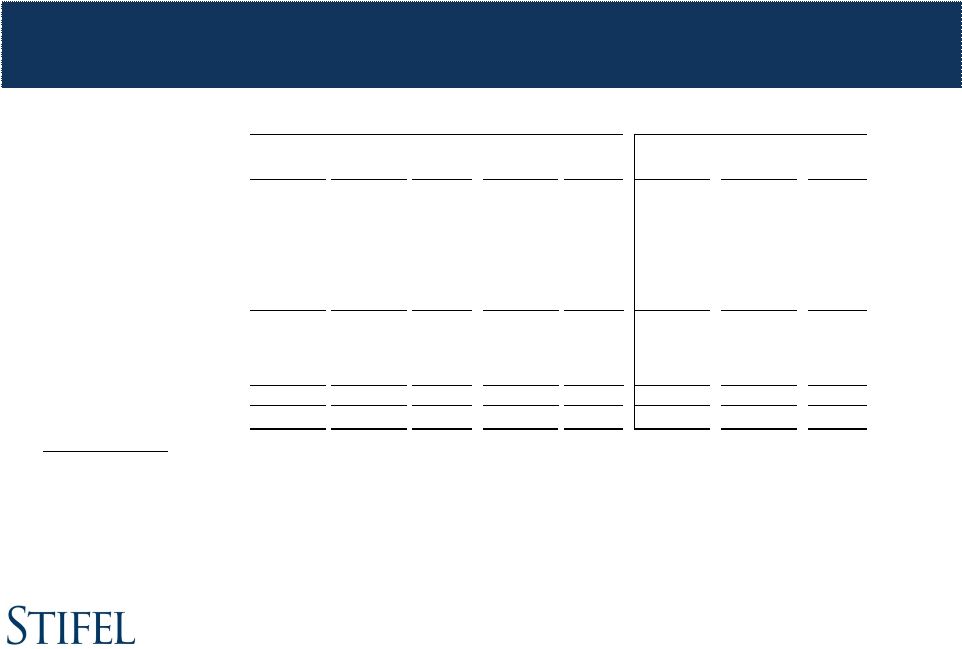
 Stifel Financial
Corp. Results Six months ended June 30, 2013
7
($ in thousands, except per share amounts)
GAAP
Non-Core
Non-GAAP
6/30/12
% Change
Total revenues
964,661
$
1,744
$
966,405
$
793,607
$
21.8%
Interest expense
24,145
-
24,145
18,867
28.0%
Net revenues
940,516
1,744
942,260
774,740
21.6%
Compensation and benefits
637,058
(39,804)
597,254
494,078
20.9%
Non-comp operating expenses
228,914
(21,526)
207,388
177,534
16.8%
Total non-interest expenses
865,972
(61,330)
804,642
671,612
19.8%
Income before income taxes
74,544
63,074
137,618
103,128
33.4%
Provision for income taxes
30,490
22,888
53,378
42,219
26.4%
Net income
44,054
$
40,186
$
84,240
$
60,909
$
38.3%
Earnings per share:
Diluted
0.62
$
1.18
$
0.97
$
21.6%
Weighted average number of shares outstanding:
Diluted
71,627
71,627
62,700
14.2%
Ratios to net revenues:
Compensation and benefits
67.7%
63.4%
63.8%
Non-comp operating expenses
24.4%
22.0%
22.9%
Income before income taxes
7.9%
14.6%
13.3%
Six Months Ended June 30, 2013
Six Months Ended
(1)
Non-core adjustments consist of a charges related to expensing stock
awards issued as retention in connection with the acquisition of KBW and other
merger-related revenues and expenses associated with our acquisitions of KBW, the
Knight Capital Fixed Income business and Miller Buckfire.
_________________________________________________________
(1) |
 Source of
Revenues 8
($ in thousands)
6/30/13
6/30/12
%
Change
3/31/13
%
Change
6/30/13
6/30/12
%
Change
Commissions
157,168
$
127,427
$
23.3%
148,648
$
5.7%
305,816
$
250,730
$
22.0%
Principal transactions
111,448
91,564
21.7%
107,244
3.9%
218,692
207,797
5.2%
Brokerage revenues
268,616
218,991
22.7%
255,892
5.0%
524,508
458,527
14.4%
Capital raising
74,146
40,733
82.0%
51,199
44.8%
125,345
95,566
31.2%
Advisory
47,968
26,630
80.1%
27,180
76.5%
75,148
42,235
77.9%
Investment banking
122,114
67,363
81.3%
78,379
55.8%
200,493
137,801
45.5%
Asset mgt and service fees
76,088
65,311
16.5%
68,912
10.4%
145,000
126,129
15.0%
Other
11,670
5,418
115.4%
20,212
(42.3%)
31,882
18,712
70.4%
Total operating revenues
478,488
357,083
34.0%
423,395
13.0%
901,883
741,169
21.7%
Interest revenue
32,933
27,181
21.2%
29,845
10.3%
62,778
52,438
19.7%
Total revenues
511,421
384,264
33.1%
453,240
12.8%
964,661
793,607
21.6%
Interest expense
12,685
9,857
28.7%
11,460
10.7%
24,145
18,867
28.0%
Net revenues
498,736
$
374,407
$
33.2%
441,780
$
12.9%
940,516
$
774,740
$
21.4%
Three Months Ended
Six Months Ended |
 ($ in
thousands) 6/30/13
6/30/12
%
Change
3/31/13
%
Change
6/30/13
6/30/12
%
Change
Private client group
160,889
$
143,475
$
12.1%
158,392
$
1.6%
319,282
$
292,876
$
9.0%
Equity brokerage
66,788
38,466
73.6%
52,000
28.4%
118,788
82,638
43.7%
Fixed income brokerage
40,939
37,050
10.5%
45,500
(9.9%)
86,439
83,013
4.1%
Institutional brokerage
107,727
75,516
42.7%
97,500
10.5%
205,227
165,651
23.9%
Total Brokerage Revenues
268,616
$
218,991
$
22.7%
255,892
$
5.0%
524,509
$
458,527
$
14.4%
Three Months Ended
Six Months Ended
9
Brokerage Revenues by Segment |
 Core
Non-Interest Expenses Three months ended June 30, 2013
($ in thousands)
6/30/13
(1)
6/30/12
% Change
3/31/13
% Change
6/30/13
(1)
6/30/12
3/31/13
Net revenues
500,472
$
374,407
$
33.7%
441,788
$
13.3%
100.0%
100.0%
100.0%
Compensation and benefits
294,446
219,004
34.4%
259,135
13.6%
58.8%
58.5%
58.7%
Transitional pay
(2)
20,867
20,370
2.4%
22,806
(8.5%)
4.2%
5.4%
5.2%
Total compensation and benefits
315,313
239,374
31.7%
281,941
11.8%
63.0%
63.9%
63.8%
Occupancy and equipment rental
38,306
32,320
18.5%
31,501
21.6%
7.7%
8.6%
7.1%
Communication and office supplies
24,604
20,797
18.3%
21,858
12.6%
4.9%
5.6%
4.9%
Commissions and floor brokerage
9,616
7,747
24.1%
8,669
10.9%
1.9%
2.1%
2.0%
Other operating expenses
38,707
30,295
27.8%
34,127
13.4%
7.7%
8.1%
7.6%
Total non-comp operating expenses
111,233
91,159
22.0%
96,155
15.7%
22.2%
24.3%
21.8%
Total non-interest expense
426,546
330,533
29.0%
378,096
12.8%
85.2%
88.3%
85.6%
Income before income taxes
73,926
43,874
68.5%
63,692
16.1%
14.8%
11.7%
14.4%
Provision for income taxes
29,570
17,738
66.7%
23,808
24.2%
5.9%
4.6%
5.4%
Non-GAAP net income
44,356
$
26,136
$
69.7%
39,884
$
11.2%
8.9%
7.0%
9.0%
Non-core expenses (after-tax)
(14,921)
-
(25,265)
GAAP net income
29,435
$
26,136
$
14,619
$
Three Months Ended
% of Net revenues
10
_________________________________________________________
(1)
Excludes non-core adjustments consisting of merger-related revenues and expenses
associated with our acquisitions of KBW, the Knight Capital Fixed Income business and Miller Buckfire.
(2)
Transition pay includes amortization of upfront notes, signing bonuses and retention
awards. |
 Core
Non-Interest Expenses Six months ended June 30, 2013
($ in thousands)
6/30/13
(1)
6/30/12
% Change
6/30/13
(1)
6/30/12
Net revenues
942,260
$
774,740
$
21.6%
100.0%
100.0%
Compensation and benefits
555,424
455,336
22.0%
58.9%
58.8%
Transitional pay
(2)
41,830
38,742
8.0%
4.4%
5.0%
Total compensation and benefits
597,254
494,078
20.9%
63.4%
63.8%
Occupancy and equipment rental
69,808
63,111
10.6%
7.4%
8.1%
Communication and office supplies
46,462
41,170
12.9%
4.9%
5.3%
Commissions and floor brokerage
18,285
15,359
19.1%
1.9%
2.0%
Other operating expenses
72,833
57,894
25.8%
7.7%
7.5%
Total non-comp operating expenses
207,388
177,534
16.8%
22.0%
22.9%
Total non-interest expense
804,642
671,612
19.8%
85.4%
86.7%
Income before income taxes
137,618
103,128
33.4%
14.6%
13.3%
Provision for income taxes
53,378
42,219
26.4%
5.7%
5.3%
Non-GAAP net income
84,240
$
60,909
$
38.3%
8.9%
7.9%
Non-core expenses (after-tax)
(40,186)
-
GAAP net income
44,054
$
60,909
$
Six Months Ended
% of Net revenues
11
_________________________________________________________
(1)
Excludes non-core adjustments consisting of a charge related to expensing stock
awards issued as retention in connection with the acquisition of KBW and other merger-related
revenues and expenses associated with our acquisitions of KBW, the Knight Capital Fixed Income
business and Miller Buckfire. (2)
Transition pay includes amortization of upfront notes, signing bonuses and retention
awards. |
 Segment
Comparison - Core
12
($ in thousands)
6/30/13
(1)
6/30/12
%
Change
3/31/13
%
Change
6/30/13
(1)
6/30/12
%
Change
Net revenues:
Global Wealth Management
282,717
$
239,300
$
18.1%
266,957
$
5.9%
549,674
$
486,908
$
12.9%
Institutional Group
220,476
136,026
62.1%
176,437
25.0%
396,913
285,270
39.1%
Other
(2,721)
(919)
196.1%
(1,606)
69.4%
(4,327)
2,562
(268.9%)
500,472
$
374,407
$
33.7%
441,788
$
13.3%
942,260
$
774,740
$
21.6%
Operating contribution:
Global Wealth Management
78,924
$
61,036
$
29.3%
69,499
$
13.6%
148,423
$
129,914
$
14.2%
Institutional Group
30,059
17,863
68.3%
28,137
6.8%
58,196
41,867
39.0%
Other
(35,057)
(35,025)
0.2%
(33,944)
3.4%
(69,001)
(68,653)
0.6%
73,926
$
43,874
$
68.5%
63,692
$
16.2%
137,618
$
103,128
$
33.4%
Three Months Ended
Six Months Ended
(1)
Core (non-GAAP) results for the three and six months ended June 30, 2012 are the same as
GAAP results.
_________________________________________________________
|
 Global Wealth
Management ($ in thousands)
6/30/13
6/30/12
% Change
3/31/13
% Change
6/30/13
6/30/12
% Change
Commissions
104,576
$
88,417
$
18.3%
102,086
$
2.4%
206,662
$
179,437
$
15.2%
Principal transactions
56,313
55,058
2.3%
56,307
0.0%
112,620
113,439
(0.7%)
Asset management & service fees
75,976
65,169
16.6%
68,934
10.2%
144,910
125,755
15.2%
Net interest
24,505
18,227
34.5%
21,486
14.1%
45,991
35,869
28.2%
Investment banking
15,334
8,384
82.9%
11,103
38.1%
26,437
20,786
27.2%
Other income
6,013
4,045
48.7%
7,041
(14.6%)
13,054
11,622
12.3%
Net revenues
282,717
239,300
18.1%
266,957
5.9%
549,674
486,908
12.9%
Compensation and benefits
163,156
140,629
16.0%
157,596
3.5%
320,752
283,980
12.9%
Non-comp operating expenses
40,637
37,635
8.0%
39,862
1.9%
80,499
73,014
10.3%
Total non-interest expenses
203,793
178,264
14.3%
197,458
3.2%
401,251
356,994
12.4%
Income before income taxes
78,924
$
61,036
$
29.3%
69,499
$
13.6%
148,423
$
129,914
$
14.2%
Ratios to net revenues:
Compensation and benefits
57.7%
58.8%
59.0%
58.4%
58.3%
Non-comp operating expenses
14.4%
15.7%
15.0%
14.6%
15.0%
Income before income taxes
27.9%
25.5%
26.0%
27.0%
26.7%
Three Months Ended
Six Months Ended
13 |
 Stifel Bank
& Trust (an operating unit of GWM)
14
As of
6/30/13
6/30/12
% Change
3/31/13
% Change
Assets
$
4,306,447
$
3,052,867
41.1
$
3,872,677
11.2
Investment securities
2,956,073
1,844,875
60.2
2,440,146
21.1
Retained loans, net
983,788
709,079
38.7
886,597
11.0
Loans held for sale
152,246
117,166
29.9
165,698
(8.1)
Deposits
4,007,050
2,776,684
44.3
3,556,568
12.7
Allowance for loan losses
10,919
$
5,781
$
88.9
9,406
$
16.1
Allowance as a percentage of loans
1.10
%
0.88
%
1.01
%
Non-performing loans
1,042
$
1,872
$
(44.3)
1,063
$
(2.0)
Other non-performing assets
173
634
(72.7)
373
(53.6)
Non-performing assets
1,215
$
2,506
$
(51.5)
1,436
$
(15.4)
Non-performing assets as a percentage of
total assets
0.03
%
0.08
%
0.04
%
As of |
 Institutional
Group Revenues ($ in thousands)
6/30/13
6/30/12
% Change
3/31/13
% Change
6/30/13
6/30/12
% Change
Institutional brokerage:
Equity
66,788
$
38,466
$
73.6%
52,000
$
28.4%
118,788
$
82,638
$
43.7%
Fixed income
40,939
37,050
10.5%
45,500
(9.9%)
86,439
83,013
4.1%
107,727
75,516
42.7%
97,500
10.5%
205,227
165,651
23.9%
Investment Banking:
Capital raising
Equity
44,640
17,651
152.9%
24,380
83.1%
69,020
49,201
40.3%
Fixed income
14,173
14,698
(3.6%)
15,715
(9.8%)
29,888
25,579
16.8%
58,813
32,349
81.8%
40,095
46.7%
98,908
74,780
32.3%
Advisory fees
47,967
26,630
80.1%
27,180
76.5%
75,147
42,235
77.9%
Investment banking
106,780
58,979
81.0%
67,275
58.7%
174,055
117,015
48.7%
Other
(1)
5,969
1,531
289.9%
11,662
(48.8%)
17,631
2,604
577.0%
Total net revenue
220,476
$
136,026
$
62.1%
176,437
$
25.0%
396,913
$
285,270
$
39.1%
Three Months Ended
Six Months Ended
15
_________________________________________________________
(1)
Includes net interest and other income. |
 Institutional
Group Revenues ($ in thousands)
6/30/13
6/30/12
% Change
3/31/13
% Change
6/30/13
6/30/12
% Change
Institutional brokerage:
Equity
66,788
$
38,466
$
73.6%
52,000
$
28.4%
118,788
$
82,638
$
43.7%
Fixed income
40,939
37,050
10.5%
45,500
(9.9%)
86,439
83,013
4.1%
107,727
75,516
42.7%
97,500
10.5%
205,227
165,651
23.9%
Investment Banking:
Capital raising
Equity
44,640
17,651
152.9%
24,380
83.1%
69,020
49,201
40.3%
Fixed income
14,173
14,698
(3.6%)
15,715
(9.8%)
29,888
25,579
16.8%
58,813
32,349
81.8%
40,095
46.7%
98,908
74,780
32.3%
Advisory fees
47,967
26,630
80.1%
27,180
76.5%
75,147
42,235
77.9%
Investment banking
106,780
58,979
81.0%
67,275
58.7%
174,055
117,015
48.7%
Other
(1)
5,969
1,531
289.9%
11,662
(48.8%)
17,631
2,604
577.0%
Total net revenue
220,476
$
136,026
$
62.1%
176,437
$
25.0%
396,913
$
285,270
$
39.1%
Three Months Ended
Six Months Ended
16
_________________________________________________________
* Percentage not meaningful.
(1)
Includes net interest and other income. |
 17
Financial
Financial
Condition
Condition |
 Capital
Structure As of June 30, 2013
(in thousands, except ratios)
($ in thousands)
Total Assets
8,493,191
$
Stockholders' Equity
1,897,990
$
6.70% senior notes, due 2022
175,000
$
5.375% senior notes, due 2022
150,000
Non-recourse debt, 6.75%, due 2016
53,024
Debentures to Stifel Financial Capital Trusts II, III, & IV
82,500
Total Capitalization
2,358,514
$
Ratios:
Debt to Equity
13.6%
Leverage Ratio
3.6x
Equity Capitalization
4.5x
18
(1)
Debt
to
equity
ratio
includes
the
debentures
to
Stifel
Financial
Capital
Trusts
($82.5m),
non-recourse
debt
($55.9m),
and
Senior
Notes
($325.0m)
divided
by
stockholders’
equity.
(2)
Leverage ratio = total assets divided by total capitalization.
(3)
Equity capitalization = total assets divided by stockholders’equity.
_________________________________________________________
(1)
(2)
(3) |
 As of
6/30/13
6/30/12
% Change
3/31/13
% Change
Total assets (000s):
Stifel Nicolaus & Stifel Financial
4,186,744
$
3,085,668
$
35.7%
4,261,078
$
(1.7%)
Stifel Bank
4,306,447
3,052,867
41.1%
3,872,677
11.2%
Total assets
8,493,191
$
6,138,535
$
38.4%
8,133,755
$
4.4%
Total shareholders' equity (000s):
Stifel Nicolaus & Stifel Financial
1,613,003
$
1,140,188
$
41.5%
1,613,398
$
(0.0%)
Stifel Bank
284,987
231,657
23.0%
290,268
(1.8%)
Total shareholders' equity
1,897,990
$
1,371,845
$
38.4%
1,903,666
$
(0.3%)
Leverage ratio:
Stifel Nicolaus & Stifel Financial
2.0
2.2
(8.5%)
2.1
(1.6%)
Stifel Bank
15.1
13.2
14.6%
13.3
13.3%
Total leverage ratio
3.6
3.8
(4.5%)
3.4
4.8%
Financial advisors
(1)
2,069
2,028
2.0%
2,063
0.3%
Full-time associates
5,759
5,196
10.8%
5,680
1.4%
Locations
357
332
7.5%
357
0.0%
Total client assets (000s)
(2)
150,628,000
$
131,026,000
$
15.0%
147,119,000
$
2.4%
As of
19
Other Financial Data
(1)
Includes
145,
156
and
148
independent
contractors
as
of
June
30,
2013,
June
30,
2012
and
March
31,
2013.
(2)
Includes
money-market
and
FDIC-insured
balances.
Prior
period
amounts
have
been
adjusted
to
conform
to
the
current
period
presentation.
_________________________________________________________
|
 Q&A
Q&A |