Attached files
| file | filename |
|---|---|
| 8-K - FORM 8-K - SCIENTIFIC GAMES CORP | v352285_8k.htm |
| EX-99.1 - EXHIBIT 99.1 - SCIENTIFIC GAMES CORP | v352285_ex99-1.htm |
Exhibit 99.2

Scientific Games Second Quarter 2013 Earnings Presentation

Safe Harbor Statement 2 Throughout this presentation the Company makes “forward - looking statements” within the meaning of the U.S. Private Securities Litigation Reform Act of 1995. Forward - looking statements describe future expectations, plans, results or strategies and can often be ident ified by the use of terminology such as “may,” “will,” “estimate,” “intend,” “continue,” “believe,” “expect,” “anticipate,” “should,” “cou ld, ” “potential,” “opportunity,” or similar terminology. These statements are based upon management’s current expectations, assumptions and es tim ates and are not guarantees of future results or performance. Actual results may differ materially from those contemplated in these s tat ements due to a variety of risks and uncertainties and other factors, including, among other things: competition; material adverse changes in economic and industry conditions; technological change; retention and renewal of existing contracts and entry into new or revised contract s; availability and adequacy of cash flows to satisfy obligations and indebtedness or future needs; protection of intellectual property; secu rit y and integrity of software and systems; laws and government regulation, including those relating to gaming licenses, permits and operations; in ability to identify, complete and integrate future acquisitions; inability to benefit from, and risks associated with, strategic equity inv estments and relationships; failure of our Northstar Illinois joint venture to meet the net income targets or otherwise to realize the anticipated benefits under its private management agreement with the Illinois Lottery; failure of our Northstar New Jersey joint venture to meet the net income targets or other requirements under its agreement to provide marketing and sales services to the New Jersey Lottery or otherw ise to realize the anticipated benefits under such agreement (including as a result of a protest); the seasonality of our business; failure to receive the required approvals related to the award to our consortium of an instant ticket concession in Greece on a timely basis or at a ll, or otherwise to realize the anticipated benefits in connection with such concession; failure to complete the pending acquisition of WMS Indus tri es Inc. (“WMS”) on a timely basis or at all, including due to the inability to obtain the gaming regulatory approvals required to com ple te the acquisition; disruption of our current plans and operations in connection with the WMS acquisition; failure to achieve the in ten ded benefits of the WMS acquisition, including due to the inability to realize synergies in the anticipated amounts or within the contemplate d t ime - frames or cost expectations, or at all; inability to identify and capitalize on trends and changes in the lottery and gaming industries , i ncluding the potential expansion of regulated gaming via the internet; inability to enhance and develop successful gaming concepts; depend enc e on suppliers and manufacturers; liability for product defects; fluctuations in foreign currency exchange rates and other factors as sociated with international operations; influence of certain stockholders; dependence on key personnel; failure to perform under our contra cts ; resolution of pending or future litigation; labor matters and stock price volatility. Additional information regarding risks and uncerta int ies and other factors that could cause actual results to differ materially from those contemplated in forward - looking statements is included f rom time to time in the Company’s filings with the Securities and Exchange Commission (“SEC”), including under the heading “Risk Factors” in the Company’s Annual Report on Form 10 - K filed with the SEC on March 12, 2013 and in its subsequent periodic reports. Forward - lookin g statements speak only as of the date they are made and, except for the Company’s ongoing obligations under the U.S. federal s ecu rities laws, the Company undertakes no obligation to publicly update any forward - looking statements whether as a result of new information, f uture events or otherwise. The date of this presentation is as of August 8, 2013, and the information provided herein is presented through the dates ind ica ted on the applicable slides. Forward - looking statements speak only as of the date they are made and, except for Scientific Games’ ongoing obligations under the U.S. federal securities laws, Scientific Games undertakes no obligation to publicly update any forward - looking stateme nts whether as a result of new information, future events or otherwise. Note Regarding Presentation of Non - GAAP Financial Measures: This presentation and the related discussion include certain financial measures that were not prepared in accordance with gen era lly accepted accounting principles in the United States (GAAP). Additional information regarding these non - GAAP financial measures, includin g reconciliations to the most directly comparable GAAP financial measures, can be found in Scientific Games’ press release dated August 8, 2013. This press release is available on Scientific Games’ website at www.scientificgames.com in the “Investor Information – Pr ess Releases ”. Scientific Games sold its installed base of gaming terminals in its pub business on March 25, 2013. The related results of op era tions are presented as discontinued operations in the Company’s financial statements for all periods presented. All financial results r efe renced in this presentation are for continuing operations only, unless otherwise noted.

3 (1) Attributable EBITDA, as used herein, is based on the definition of "consolidated EBITDA" in our credit agreement (summarized in our August 8, 2013 press release), except that attributable EBITDA as used herein includes our share of the EBITDA of all of our equity investments (whereas "consolidated EBITDA" for purposes of the credit agreement gene ral ly includes our share of the EBITDA of our Italian joint venture but only the income of our other equity investments to the extent it has been distributed to us). Attributable EBITDA is a non - GAAP financial measure that is pr esented herein as a supplemental disclosure and is reconciled to net income (loss) in our August 8, 2013 press release. (2) Free cash flow, as included herein, represents net cash provided by operating activities less total capital expenditures (whi ch includes lottery and gaming systems expenditures and other intangible assets and software expenditures). Free cash flow is a non - GAAP financial measure that is presented herein as a supplemental disclosure and is reco nciled to net cash provided by operating activities in our August 8, 2013 press release . Summary of Q2 Results ($ in millions, except per share amounts) 2013 2012 $ Δ % Δ Revenue 235.0$ 226.0$ 9.0$ 4.0% Printed Products 130.1 122.7 7.4 6.0% Lottery Systems 68.9 64.6 4.3 6.6% Gaming 36.1 38.7 (2.6) (6.8%) Operating Income 12.5 11.4 1.1 9.3% Printed Products 35.3 23.1 12.2 52.7% Lottery Systems 8.3 10.5 (2.1) (20.2%) Gaming (8.4) (0.8) (7.6) NM (Increase) / Decrease in Unallocated Corporate Expense (22.9) (21.4) (1.5) (6.8%) Net Loss (Continuing Operations) (12.4) (10.9) (1.5) (13.5%) Net Loss per share (Continuing Operations) (0.14) (0.12) (0.02) (16.7%) Attributable EBITDA (Continuing Operations) (1) 86.5 83.2 3.3 4.0% Total Capital Expenditures (2) (44.2) (28.6) (15.6) 54.7% Free Cash Flow (2) 2.6 32.9 (30.3) NM Second Quarter

(7.5%) (17.6%) (14.9%) (12.5%) (7.6%) Q2'12 Q3'12 Q4'12 Q1'13 Q2'13 Q2’13 Key Performance Indicators U.S. Lottery Customers’ Retail Sales Y/Y Δ China Sports Lottery Instant Ticket Retail Sales Y/Y Δ Italy Instant Ticket Retail Sales Y/Y Δ Global Draw U.K. Betting Shop Performance Y/Y Δ Terminals 18,284 18,405 (1) Represents the average amount bet less player winnings, excluding taxes and other fees, per installed Global Draw terminal pe r d ay. (2) Percentage increases for Q3’12, Q4’12, Q1’13 and Q2’13 are calculated excluding William Hill’s results in the prior - year period. The Company’s contract with William Hill expired in Q1’12. 19,123 (2) 4 (2) (2) 19,453 (7.8%) (6.3%) 3.9% (2.8%) (2.4%) Q2'12 Q3'12 Q4'12 Q1'13 Q2'13 19,638 10.0% 8.9% 5.1% 2.0% 4.9% 3.8% 8.5% 10.9% (14.9%) 10.8% Q2'12 Q3'12 Q4'12 Q1'13 Q2'13 Instant Tickets Lottery Systems (2) 6.3% 6.5% 0.8% (1.2%) (2.2%) Q2'12 Q3'12 Q4'12 Q1'13 Q2'13 Global Draw U.K. Gross Win/Terminal/Day(1)

New Contracts and Contract Extensions 5 Commence Customer Term/Type of Contract Date Term/Extension Additional Information New Contracts HRADF (Greece) Management of instant ticket lotteries N/A 12-yr / none $5.6B 2011 total lottery sales (1)* Hungarian State Lottery Terminal sales and systems N/A Dec-20 / none N/A LEIDSA (Dominican Republic) Instant ticket CSP May-13 7-yr / one 3-yr N/A LoRo (Switzerland) Terminal sales and systems N/A N/A ~3,000 terminals New Jersey Lottery Lottery marketing and sales services Oct-13 Jun-29 / none $2.8B FY12 total lottery sales* Norsk Tipping (Norway) Terminal sales and support Apr-14 5-yr / none ~5,000 terminals Norsk Tipping (Norway) Instant game system N/A 4-yr / one 4-yr & two 2-yr $1.9B 2011 total lottery sales* Rhode Island Lottery Instant ticket PPK Jul-13 3-yr / five 1-yr $85M FY12 instant ticket sales* South Carolina Lottery Instant ticket CSP Oct-13 5-yr / one 2-yr $758M FY12 instant ticket sales* Contract Extensions ISBB (Israel) Sports betting central system N/A Feb-16 / none $479M 2012 toto sales* Ohio Lottery Instant ticket PPK Jul-13 2-yr / none $1.5B FY12 instant ticket sales* Oregon Lottery Instant ticket PPK Jul-13 4-yr / none $118M FY12 instant ticket sales* Tatts Lotteries (Australia) Instant ticket PPK Jul-13 Dec-14 / two 1-yr $421M 2012 instant ticket sales* West Virginia Lottery VLT central system N/A Jan-18 / none $13.3B FY12 VLT sales (bets played)* (1) Instant tickets are not currently offered in this jurisdiction. * Source: LaFleur's World Lottery Almanac. PPK= Price per thousand CSP = Cooperative services VLT = Video lottery terminal

Printed Products ($ in millions) 6 ▪ Revenue growth in price per thousand customers primarily driven by sales to our customer in Italy ▪ Growth in percentage of sales customers principally reflects higher sales in Florida, Georgia and the U.K ▪ Decrease in depreciation and amortization and employee termination and restructuring costs due in large part to closure of the Australia printing facility in 2012 Revenue Q2'12 Revenue $122.7 Price Per Thousand Customers 5.3 Percentage of Sales and Cooperative Services (CSP) Customers 1.8 Impact of Foreign Exchange and Other 0.3 Q2'13 Revenue $130.1 Operating Income Q2'12 Operating Income $23.1 +/- Impact of Change in Revenue 3.8 +/- Selling, General & Administrative Expense (0.1) +/- Stock-Based Compensation 0.0 +/- Depreciation & Amortization 4.0 +/- Employee Termination & Restructuring Costs 4.5 Q2'13 Operating Income $35.3

Lottery Systems ($ in millions) 7 ▪ Equipment sales revenue growth primarily represents sales to international customers ▪ Increase in service revenue principally reflects the benefit of a record $591 million Powerball ® jackpot during the quarter ▪ Increase in D&A principally due to new hardware deployed in the U.S. and China Revenue Q2'12 Revenue $64.6 Equipment Sales 3.1 Service Revenue 1.1 Other 0.1 Q2'13 Revenue $68.9 Operating Income Q2'12 Operating Income $10.5 +/- Impact of Change in Revenue 0.4 +/- Selling, General & Administrative Expense (0.6) +/- Stock-Based Compensation (0.1) +/- Depreciation & Amortization (1.8) Q2'13 Operating Income $8.3
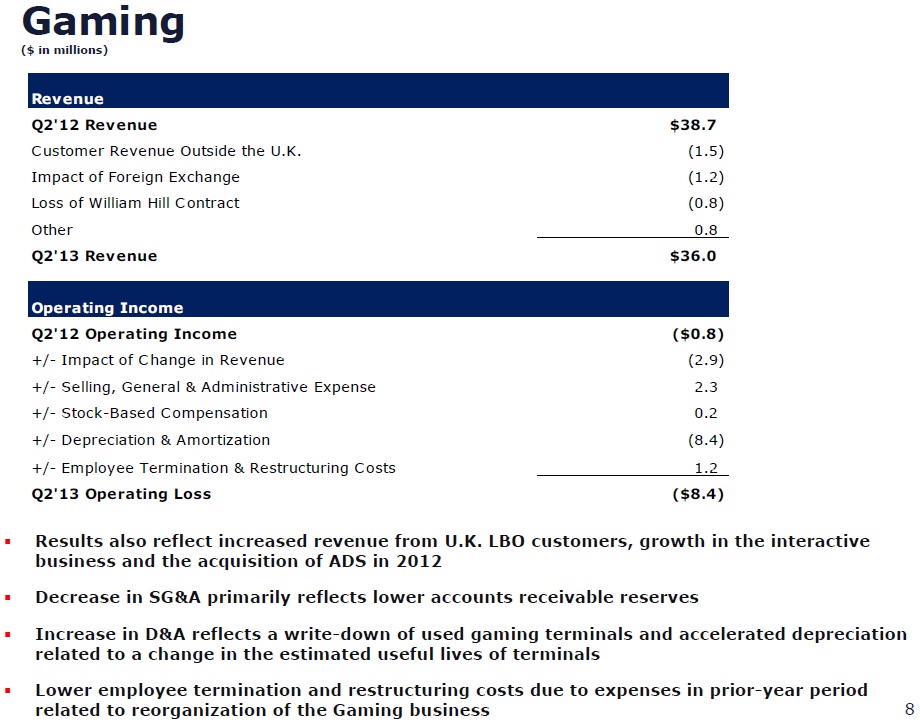
Gaming ($ in millions) 8 ▪ Results also reflect increased revenue from U.K. LBO customers, growth in the interactive business and the acquisition of ADS in 2012 ▪ Decrease in SG&A primarily reflects lower accounts receivable reserves ▪ Increase in D&A reflects a write - down of used gaming terminals and accelerated depreciation related to a change in the estimated useful lives of terminals ▪ Lower employee termination and restructuring costs due to expenses in prior - year period related to reorganization of the Gaming business Revenue Q2'12 Revenue $38.7 Customer Revenue Outside the U.K. (1.5) Impact of Foreign Exchange (1.2) Loss of William Hill Contract (0.8) Other 0.8 Q2'13 Revenue $36.0 Operating Income Q2'12 Operating Income ($0.8) +/- Impact of Change in Revenue (2.9) +/- Selling, General & Administrative Expense 2.3 +/- Stock-Based Compensation 0.2 +/- Depreciation & Amortization (8.4) +/- Employee Termination & Restructuring Costs 1.2 Q2'13 Operating Loss ($8.4)

Earnings Analysis 9 Second Quarter 2013 2012 ($ in millions, except for EPS) Credit Agreement Adjustments: Description Segment Income Statement Line Impacted Non-cash stock-based compensation expenses Non-cash compensation expense related to issuance of stock options and restricted stock units All SG&A $ 5.7 $ 5.9 (0.06)$ (0.06)$ Specified permitted add-backs Expenses related to WMS acquisition, management transition and transaction expenses in Q2'13; Transaction expenses and restructuring expenses in Q2'12 All SG&A and Restructuring 3.1 6.8 (0.03) (0.05) Playtech royalties and fees Royalty fees related to Videobet platform Gaming Cost of Services 2.0 1.9 (0.02) (0.02) Acquisition Advisory Fees Fees and expenses primarily related to the Provoloto acquisition, ADS acquisition and other transactions All SG&A - 0.7 - (0.01) Not Credit Agreement Adjustments Non-cash charge Write-down of used terminals and accelerated depreciation due to a change in the depreciable life of our gaming terminals Gaming Depreciation 8.7$ 2.7$ (0.08)$ (0.03)$ Non-cash charge Write down of certain development costs Printed Products Depreciation - 3.1 - (0.03) Non-cash charge Accelerated depreciation of equipment related to reorganization of Australian printing operations Printed Products Depreciation - 1.5 - (0.01) Non-cash charge Increase in accounts receivable reserves Gaming SG&A - 2.4 - (0.02) Non-cash charge Impact of foreign exchange transaction loss/gain All Other Income/Expense - 1.4 - (0.01) Second Quarter Impact on Attributable EBITDA Impact on Reported EPS 2013 2012