Attached files
| file | filename |
|---|---|
| 8-K - 8-K - SUNEDISON, INC. | sunedisonform8-k6302013pre.htm |
| EX-99.1 - PRESS RELEASE - SUNEDISON, INC. | exhibit991-6302013pressrel.htm |

Second Quarter 2013 Results Conference Call August 7, 2013

Safe Harbor 2 With the exception of historical information, the matters disclosed in this presentation are forward-looking statements. Such statements involve certain risks and uncertainties that could cause actual results to differ materially from those in the forward-looking statements. Potential risks and uncertainties are described in the Company’s filings with the Securities and Exchange Commission (SEC), including its 2012 Form 10-K and second quarter 2013 Form 10-Q, in addition to the risks and uncertainties described on page 19 of this presentation. These forward-looking statements represent the Company’s judgment as of the date of this presentation. The Company disclaims, however, any intent or obligation to update these forward-looking statements. This presentation also includes non-GAAP financial measures. You can find a reconciliation of each of these non-GAAP measures to the most directly comparable GAAP financial measure in our earnings press release filed on Form 8-K today with the SEC and posted in the Investor Relations portion of our web site at www.SunEdison.com.

Quarter Overview 3 2Q’13 metrics largely in-line with guidance issued on May 9, 2013 Semiconductor Materials grew revenue, profits and cash flow Q/Q Solar Energy non-GAAP revenue grew 25% Q/Q Competitive position strong Solar outlook encouraging

Results Review 4 2Q Highlights Semiconductor Materials continues to perform • Revenue grew 4% Q/Q • Free cash flow grew Q/Q Average Price per Watt • $2.85 for all projects • $3.32 for fully developed projects • $1.54 for EPC projects Capex • Continue to invest in Semiconductor Materials segment Key Metrics 2Q 2013 Outlook 2Q 2013 Actual Semiconductor Revenue ($ mil) $235 to $245 $239 Solar Energy Systems MW Sold (Non-GAAP) 29 to 54 51 Solar Energy Systems MW Retained on Balance Sheet 0 to 3 0 Fully-Developed Solar Energy Systems Avg. Price ($/Wdc) $3.40 to $3.55 $3.32 Capex ($ mil) $30 to $40 $39(1) Note: Unaudited (1) Includes $9 million related to the acquisition of a TCS plant from Evonik

Summary Results 5 Adjustments to GAAP are related to direct sale and financing sale-leaseback solar projects Operating Income adjustment is due to timing differences between GAAP and non-GAAP Note: Unaudited. See non-GAAP to GAAP reconciliation included in our earnings press release filed on Form 8-K dated 8/7/2013 ($ Millions, except per share) Semiconductor Materials Solar Energy Corporate SunEdison GAAP Non-GAAP Adjustments (Solar Energy) SunEdison Non-GAAP Net Sales 239.0$ 162.3$ -$ 401.3$ 90.3$ 491.6$ Gross Profit 49.2 (20.4) 28.8 Gross Margin% 12.3% 5.9% Operating Expenses 95.8 - 95.8 Operating Income (Loss) 3.6 (25.2) (25.0) (46.6) (20.4) (67.0) Operating Margin % 1.5% -15.5% -11.6% -13.6% Other Expense / (Income) 36.2 (10.5) 25.7 Profit / (Loss) Before Tax (82.8) (9.9) (92.7) Income Taxes/(Benefit) 13.6 (70.4) (56.8) Equity in Earnings (Loss) of JVs/Noncontrolling Interest (6.5) - (6.5) Net Income (Loss) (102.9) 60.5 (42.4) Diluted Earnings (Loss) per Share (0.45)$ 0.26$ (0.19)$

Period Comparisons 6 Revenue Q/Q growth driven by higher semiconductor and solar volume Y/Y decline driven by 98 MW of European projects sold in 2Q’12 which were expected in 4Q’11 Gross Margin Semiconductor Materials improved Q/Q with volume and operational efficiencies Solar Energy low due to project mix and lower downstream volume driving lower upstream utilization 2Q’12 included $25 million related to contract amendment with Tainergy Operating Expense Opex higher Q/Q to support 2H’13 and 2014 ramp in solar project deliveries 2Q 2013 1Q 2013 2Q 2012 ($ Millions, except per share) Non-GAAP Non-GAAP $ Variance % Variance Non-GAAP $ Variance % Variance Net Sales 491.6$ 431.3$ 60.3$ 14% 933.4$ (441.8)$ -47% Gross Profit 28.8 41.8 (13.0) -31% 140.2 (111.4) -79% Gross Margin % 5.9% 9.7% 15.0% Operating Expenses 95.8 83.2 12.6 15% 105.7 (9.9) -9% Operating Income (Loss) (67.0) (41.4) (25.6) -62% 34.5 (101.5) -294% Operating Margin % -13.6% -9.6% 3.7% Net Income (Loss) (42.4) (35.5) (6.9) -19% 17.0 (59.4) -349% Diluted Earnings (Loss) per Share (0.19)$ (0.16)$ (0.03)$ -20% 0.08$ (0.27)$ -336% vs. Prior Quarter vs. Prior Year Note: Unaudited. See non-GAAP to GAAP reconciliation included in our earnings press release filed on Form 8-K dated 8/7/2013

Revenue ($ Millions) Operating Profit ($ Millions) Sequential up $9M, or 4% 6% higher volume, 2% lower ASP, driven mostly by large diameter YOY up $6M, or 3% 11% higher volume and 7% lower ASP, driven mostly by 300mm Sequential up $2M Higher sales volume and ongoing operational improvements YOY up $8M Despite 7% lower ASP, OM% up due to volume growth and ongoing operational improvements (12.5) (4.3) 8.7 3.1 1.4 3.6 -20 0 20 Q1 Q2 Q3 Q4 Q1 Q2 2012 2013 Semiconductor Materials 7 Focused on Operational Excellence & Cost Reduction Note: Unaudited 216.0 232.7 240.3 228.5 229.8 239.0 0 100 200 300 Q1 Q2 Q3 Q4 Q1 Q2 2012 2013

Revenue ($ Millions) Operating Profit ($ Millions) Sequential up $51M, or 25% Higher solar project MW and materials sales MW constrained by decision last year to slow development spending YOY down $448M, or 64% 2Q’12 included 98 MW of European projects Unfavorable project mix in 2Q’13 included 14 MW of EPC projects with lower ASP Sequential down $27M 1Q’13 included $25 million from contract settlement from Tainergy Higher OpEx to support MW growth, underutilization in solar upstream operations due to low solar downstream project volume YOY down $107M Lower MW volume due to 98 MW originally expected in 4Q’11 (21.3) 61.5 6.8 64.4 (18.7) (45.6) -40 0 40 80 120 Q1 Q2 Q3 Q4 Q1 Q2 2012 2013 Solar Energy (Non-GAAP) 8 Non-GAAP Adjusted Non-GAAP Adjusted (net restructuring & Conergy benefit) Adjusted (net restructuring) Results as Expected; Preparing for 2H Ramp 77.5 102.1 76.0 307.8 7 0.7 468.6 475.8 201.5 252.6 0 350 700 Q1 Q2 Q3 Q4 Q1 Q2 2012 2013 Note: Unaudited. See non-GAAP to GAAP reconciliation included in our earnings press release filed on Form 8-K dated 8/7/2013

Solar Project Activity Pipeline by Region Pipeline by Size 2.9 GWdc Pipeline Up 218 MW from 1Q’13 51 MWdc recognized for non-GAAP revenue Includes 39 MW of previously interconnected or POC projects 22 MWdc interconnected in 2Q’13 Predominantly projects in Southern Asia and North America Solar Project Pipeline & Installations 9 US 48% EMEA & LA 25% Emerging Markets 15% Canada 12% 10 ≤ MW <50 31% 1 ≤ MW <10 12% MW≥100 23% MW <1 7% 50 ≤ MW <100 27% MWdc Note: Unaudited 20 30 85 161 149 87 47 106 41 22 105 160 330 255 147 104 117 73 135 200 55 28 82 109 49 169 74 91 45 51 - 100 200 300 400 Q1 Q2 Q3 Q4 Q1 Q2 Q3 Q4 Q1 Q2 2011 2012 2013 Interconnected Under Construction Sold

1.0 GW Backlog 2.9 GW Pipeline/Backlog Solar Project Backlog 10 Pipeline: A project with a signed or awarded PPA or other energy off-take agreement or has achieved each of the following three items: site control, an identified interconnection point with interconnection cost estimate, and executed energy off-take agreement or the determination that there is a reasonable likelihood that an energy off-take agreement will be signed. Backlog: A project with an executed PPA or other energy off-take agreement, such as a FiT. Pipeline 64% Backlog 29% 200 MWdc (7%) Under Construction USA 53% Canada 17% North America Projects 16 (331 MWdc) US utility 448 (218 MWdc) US DG 18 (178 MWdc) Canada Emerging 17% EMEA 13% dc dc Backlog up 119 MW Q/Q • Additions in South Africa and U.S. Backlog is 36% of Pipeline • All backlog projects have signed PPA or FiT • Most expected to be completed in the next 24 months Expected backlog gross margin • $0.75/W - $0.80/W • 90%-95% average success rate Note: Unaudited

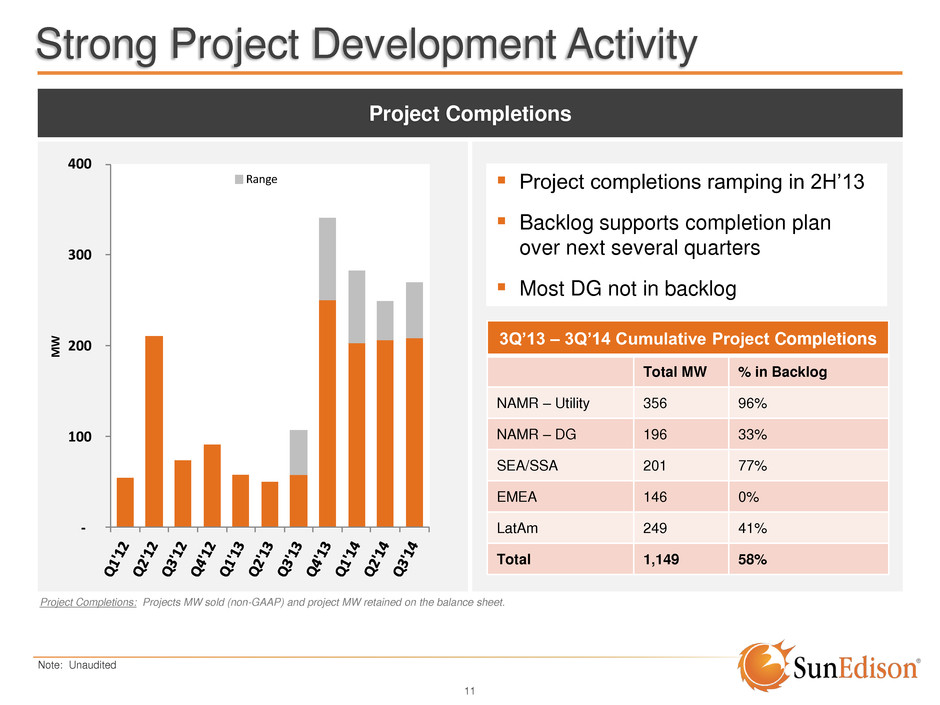
Strong Project Development Activity 11 Project Completions: Projects MW sold (non-GAAP) and project MW retained on the balance sheet. Project Completions Project completions ramping in 2H’13 Backlog supports completion plan over next several quarters Most DG not in backlog 3Q’13 – 3Q’14 Cumulative Project Completions Total MW % in Backlog NAMR – Utility 356 96% NAMR – DG 196 33% SEA/SSA 201 77% EMEA 146 0% LatAm 249 41% Total 1,149 58% Note: Unaudited - 100 200 300 400 M W Range

North American Distributed Generation Flow Business Model – The Case for DG 12 Note: Unaudited DG ramping first in North America and then globally • DG higher ASP & margin DG Benefits: • Increase diversification • Improve working capital management • Reduce Q/Q volatility and cycle time • Less dependence on backlog Energy / O&M • Higher margin • More predictable timing Flow Business Revenue consists of Revenue from Distributed Generation (DG), Energy, Operations & Maintenance (O&M) and Other Services 0 20 40 60 80 100 120 140 160 2011 2012 2013E 2014E M W Range

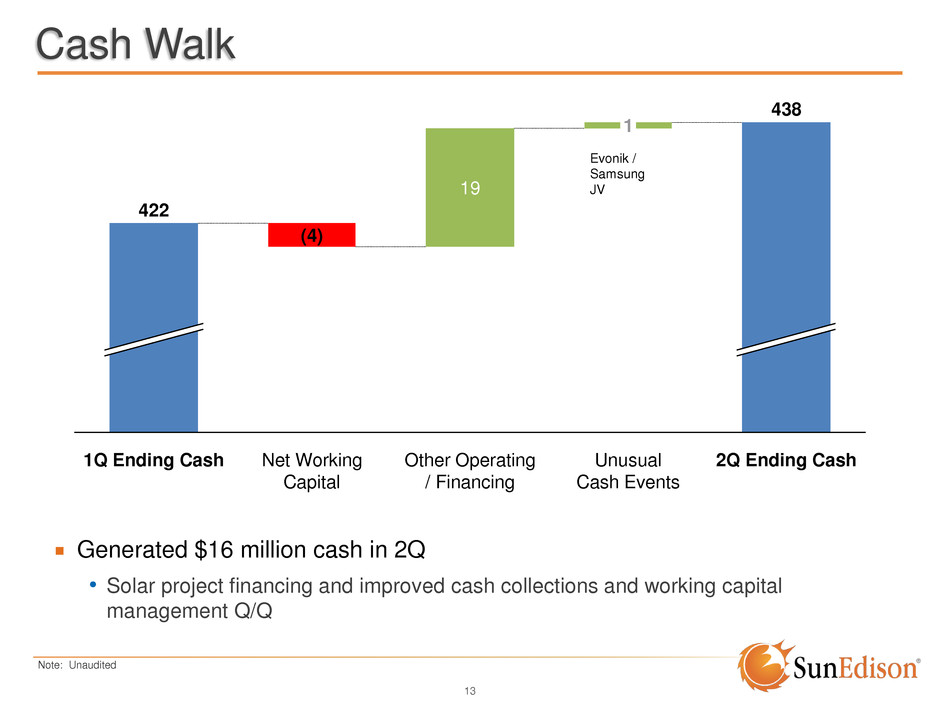
Cash Walk 13 Generated $16 million cash in 2Q • Solar project financing and improved cash collections and working capital management Q/Q 2Q Ending Cash 438 Unusual Cash Events 1 Other Operating / Financing 19 Net Working Capital (4) 1Q Ending Cash 422 Evonik / Samsung JV Note: Unaudited

414 1,454 817 438 1,799 Balance Sheet & Liquidity 14 ($ Millions) Assets Liabilities/ Equity Cash Non- recourse debt LT debt Equity Solar energy systems (PP&E) $628 million in liquidity • $438 million cash/cash equivalents • $190 million unused corporate revolver Non-recourse debt: • Excluded from leverage calculations in covenants • Supported by solar energy systems (including lease obligations) No significant debt maturities until 2017 Note: Unaudited

3Q 2013 Outlook 15 Semiconductor Materials: Expecting revenue growth on higher volume and stable ASP Solar Energy: Expecting lower 3Q MW sold due to project timing; pricing flat to higher Cash: Expecting cash similar to 1Q 2012 levels due to FRV earn-out and lower Solar MW Key Metrics 3Q 2013 Outlook Comments Semiconductor Materials Revenue ($ mil) $230 to $250 Flat pricing Q/Q Solar Energy Systems MW Sold (Non-GAAP) 60 to 100 Majority fully developed projects Solar Energy Systems MW Retained on Balance Sheet 0 to 10 Fully-Developed Solar Energy Systems Avg. Price ($/Wdc) $3.25 to $3.50 Excludes EPC projects Highly influenced by size and geographic mix Capex ($ mil) $30 to $40 F cused on Semiconductor Materials

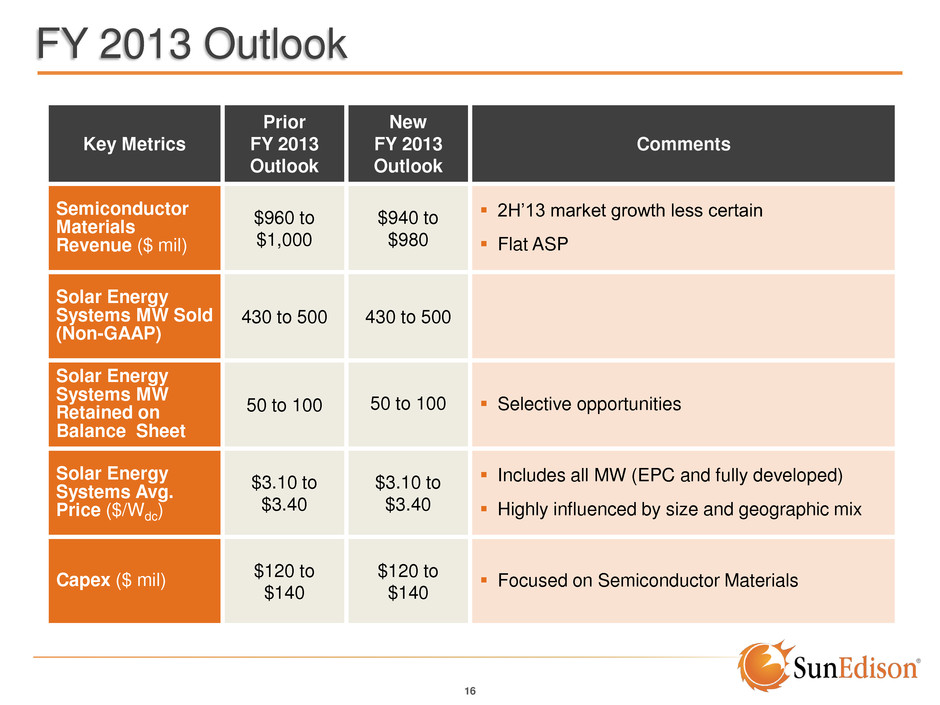
FY 2013 Outlook 16 Semiconductor Materials: Expecting revenue growth on higher volume and stable ASP Solar Energy: Expecting lower 3Q MW sold due to project timing; pricing flat to higher Cash: Expecting cash similar to 1Q 2012 levels due to FRV earn-out and lower Solar MW Key Metrics Prior FY 2013 Outlook New FY 2013 Outlook Comments Semiconductor Materials Revenue ($ mil) $960 to $1,000 $940 to $980 2H’13 market growth less certain Flat ASP Solar Energy Systems MW Sold (Non-GAAP) 430 to 500 430 to 500 Solar Energy Systems MW Retained on Balance Sheet 50 to 100 50 to 100 Selective opportunities Solar Energy Systems Avg. Price ($/Wdc) $3.10 to $3.40 $3.10 to $3.40 Includes all MW (EPC and fully developed) Highly influenced by size and geographic mix Capex ($ mil) $120 to $140 $120 to $140 F cused on Semiconductor Materials

Appendix

Segment Cash Flow 18 *2011 metrics are un-adjusted Note: Unaudited ($ Millions) Semiconductor Materials Solar Energy Corporate SunEdison For the Quarter ended June 30, 2013 Net Income 3.6$ (46.5)$ (53.5)$ (96.4)$ Depreciation & Amortization 30.6 28.4 2.0 61.0 Stock Compensation 1.1 0.2 5.4 6.7 Accounts Receivable 15.1 30.3 - 45.4 Inventory/Solar Energy Systems (3.7) (103.3) - (107.0) Accounts Payable 3.1 54.7 - 57.8 Deferred Revenue - 27.8 - 27.8 Other Operating (4.4) (54.7) (21.9) (81.0) Taxes, net - - (0.7) (0.7) Operating Cash Flow 45.4 (63.1) (68.7) (86.4) Capital Expenditures (23.7) (13.6) (1.5) (38.8) Construction of Solar Energy Systems - (75.1) - (75.1) Financing & Capital Lease Obligations, net - 193.3 - 193.3 Return of Investment to Noncontrolling Interest - 11.4 - 11.4 Free Cash Flow (Non-GAAP) 21.7 52.9 (70.2) 4.4 Restricted Cash & Other (2.0) 12.4 1.6 12.0 Total Cash Flow 19.7$ 65.3$ (68.6)$ 16.4$ Because certain sites include operations, facilities and/or back office functions that are utilized to support our Semiconductor Materials and Solar Energy businesses, we do not have discrete financial information for certain assets. Accordingly, our segment cash flow includes certain estimates and allocations and is therefore non-gaap. In addition to other key performance indicators, we evaluate the performance of the solar project business on the cash generation abilities of the projects which is best reflected in Free Cash Flow. Projects are typically financed at the inception of a lease, resulting in a gain on sale that is deferred and not immediately included in net income (loss). For direct sales, we sometimes finance these projects prior to sale in which our customers assume the debt upon sale. For our GAAP financial statements, debt proceeds are recorded as financing activities while costs to construct the solar energy systems are reflected as operating outflows.

Forward-Looking Statements 19 Certain matters discussed in this presentation and on the conference call are forward-looking statements, including the expected project completion MW quantities for the remainder of 2013 and 2014, the expected completion timeline for projects in our backlog, and that for the third quarter of 2013, the company expects Semiconductor Materials revenue to be between $230 million and $250 million, solar energy systems total non-GAAP sales volume to be in the range of 60 MW to 100 MW, solar energy systems MW retained on the balance sheet to be between 0 MW and 10 MW, fully developed solar energy systems average project pricing to be between $3.25/watt and $3.50/watt, and capital spending to be between $30 million and $40 million; that for the 2013 full year, the company expects Semiconductor Materials revenue to be between $940 million and $980 million, solar energy systems total non-GAAP sales volume to be in the range of 430 MW to 500 MW, solar energy systems MW retained on the balance sheet to be between 50 MW and 100 MW, total solar energy systems average project pricing to be between $3.10/watt and $3.40/watt, and capital spending to be between $120 million and $140 million. Such statements involve certain risks and uncertainties that could cause actual results to differ materially from those in the forward-looking statements. Potential risks and uncertainties include concentrated project development risks related to large scale solar projects; the availability of attractive project finance and other capital for SunEdison projects; market demand for our products and services; changes in the pricing environment for silicon wafers and polysilicon, as well as solar power systems; the availability and size of government and economic incentives to adopt solar power, including tax policy and credits and renewable portfolio standards; the ability to effectuate and realize the savings from the restructuring plan; our ability to maintain adequate liquidity and compliance with our debt covenants; the need to impair long lived assets or other intangible assets due to changes in the carrying value or realizability of such assets; the effect of any antidumping or countervailing duties imposed on photovoltaic cells and/or modules in connection with any trade complaints in the United States, Europe or elsewhere; the result of any Chinese government investigations of unfair trade practices in connection with polysilicon exported from the United States or South Korea into China; changes to accounting interpretations or accounting rules; existing or new regulations and policies governing the electric utility industry; our ability to convert SunEdison pipeline into completed projects in accordance with our current expectations; dependence on single and limited source suppliers; utilization of our manufacturing volume and capacity; the terms of any potential future amendments to or terminations of our long-term agreements with our solar wafer customers or any of our suppliers; general economic conditions, including interest rates; the ability of our customers to pay their debts as they become due; changes in the composition of worldwide taxable income and applicable tax laws and regulations, including our ability to utilize any net operating losses; failure of third-party subcontractors to construct and install our solar energy systems; quarterly fluctuations in our SunEdison business; the impact of competitive products and technologies; inventory levels of our customers; supply chain difficulties or problems; interruption of production; outcome of pending and future litigation matters; good working order of our manufacturing facilities; our ability to reduce manufacturing and operating costs; assumptions underlying management's financial estimates; actions by competitors, customers and suppliers; changes in the retail industry; damage to our brand; acquisitions of pipeline in our Solar Energy segment; changes in product specifications and manufacturing processes; changes in financial market conditions; changes in foreign economic and political conditions; changes in technology; changes in currency exchange rates and other risks described in the company’s filings with the Securities and Exchange Commission. These forward-looking statements represent the company’s judgment as of the date of this press release. The company disclaims, however, any intent or obligation to update these forward-looking statements.

