Attached files
| file | filename |
|---|---|
| 8-K - 2Q'13 RESULTS AND SLIDES COVER - Frontier Communications Parent, Inc. | results2q138k.htm |
| EX-99.1 - 2Q'13 PRESS RELEASE/ANALYST SCHEDULES - Frontier Communications Parent, Inc. | prandanalsched.htm |

Investor Update Second Quarter 2013 August 7, 2013

Safe Harbor Statement Forward-Looking Language This document contains forward-looking statements that are subject to risks and uncertainties that could cause actual results to differ materially from those expressed or implied in the financial statements. Statements that are not historical facts are forward-looking statements made pursuant to the safe harbor provisions of The Private Securities Litigation Reform Act of 1995. Words such as “believe,” “anticipate,” “expect” and similar expressions are intended to identify forward-looking statements. Forward-looking statements (including oral representations) are only predictions or statements of current plans, which we review continuously. Forward-looking statements may differ from actual future results due to, but not limited to, and our future results may be materially affected by, potential risks or uncertainties. You should understand that it is not possible to predict or identify all potential risks or uncertainties. We note the following as a partial list: the effects of greater than anticipated competition which could require us to implement new pricing, marketing strategies or new product or service offerings and the risk that we will not respond on a timely or profitable basis; reductions in the number of our voice customers that we cannot offset with increases in broadband subscribers and sales of other products and services; the effects of competition from cable, wireless and other wireline carriers; our ability to maintain relationships with customers, employees or suppliers; the effects of ongoing changes in the regulation of the communications industry as a result of federal and state legislation and regulation, or changes in the enforcement or interpretation of such legislation and regulation; the effects of any unfavorable outcome with respect to any current or future legal, governmental or regulatory proceedings, audits or disputes; the effects of changes in the availability of federal and state universal service funding or other subsidies to us and our competitors; our ability to adjust successfully to changes in the communications industry and to implement strategies for growth; continued reductions in switched access revenues as a result of regulation, competition or technology substitutions; our ability to effectively manage service quality in our territories and meet mandated service quality metrics; our ability to successfully introduce new product offerings, including our ability to offer bundled service packages on terms that are both profitable to us and attractive to customers; the effects of changes in accounting policies or practices adopted voluntarily or as required by generally accepted accounting principles or regulations; our ability to effectively manage our operations, operating expenses and capital expenditures, and to repay, reduce or refinance our debt; the effects of changes in both general and local economic conditions on the markets that we serve, which can affect demand for our products and services, customer purchasing decisions, collectability of revenues and required levels of capital expenditures related to new construction of residences and businesses; the effects of technological changes and competition on our capital expenditures, products and service offerings, including the lack of assurance that our network improvements in speed and capacity will be sufficient to meet or exceed the capabilities and quality of competing networks; the effects of increased medical, pension and postemployment expenses, such as retiree medical and severance costs, and related funding requirements; the effects of changes in income tax rates, tax laws, regulations or rulings, or federal or state tax assessments; our ability to successfully renegotiate union contracts in 2013 and thereafter; changes in pension plan assumptions and/or the value of our pension plan assets, which could require us to make increased contributions to the pension plan in 2014 and beyond; the effects of economic downturns, including customer bankruptcies and home foreclosures, which could result in difficulty in collection of revenues and loss of customers; adverse changes in the credit markets or in the ratings given to our debt securities by nationally accredited ratings organizations, which could limit or restrict the availability, or increase the cost, of financing; our cash flow from operations, amount of capital expenditures, debt service requirements, cash paid for income taxes and liquidity may affect our payment of dividends on our common shares; the effects of state regulatory cash management practices that could limit our ability to transfer cash among our subsidiaries or dividend funds up to the parent company; and the effects of severe weather events such as hurricanes, tornadoes, ice storms or other natural or man-made disasters. These and other uncertainties related to our business are described in greater detail in our filings with the Securities and Exchange Commission, including our reports on Forms 10-K and 10-Q, and the foregoing information should be read in conjunction with these filings. We undertake no obligation to publicly update or revise any forward-looking statements or to make any other forward-looking statement, whether as a result of new information, future events or otherwise unless required to do so by securities laws. *

The Company uses certain non-GAAP financial measures in evaluating its performance. These include non-GAAP adjusted net income attributable to common shareholders of Frontier, free cash flow, EBITDA or “operating cash flow,” which we define as operating income plus depreciation and amortization (“EBITDA”), and Adjusted EBITDA; a reconciliation of the differences between EBITDA and free cash flow and the most comparable financial measures calculated and presented in accordance with GAAP is included in the appendix. The non-GAAP financial measures are by definition not measures of financial performance under GAAP and are not alternatives to operating income or net income reflected in the statement of operations or to cash flow as reflected in the statement of cash flows and are not necessarily indicative of cash available to fund all cash flow needs. The non-GAAP financial measures used by the Company may not be comparable to similarly titled measures of other companies. The Company believes that the presentation of non-GAAP financial measures provides useful information to investors regarding the Company’s financial condition and results of operations because these measures, when used in conjunction with related GAAP financial measures, (i) together provide a more comprehensive view of the Company’s core operations and ability to generate cash flow, (ii) provide investors with the financial analytical framework upon which management bases financial, operational, compensation and planning decisions and, (iii) presents measurements that investors and rating agencies have indicated to management are useful to them in assessing the Company and its results of operations. In addition, the Company believes that free cash flow and EBITDA, as the Company defines them, can assist in comparing performance from period to period, without taking into account factors affecting cash flow reflected in the statement of cash flows, including changes in working capital and the timing of purchases and payments. The Company has shown adjustments to its financial presentations to exclude certain costs because investors have indicated to management that such adjustments are useful to them in assessing the Company and its results of operations. These adjustments are detailed in the Appendix for the reconciliation of free cash flow and operating cash flow. Management uses these non-GAAP financial measures to (i) assist in analyzing the Company’s underlying financial performance from period to period, (ii) evaluate the financial performance of its business units, (iii) analyze and evaluate strategic and operational decisions, (iv) establish criteria for compensation decisions, and (v) assist management in understanding the Company’s ability to generate cash flow and, as a result, to plan for future capital and operational decisions. Management uses these non-GAAP financial measures in conjunction with related GAAP financial measures. These non-GAAP financial measures have certain shortcomings. In particular, free cash flow does not represent the residual cash flow available for discretionary expenditures, since items such as debt repayments and dividends are not deducted in determining such measure. EBITDA has similar shortcomings as interest, income taxes, capital expenditures, debt repayments and dividends are not deducted in determining this measure. Management compensates for the shortcomings of these measures by utilizing them in conjunction with their comparable GAAP financial measures. The information in this document should be read in conjunction with the financial statements and footnotes contained in our documents filed with the U.S. Securities and Exchange Commission. Note: Unless noted otherwise, throughout this presentation all prior period Revenues and Adjusted EBITDA exclude Mohave Cellular Limited Partnership results, which was sold on April 1, 2013. Numbers are rounded and may not sum. Non-GAAP Financial Measures *

Strategic Overview Maggie Wilderotter, Chairman and CEO Operational Results Dan McCarthy, President and COO Financial Results John Jureller, EVP and CFO Earnings Call Agenda * Note: Unless noted otherwise, throughout this presentation all prior period Revenues and Adjusted EBITDA exclude Mohave Cellular Limited Partnership results, which was sold on April 1, 2013. Numbers are rounded and may not sum.

Strong revenue improvement quarter over quarter in both Residential and Business segments Net broadband additions of 29,511 – a record quarter! Net customer losses improved substantially Positive broad-based customer response to bundles and pricing Residential & Business momentum continues in July Local engagement strategy is delivering results Strategic and Operating Achievements Second Quarter Results *

Key Strategic and Operating Objectives Broadband market share growth Sequential increases in data and internet services revenue exceeded declines in voice services in Q2 New offerings for Business customers in Q3 * Drive Revenue Growth
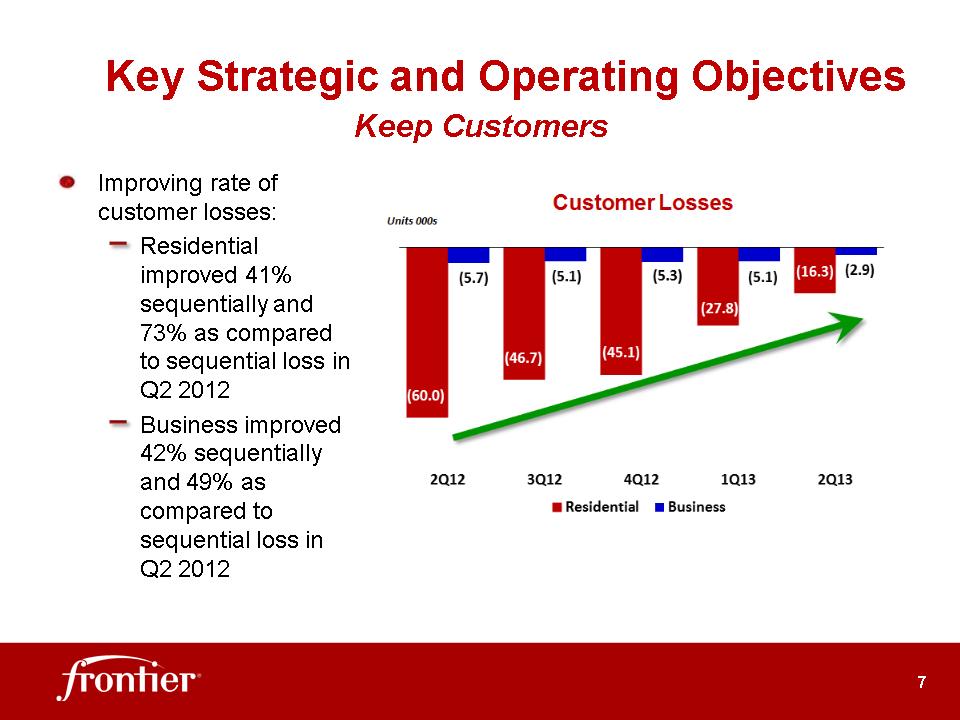
Key Strategic and Operating Objectives Improving rate of customer losses: Residential improved 41% sequentially and 73% as compared to sequential loss in Q2 2012 Business improved 42% sequentially and 49% as compared to sequential loss in Q2 2012 * Keep Customers
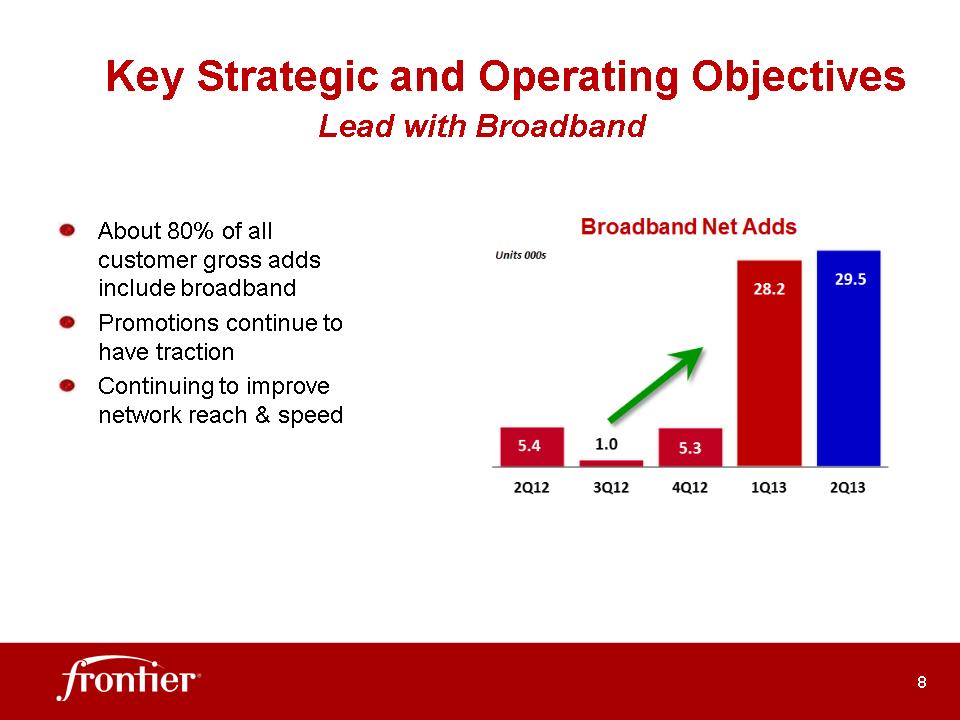
Key Strategic and Operating Objectives About 80% of all customer gross adds include broadband Promotions continue to have traction Continuing to improve network reach & speed * Lead with Broadband
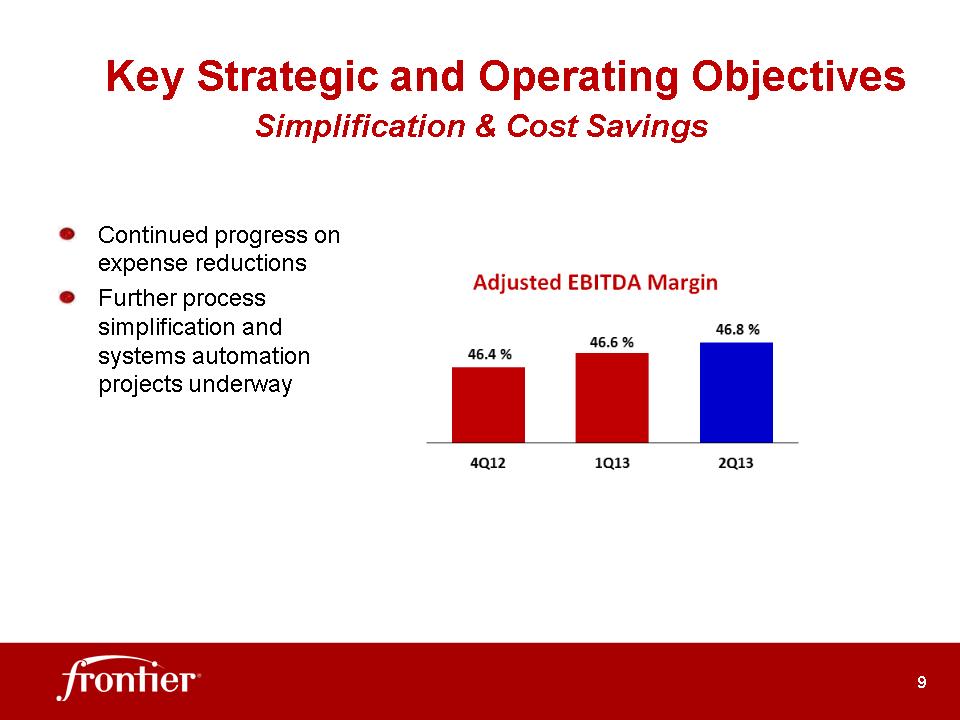
Key Strategic and Operating Objectives Continued progress on expense reductions Further process simplification and systems automation projects underway * Simplification & Cost Savings

Sequential increase in data revenue exceeded sequential declines in voice revenue for the first time in over 5 years Broadband unit growth and Residential customer losses improved due to Simply Broadband, network enhancements and improved customer service Frontier Secure offerings have broadened to include equipment insurance protection 30% of gross adds came through alternate channels Residential Operational Review *

Improved sequential retention performance from both SME and Carrier segments Continued progress with Gigabit Ethernet expansion and sales Alternate channel expansion, including distributors New small business bundles launched in early Q3 Business & Wholesale * Operational Review

Turned up over 50,000 new Broadband Households YTD 2013 Expect to complete 55,000 from Federal CAF subsidy by year-end Applying for up to $70 Million in Phase 2 CAF funding in Q3 Gigabit Ethernet availability expanded to 83% of Central Offices 20% of Broadband gross additions were above basic speed tier in Q2 WiFi expansion underway in all markets Substantial runway to drive higher Residential Broadband market share Large opportunity to upgrade customers to higher speed tiers for both Business and Residential Broadband Progress with Network * Operational Review

Network Roadmap * Aggressive migration to an all-IP, converged network Deploying robust, dynamic optical (ROADM) middle-mile transport network;11k miles completed; connected to 40Gbps Backbone Network Deploying Ethernet, ADSL2+ bonding and VDSL2 technology

Customer Revenue declined 0.3% sequentially Broadband unit improvement driving incremental revenue Business declined 0.4% sequentially and Residential declined 0.3% sequentially Revenues *
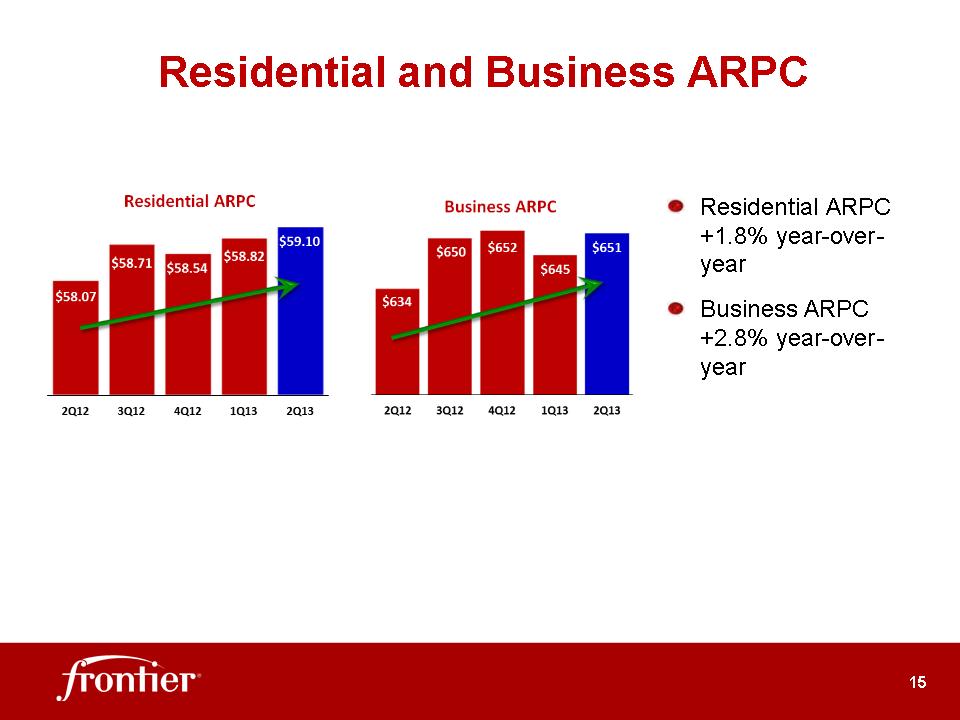
Residential ARPC +1.8% year-over-year Business ARPC +2.8% year-over-year Residential and Business ARPC *

Continued progress in reducing net cash operating expense in 2013 Cost Saving Reduction Initiative * Operating Expenses

Notes: (1) Includes Integration Expenses and Capital Expenditures Q2 and trailing four quarter cash flows remain strong 1H 2013 Dividend payout ratio was 52% Cash Flow / Dividend Payout *

Leverage (Net Debt / Adj EBITDA) for 2Q13 at 3.34x $1.32B of liquidity at the end of Q2 Notes: (1) Calculation excludes non-current restricted cash of $11.6 million. LTM Adj. EBITDA includes results of Mohave partnership. Credit and Liquidity *

$258 million current and $7.9 billion long-term debt outstanding $750 million Revolving Credit Facility completed on May 3rd: commitments extended to November 2016 Debt Profile *

Guidance Reaffirmed *

Appendix

Non-GAAP Reconciliation * Quarterly Revenue

Non-GAAP Reconciliation * Note: Operating cash flow, as adjusted, less Mohave partnership Adjusted EBITDA of $6 million, $7 million, $7 million and $4 million results in Adjusted EBITDA excluding the Mohave partnership of $614 million, $574 million, $567 million and $558 million for the three months ended June 30,2012, September 30, 2012, December 31, 2012 and March 31,2013, respectively.

* Frontier Communications Corp. (NASDAQ: FTR) Investor Relations Frontier Communications Corp. 3 High Ridge Park Stamford, CT 06905 203.614.4606 IR@FTR.com