Attached files
| file | filename |
|---|---|
| 8-K - 8-K - PANTRY INC | a06272013-form8xk.htm |
| EX-99.1 - EX-99.1 - PANTRY INC | a06272013-pressrelease.htm |

The Pantry, Inc. Fiscal Year 2013 Third Quarter Earnings Call Tuesday, August 6, 2013 Exhibit 99.2

Slide 2 Safe Harbor Statement Some of the statements in this presentation constitute “forward-looking statements” within the meaning of the Private Securities Litigation Reform Act of 1995. All statements other than those of historical facts included herein, including those related to the company’s financial outlook, goals, business strategy, projected plans and objectives of management for future operations and liquidity, are forward-looking statements. These forward-looking statements are based on the company’s plans and expectations and involve a number of risks and uncertainties that could cause actual results to vary materially from the results and events anticipated or implied by such forward-looking statements. Please refer to the company’s Annual Report on Form 10-K and its other filings with the SEC for a discussion of significant risk factors applicable to the company. In addition, the forward-looking statements included in this presentation are based on the company’s estimates and plans as of the date of this presentation. While the company may elect to update these forward-looking statements at some point in the future, it specifically disclaims any obligation to do so. In this presentation, we will refer to certain non-GAAP financial measures that we believe are helpful in understanding our financial performance. A reconciliation of each non-GAAP financial measure to the most directly comparable GAAP measure is included in the appendix of this presentation.

Third Quarter Business Overview Performance summary Merchandise category review Cost management/profitability improvement Store upgrades/Quick Service Restaurants (“QSR’s”)/promotions Slide 3

FY2013 Third Quarter Summary Diluted earnings per share of $0.26 versus $0.65 in Q3 2012 Adjusted EBITDA(1) of $65.3 million versus $74.7 million in Q3 2012 Comparable store merchandise revenue increased 1.3%; up 3.3% excluding cigarettes Customer traffic levels improved from the 4.6% decline versus prior year in Q2 to a decline of 1.2% in Q3 Merchandise sales per customer improved 2.5% on a comparable basis Comparable store retail fuel gallons sold decreased 4.4% Retail fuel margins declined $0.023 per gallon to $0.123 (1) See Appendix for a description of each non-GAAP financial measure as well as a reconciliation of each non-GAAP financial measure to the most directly comparable GAAP measure. Slide 4

Q3 FY2013 Merchandise Category Review Slide 5 Q1 Q2 Q3 YTD Cigarettes -2.8% -6.4% -3.3% -4.1% Other Packaged Goods 4.3% 0.2% 3.0% 2.5% Packaged Goods 1.6% -2.3% 0.7% 0.1% Proprietary Foodservice 8.6% 3.3% 6.9% 6.3% QSR -1.9% -5.9% -2.4% -3.4% Foodservice 4.2% -0.7% 3.0% 2.2% Services 12.0% 0.7% 9.2% 7.1% Total Comparable Store Merchandise Revenue 2.2% -2.0% 1.3% 0.5% Total Excluding Cigarettes 4.6% 0.1% 3.3% 2.7% FY13 Sales Comps

Focus On Managing Costs And Improving Profitability Fuel cost increases and retail price lags constrained third quarter retail margin per gallon Store level productivity initiatives continue – Labor costs – Improved employee training and development to drive productivity – Other store costs G&A cost controls – Optimize as sales levels and store portfolio change – Support growth initiatives Slide 6

Merchandising/Kangaroo Express Awareness Initiatives Boris Zelmanovich joined The Pantry as the Chief Merchandising Officer Store level merchandising initiatives shape the customer experience – Lifestyle and local merchandising continues to progress – Point of Purchase advertising – Promotions – “The RooCup” has met expectations with almost 500K cups sold and over seven million refills Third year of Salute Our Troops; raised $5.7 million over the last two years Victory Junction; recently raised over $1 million given during ceremony at Charlotte Motor Speedway Infield store at Charlotte Motor Speedway Slide 7

Driving Brand Exposure At Charlotte Motor Speedway Slide 8 Infield store is open for business during motor sport and special holiday events held at the racetrack
Other Key Activities Facilities: – Completed 31 remodels in the third quarter – Completed 3 new QSR’s in the third quarter – 41 remodels, 13 QSR’s, 3 new stores, 1 rebuild currently underway Acquired store in Conway, SC on 7/18/13 Continued focus on optimizing store portfolio – 140 stores closed FY11-FY13 New Charlotte store opened in February and is performing well Slide 9
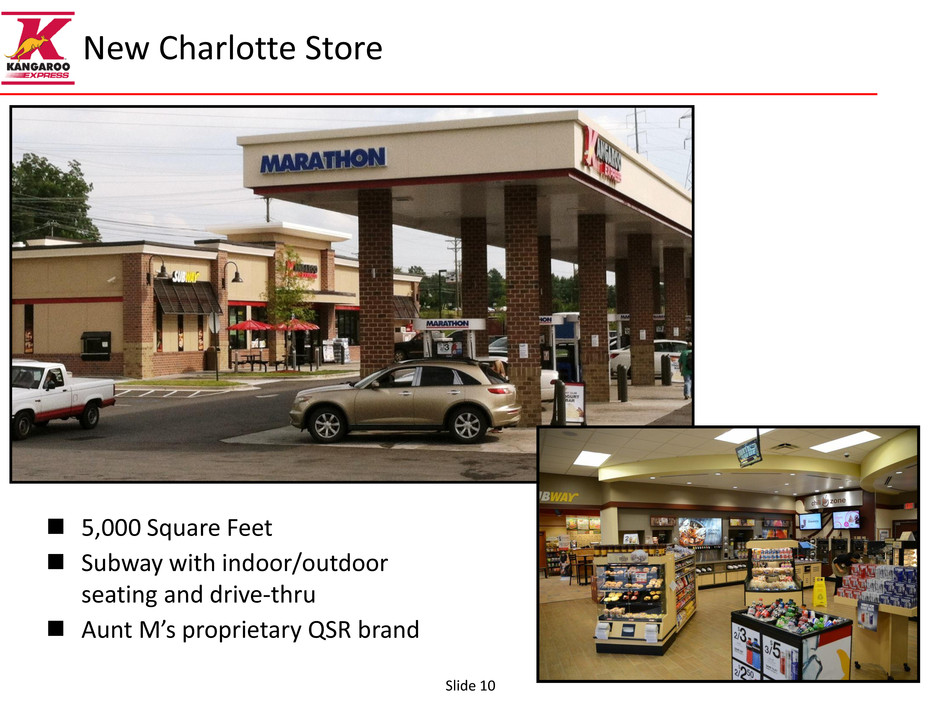
New Charlotte Store Slide 10 5,000 Square Feet Subway with indoor/outdoor seating and drive-thru Aunt M’s proprietary QSR brand

Third Quarter Financial Review Slide 11 Financial Summary Financial Details Capital Expenditures Store Count Capital Structure And Liquidity Fiscal 2013 Outlook

2012 2013 Percent Change Total revenues $ 2,137.1 $ 1,992.7 -6.8% Total costs and operating expenses (1) 2,094.0 1,957.6 -6.5% Income from operations $ 43.1 $ 35.1 -18.6% Loss on extinguishment of debt - - N/M Interest expense, net 19.7 22.0 11.7% Income before income taxes $ 23.4 $ 13.1 -44.0% Income tax expense 8.6 7.2 -16.3% Net Income $ 14.8 $ 5.9 -60.1% Net income per diluted share $ 0.65 $ 0.26 -60.0% Adjusted EBITDA $ 74.7 65.3$ -12.6% Third Quarter Third Quarter Financial Summary ($ millions except per share data) Slide 12 (1) Includes impairment charges of $1.8 million and $0.8 million in 2012 and 2013, respectively. (2) See Appendix for a description of each non-GAAP financial measure as well as a reconciliation of each non-GAAP financial measure to the most directly comparable GAAP measure. (1) (2)

Third Quarter Financial Details ($ millions) Slide 13 2012 2013 Percent Change Merchandise revenue $ 476.5 $ 476.6 0.0% Fuel revenue 1,660.6 1,516.1 -8.7% Total revenues $ 2,137.1 $ 1,992.7 -6.8% Merchandise cost of goods sold $ 316.8 $ 315.7 -0.3% Fuel cost of goods sold 1,593.6 1,462.2 -8.2% Store operating 126.9 123.3 -2.8% General and administrative 25.1 26.1 4.0% Impairment charges 1.8 0.8 -55.6% Depreciation and amortization 29.8 29.5 -1.0% Income from operations $ 43.1 $ 35.1 -18.6% Selected financial data: Comparable store merchandise sales % 3.6% 1.3% Weighted-average store count 1,605 1,567 Merchandise margin 33.5% 33.8% Comparable store retail fuel gallons % -3.6% -4.4% Retail fuel margin per gallon $ 0.146 $ 0.123 Third Quarter
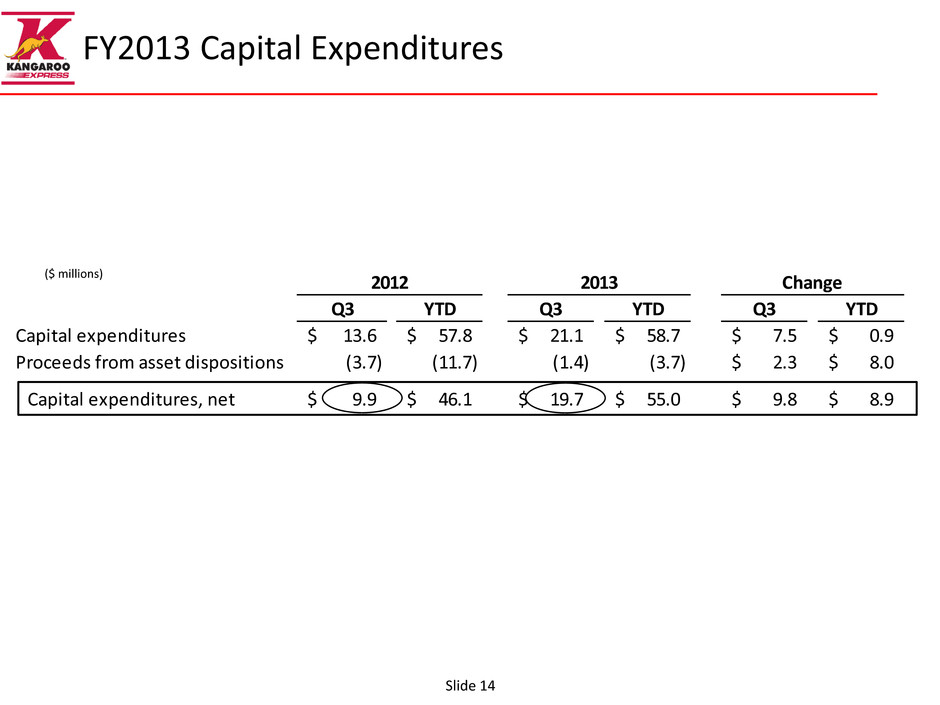
Q3 YTD Q3 YTD Q3 YTD Capital expenditures 13.6$ 57.8$ 21.1$ 58.7$ 7.5$ 0.9$ Proceeds from asset dispositions (3.7) (11.7) (1.4) (3.7) 2.3$ 8.0$ Capital expenditures, net 9.9$ 46.1$ 19.7$ 55.0$ 9.8$ 8.9$ 2012 2013 Change FY2013 Capital Expenditures ($ millions) Slide 14

Beginning Stores - Q1 FY2013 1,578 Rebuilt 1 Closed (7) Beginning Stores - Q2 FY2013 1,572 New 1 Acquired 1 Closed (6) Beginning Stores - Q3 FY2013 1,568 New 1 Closed (7) Ending Stores - Q3 FY2013 1,562 FY2013 Store Count Summary Slide 15
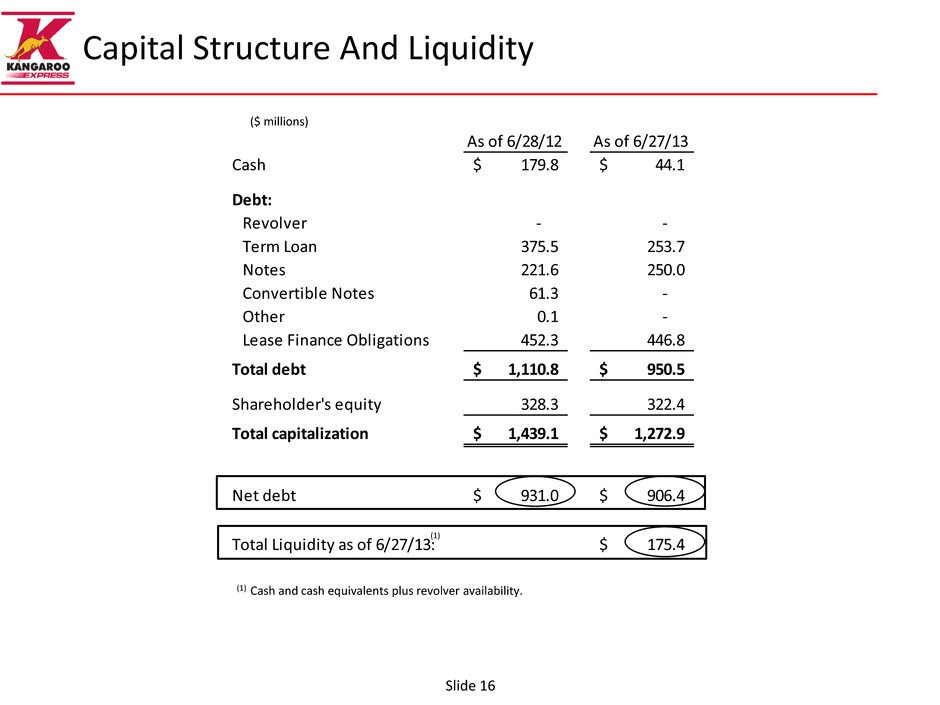
Capital Structure And Liquidity ($ millions) Slide 16 (1) Cash and cash equivalents plus revolver availability. (1) As of 6/28/12 As of 6/27/13 Cash 179.8$ 44.1$ Debt: Revolver - - Term Loan 375.5 253.7 Notes 221.6 250.0 Convertible Notes 61.3 - Other 0.1 - Lease Finance Obligations 452.3 446.8 Total debt 1,110.8$ 950.5$ Shareholder's equity 328.3 322.4 Total capitalization 1,439.1$ 1,272.9$ Net debt 931.0$ 906.4$ Total Liquidity as of 6/27/13: 175.4$
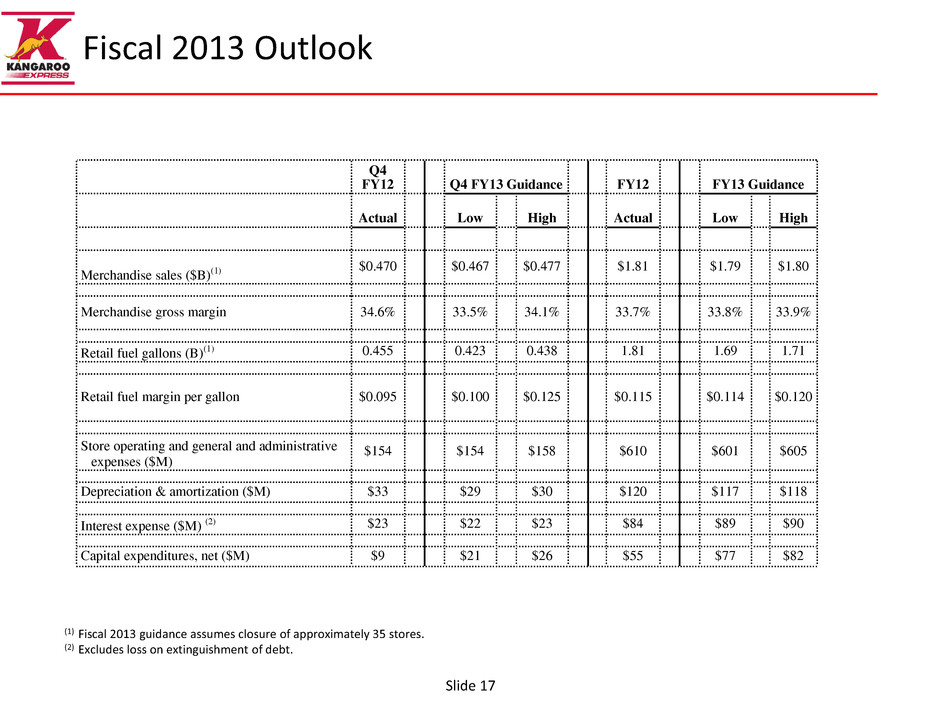
Fiscal 2013 Outlook Slide 17 (1) Fiscal 2013 guidance assumes closure of approximately 35 stores. (2) Excludes loss on extinguishment of debt. Q4 FY12 Q4 FY13 Guidance FY12 FY13 Guidance Actual Low High Actual Low High Merchandise sales ($B)(1) $0.470 $0.467 $0.477 $1.81 $1.79 $1.80 Merchandise gross margin 34.6% 33.5% 34.1% 33.7% 33.8% 33.9% Retail fuel gallons (B)(1) 0.455 0.423 0.438 1.81 1.69 1.71 Retail fuel margin per gallon $0.095 $0.100 $0.125 $0.115 $0.114 $0.120 Store operating and general and administrative expenses ($M) $154 $154 $158 $610 $601 $605 Depreciation & amortization ($M) $33 $29 $30 $120 $117 $118 Interest expense ($M) (2) $23 $22 $23 $84 $89 $90 Capital expenditures, net ($M) $9 $21 $26 $55 $77 $82

Slide 18

Appendix Slide 19 Selected financial data Use of Non-GAAP measures
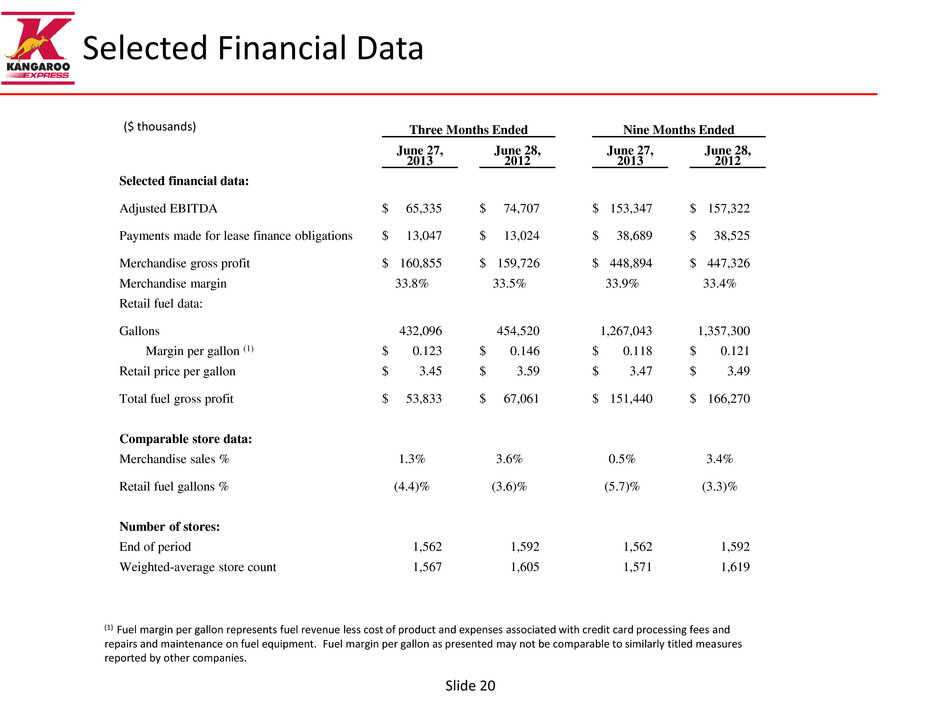
Selected Financial Data Slide 20 (1) Fuel margin per gallon represents fuel revenue less cost of product and expenses associated with credit card processing fees and repairs and maintenance on fuel equipment. Fuel margin per gallon as presented may not be comparable to similarly titled measures reported by other companies. ($ thousands) Three Months Ended Nine Months Ended June 27, 2013 June 28, 2012 June 27, 2013 June 28, 2012 Selected financial data: Adjusted EBITDA $ 65,335 $ 74,707 $ 153,347 $ 157,322 Payments made for lease finance obligations $ 13,047 $ 13,024 $ 38,689 $ 38,525 Merchandise gross profit $ 160,855 $ 159,726 $ 448,894 $ 447,326 Merchandise margin 33.8% 33.5% 33.9% 33.4% Retail fuel data: Gallons 432,096 454,520 1,267,043 1,357,300 Margin per gallon (1) $ 0.123 $ 0.146 $ 0.118 $ 0.121 Retail price per gallon $ 3.45 $ 3.59 $ 3.47 $ 3.49 Total fuel gross profit $ 53,833 $ 67,061 $ 151,440 $ 166,270 Comparable store data: Merchandise sales % 1.3% 3.6% 0.5% 3.4% Retail fuel gallons % (4.4)% (3.6)% (5.7)% (3.3)% Number of stores: End of period 1,562 1,592 1,562 1,592 Weighted-average store count 1,567 1,605 1,571 1,619

Use of Non-GAAP Measures Adjusted EBITDA Adjusted EBITDA is defined by the Company as net income (loss) before interest expense, net, gain/loss on extinguishment of debt, income taxes, impairment charges and depreciation and amortization. Adjusted EBITDA is not a measure of operating performance or liquidity under generally accepted accounting principles in the United States of America (“GAAP”) and should not be considered as a substitute for net income, cash flows from operating activities or other income or cash flow statement data. The Company has included information concerning Adjusted EBITDA because it believes investors find this information useful as a reflection of the resources available for strategic opportunities including, among others, to invest in the Company’s business, make strategic acquisitions and to service debt. Management also uses Adjusted EBITDA to review the performance of the Company's business directly resulting from its retail operations and for budgeting and compensation targets. Adjusted EBITDA does not include impairment of long-lived assets and other charges. The Company excluded the effect of impairment losses because it believes that including them in Adjusted EBITDA is not consistent with reflecting the ongoing performance of its remaining assets. Adjusted EBITDA does not include gain/loss on extinguishment of debt because it represents financing activities and is not indicative of the ongoing performance of the Company’s remaining stores. Slide 21

Additional Information Regarding Non-GAAP Measures Any measure that excludes interest expense, gain/loss on extinguishment of debt, depreciation and amortization, impairment charges, or income taxes has material limitations because the Company uses debt and lease financing in order to finance its operations and acquisitions, uses capital and intangible assets in its business and must pay income taxes as a necessary element of its operations. Due to these limitations, the Company uses non-GAAP measures in addition to and in conjunction with results and cash flows presented in accordance with GAAP. The Company strongly encourages investors to review its consolidated financial statements and publicly filed reports in their entirety and not to rely on any single financial measure. Slide 22
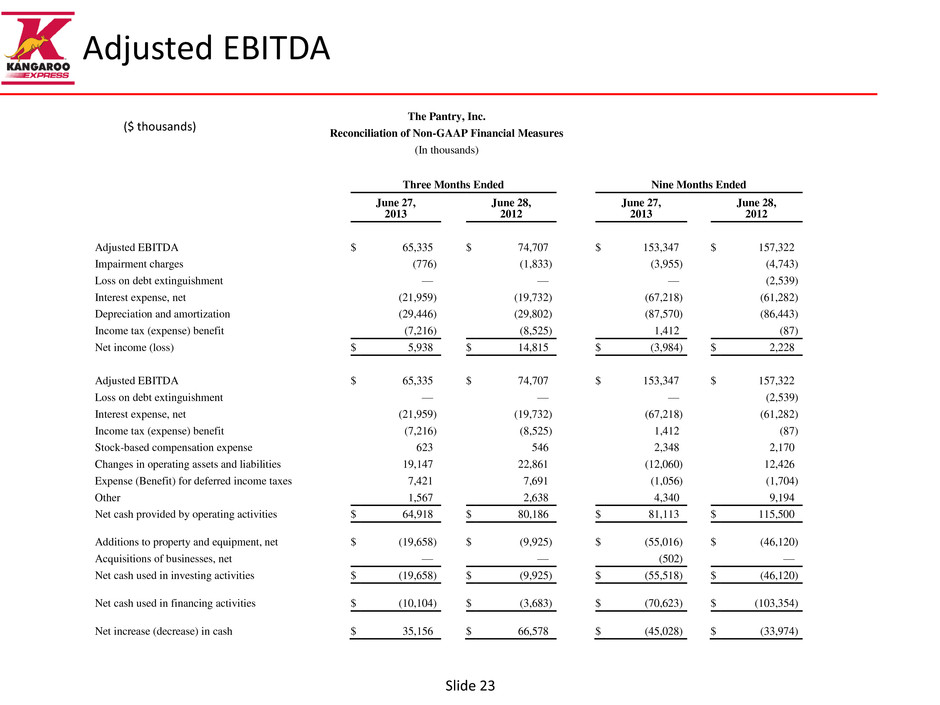
Adjusted EBITDA Slide 23 ($ thousands) The Pantry, Inc. Reconciliation of Non-GAAP Financial Measures (In thousands) Three Months Ended Nine Months Ended June 27, 2013 June 28, 2012 June 27, 2013 June 28, 2012 Adjusted EBITDA $ 65,335 $ 74,707 $ 153,347 $ 157,322 Impairment charges (776 ) (1,833 ) (3,955 ) (4,743 ) Loss on debt extinguishment — — — (2,539 ) Interest expense, net (21,959 ) (19,732 ) (67,218 ) (61,282 ) Depreciation and amortization (29,446 ) (29,802 ) (87,570 ) (86,443 ) Income tax (expense) benefit (7,216 ) (8,525 ) 1,412 (87 ) Net income (loss) $ 5,938 $ 14,815 $ (3,984 ) $ 2,228 Adjusted EBITDA $ 65,335 $ 74,707 $ 153,347 $ 157,322 Loss on debt extinguishment — — — (2,539 ) Interest expense, net (21,959 ) (19,732 ) (67,218 ) (61,282 ) Income tax (expense) benefit (7,216 ) (8,525 ) 1,412 (87 ) Stock-based compensation expense 623 546 2,348 2,170 Changes in operating assets and liabilities 19,147 22,861 (12,060 ) 12,426 Expense (Benefit) for deferred income taxes 7,421 7,691 (1,056 ) (1,704 ) Other 1,567 2,638 4,340 9,194 Net cash provided by operating activities $ 64,918 $ 80,186 $ 81,113 $ 115,500 Additions to property and equipment, net $ (19,658 ) $ (9,925 ) $ (55,016 ) $ (46,120 ) Acquisitions of businesses, net — — (502 ) — Net cash used in investing activities $ (19,658 ) $ (9,925 ) $ (55,518 ) $ (46,120 ) Net cash used in financing activities $ (10,104 ) $ (3,683 ) $ (70,623 ) $ (103,354 ) Net increase (decrease) in cash $ 35,156 $ 66,578 $ (45,028 ) $ (33,974 )
