Attached files
| file | filename |
|---|---|
| 8-K - FORM 8-K - ENDEAVOUR INTERNATIONAL CORP | d580729d8k.htm |
| EX-99.1 - EX-99.1 - ENDEAVOUR INTERNATIONAL CORP | d580729dex991.htm |
 Second Quarter 2013
Earnings Review
August 6, 2013
Exhibit 99.2 |
 2
This presentation contains certain forward-looking statements regarding
various oil and gas discoveries, oil and gas exploration, development and
production activities, anticipated and potential production and flow rates;
anticipated revenues; the economic potential of properties and estimated exploration costs.
Accuracy of the projections depends on assumptions about events that change over
time and is thus susceptible to periodic change based on actual experience
and new developments. Endeavour cautions readers that it assumes no
obligation to update or publicly release any revisions to the projections in this
presentation and, except to the extent required by applicable law, does not intend
to update or otherwise revise the projections. Important factors that might
cause future results to differ from these projections include: variations
in the market prices of oil and natural gas; drilling results; access to
equipment and oilfield services; unanticipated fluctuations in flow rates
of producing wells related to mechanical, reservoir or facilities
performance; oil and natural gas reserves expectations; the ability to satisfy future cash
obligations
and
environmental
costs;
and
general
exploration
and
development
risks
and
hazards.
The Securities and Exchange Commission permits oil and gas companies in their
filings with the SEC to disclose only proved reserves that a company has
demonstrated by actual production or conclusive
formation tests to be economically and legally producible under existing economic
and operating conditions. SEC guidelines prohibit the use in filings of
terms such as “probable,” “possible,”
P2 or P3 and
“non-proved”
reserves, reserves “potential”
or “upside”
or other descriptions of volumes of reserves
potentially recoverable through additional drilling or recovery techniques.
These estimates are by their nature more speculative than estimates of
proved reserves and accordingly are subject to greater risk of being
actually realized by the company. Certain statements should be regarded as “forward-looking”
statements within the meaning of the securities laws. These statements speak only
as of the date made. Such statements are subject to assumptions, risk and
uncertainty. Actual results or events may vary materially. The
estimates of recoverable resources per well and completed well costs included herein are
based upon other typical results in these shale plays and may not be indicative of
actual results. |
 3
2013 Second Quarter –
Financial/Operational Results
Sales Volumes and Physical Production
•
Q2 sales volumes averaged 14,497 barrels of oil equivalent per day
(“boepd”) •
Volumes for the quarter were impacted by two liftings at the Alba field during the
period •
Physical production for Q2 averaged 9,498 boepd compared to 9,385 boepd during
Q1 •
The well flowed at 9,600 barrels of oil per day (“bopd”) gross and the
performance from all three wells was 17,600 bopd gross
•
The well was completed ahead of schedule and under cost estimates
•
The total MPP outstanding is $125 million
The West Rochelle well (W-1) has been completed and is expected on-line in
September 2013 following routine maintenance work on the Scott Platform
The E-2 well at East Rochelle commenced drilling on July 25
th
and is expected on-
line in Q4 2013
At Bacchus, the third production well (B-1) was completed and is
on-line The Forward Sale commitment was fulfilled during the quarter
In May, the Company completed the sale of an additional $17.5 million expansion to
the Monetary Production Payment (MPP) |
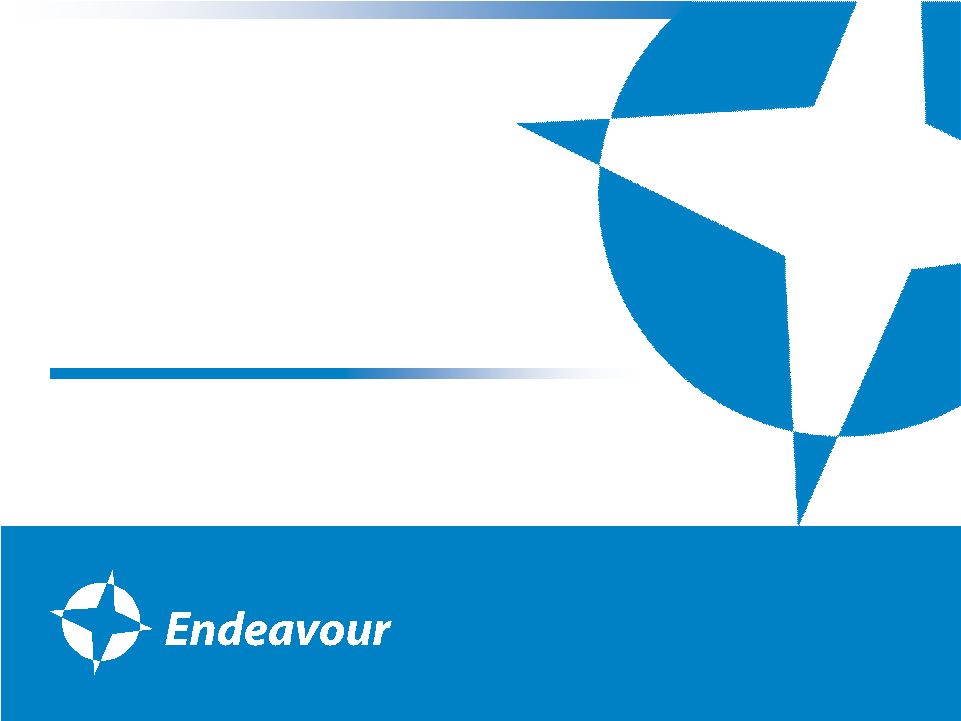
 45%
54%
91%
9%
4
Production Volumes (BOE per day)
2013
Q2 Sales = 14,497
Physical
production
volume
for
the
second
quarter
averaged
9,498
boepd
vs.
9,385
boepd
for
Q1
Second quarter realized prices
•
Oil and condensate price = $102.67 per barrel
•
Gas price = $3.50 per Mcf
2012
Q2 Sales = 4,677
US Gas
US Oil UK Oil
UK Gas |
  5
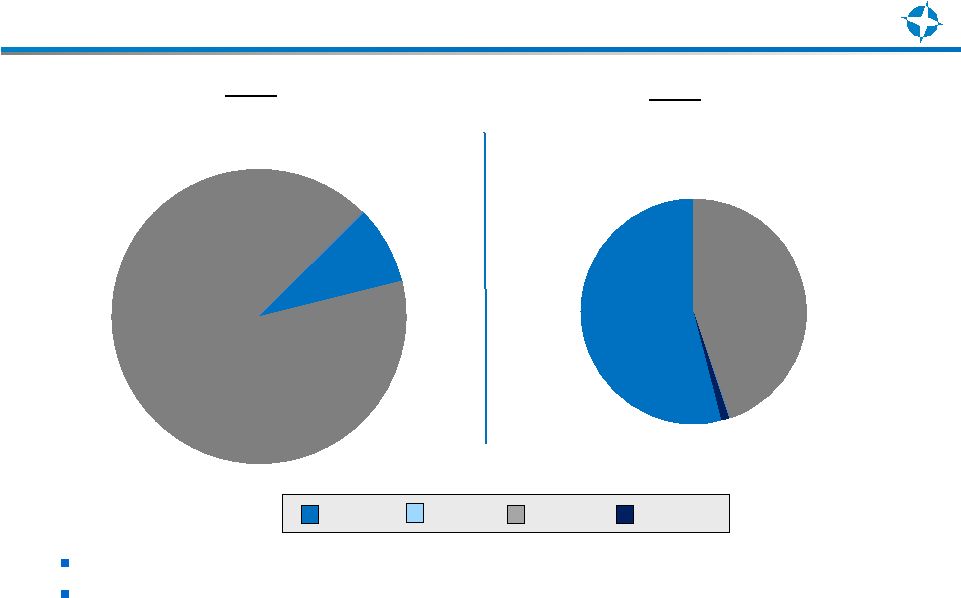
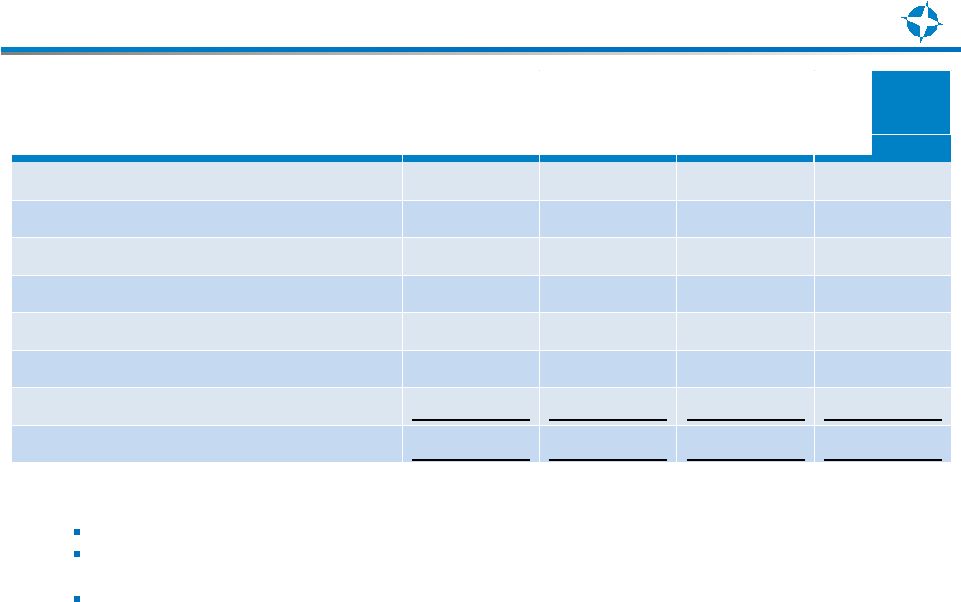
Summary Financial Results
Revenues increased year-over-year due to the increased working interest at
Alba and two wells on production at the Bacchus development
Quarter-over-quarter revenues (Q1 $57.7 million)
were up due to two liftings during the quarter compared to one lifting in
the first quarter Measure
($ in millions, except per share data)
2013
2012
2013
2012
Oil and Gas Revenues
126.2
$
23.0
$
183.8
$
38.2
$
Operating Expenses
38.1
$
5.7
$
55.6
$
10.6
$
Adjusted cash flow from Operations
88.1
$
17.3
$
128.2
$
27.6
$
Second Quarter Ending
June 30,
Six Months Ending
June 30, |
     6
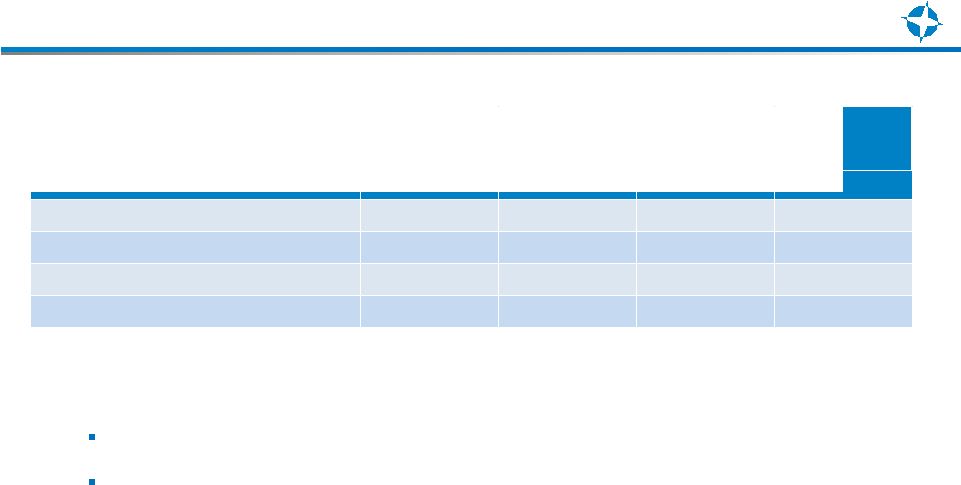
Key Business Metrics
OpEx expense during the quarter continues to be impacted by on-going
maintenance work at the Alba field to resolve processing issues. In the
U.S., well work over costs continued into the second quarter
The increase in DD&A is due to increased volumes from the U.K. and increased
accretion expense on asset retirement obligations
Interest expense is down year-over-year due to the repayment of the senior
term loan and notes payable
during
Q2
2012.
Quarter-over-quarter,
cash
and
non-cash
(Q1
2013
-
$24.31
cash/$8.83
non-
cash)
interest expense declined due to an increase in the barrels produced in Q2
Measure ($ expense per BOE)
2013
2012
2013
2012
Operating Expenses (OpEx)
Consolidated
$28.88
$13.49
$28.28
$13.21
U.K.
$30.03
$21.15
$29.20
$25.08
U.S.
$16.50
$6.97
$21.94
$6.34
Depreciation, depletion and amortization (DD&A)
Consolidated
$39.36
$24.97
$38.08
$23.01
U.K.
$42.17
$41.67
$42.35
$42.84
U.S.
$9.01
$10.76
$8.62
$11.54
General and Administrative Expense (G&A)
$3.70
$11.82
$5.27
$12.85
Interest Expenses
Cash
$13.65
$46.96
$17.16
$40.35
Non-cash
$4.88
$12.38
$6.18
$15.47
Second Quarter Ending
June 30,
Six Months Ending
June 30, |
   7
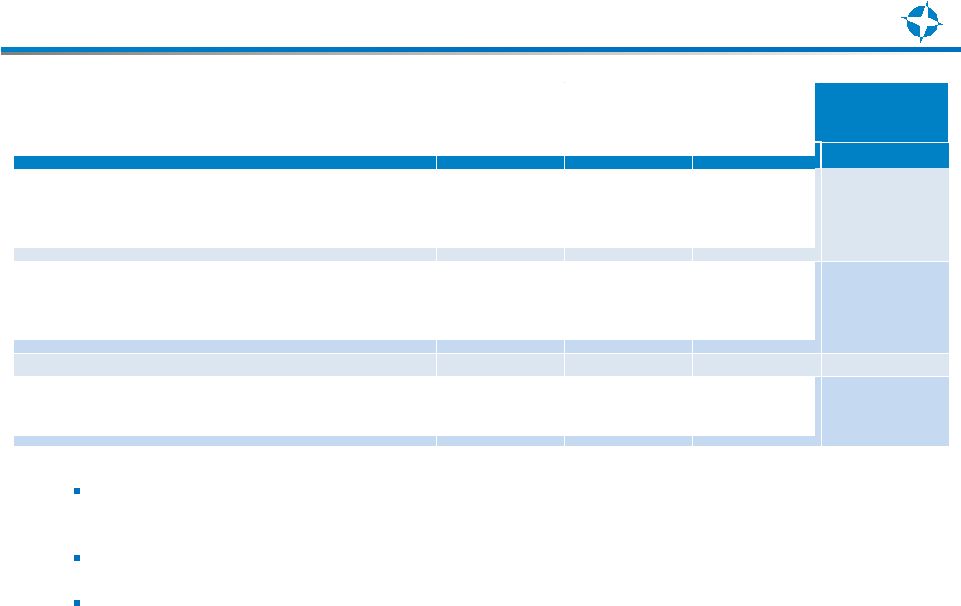
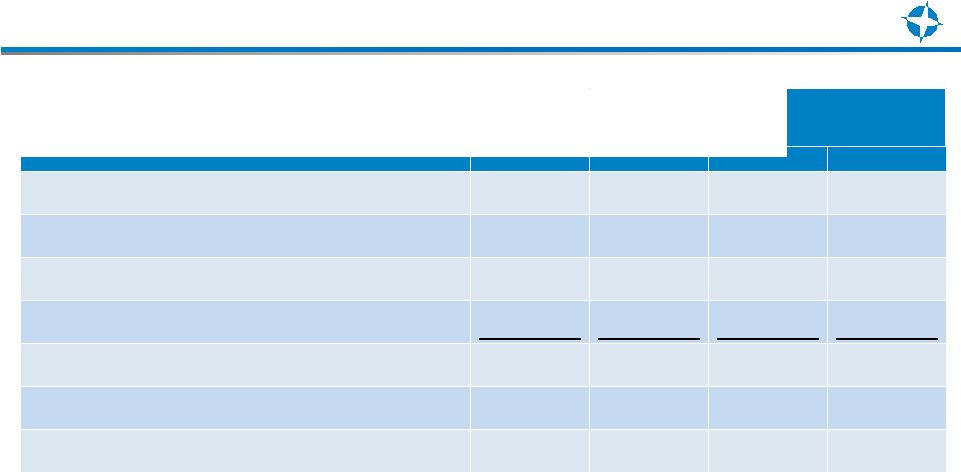
Adjusted EBITDA
Measure ($ in millions, except per share data)
2013
2012
2013
2012
Net Income (loss)
(13.9)
$
(50.8)
$
(27.9)
$
(86.1)
$
Unrealized (gain) loss on derivatives
1.3
(3.8)
(0.3)
1.0
Net Interest Expense
24.5
46.7
45.8
66.4
Letter of Credit Fees
7.1
3.1
18.5
3.1
Depreciation, depletion and amortization
51.9
10.6
74.9
18.5
Impairment of U.S. oil and gas properties
-
20.0
3.5
35.7
Income tax expense (benefit)
11.3
(14.3)
12.2
(24.9)
Adjusted EBITDA
82.2
$
11.5
$
126.7
$
13.7
$
Second Quarter Ending
June 30,
Six Months Ending
June 30,
Income tax expense is primarily PRT related to the Alba field
Adjusted EBITDA increased seven-fold over 2012, driven by the increase
in production at Alba and Bacchus
EBITDA increased significantly year-over-year, however the increases were
offset by higher interest expense, Letter of Credit fees, DD&A and
taxes |
  8
Adjusted Net Income (Loss)
Measure
($ in millions, except per share data)
2013
2012
2013
2012
Net Income (loss)
(13.9)
$
(50.8)
$
(27.9)
$
(86.1)
$
Impairment of U.S. oil and gas properties
-
20.0
3.5
35.7
Unrealized (gain) loss on derivatives (net of tax)
1.3
(4.4)
(0.3)
(0.2)
Loss on early extinguishment of debt (next of tax)
-
17.8
-
17.8
Net Income (loss) as Adjusted
(12.6)
$
(17.4)
$
(24.7)
$
(32.8)
$
Weighted-average basic
shares
outstanding (in millions)
47.1
39.0
47.1
38.4
Adjusted earning (loss) per basic share
(0.27)
$
(0.45)
$
(0.52)
$
(0.85)
$
Second Quarter Ending
June 30,
Six Months Ending
June 30, |
   9
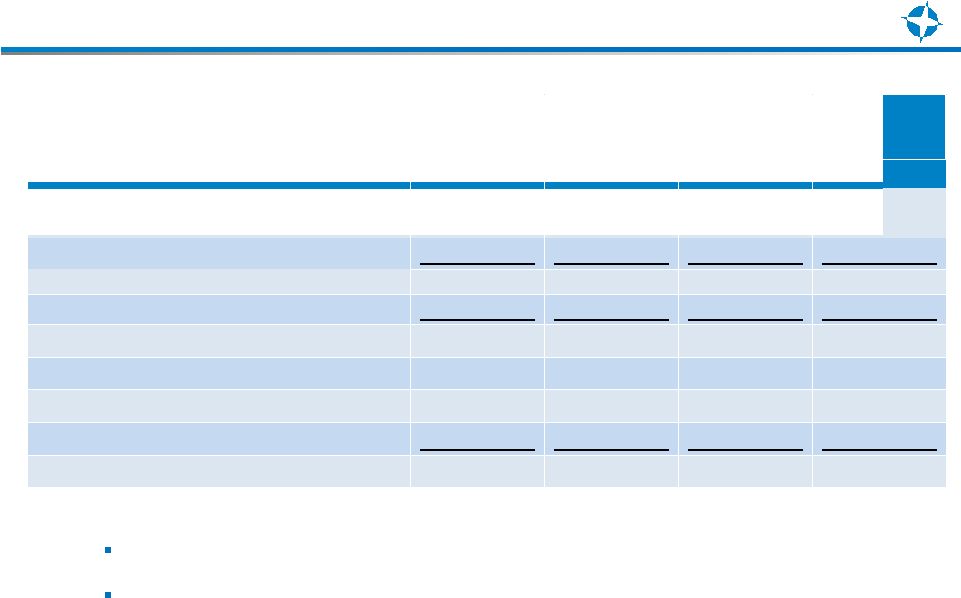
Capex Update
Capex spend for the quarter was impacted by drilling and development activities at
all the major U.K. projects -
Bacchus, Rochelle and Alba
In Q2 2012, Total Capital Expenditures included the purchase costs for the
additional working interest in the Alba field
Measure
($ in millions)
2013
2012
2013
2012
Direct Oil & Gas Capex
U.K.
64.4
$
40.8
$
97.5
$
84.5
$
U.S.
1.3
2.2
1.3
13.9
Total Direct Oil & Gas Capex
65.7
43.0
98.8
98.4
Acquisitions
0.7
190.1
1.5
191.6
66.4
233.1
100.3
290.0
Capitalized Interest
7.6
6.3
13.8
11.9
Capitalized G&A
1.8
5.3
6.8
9.8
Asset Retirement Obligations (AROs)
(7.7)
-
(3.5)
-
Total Capital Expenditures
68.1
$
244.7
$
117.4
$
311.7
$
Second Quarter Ending
June 30,
Six Months Ending
June 30, |
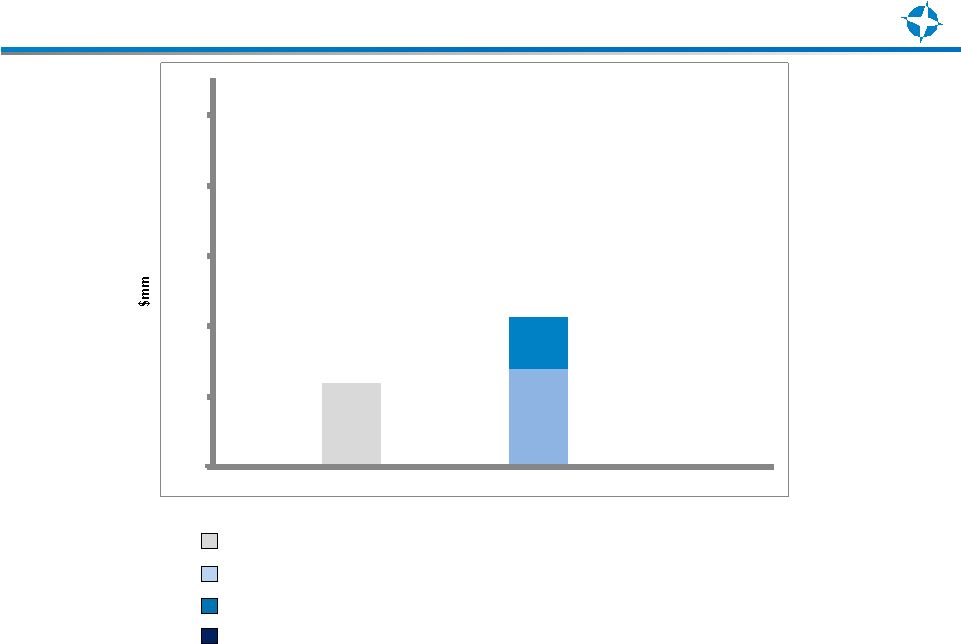
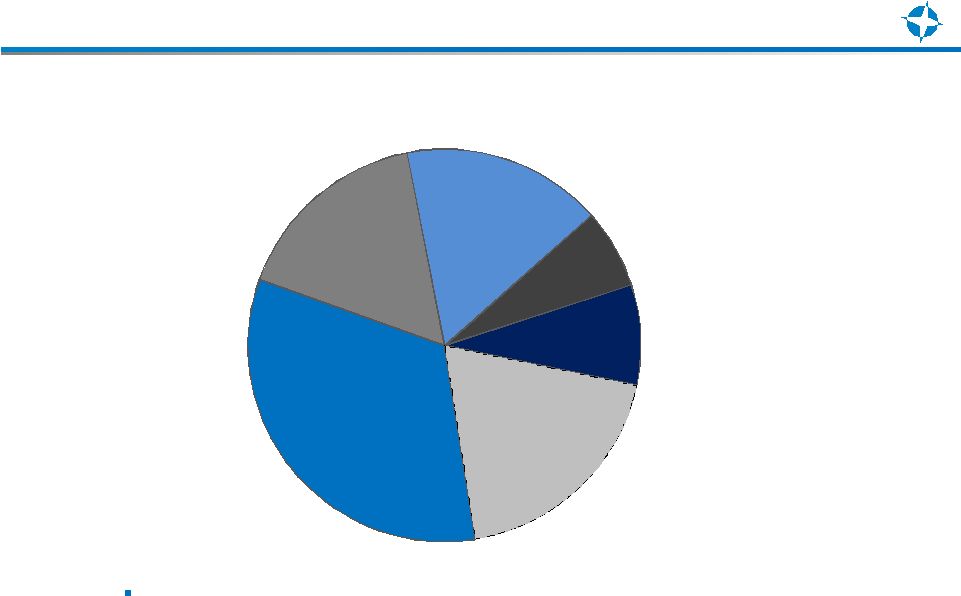 2013
Direct Capital Expenditures 10
Direct capital expenditures in the U.K. increased ~$30 million to reflect cost
overruns at Rochelle, due to extended drilling on the West Well (W-1)
and drilling of the new E-2 well at East Rochelle
Rochelle
Bacchus
Alba
U.S.
U.K. Other
Centurion
South
U.K. = $170 million -
$180 million
U.S. = $ 10 million -
$ 30 million |
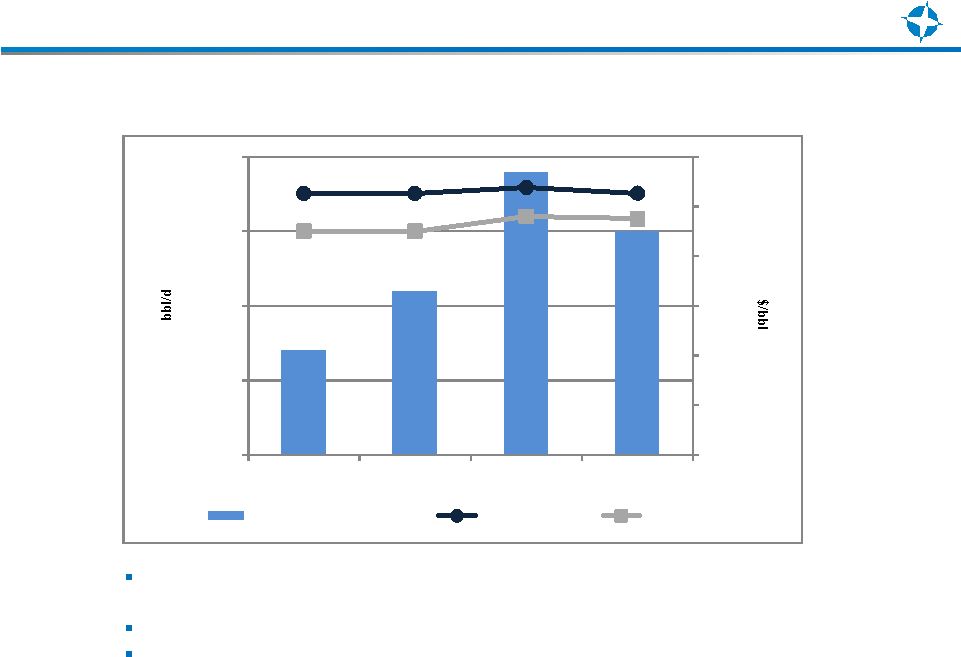 U.K.
Hedged Oil Position 11
The current hedging program involves embedding collars within existing
production marketing contracts
Pricing for the Forward Sale falls within the average ceiling and floor
Production for the Forward Sale is included in the barrels-per-day
$0
$20
$40
$60
$80
$100
$120
-
1,000
2,000
3,000
4,000
1Q2013
2Q2013
3Q2013
4Q2013
Hedged Production
Ave Ceiling
Ave Floor |
  12
Debt Maturity Schedule
Convertible Notes due 2016 ($18.51 per share conversion price)
Convertible Bonds due 2016 ($16.52 per share conversion price)
Senior Notes due 2018
Revolving Credit Facility due 2014
$115
$135
$554
$74
$0
$100
$200
$300
$400
$500
2013
2014
2015
2016
2017
2018 |
 LSE:ENDV
NYSE:END
www.endeavourcorp.com
Darcey Matthews
Director of Investor Relations
(713) 307-8711
darcey.matthews@endeavourcorp.com
INVESTOR CONTACTS: |