Attached files
| file | filename |
|---|---|
| 8-K - FORM 8-K - C. H. ROBINSON WORLDWIDE, INC. | d580894d8k.htm |
| EX-99.1 - EX-99.1 - C. H. ROBINSON WORLDWIDE, INC. | d580894dex991.htm |
 Earnings Conference Call –
Second Quarter 2013
August 6, 2013
John Wiehoff, Chairman & CEO
Chad Lindbloom, CFO
Tim Gagnon, Director, Investor Relations
Exhibit 99.2 |
 2
Safe Harbor Statement
Except for the historical information contained herein, the matters set forth in this presentation and
the accompanying earnings release are forward-looking statements that represent our
expectations, beliefs, intentions or strategies concerning future events. These
forward-looking statements are subject to certain risks and uncertainties that could cause
actual results to differ materially from our historical experience or our present expectations,
including, but not limited to such factors as changes in economic conditions, including uncertain
consumer demand; changes in market demand and pressures on the pricing for our services; competition
and growth rates within the third party logistics industry; freight levels and increasing costs
and availability of truck capacity or alternative means of transporting freight, and changes in
relationships with existing truck, rail, ocean and air carriers; changes in our customer base
due to possible consolidation among our customers; our ability to integrate the operations of
acquired companies with our historic operations successfully; risks associated with litigation
and insurance coverage; risks associated with operations outside of the U.S.; risks associated with the
potential impacts of changes in government regulations; risks associated with the produce industry,
including food safety and contamination issues; fuel prices and availability; and the impact of
war on the economy; and other risks and uncertainties detailed in our Annual and Quarterly
Reports. We have
included herein certain non-GAAP financial information, including certain fiscal 2012 information
adjusted to reflect an acquisition and a divestiture that occurred during 2012. In addition to
helping us assess our operating performance, we believe that these non-GAAP financial
measures assist investors in understanding our operations and results. However,
non-GAAP results should not be regarded as a substitute for corresponding GAAP measures,
and should be viewed in conjunction with our consolidated financial statements prepared in
accordance with GAAP. Reconciliations of such non-GAAP information to actual results
are set forth in Appendices A and B. |
 3
Q2 2013 Results
2013
2012
% Change
2013
2012
% Change
Total revenues
$3,288,262
$2,955,714
11.3%
$6,282,529
$5,507,828
14.1%
Total net revenues
$472,602
$425,523
11.1%
$928,324
$840,269
10.5%
Income from
operations
$182,476
$184,914
-1.3%
$351,182
$354,459
-0.9%
Net income
$111,872
$114,582
-2.4%
$215,215
$221,082
-2.7%
Earnings per share
(diluted)
$0.70
$0.71
-1.4%
$1.34
$1.36
-1.5%
Three months ended June 30
Six months ended June 30
In thousands, except per share amounts
•
Acquired revenues and T-Chek comparisons were impactful in the quarter
•
Auto
liability
settlement
of
$5
million,
negative
impact
of
$.02
to
diluted
EPS
in
Q2,
2013 |
 4
In thousands
2013 Actual
2012
Actual
T-Chek
Operations
Phoenix
Operations
2012 Pro
Forma
% Change
Pro Forma
Total net revenues
$472,602
$425,523
-$13,354
$46,039
$458,208
3.1%
Personnel expenses
206,009
177,184
-3,601
21,419
195,002
5.6%
Selling, general & admin
79,091
62,589
-2,938
9,952
69,603
13.6%
Acquisition amortization
5,026
836
0
4,067
4,903
2.5%
Total operating expenses
290,126
240,609
-6,539
$35,438
269,508
7.7%
Income from operations
$182,476
$184,914
-$6,815
$10,601
$188,700
-3.3%
Percent of net revenue
38.6%
43.5%
51.0%
23.0%
41.2%
-6.3%
Q2 2013 Actual Compared to Q2 2012 Pro Forma
•
2012 Pro Forma includes the effects of the disposition of T-Chek and
acquisition of Phoenix as if they
had
occurred
at
the
beginning
of
our
2012
fiscal
year.
A
reconciliation
of
actual
results
to
pro forma appears in Appendix A
•
Headcount increased approximately eight percent in the second quarter of 2013
compared to the
second
quarter
of
2012
excluding
the
employees
of
Phoenix,
Apreo
and
T-Chek
•
SG&A increase was impacted by the settlement of an auto liability claim and
the integration costs of Phoenix
Three months ended June 30 |
 5
In thousands
2013 Actual
2012
Actual
T-Chek
Operations
Phoenix
Operations
2012 Pro
Forma
% Change
Pro Forma
Total net revenues
$928,324
$840,269
-$26,129
$82,920
$897,060
3.5%
Personnel expenses
418,654
360,622
-7,706
41,100
394,016
6.3%
Selling, general & admin
148,415
123,510
-5,926
18,750
136,334
8.9%
Acquisition amortization
10,073
1,678
0
8,133
9,811
2.7%
Total operating expenses
577,142
485,810
-13,632
$67,983
540,161
6.8%
Income from operations
$351,182
$354,459
-$12,497
$14,937
$356,899
-1.6%
Percent of net revenue
37.8%
42.2%
47.8%
18.0%
39.8%
-5.0%
YTD Actual compared to prior YTD Pro Forma
•
2012 Pro Forma includes the effects of the disposition of T-Chek and
acquisition of Phoenix as if they had occurred at the beginning of our 2012
fiscal year. A reconciliation of actual results to pro forma appears in
Appendix B •
2013 Actual compared to Pro Forma 2012 net revenues increased 3.5 percent for
the
six
months
ending
June
30,
2013
compared
to
the
first
six
months
of
2012
•
Pro Forma income from operations decreased 1.6 percent
Six months ended June 30 |
 6
Transportation Results Q2 2013
•
Mix change influences net revenue margin
•
Global Forwarding net revenues (Ocean, Air and Customs) represent 18.3% of our
transportation net revenues in the second quarter 2013 compared to 8.5% in
the second quarter of 2012
2013
2012
% Change
2013
2012
% Change
Total revenues
$2,818,077
$2,476,805
13.8%
$5,421,259
$4,653,602
16.5%
Total net revenues
$431,145
$369,006
16.8%
$852,397
$736,222
15.8%
Net revenue margin
15.3%
14.9%
2.7%
15.7%
15.8%
-0.6%
Three months ended June 30
Six months ended June 30
TRANSPORTATION in thousands
TRANSPORTATION NET REVENUE MARGIN PERCENTAGE
2002
2003
2004
2005
2006
2007
2008
2009
2010
2011
2012
2013
Q1
17.7%
17.8%
16.8%
17.4%
18.3%
20.2%
18.2%
22.6%
17.4%
17.2%
16.9%
16.2%
Q2
16.1%
15.9%
15.4%
16.3%
17.1%
17.9%
15.4%
20.6%
15.8%
16.2%
14.9%
15.3%
Q3
15.6%
16.0%
15.9%
16.3%
17.5%
18.0%
15.9%
19.8%
16.6%
16.4%
15.6%
Q4
16.2%
15.8%
16.0%
15.7%
18.3%
17.7%
19.0%
18.3%
17.6%
16.3%
15.8% |
 7
Truckload Results Q2 2013
2013
2012
2013
2012
% Change
$264,335
$256,193
3.2%
$532,939
$519,775
2.5%
Three months ended June 30
Six months ended June 30
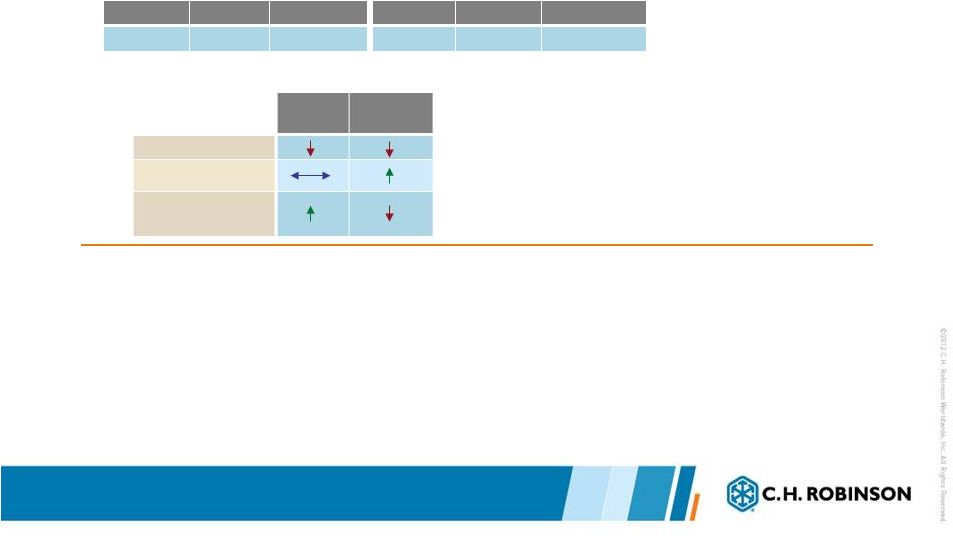
TRUCKLOAD NET REVENUES in thousands
Quarter
Year to
Date
Volume
9%
9%
Pricing *
1%
1%
Net revenue margin
TRUCKLOAD
Year over year change
*Excluding estimated impact of fuel
•
The acquisition of Apreo Logistics contributed approximately four percent to our
volume growth in the second quarter of 2013
•
North
America
Truckload
net
revenue
margins
were
relatively
flat
in
the
second
quarter
when
compared to the second quarter of 2012
•
North American Truckload cost per mile, excluding the impact of fuel and customer
pricing increased at nearly the same rate in the second quarter of
2013 % Change |
 8
LTL Results Q2 2013
2013
2012
% Change
2013
2012
% Change
$60,711
$56,445
7.6%
$119,202
$108,272
10.1%
Three months ended June 30
Six months ended June 30
LTL NET REVENUES in thousands
Quarter
Year to Date
Volume
8%
10%
Pricing
Net revenue margin
LTL
Year over year change
•
Net
revenues
increased
7.6
percent
in
the
second
quarter
of
2013
compared
to
the
second
quarter
of 2012
•
Volumes grew approximately eight percent in the quarter, driven by growth with
large customers •
Net revenue growth with smaller, transactional customers decreased in the second
quarter of 2013 compared to the second quarter of 2012
|
 9
Intermodal Results Q2 2013
•
Intermodal net revenue decreased 1.0 percent in the second quarter of 2013
compared to the second quarter of 2012
•
Volumes declined in the second quarter of 2013 compared to the second quarter of
2012, largely a result of less business with smaller, transactional
customers and available truckload capacity
2013
2012
% Change
2013
2012
% Change
$9,920
$10,019
-1.0%
$19,021
$19,730
-3.6%
Three months ended June 30
Six months ended June 30
INTERMODAL NET REVENUES in thousands
Year over year change
Volume
Pricing
Net revenue margin
Quarter
Year to
Date |
 10
Phoenix Integration Update
•
Integration initiatives are on track through the second quarter of 2013
•
Technology
transition
for
the
Phoenix
offices
has
begun
and
will
continue
for
many
months
•
Sales teams are active in communicating the CHRW service portfolio to Phoenix
customers 2013
2012
% Change
Actual C.H. Robinson
net revenue
$79,095
$31,469
151.3%
Phoenix net revenue *
$46,039
Total *
$79,095
$ 77,508
2.0%
Three months ended June 30
OCEAN, AIR, AND CUSTOMS NET REVENUE
In thousands
* See Appendix A & B
2013
2012
% Change
$146,957
$ 59,503
147.0%
$82,920
$146,957
$142,423
3.2%
Six months ended June 30 |
 11
Global Forwarding Results Q2 2013
Ocean, Air and Customs
2013
2012
% Change
2013
2012
% Change
Ocean
$49,124
$16,958
189.7%
$91,612
$32,719
180.0%
Air
$20,202
$10,577
91.0%
$36,970
$19,450
90.1%
Customs
$9,769
$3,934
148.3%
$18,375
$7,334
150.5%
Three months ended June 30
Six months ended June 30
NET REVENUES in thousands
Quarter
Year to Date
Volume
Pricing
Net revenue margin
OCEAN
Quarter
Year to Date
Volume
Pricing
Net revenue margin
AIR
Year over year change
Year over year change
•
Volume synergies are yielding positive results
•
Global Forwarding environment remains challenging and competitive
|
 12
Other Logistics Services Results Q2 2013
•
Other Logistics Services net revenues include transportation management services,
warehousing and small parcel
•
The sales pipeline for logistics and supply chain services is full and our value
proposition is well positioned for customer needs
2013
2012
% Change
2013
2012
% Change
$17,084
$14,880
14.8%
$34,278
$28,942
18.4%
Three months ended June 30
Six months ended June 30
NET REVENUES in thousands
|
 13
Sourcing Results Q2 2013
•
Net
revenues
decreased
3.6
percent
in
the
second
quarter
of
2013
compared
to
the
second
quarter of 2012
•
Case volume increased approximately one percent in the second quarter of 2013
compared to the second quarter of 2012
•
Weather impacted product availability and yields in key commodities
2013
2012
% Change
2013
2012
% Change
Total revenues
$466,811
$462,597
0.9%
$854,663
$822,327
3.9%
Total net revenues
$38,752
$40,205
-3.6%
$70,598
$72,148
-2.1%
Net revenue margin
8.3%
8.7%
-4.5%
8.3%
8.8%
-5.9%
Three months ended June 30
Six months ended June 30
SOURCING in thousands |
 14
2013
2012
% Change
2013
2012
% Change
Net cash provided by operating
activities
$116,320
$32,944
253.1%
$58,271
$110,028
-47.0%
Capital expenditures, net
$12,400
$11,150
11.2%
$22,577
$24,970
-9.6%
Three months ended June 30
Six months ended June 30
2
Quarter,
2013
Through
June 30, *
2013
Shares repurchased
872,225
2,435,817
Average price per
share
$57.26
$60.08
Total cost of shares
repurchased
$49,944
$146,352
June 30, 2013
Cash &
investments
$150,017
Current assets
$1,782,968
Total assets
$2,291,545
Debt
$365,652
Current liabilities
$1,330,987
Stockholders’
investment
$1,499,065
CASH FLOW DATA
2013
BALANCE SHEET DATA
REPURCHASES OF COMMON STOCK
Other Financial Information
In thousands, except share and per share amounts
*year
to
date
total
includes
the
shares
withheld
on
the
delivery
of
restricted shares to employees in quarter one
nd |
 15
A look ahead
•
Divestiture of T-Chek and the acquisitions of Phoenix International and Apreo
will continue to affect our results, as planned
•
The North American truckload market conditions remain balanced and
competitive •
We will continue to pursue profitable market share growth
•
We will continue to invest in the long term success of our business
|
 16
Appendix A: 2012 Actual to Pro Forma Reconciliation
In thousands
Three months ended June 30
1.
Adjustments have been made to historical Phoenix operations for the addition of
amortization expense of finite-lived intangible assets recorded in
connection with the acquisition ($4,067), rent expense for lease agreements
entered into in connection with the acquisition ($84), and depreciation on
a building acquired in the acquisition ($37). An
adjustment
has
also
been
made
for
the
elimination
of
contractual
changes
in
compensation ($5,080). There were no pro forma adjustments to the T-Chek
historical results.
2.
Net revenues are our total revenues less purchased transportation and related
services and purchased products sourced for resale.
|
 17
Appendix B: 2012 Actual to Pro Forma Reconciliation
In thousands
Six months ended June 30
1.
Adjustments have been made to historical Phoenix operations for addition of
amortization expense of finite-lived intangible assets recorded in connection
with the acquisition ($8,133), rent expense for lease agreements entered
into in connection with the acquisition ($168), and depreciation on a
building acquired in the acquisition ($75). An adjustment has also been
made for the elimination of contractual changes in compensation ($5,080).
There were no pro forma adjustments to the T-Chek historical
results.
2.
Net revenues are our total revenues less purchased transportation and related
services and purchased products sourced for resale.
|
 18
Appendix C: 2012 & 2011 Truckload, LTL & Customs
quarterly net revenue
In thousands
2012
2011
Q1
Q2
Q3
Q4
Q1
Q2
Q3
Q4
Truckload
$263,582
$256,193
$269,097
$271,248
$248,577
$264,029
$268,376
$256,894
LTL
51,827
$56,445
58,863
57,025
45,923
50,273
52,990
49,549
Total Truck
$315,409
$312,638
$327,960
$328,273
$294,500
$314,302
$321,366
$306,443
Customs
$3400
$3,934
$4,109
$6,782
$2,935
$3,306
$3,490
$3,369
Other Logistics Services
14,062
14,880
13,087
15,420
11,130
11,542
11,262
12,838
Total Other Logistics
Services
$17,462
$18,814
$17,196
$22,202
$14,065
$14,848
$14,752
$16,207 |
 |