Attached files
| file | filename |
|---|---|
| EX-99.1 - EX-99.1 - Rockwood Holdings, Inc. | a13-17884_1ex99d1.htm |
| 8-K - 8-K - Rockwood Holdings, Inc. | a13-17884_18k.htm |
Exhibit 99.2
|
|
August 5, 2013 Second Quarter 2013 Results |
|
|
Forward Looking Statements This press release contains, and management may make, certain "forward-looking statements" within the meaning of the Private Securities Litigation Reform Act of 1995. All statements other than statements of historical facts may be forward-looking statements. Words such as "may,” “will,” “should,” “could,” “likely,” “anticipates," “intends,” "believes," "estimates," "expects," "forecasts," “plans,” “projects,” "predicts" and “outlook” and similar words and expressions are intended to identify forward-looking statements. Examples of our forward-looking statements include, among others, statements relating to our outlook, our future operating results on a segment basis, our future Adjusted EBITDA and free cash flows, our share repurchase plans and our strategic initiatives. Although they reflect Rockwood’s current expectations, they involve a number of known and unknown risks, uncertainties and other factors that could cause actual results to differ materially from those expressed or implied, and not guarantees of future performance. These risks, uncertainties and other factors include, without limitation, Rockwood’s business strategy; changes in general economic conditions in North America and Europe and in other locations in which Rockwood currently does business; competitive pricing or product development activities affecting demand for Rockwood’s products; technological changes affecting production of Rockwood’s materials; fluctuations in interest rates, exchange rates and currency values; availability and pricing of raw materials; governmental and environmental regulations and changes in those regulations; fluctuations in energy prices; changes in the end-use markets in which Rockwood’s products are sold; hazards associated with chemicals manufacturing; Rockwood’s ability to access capital markets; Rockwood’s high level of indebtedness; risks associated with competition and the introduction of new competing products, especially from the Asia-Pacific region; risks associated with international sales and operations; risks associated with information securities and the risks, uncertainties and other factors discussed under "Risk Factors" and “Management’s Discussion and Analysis of Financial Condition and Results of Operations” in Rockwood's Form 10-K for the year ended December 31, 2012 and other periodic reports filed with or furnished to the Securities and Exchange Commission. Rockwood does not undertake any obligation to publicly update or revise any forward-looking statement, whether as a result of new information, future events or otherwise. |
|
|
Agenda Second Quarter 2013 Highlights Financial Summary Summary Appendices |
|
|
Second Quarter 2013 Highlights |
|
|
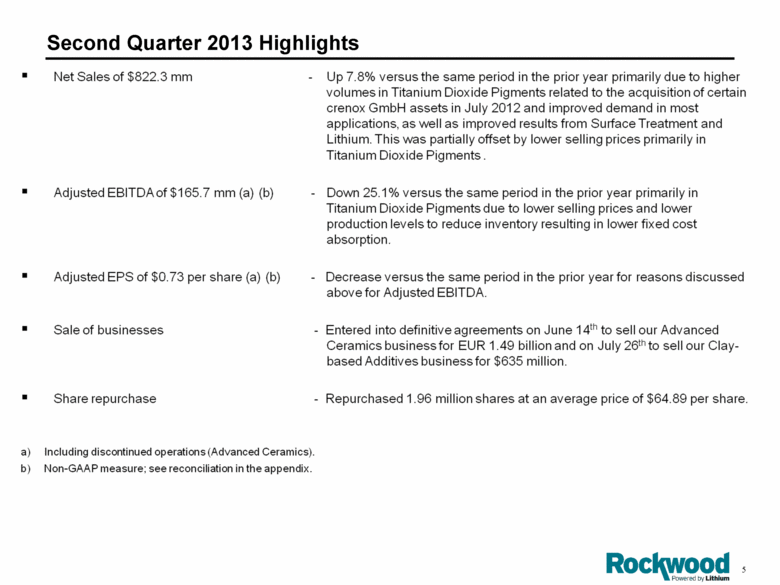
Second Quarter 2013 Highlights Net Sales of $822.3 mm - Up 7.8% versus the same period in the prior year primarily due to higher volumes in Titanium Dioxide Pigments related to the acquisition of certain crenox GmbH assets in July 2012 and improved demand in most applications, as well as improved results from Surface Treatment and Lithium. This was partially offset by lower selling prices primarily in Titanium Dioxide Pigments. Adjusted EBITDA of $165.7 mm (a) (b) - Down 25.1% versus the same period in the prior year primarily in Titanium Dioxide Pigments due to lower selling prices and lower production levels to reduce inventory resulting in lower fixed cost absorption. Adjusted EPS of $0.73 per share (a) (b) - Decrease versus the same period in the prior year for reasons discussed above for Adjusted EBITDA. Sale of businesses - Entered into definitive agreements on June 14th to sell our Advanced Ceramics business for EUR 1.49 billion and on July 26th to sell our Clay- based Additives business for $635 million. Share repurchase - Repurchased 1.96 million shares at an average price of $64.89 per share. a) Including discontinued operations (Advanced Ceramics). b) Non-GAAP measure; see reconciliation in the appendix. |
|
|
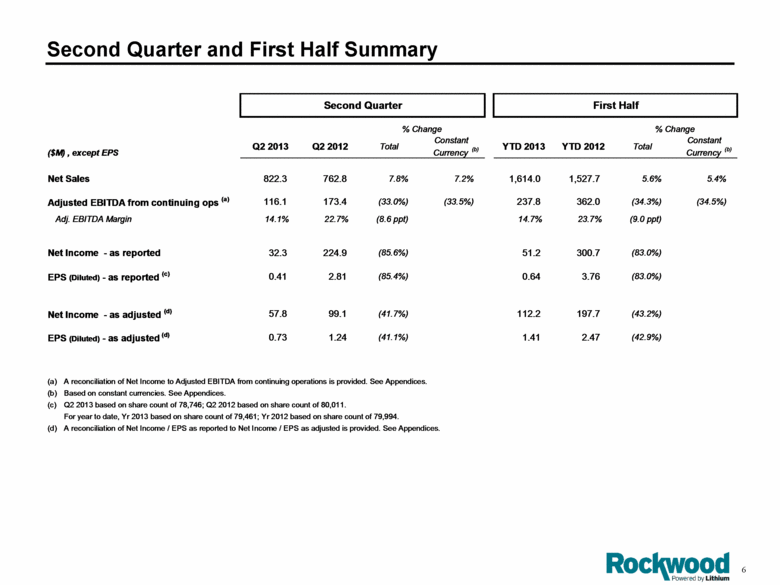
Second Quarter and First Half Summary Second Quarter First Half % Change % Change ($M) , except EPS Q2 2013 Q2 2012 Total Constant Currency (b) YTD 2013 YTD 2012 Total Constant Currency (b) Net Sales 822.3 762.8 7.8% 7.2% 1,614.0 1,527.7 5.6% 5.4% Adjusted EBITDA from continuing ops (a) 116.1 173.4 (33.0%) (33.5%) 237.8 362.0 (34.3%) (34.5%) Adj. EBITDA Margin 14.1% 22.7% (8.6 ppt) 14.7% 23.7% (9.0 ppt) Net Income - as reported 32.3 224.9 (85.6%) 51.2 300.7 (83.0%) EPS (Diluted) - as reported (c) 0.41 2.81 (85.4%) 0.64 3.76 (83.0%) Net Income - as adjusted (d) 57.8 99.1 (41.7%) 112.2 197.7 (43.2%) EPS (Diluted) - as adjusted (d) 0.73 1.24 (41.1%) 1.41 2.47 (42.9%) (a) A reconciliation of Net Income to Adjusted EBITDA from continuing operations is provided. See Appendices. (b) Based on constant currencies. See Appendices. (c) (d) A reconciliation of Net Income / EPS as reported to Net Income / EPS as adjusted is provided. See Appendices. For year to date, Yr 2013 based on share count of 79,461; Yr 2012 based on share count of 79,994. Q2 2013 based on share count of 78,746; Q2 2012 based on share count of 80,011. |
|
|
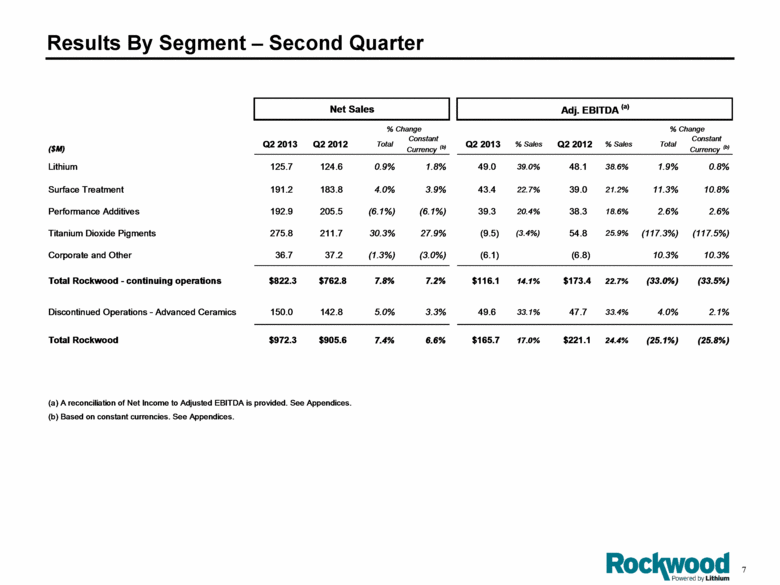
Results By Segment – Second Quarter Net Sales Adj. EBITDA (a) % Change % Change ($M) Q2 2013 Q2 2012 Total Constant Currency (b) Q2 2013 % Sales Q2 2012 % Sales Total Constant Currency (b) Lithium 125.7 124.6 0.9% 1.8% 49.0 39.0% 48.1 38.6% 1.9% 0.8% Surface Treatment 191.2 183.8 4.0% 3.9% 43.4 22.7% 39.0 21.2% 11.3% 10.8% Performance Additives 192.9 205.5 (6.1%) (6.1%) 39.3 20.4% 38.3 18.6% 2.6% 2.6% Titanium Dioxide Pigments 275.8 211.7 30.3% 27.9% (9.5) (3.4%) 54.8 25.9% (117.3%) (117.5%) Corporate and Other 36.7 37.2 (1.3%) (3.0%) (6.1) (6.8) 10.3% 10.3% Total Rockwood - continuing operations $822.3 $762.8 7.8% 7.2% $116.1 14.1% $173.4 22.7% (33.0%) (33.5%) Discontinued Operations - Advanced Ceramics 150.0 142.8 5.0% 3.3% 49.6 33.1% 47.7 33.4% 4.0% 2.1% Total Rockwood $972.3 $905.6 7.4% 6.6% $165.7 17.0% $221.1 24.4% (25.1%) (25.8%) (a) A reconciliation of Net Income to Adjusted EBITDA is provided. See Appendices. (b) Based o n constant currencies. See Appendices. |
|
|
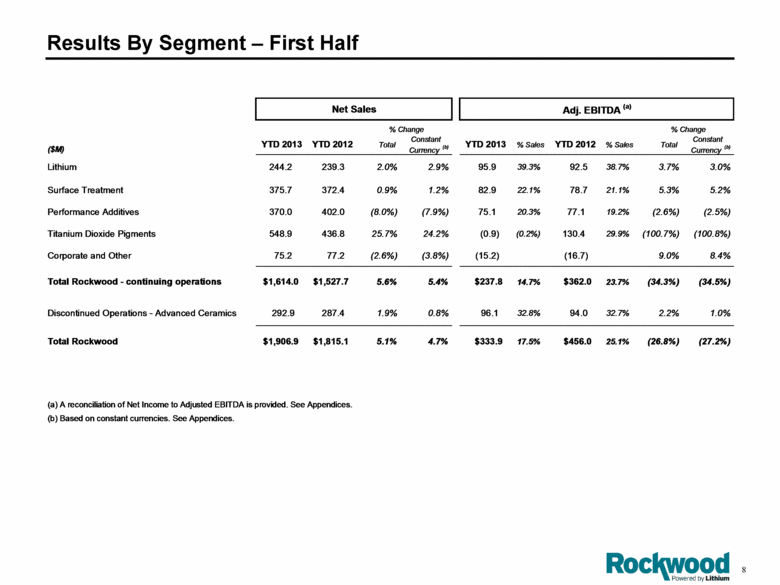
Results By Segment – First Half Net Sales Adj. EBITDA (a) % Change % Change ($M) YTD 2013 YTD 2012 Total Constant Currency (b) YTD 2013 % Sales YTD 2012 % Sales Total Constant Currency (b) Lithium 244.2 239.3 2.0% 2.9% 95.9 39.3% 92.5 38.7% 3.7% 3.0% Surface Treatment 375.7 372.4 0.9% 1.2% 82.9 22.1% 78.7 21.1% 5.3% 5.2% Performance Additives 370.0 402.0 (8.0%) (7.9%) 75.1 20.3% 77.1 19.2% (2.6%) (2.5%) Titanium Dioxide Pigments 548.9 436.8 25.7% 24.2% (0.9) (0.2%) 130.4 29.9% (100.7%) (100.8%) Corporate and Other 75.2 77.2 (2.6%) (3.8%) (15.2) (16.7) 9.0% 8.4% Total Rockwood - continuing operations $1,614.0 $1,527.7 5.6% 5.4% $237.8 14.7% $362.0 23.7% (34.3%) (34.5%) Discontinued Operations - Advanced Ceramics 292.9 287.4 1.9% 0.8% 96.1 32.8% 94.0 32.7% 2.2% 1.0% Total Rockwood $1,906.9 $1,815.1 5.1% 4.7% $333.9 17.5% $456.0 25.1% (26.8%) (27.2%) (a) A reconciliation of Net Income to Adjusted EBITDA is provided. See Appendices. (b) Based o n constant currencies. See Appendices. |
|
|
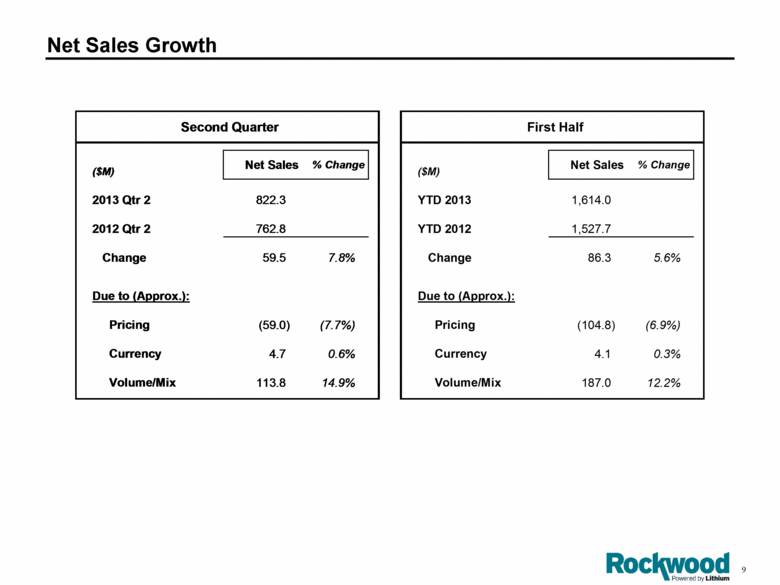
Net Sales Growth Second Quarter First Half ($M) Net Sales % Change ($M) Net Sales % Change 2013 Qtr 2 822.3 YTD 2013 1,614.0 2012 Qtr 2 762.8 YTD 2012 1,527.7 Change 59.5 7.8% Change 86.3 5.6% Due to (Approx.): Due to (Approx.): Pricing (59.0) (7.7%) Pricing (104.8) (6.9%) Currency 4.7 0.6% Currency 4.1 0.3% Volume/Mix 113.8 14.9% Volume/Mix 187.0 12.2% |
|
|
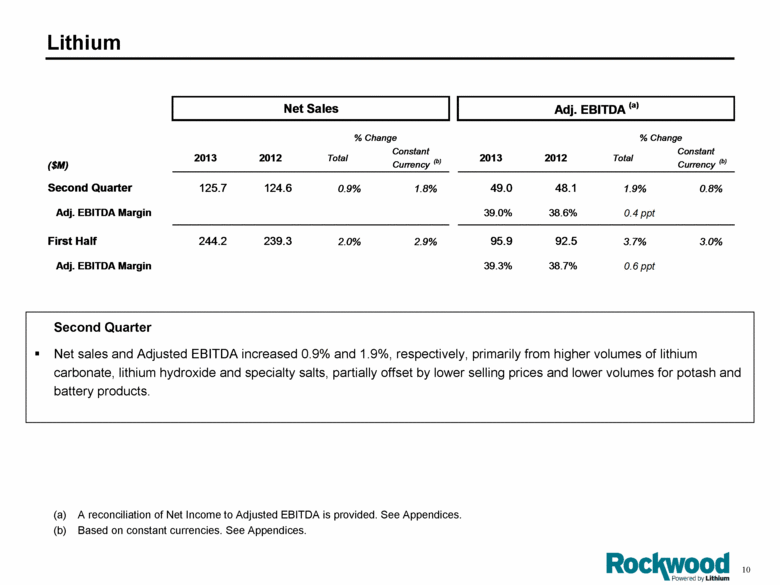
Lithium Second Quarter Net sales and Adjusted EBITDA increased 0.9% and 1.9%, respectively, primarily from higher volumes of lithium carbonate, lithium hydroxide and specialty salts, partially offset by lower selling prices and lower volumes for potash and battery products. A reconciliation of Net Income to Adjusted EBITDA is provided. See Appendices. Based on constant currencies. See Appendices. Net Sales Adj. EBITDA (a) % Change % Change ($M) 2013 2012 Total Constant Currency (b) 2013 2012 Total Constant Currency (b) Second Quarter 125.7 124.6 0.9% 1.8% 49.0 48.1 1.9% 0.8% Adj. EBITDA Margin 39.0% 38.6% 0.4 ppt First Half 244.2 239.3 2.0% 2.9% 95.9 92.5 3.7% 3.0% Adj. EBITDA Margin 39.3% 38.7% 0.6 ppt |
|
|
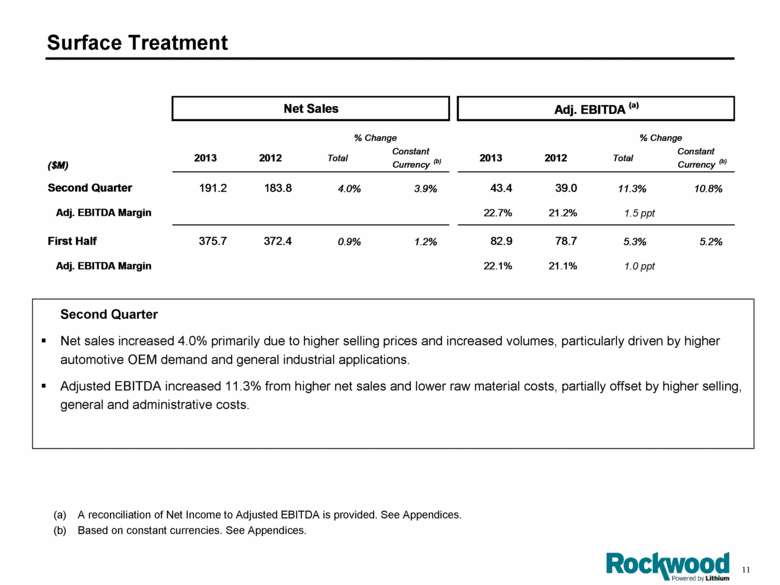
Surface Treatment Second Quarter Net sales increased 4.0% primarily due to higher selling prices and increased volumes, particularly driven by higher automotive OEM demand and general industrial applications. Adjusted EBITDA increased 11.3% from higher net sales and lower raw material costs, partially offset by higher selling, general and administrative costs. A reconciliation of Net Income to Adjusted EBITDA is provided. See Appendices. Based on constant currencies. See Appendices. Net Sales Adj. EBITDA (a) % Change % Change ($M) 2013 2012 Total Constant Currency (b) 2013 2012 Total Constant Currency (b) Second Quarter 191.2 183.8 4.0% 3.9% 43.4 39.0 11.3% 10.8% Adj. EBITDA Margin 22.7% 21.2% 1.5 ppt First Half 375.7 372.4 0.9% 1.2% 82.9 78.7 5.3% 5.2% Adj. EBITDA Margin 22.1% 21.1% 1.0 ppt |
|
|
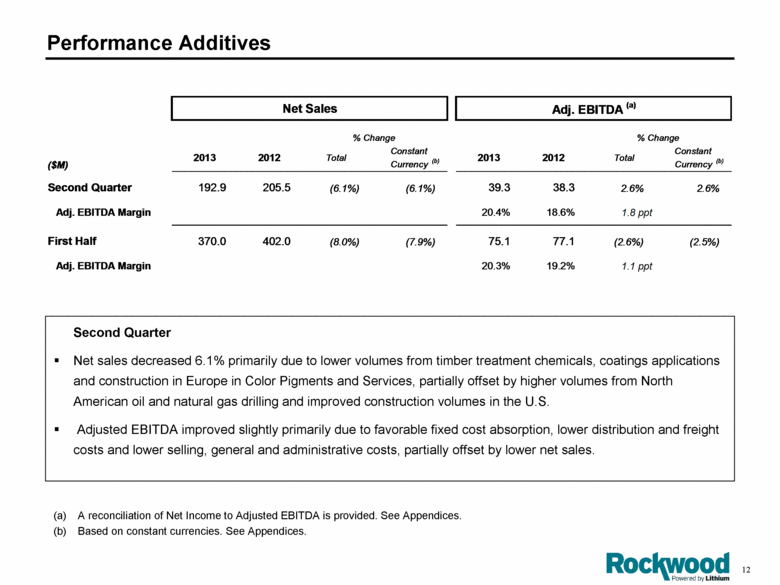
Performance Additives Second Quarter Net sales decreased 6.1% primarily due to lower volumes from timber treatment chemicals, coatings applications and construction in Europe in Color Pigments and Services, partially offset by higher volumes from North American oil and natural gas drilling and improved construction volumes in the U.S. Adjusted EBITDA improved slightly primarily due to favorable fixed cost absorption, lower distribution and freight costs and lower selling, general and administrative costs, partially offset by lower net sales. A reconciliation of Net Income to Adjusted EBITDA is provided. See Appendices. Based on constant currencies. See Appendices. Net Sales Adj. EBITDA (a) % Change % Change ($M) 2013 2012 Total Constant Currency (b) 2013 2012 Total Constant Currency (b) Second Quarter 192.9 205.5 (6.1%) (6.1%) 39.3 38.3 2.6% 2.6% Adj. EBITDA Margin 20.4% 18.6% 1.8 ppt First Half 370.0 402.0 (8.0%) (7.9%) 75.1 77.1 (2.6%) (2.5%) Adj. EBITDA Margin 20.3% 19.2% 1.1 ppt |
|
|
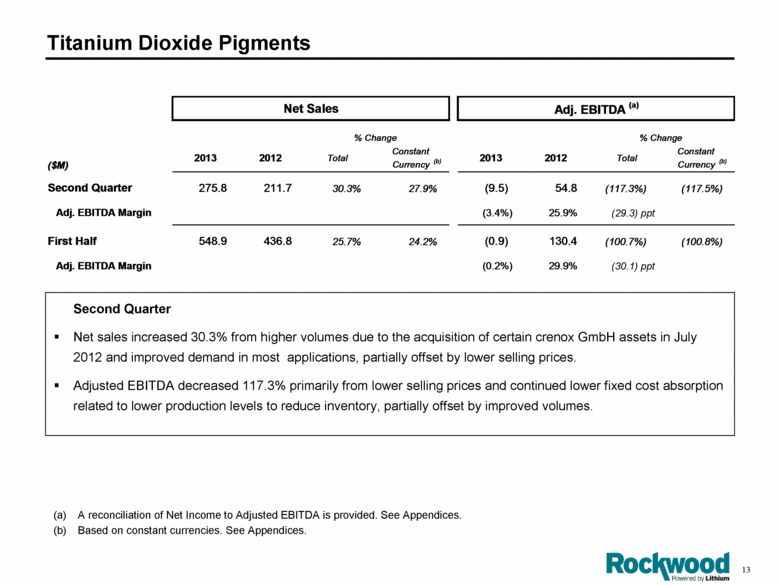
Titanium Dioxide Pigments Second Quarter Net sales increased 30.3% from higher volumes due to the acquisition of certain crenox GmbH assets in July 2012 and improved demand in most applications, partially offset by lower selling prices. Adjusted EBITDA decreased 117.3% primarily from lower selling prices and continued lower fixed cost absorption related to lower production levels to reduce inventory, partially offset by improved volumes. A reconciliation of Net Income to Adjusted EBITDA is provided. See Appendices. Based on constant currencies. See Appendices. Net Sales Adj. EBITDA (a) % Change % Change ($M) 2013 2012 Total Constant Currency (b) 2013 2012 Total Constant Currency (b) Second Quarter 275.8 211.7 30.3% 27.9% (9.5) 54.8 (117.3%) (117.5%) Adj. EBITDA Margin (3.4%) 25.9% (29.3) ppt First Half 548.9 436.8 25.7% 24.2% (0.9) 130.4 (100.7%) (100.8%) Adj. EBITDA Margin (0.2%) 29.9% (30.1) ppt |
|
|
Financial Summary |
|
|
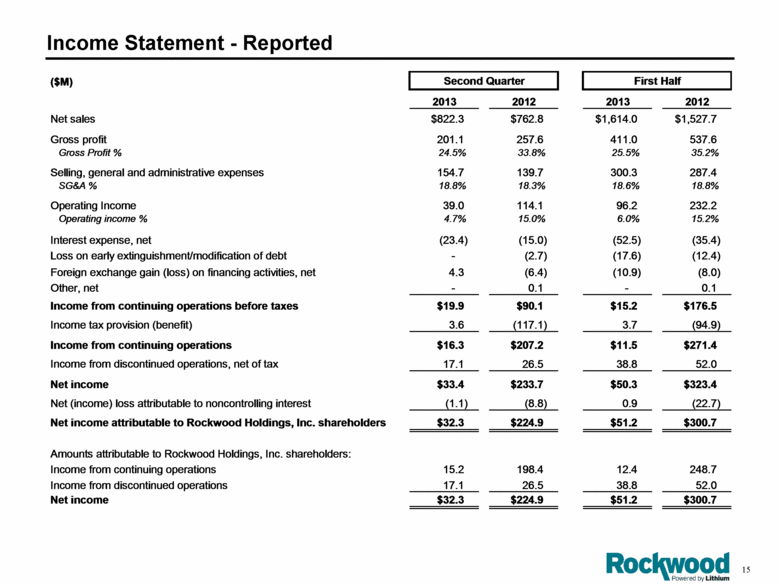
Income Statement - Reported ($M) Second Quarter First Half 2013 2012 2013 2012 Net sales $822.3 $762.8 $1,614.0 $1,527.7 Gross profit 201.1 257.6 411.0 537.6 Gross Profit % 24.5% 33.8% 25.5% 35.2% Selling, general and administrative expenses 154.7 139.7 300.3 287.4 SG&A % 18.8% 18.3% 18.6% 18.8% Operating Income 39.0 114.1 96.2 232.2 Operating income % 4.7% 15.0% 6.0% 15.2% Interest expense, net (23.4) (15.0) (52.5) (35.4) Loss on early extinguishment/modification of debt - (2.7) (17.6) (12.4) Foreign exchange gain (loss) on financing activities, net 4.3 (6.4) (10.9) (8.0) Other, net - 0.1 - 0.1 Income from continuing operations before taxes $19.9 $90.1 $15.2 $176.5 Income tax provision (benefit) 3.6 (117.1) 3.7 (94.9) Income from continuing operations $16.3 $207.2 $11.5 $271.4 Income from discontinued operations, net of tax 17.1 26.5 38.8 52.0 Net income $33.4 $233.7 $50.3 $323.4 Net (income) loss attributable to noncontrolling interest (1.1) (8.8) 0.9 (22.7) Net income attributable to Rockwood Holdings, Inc. shareholders $32.3 $224.9 $51.2 $300.7 Amounts attributable to Rockwood Holdings, Inc. shareholders: Income from continuing operations 15.2 198.4 12.4 248.7 Income from discontinued operations 17.1 26.5 38.8 52.0 Net income $32.3 $224.9 $51.2 $300.7 |
|
|
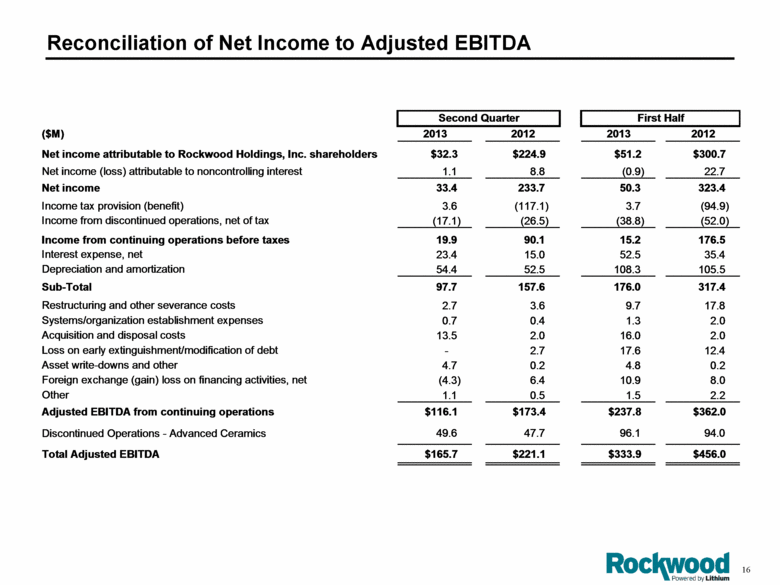
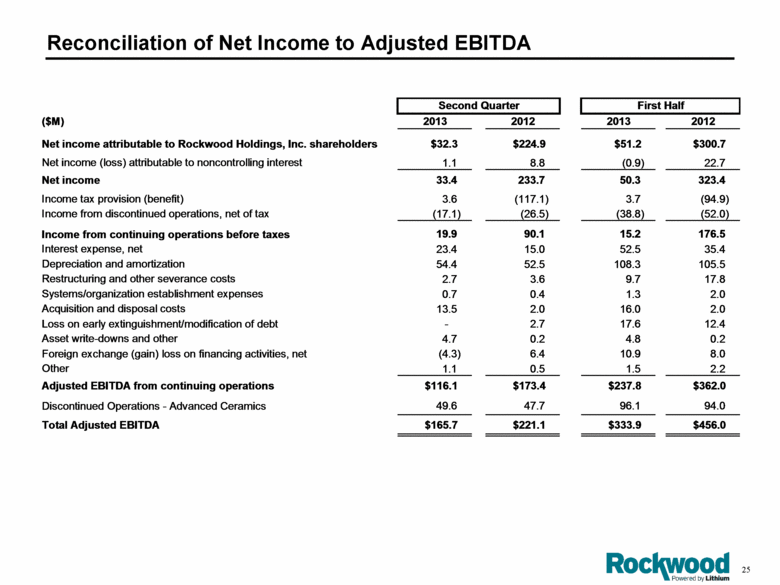
Reconciliation of Net Income to Adjusted EBITDA ($M) 2013 2012 2013 2012 Net income attributable to Rockwood Holdings, Inc. shareholders $32.3 $224.9 $51.2 $300.7 Net income (loss) attributable to noncontrolling interest 1.1 8.8 (0.9) 22.7 Net income 33.4 233.7 50.3 323.4 Income tax provision (benefit) 3.6 (117.1) 3.7 (94.9) Income from discontinued operations, net of tax (17.1) (26.5) (38.8) (52.0) Income from continuing operations before taxes 19.9 90.1 15.2 176.5 Interest expense, net 23.4 15.0 52.5 35.4 Depreciation and amortization 54.4 52.5 108.3 105.5 Sub-Total 97.7 157.6 176.0 317.4 Restructuring and other severance costs 2.7 3.6 9.7 17.8 Systems/organization establishment expenses 0.7 0.4 1.3 2.0 Acquisition and disposal costs 13.5 2.0 16.0 2.0 Loss on early extinguishment/modification of debt - 2.7 17.6 12.4 Asset write-downs and other 4.7 0.2 4.8 0.2 Foreign exchange (gain) loss on financing activities, net (4.3) 6.4 10.9 8.0 Other 1.1 0.5 1.5 2.2 Adjusted EBITDA from continuing operations $116.1 $173.4 $237.8 $362.0 Discontinued Operations - Advanced Ceramics 49.6 47.7 96.1 94.0 Total Adjusted EBITDA $165.7 $221.1 $333.9 $456.0 First Half Second Quarter |
|
|
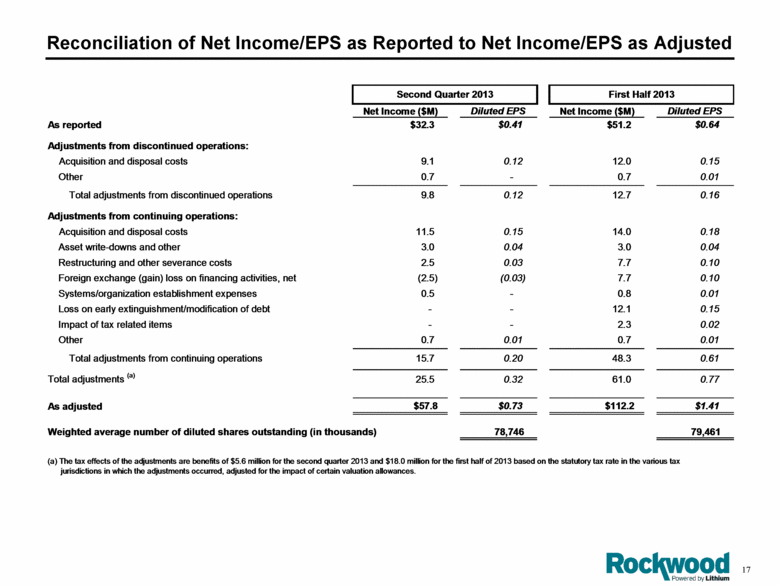
Reconciliation of Net Income/EPS as Reported to Net Income/EPS as Adjusted Net Income ($M) Diluted EPS Net Income ($M) Diluted EPS As reported $32.3 $0.41 $51.2 $0.64 Adjustments from discontinued operations: Acquisition and disposal costs 9.1 0.12 12.0 0.15 Other 0.7 - 0.7 0.01 Total adjustments from discontinued operations 9.8 0.12 12.7 0.16 Adjustments from continuing operations: Acquisition and disposal costs 11.5 0.15 14.0 0.18 Asset write-downs and other 3.0 0.04 3.0 0.04 Restructuring and other severance costs 2.5 0.03 7.7 0.10 Foreign exchange (gain) loss on financing activities, net (2.5) (0.03) 7.7 0.10 Systems/organization establishment expenses 0.5 - 0.8 0.01 Loss on early extinguishment/modification of debt - - 12.1 0.15 Impact of tax related items - - 2.3 0.02 Other 0.7 0.01 0.7 0.01 Total adjustments from continuing operations 15.7 0.20 48.3 0.61 Total adjustments (a) 25.5 0.32 61.0 0.77 As adjusted $57.8 $0.73 $112.2 $1.41 Weighted average number of diluted shares outstanding (in thousands) 78,746 79,461 (a) The tax effects of the adjustments are benefits of $5.6 million for the second quarter 2013 and $18.0 million for the first half of 2013 based on the statutory tax rate in the various tax jurisdictions in which the adjustments occurred, adjusted for the impact of certain valuation allowances. First Half 2013 Second Quarter 2013 |
|
|
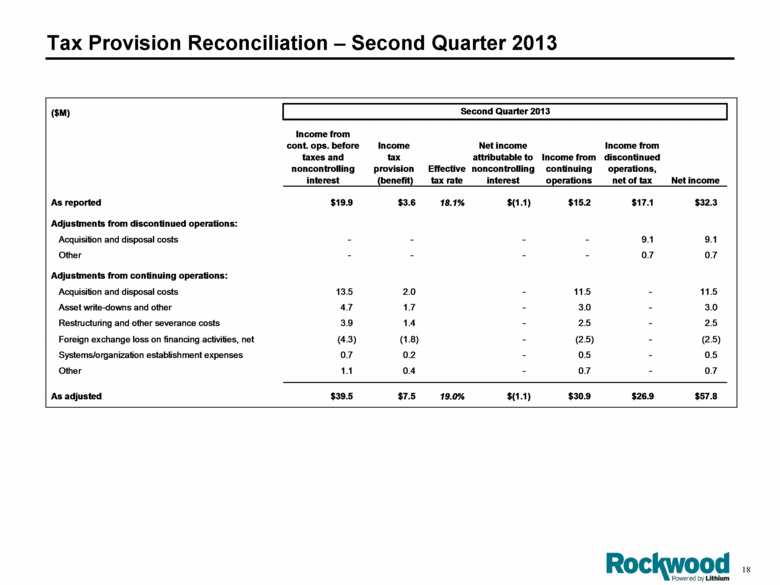
Tax Provision Reconciliation – Second Quarter 2013 ($M) Income from cont. ops. before taxes and noncontrolling interest Income tax provision (benefit) Effective tax rate Net income attributable to noncontrolling interest Income from continuing operations Income from discontinued operations, net of tax Net income As reported $19.9 $3.6 18.1% $(1.1) $15.2 $17.1 $32.3 Adjustments from discontinued operations: Acquisition and disposal costs - - - - 9.1 9.1 Other - - - - 0.7 0.7 Adjustments from continuing operations: Acquisition and disposal costs 13.5 2.0 - 11.5 - 11.5 Asset write-downs and other 4.7 1.7 - 3.0 - 3.0 Restructuring and other severance costs 3.9 1.4 - 2.5 - 2.5 Foreign exchange loss on financing activities, net (4.3) (1.8) - (2.5) - (2.5) Systems/organization establishment expenses 0.7 0.2 - 0.5 - 0.5 Other 1.1 0.4 - 0.7 - 0.7 As adjusted $39.5 $7.5 19.0% $(1.1) $30.9 $26.9 $57.8 Second Quarter 2013 (a) |
|
|
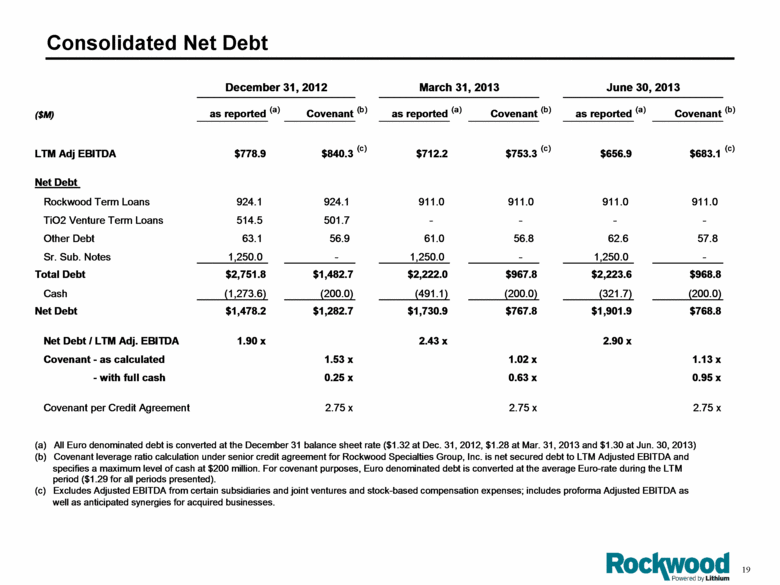
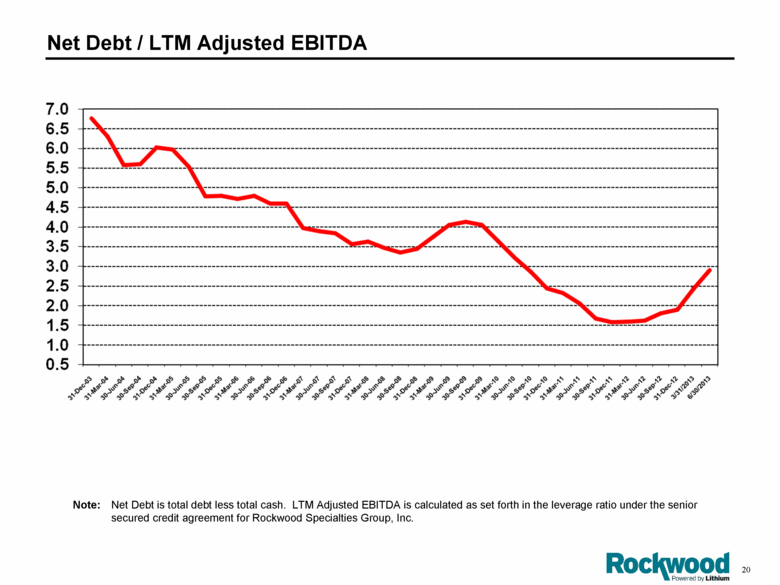
Consolidated Net Debt December 31, 2012 March 31, 2013 June 30, 2013 ($M) as reported (a) Covenant (b) as reported (a) Covenant (b) as reported (a) Covenant (b) LTM Adj EBITDA $778.9 $840.3 (c) $712.2 $753.3 (c) $656.9 $683.1 (c) Net Debt Rockwood Term Loans 924.1 924.1 911.0 911.0 911.0 911.0 TiO2 Venture Term Loans 514.5 501.7 - - - - Other Debt 63.1 56.9 61.0 56.8 62.6 57.8 Sr. Sub. Notes 1,250.0 - 1,250.0 - 1,250.0 - Total Debt $2,751.8 $1,482.7 $2,222.0 $967.8 $2,223.6 $968.8 Cash (1,273.6) (200.0) (491.1) (200.0) (321.7) (200.0) Net Debt $1,478.2 $1,282.7 $1,730.9 $767.8 $1,901.9 $768.8 Net Debt / LTM Adj. EBITDA 1.90 x 2.43 x 2.90 x Covenant - as calculated 1.53 x 1.02 x 1.13 x - with full cash 0.25 x 0.63 x 0.95 x Covenant per Credit Agreement 2.75 x 2.75 x 2.75 x (b) Covenant leverage ratio calculation under senior credit agreement for Rockwood Specialties Group, Inc. is net secured debt to LTM Adjusted EBITDA and specifies a maximum level of cash at $200 million. For covenant purposes, Euro denominated debt is converted at the average Euro-rate during the LTM (c) Excludes Adjusted EBITDA from certain subsidiaries and joint ventures and stock-based compensation expenses; includes proforma Adjusted EBITDA as well as anticipated synergies for acquired businesses. period ($1.29 for all periods presented). (a) All Euro denominated debt is converted at the December 31 balance sheet rate ($1.32 at Dec. 31, 2012, $1.28 at Mar. 31, 2013 and $1.30 at Jun. 30, 2013) |
|
|
Net Debt / LTM Adjusted EBITDA Note: Net Debt is total debt less total cash. LTM Adjusted EBITDA is calculated as set forth in the leverage ratio under the senior secured credit agreement for Rockwood Specialties Group, Inc. |
|
|
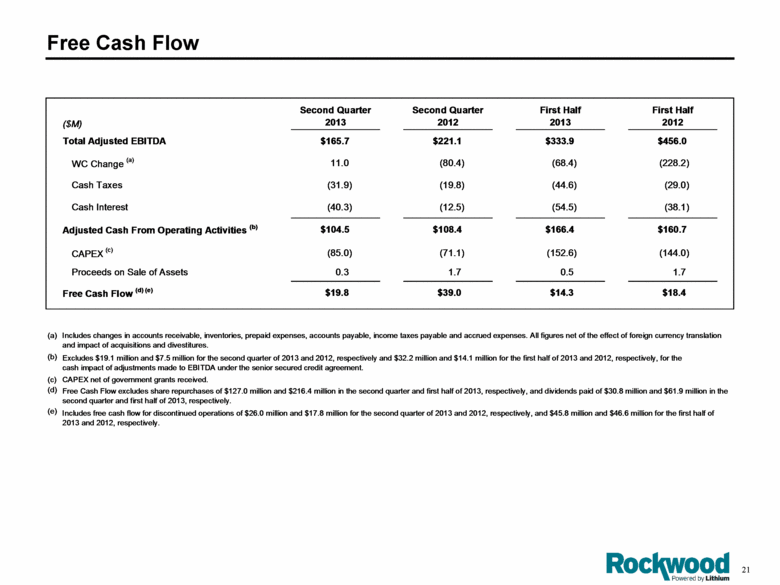
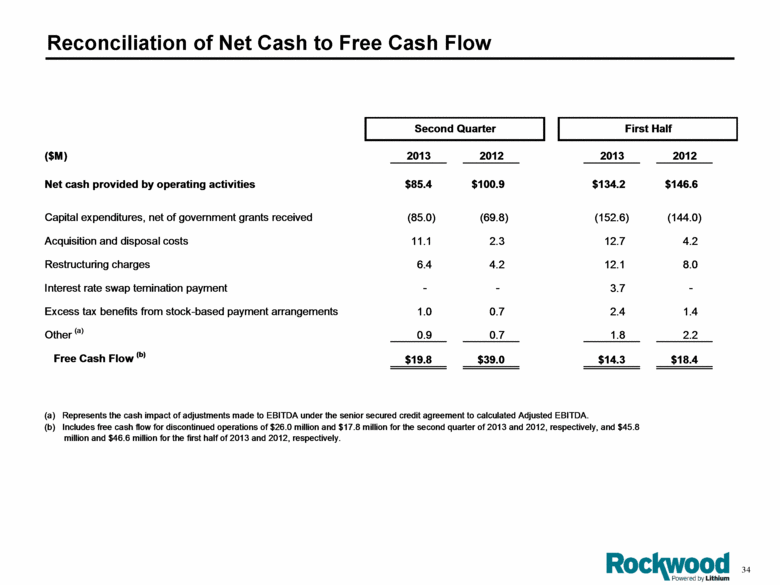
Free Cash Flow ($M) Second Quarter 2013 Second Quarter 2012 First Half 2013 First Half 2012 Total Adjusted EBITDA $165.7 $221.1 $333.9 $456.0 WC Change (a) 11.0 (80.4) (68.4) (228.2) Cash Taxes (31.9) (19.8) (44.6) (29.0) Cash Interest (40.3) (12.5) (54.5) (38.1) Adjusted Cash From Operating Activities (b) $104.5 $108.4 $166.4 $160.7 CAPEX (c) (85.0) (71.1) (152.6) (144.0) Proceeds on Sale of Assets 0.3 1.7 0.5 1.7 Free Cash Flow (d) (e) $19.8 $39.0 $14.3 $18.4 (a) (b) (c) CAPEX net of government grants received. (d) (e) Includes changes in accounts receivable, inventories, prepaid expenses, accounts payable, income taxes payable and accrued expenses. All figures net of the effect of foreign currency translation and impact of acquisitions and divestitures. Free Cash Flow excludes share repurchases of $127.0 million and $216.4 million in the second quarter and first half of 2013, respectively, and dividends paid of $30.8 million and $61.9 million in the second quarter and first half of 2013, respectively. Includes free cash flow for discontinued operations of $26.0 million and $17.8 million for the second quarter of 2013 and 2012, respectively, and $45.8 million and $46.6 million for the first half of 2013 and 2012, respectively. Excludes $19.1 million and $7.5 million for the second quarter of 2013 and 2012, respectively and $32.2 million and $14.1 million for the first half of 2013 and 2012, respectively, for the cash impact of adjustments made to EBITDA under the senior secured credit agreement. |
|
|
Summary |
|
|
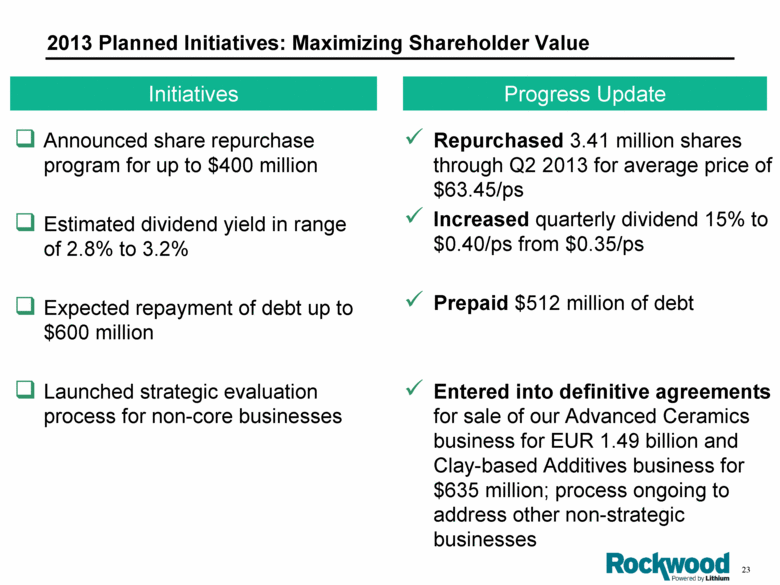
2013 Planned Initiatives: Maximizing Shareholder Value Announced share repurchase program for up to $400 million Estimated dividend yield in range of 2.8% to 3.2% Expected repayment of debt up to $600 million Launched strategic evaluation process for non-core businesses Initiatives Progress Update Repurchased 3.41 million shares through Q2 2013 for average price of $63.45/ps Increased quarterly dividend 15% to $0.40/ps from $0.35/ps Prepaid $512 million of debt Entered into definitive agreements for sale of our Advanced Ceramics business for EUR 1.49 billion and Clay-based Additives business for $635 million; process ongoing to address other non-strategic businesses |
|
|
Appendices |
|
|
Reconciliation of Net Income to Adjusted EBITDA ($M) 2013 2012 2013 2012 Net income attributable to Rockwood Holdings, Inc. shareholders $32.3 $224.9 $51.2 $300.7 Net income (loss) attributable to noncontrolling interest 1.1 8.8 (0.9) 22.7 Net income 33.4 233.7 50.3 323.4 Income tax provision (benefit) 3.6 (117.1) 3.7 (94.9) Income from discontinued operations, net of tax (17.1) (26.5) (38.8) (52.0) Income from continuing operations before taxes 19.9 90.1 15.2 176.5 Interest expense, net 23.4 15.0 52.5 35.4 Depreciation and amortization 54.4 52.5 108.3 105.5 Restructuring and other severance costs 2.7 3.6 9.7 17.8 Systems/organization establishment expenses 0.7 0.4 1.3 2.0 Acquisition and disposal costs 13.5 2.0 16.0 2.0 Loss on early extinguishment/modification of debt - 2.7 17.6 12.4 Asset write-downs and other 4.7 0.2 4.8 0.2 Foreign exchange (gain) loss on financing activities, net (4.3) 6.4 10.9 8.0 Other 1.1 0.5 1.5 2.2 Adjusted EBITDA from continuing operations $116.1 $173.4 $237.8 $362.0 Discontinued Operations - Advanced Ceramics 49.6 47.7 96.1 94.0 Total Adjusted EBITDA $165.7 $221.1 $333.9 $456.0 First Half Second Quarter |
|
|
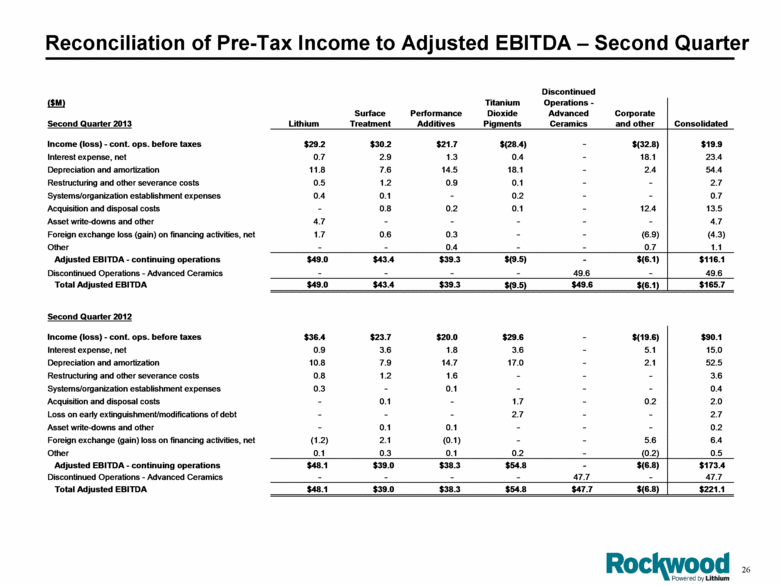
Reconciliation of Pre-Tax Income to Adjusted EBITDA – Second Quarter Discontinued ($M) Titanium Operations - Surface Performance Dioxide Advanced Corporate Second Quarter 2013 Lithium Treatment Additives Pigments Ceramics and other Consolidated Income (loss) - cont. ops. before taxes $29.2 $30.2 $21.7 $(28.4) - $(32.8) $19.9 Interest expense, net 0.7 2.9 1.3 0.4 - 18.1 23.4 Depreciation and amortization 11.8 7.6 14.5 18.1 - 2.4 54.4 Restructuring and other severance costs 0.5 1.2 0.9 0.1 - - 2.7 Systems/organization establishment expenses 0.4 0.1 - 0.2 - - 0.7 Acquisition and disposal costs - 0.8 0.2 0.1 - 12.4 13.5 Asset write-downs and other 4.7 - - - - - 4.7 Foreign exchange loss (gain) on financing activities, net 1.7 0.6 0.3 - - (6.9) (4.3) Other - - 0.4 - - 0.7 1.1 Adjusted EBITDA - continuing operations $49.0 $43.4 $39.3 $(9.5) - $(6.1) $116.1 Discontinued Operations - Advanced Ceramics - - - - 49.6 - 49.6 Total Adjusted EBITDA $49.0 $43.4 $39.3 $(9.5) $49.6 $(6.1) $165.7 Second Quarter 2012 Income (loss) - cont. ops. before taxes $36.4 $23.7 $20.0 $29.6 - $(19.6) $90.1 Interest expense, net 0.9 3.6 1.8 3.6 - 5.1 15.0 Depreciation and amortization 10.8 7.9 14.7 17.0 - 2.1 52.5 Restructuring and other severance costs 0.8 1.2 1.6 - - - 3.6 Systems/organization establishment expenses 0.3 - 0.1 - - - 0.4 Acquisition and disposal costs - 0.1 - 1.7 - 0.2 2.0 Loss on early extinguishment/modifications of debt - - - 2.7 - - 2.7 Asset write-downs and other - 0.1 0.1 - - - 0.2 Foreign exchange (gain) loss on financing activities, net (1.2) 2.1 (0.1) - - 5.6 6.4 Other 0.1 0.3 0.1 0.2 - (0.2) 0.5 Adjusted EBITDA - continuing operations $48.1 $39.0 $38.3 $54.8 - $(6.8) $173.4 Discontinued Operations - Advanced Ceramics - - - - 47.7 - 47.7 Total Adjusted EBITDA $48.1 $39.0 $38.3 $54.8 $47.7 $(6.8) $221.1 |
|
|
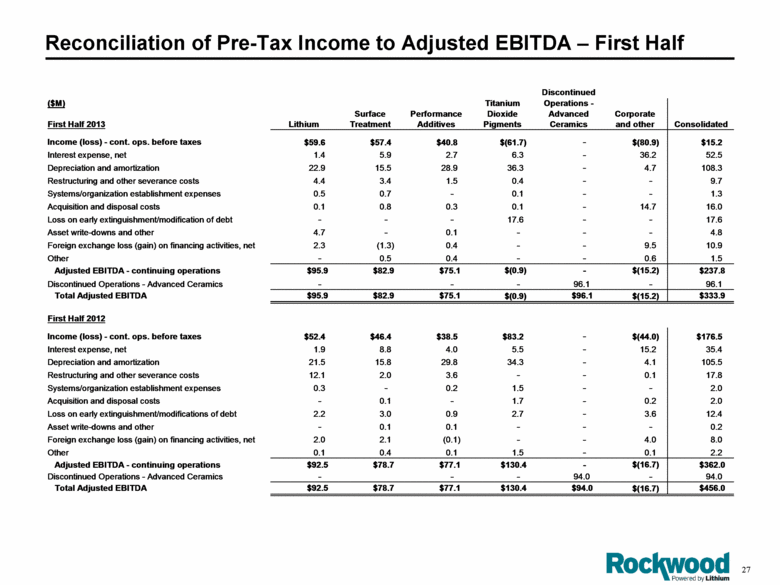
Reconciliation of Pre-Tax Income to Adjusted EBITDA – First Half Discontinued ($M) Titanium Operations - Surface Performance Dioxide Advanced Corporate First Half 2013 Lithium Treatment Additives Pigments Ceramics and other Consolidated Income (loss) - cont. ops. before taxes $59.6 $57.4 $40.8 $(61.7) - $(80.9) $15.2 Interest expense, net 1.4 5.9 2.7 6.3 - 36.2 52.5 Depreciation and amortization 22.9 15.5 28.9 36.3 - 4.7 108.3 Restructuring and other severance costs 4.4 3.4 1.5 0.4 - - 9.7 Systems/organization establishment expenses 0.5 0.7 - 0.1 - - 1.3 Acquisition and disposal costs 0.1 0.8 0.3 0.1 - 14.7 16.0 Loss on early extinguishment/modification of debt - - - 17.6 - - 17.6 Asset write-downs and other 4.7 - 0.1 - - - 4.8 Foreign exchange loss (gain) on financing activities, net 2.3 (1.3) 0.4 - - 9.5 10.9 Other - 0.5 0.4 - - 0.6 1.5 Adjusted EBITDA - continuing operations $95.9 $82.9 $75.1 $(0.9) - $(15.2) $237.8 Discontinued Operations - Advanced Ceramics - - - 96.1 - 96.1 Total Adjusted EBITDA $95.9 $82.9 $75.1 $(0.9) $96.1 $(15.2) $333.9 First Half 2012 Income (loss) - cont. ops. before taxes $52.4 $46.4 $38.5 $83.2 - $(44.0) $176.5 Interest expense, net 1.9 8.8 4.0 5.5 - 15.2 35.4 Depreciation and amortization 21.5 15.8 29.8 34.3 - 4.1 105.5 Restructuring and other severance costs 12.1 2.0 3.6 - - 0.1 17.8 Systems/organization establishment expenses 0.3 - 0.2 1.5 - - 2.0 Acquisition and disposal costs - 0.1 - 1.7 - 0.2 2.0 Loss on early extinguishment/modifications of debt 2.2 3.0 0.9 2.7 - 3.6 12.4 Asset write-downs and other - 0.1 0.1 - - - 0.2 Foreign exchange loss (gain) on financing activities, net 2.0 2.1 (0.1) - - 4.0 8.0 Other 0.1 0.4 0.1 1.5 - 0.1 2.2 Adjusted EBITDA - continuing operations $92.5 $78.7 $77.1 $130.4 - $(16.7) $362.0 Discontinued Operations - Advanced Ceramics - - - 94.0 - 94.0 Total Adjusted EBITDA $92.5 $78.7 $77.1 $130.4 $94.0 $(16.7) $456.0 |
|
|
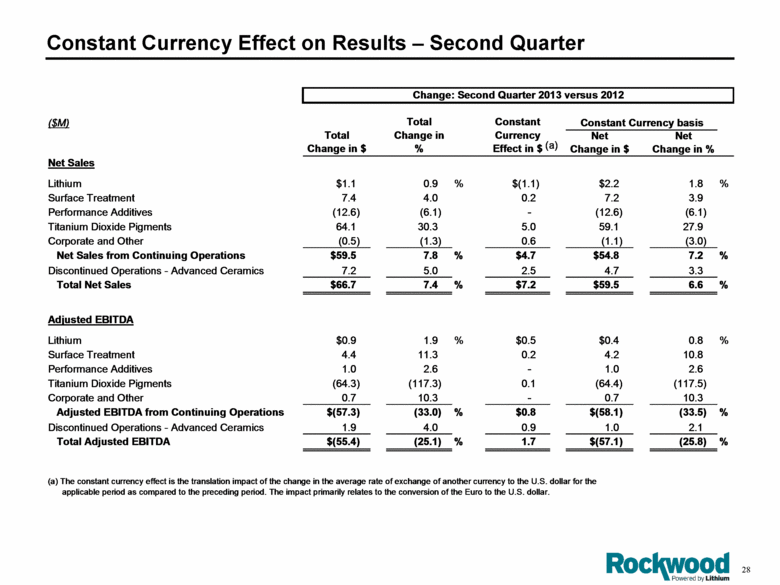
Constant Currency Effect on Results – Second Quarter ($M) Constant Currency basis Net Change in $ Net Change in % Net Sales Lithium $1.1 0.9 % $(1.1) $2.2 1.8 % Surface Treatment 7.4 4.0 0.2 7.2 3.9 Performance Additives (12.6) (6.1) - (12.6) (6.1) Titanium Dioxide Pigments 64.1 30.3 5.0 59.1 27.9 Corporate and Other (0.5) (1.3) 0.6 (1.1) (3.0) Net Sales from Continuing Operations $59.5 7.8 % $4.7 $54.8 7.2 % Discontinued Operations - Advanced Ceramics 7.2 5.0 2.5 4.7 3.3 Total Net Sales $66.7 7.4 % $7.2 $59.5 6.6 % Adjusted EBITDA Lithium $0.9 1.9 % $0.5 $0.4 0.8 % Surface Treatment 4.4 11.3 0.2 4.2 10.8 Performance Additives 1.0 2.6 - 1.0 2.6 Titanium Dioxide Pigments (64.3) (117.3) 0.1 (64.4) (117.5) Corporate and Other 0.7 10.3 - 0.7 10.3 Adjusted EBITDA from Continuing Operations $(57.3) (33.0) % $0.8 $(58.1) (33.5) % Discontinued Operations - Advanced Ceramics 1.9 4.0 0.9 1.0 2.1 Total Adjusted EBITDA $(55.4) (25.1) % 1.7 $(57.1) (25.8) % Change: Second Quarter 2013 versus 2012 (a) The constant currency effect is the translation impact of the change in the average rate of exchange of another currency to the U.S. dollar for the applicable period as comp ared to the preceding period. The impact primarily relates to the conversion of the Euro to the U.S. dollar. Constant Currency Effect in $ Total Change in % Total Change in $ (a) (a) (a) |
|
|
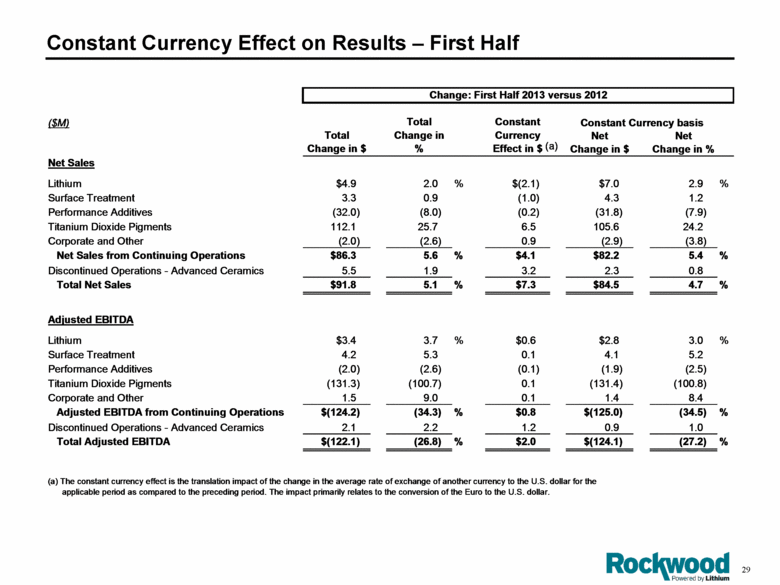
Constant Currency Effect on Results – First Half ($M) Constant Currency basis Net Change in $ Net Change in % Net Sales Lithium $4.9 2.0 % $(2.1) $7.0 2.9 % Surface Treatment 3.3 0.9 (1.0) 4.3 1.2 Performance Additives (32.0) (8.0) (0.2) (31.8) (7.9) Titanium Dioxide Pigments 112.1 25.7 6.5 105.6 24.2 Corporate and Other (2.0) (2.6) 0.9 (2.9) (3.8) Net Sales from Continuing Operations $86.3 5.6 % $4.1 $82.2 5.4 % Discontinued Operations - Advanced Ceramics 5.5 1.9 3.2 2.3 0.8 Total Net Sales $91.8 5.1 % $7.3 $84.5 4.7 % Adjusted EBITDA Lithium $3.4 3.7 % $0.6 $2.8 3.0 % Surface Treatment 4.2 5.3 0.1 4.1 5.2 Performance Additives (2.0) (2.6) (0.1) (1.9) (2.5) Titanium Dioxide Pigments (131.3) (100.7) 0.1 (131.4) (100.8) Corporate and Other 1.5 9.0 0.1 1.4 8.4 Adjusted EBITDA from Continuing Operations $(124.2) (34.3) % $0.8 $(125.0) (34.5) % Discontinued Operations - Advanced Ceramics 2.1 2.2 1.2 0.9 1.0 Total Adjusted EBITDA $(122.1) (26.8) % $2.0 $(124.1) (27.2) % Change: First Half 2013 versus 2012 (a) The constant currency effect is the translation impact of the change in the average rate of exchange of another currency to the U.S. dollar for the applicable period as compared to the preceding period. The impact primarily relates to the conversion of the Euro to the U.S. dollar. Total Change in $ Total Change in % Constant Currency Effect in $ (a) (a) (a) (a) |
|
|
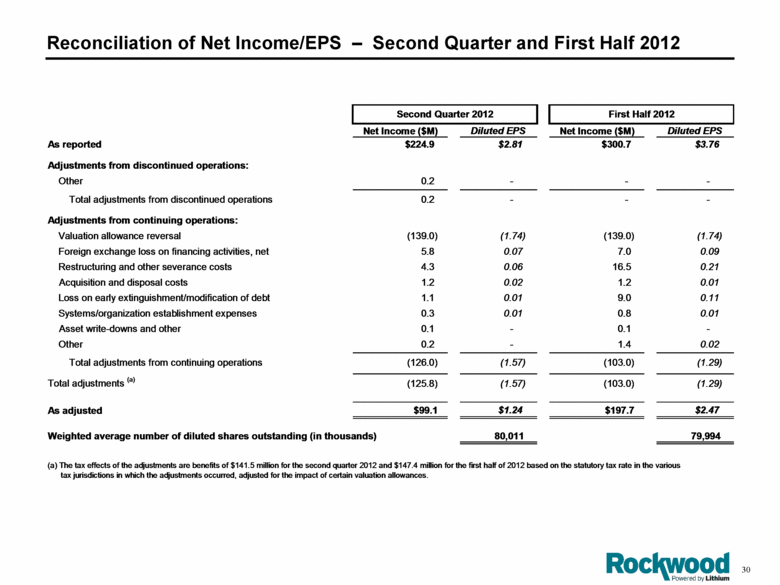
Reconciliation of Net Income/EPS – Second Quarter and First Half 2012 Net Income ($M) Diluted EPS Net Income ($M) Diluted EPS As reported $224.9 $2.81 $300.7 $3.76 Adjustments from discontinued operations: Other 0.2 - - - Total adjustments from discontinued operations 0.2 - - - Adjustments from continuing operations: Valuation allowance reversal (139.0) (1.74) (139.0) (1.74) Foreign exchange loss on financing activities, net 5.8 0.07 7.0 0.09 Restructuring and other severance costs 4.3 0.06 16.5 0.21 Acquisition and disposal costs 1.2 0.02 1.2 0.01 Loss on early extinguishment/modification of debt 1.1 0.01 9.0 0.11 Systems/organization establishment expenses 0.3 0.01 0.8 0.01 Asset write-downs and other 0.1 - 0.1 - Other 0.2 - 1.4 0.02 Total adjustments from continuing operations (126.0) (1.57) (103.0) (1.29) Total adjustments (a) (125.8) (1.57) (103.0) (1.29) As adjusted $99.1 $1.24 $197.7 $2.47 Weighted average number of diluted shares outstanding (in thousands) 80,011 79,994 Second Quarter 2012 First Half 2012 (a) The tax effects of the adjustments are benefits of $141.5 million for the second quarter 2012 and $147.4 million for the first half of 2012 based on the statutory tax rate in the various tax jurisdictions in which the adjustments occurred, adjusted for the impact of certain valuation allowances. (a) (a) (b) (c) (a) (a) (a) |
|
|
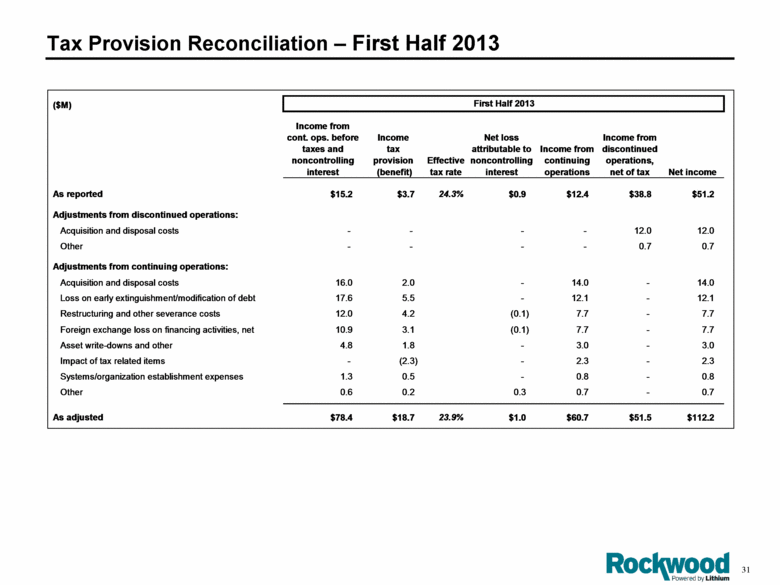
Tax Provision Reconciliation – First Half 2013 ($M) Income from cont. ops. before taxes and noncontrolling interest Income tax provision (benefit) Effective tax rate Net loss attributable to noncontrolling interest Income from continuing operations Income from discontinued operations, net of tax Net income As reported $15.2 $3.7 24.3% $0.9 $12.4 $38.8 $51.2 Adjustments from discontinued operations: Acquisition and disposal costs - - - - 12.0 12.0 Other - - - - 0.7 0.7 Adjustments from continuing operations: Acquisition and disposal costs 16.0 2.0 - 14.0 - 14.0 Loss on early extinguishment/modification of debt 17.6 5.5 - 12.1 - 12.1 Restructuring and other severance costs 12.0 4.2 (0.1) 7.7 - 7.7 Foreign exchange loss on financing activities, net 10.9 3.1 (0.1) 7.7 - 7.7 Asset write-downs and other 4.8 1.8 - 3.0 - 3.0 Impact of tax related items - (2.3) - 2.3 - 2.3 Systems/organization establishment expenses 1.3 0.5 - 0.8 - 0.8 Other 0.6 0.2 0.3 0.7 - 0.7 As adjusted $78.4 $18.7 23.9% $1.0 $60.7 $51.5 $112.2 First Half 2013 (a) |
|
|
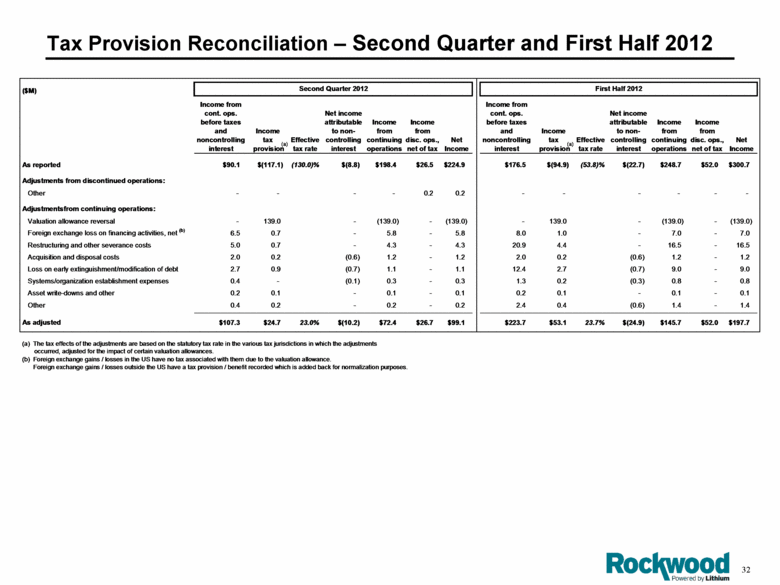
Tax Provision Reconciliation – Second Quarter and First Half 2012 ($M) Income from cont. ops. before taxes and noncontrolling interest Income tax provision Effective tax rate Net income attributable to non- controlling interest Income from continuing operations Income from disc. ops., net of tax Net Income Income from cont. ops. before taxes and noncontrolling interest Income tax provision Effective tax rate Net income attributable to non- controlling interest Income from continuing operations Income from disc. ops., net of tax Net Income As reported $90.1 $(117.1) (130.0)% $(8.8) $198.4 $26.5 $224.9 $176.5 $(94.9) (53.8)% $(22.7) $248.7 $52.0 $300.7 Adjustments from discontinued operations: Other - - - - 0.2 0.2 - - - - - - Adjustmentsfrom continuing operations: Valuation allowance reversal - 139.0 - (139.0) - (139.0) - 139.0 - (139.0) - (139.0) Foreign exchange loss on financing activities, net (b) 6.5 0.7 - 5.8 - 5.8 8.0 1.0 - 7.0 - 7.0 Restructuring and other severance costs 5.0 0.7 - 4.3 - 4.3 20.9 4.4 - 16.5 - 16.5 Acquisition and disposal costs 2.0 0.2 (0.6) 1.2 - 1.2 2.0 0.2 (0.6) 1.2 - 1.2 Loss on early extinguishment/modification of debt 2.7 0.9 (0.7) 1.1 - 1.1 12.4 2.7 (0.7) 9.0 - 9.0 Systems/organization establishment expenses 0.4 - (0.1) 0.3 - 0.3 1.3 0.2 (0.3) 0.8 - 0.8 Asset write-downs and other 0.2 0.1 - 0.1 - 0.1 0.2 0.1 - 0.1 - 0.1 Other 0.4 0.2 - 0.2 - 0.2 2.4 0.4 (0.6) 1.4 - 1.4 As adjusted $107.3 $24.7 23.0% $(10.2) $72.4 $26.7 $99.1 $223.7 $53.1 23.7% $(24.9) $145.7 $52.0 $197.7 (b) Foreign exchange gains / losses in the US have no tax associated with them due to the valuation allowance. Foreign exchange gains / losses outside the US have a tax provision / benefit recorded which is added back for normalization purposes. (a) The tax effects of the adjustments are based on the statutory tax rate in the various tax jurisdictions in which the adjustments occurred, adjusted for the impact of certain valuation allowances. Second Quarter 2012 First Half 2012 (a) (a) |
|
|
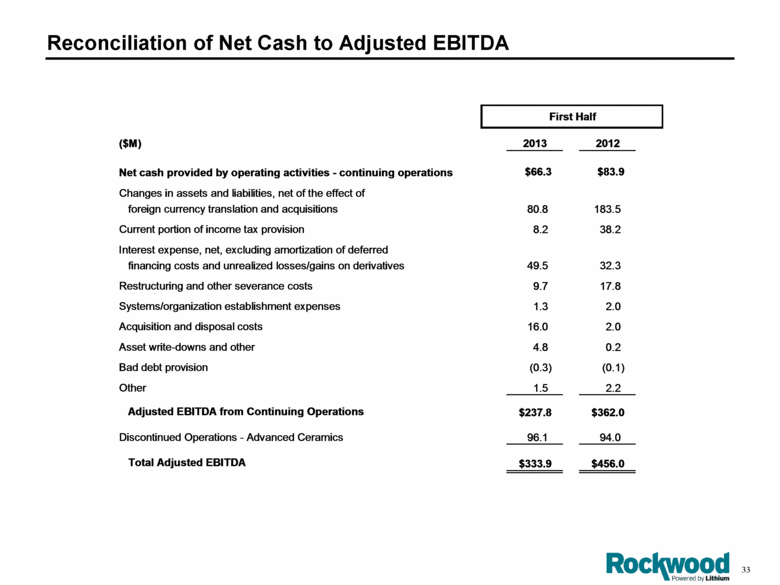
Reconciliation of Net Cash to Adjusted EBITDA First Half Full Year ($M) 2013 2012 Net cash provided by operating activities - continuing operations $66.3 $83.9 Changes in assets and liabilities, net of the effect of foreign currency translation and acquisitions 80.8 183.5 Current portion of income tax provision 8.2 38.2 Interest expense, net, excluding amortization of deferred financing costs and unrealized losses/gains on derivatives 49.5 32.3 Restructuring and other severance costs 9.7 17.8 Systems/organization establishment expenses 1.3 2.0 Acquisition and disposal costs 16.0 2.0 Asset write-downs and other 4.8 0.2 Bad debt provision (0.3) (0.1) Other 1.5 2.2 Adjusted EBITDA from Continuing Operations $237.8 $362.0 Discontinued Operations - Advanced Ceramics 96.1 94.0 Total Adjusted EBITDA $333.9 $456.0 |
|
|
Reconciliation of Net Cash to Free Cash Flow ($M) 2013 2012 2013 2012 Net cash provided by operating activities $85.4 $100.9 $134.2 $146.6 Capital expenditures, net of government grants received (85.0) (69.8) (152.6) (144.0) Acquisition and disposal costs 11.1 2.3 12.7 4.2 Restructuring charges 6.4 4.2 12.1 8.0 Interest rate swap temination payment - - 3.7 - Excess tax benefits from stock-based payment arrangements 1.0 0.7 2.4 1.4 Other (a) 0.9 0.7 1.8 2.2 Free Cash Flow (b) $19.8 $39.0 $14.3 $18.4 (b) Includes free cash flow for discontinued operations of $26.0 million and $17.8 million for the second quarter of 2013 and 2012, respectively, and $45.8 million and $46.6 million for the first half of 2013 and 2012, respectively. Second Quarter First Half (a) Represents the cash impact of adjustments made to EBITDA under the senior secured credit agreement to calculated Adjusted EBITDA. |
|
|
[LOGO] |