Attached files
| file | filename |
|---|---|
| 8-K - EXELIS INC. 8-K - Exelis Inc. | a50683648.htm |
| EX-99.1 - EXHIBIT 99.1 - Exelis Inc. | a50683648_ex991.htm |
Exhibit 99.2
Second Quarter 2013 Earnings Presentation David Melcher Chief Executive Officer and President Peter Milligan Senior Vice President and Chief Financial Officer August 2, 2013 Exelis
Safe Harbor Statement 2 Safe Harbor Statement under the Private Securities Litigation Reform Act of 1995 (the “Act”): Some of the information included herein includes forward‐looking statements intended to qualify for the safe harbor from liability established by the Private Securities Litigation Reform Act of 1995 (the “Act”). Whenever used, words such as “anticipate,” “estimate,” “expect,” “project,” “intend,” “plan,” “believe,” “target,” “may,” “could,” “outlook” and other terms of similar meaning are intended to identify such forward‐looking statements. Forward‐looking statements are uncertain and to some extent unpredictable, and involve known and unknown risks, uncertainties and other important factors that could cause actual results to differ materially from those expressed in, or implied from, such forward‐looking statements. The company undertakes no obligation to update any forward‐looking statements, whether as a result of new information, future events or otherwise, except as required by law. In addition, forward‐looking statements are subject to certain risks and uncertainties that could cause actual results to differ materially from the company’s historical experience and our present expectations or projections. These risks and uncertainties include, but are not limited to: The forward‐looking statements in this release are made as of the date hereof and the company undertakes no obligation to update any forward‐looking statements, whether as a result of new information, future events or otherwise. In addition, forward‐looking statements are subject to certain risks and uncertainties that could cause actual results to differ materially from the company’s historical experience and our present expectations or projections. These risks and uncertainties include, but are not limited to, those described in the Exelis Inc. Form 10‐K for the fiscal year ended December 31, 2012, and those described from time to time in our future reports filed with the Securities and Exchange Commission. �� Our dependence on the defense industry and the business risks peculiar to that industry, including changing priorities or reductions in the U.S. Government or international defense budgets; �� Government regulations and compliance therewith, including changes to the Department of Defense procurement process; �� Our international operations, including sales to foreign customers; �� Competition, industry capacity and production rates; �� Misconduct of our employees, subcontractors, agents and business partners; �� The level of returns on postretirement benefit plan assets and potential employee benefit plan contributions and other employment and pension matters; �� Changes in interest rates and other factors that affect earnings and cash flows; �� The mix of our contracts and programs, our performance, and our ability to control costs; �� Governmental investigations; �� Our level of indebtedness and our ability to make payments on or service our indebtedness; �� Subcontractor performance; �� Economic and capital markets conditions; �� The availability and pricing of raw materials and components; �� Ability to retain and recruit qualified personnel; �� Protection of intellectual property rights; �� Changes in technology; �� Contingencies related to actual or alleged environmental contamination, claims and concerns; �� Security breaches and other disruptions to our information technology and operations; and �� Unanticipated changes in our tax provisions or exposure to additional income tax liabilities. �� Ability to execute our internal performance plans including restructuring, productivity improvements and cost reduction initiatives
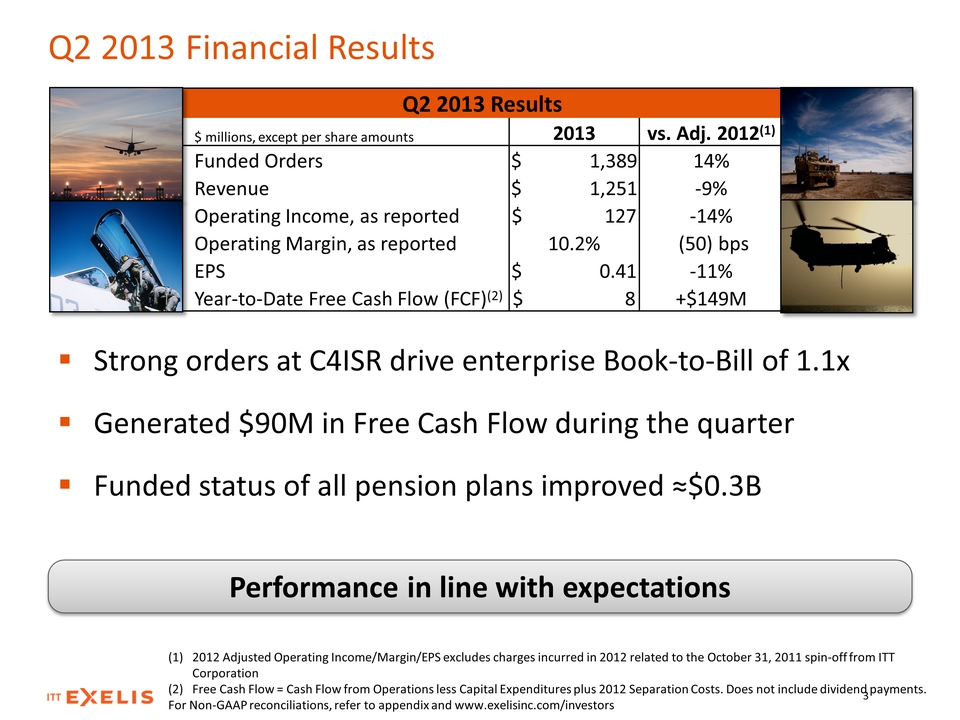
Q2 2013 Financial Results Q2 2013 Results $ millions, except per share amounts 2013 vs. Adj. 2012(1) Funded Orders $ 1,389 14% Revenue $ 1,251 ‐9% Operating Income, as reported $ 127 ‐14% Operating Margin, as reported 10.2% (50) bps EPS $ 0.41 ‐11% Year‐to‐Date Free Cash Flow (FCF)(2) $ 8 +$149M (1) 2012 Adjusted Operating Income/Margin/EPS excludes charges incurred in 2012 related to the October 31, 2011 spin‐off from ITT Corporation (2) Free Cash Flow = Cash Flow from Operations less Capital Expenditures plus 2012 Separation Costs. Does not include dividend payments. For Non‐GAAP reconciliations, refer to appendix and www.exelisinc.com/investors 3 �� Strong orders at C4ISR drive enterprise Book‐to‐Bill of 1.1x �� Generated $90M in Free Cash Flow during the quarter �� Funded status of all pension plans improved ≈$0.3B Performance in line with expectations
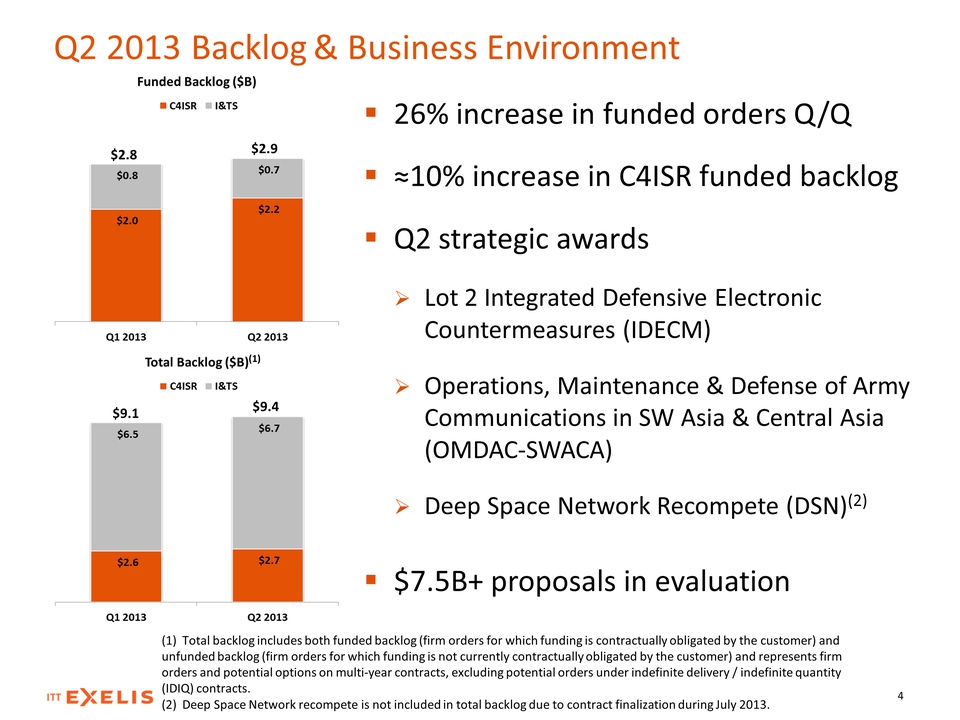
$2.8 $2.9 $9.1 $9.4 Q2 2013 Backlog& Business Environment 4 �� 26% increase in funded orders Q/Q �� ≈10% increase in C4ISR funded backlog �� Q2 strategic awards �� Lot 2 Integrated Defensive Electronic Countermeasures (IDECM) �� Operations, Maintenance & Defense of Army Communications in SW Asia & Central Asia (OMDAC‐SWACA) �� Deep Space Network Recompete (DSN)(2) �� $7.5B+ proposals in evaluation (1) Total backlog includes both funded backlog (firm orders for which funding is contractually obligated by the customer) and unfunded backlog (firm orders for which funding is not currently contractually obligated by the customer) and represents firm orders and potential options on multi‐year contracts, excluding potential orders under indefinite delivery / indefinite quantity (IDIQ) contracts. (2) Deep Space Network recompete is not included in total backlog due to contract finalization during July 2013. (1)
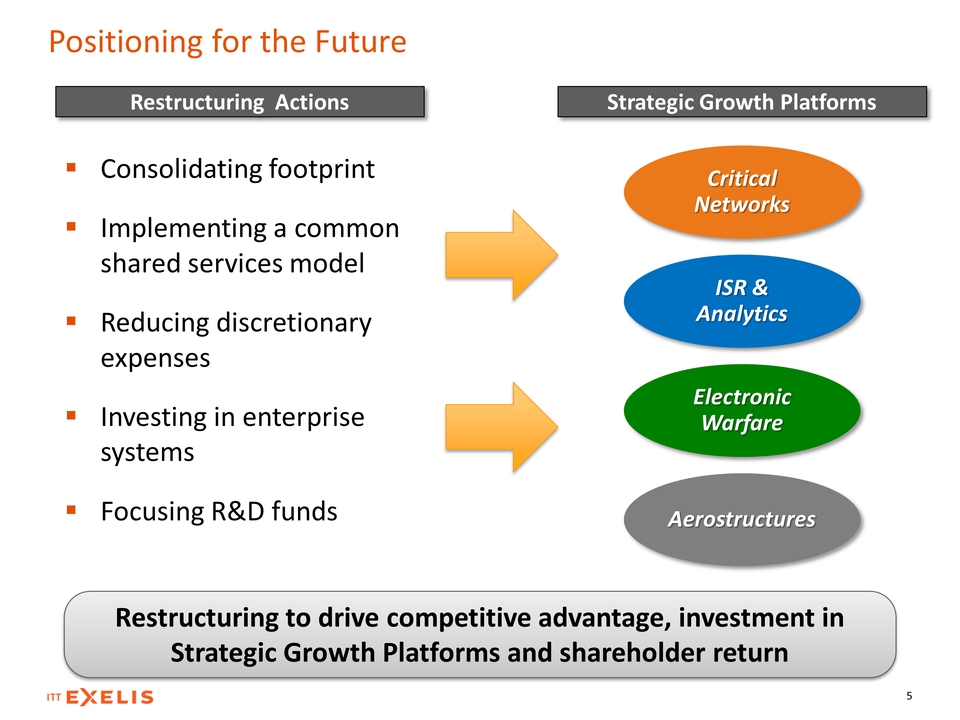
Positioning for the Future 5 Restructuring Actions Strategic Growth Platforms �� Consolidating footprint �� Implementing a common shared services model �� Reducing discretionary expenses �� Investing in enterprise systems �� Focusing R&D funds Electronic Warfare Critical Networks ISR & Analytics Aerostructures Restructuring to drive competitive advantage, investment in Strategic Growth Platforms and shareholder return ‐
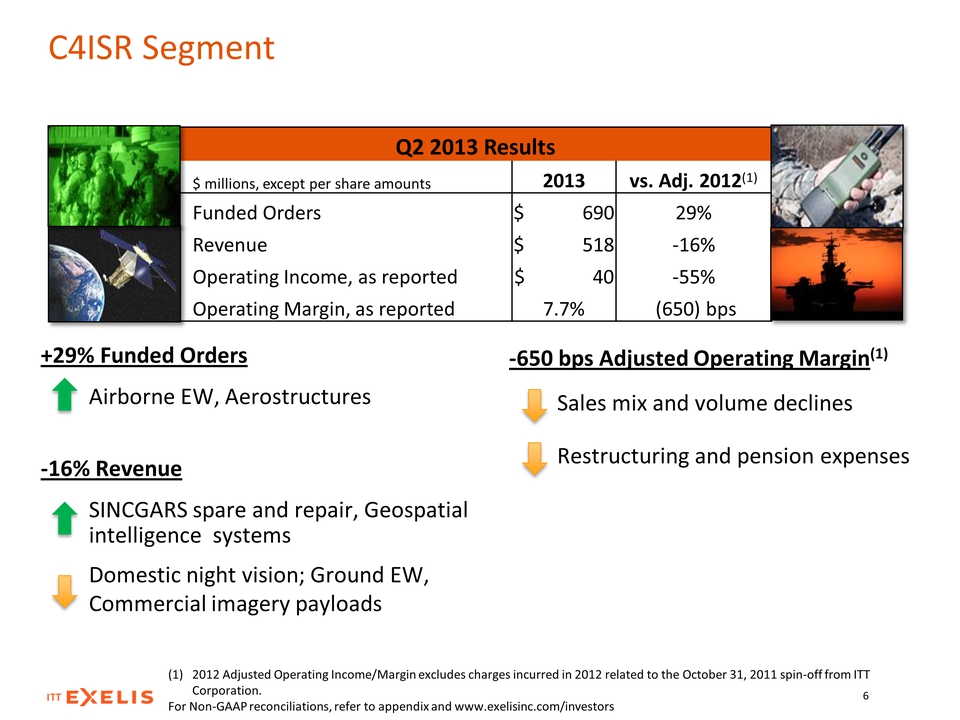
‐650 bps Adjusted Operating Margin(1) Sales mix and volume declines Restructuring and pension expenses +29% Funded Orders Airborne EW, Aerostructures ‐16% Revenue SINCGARS spare and repair, Geospatial intelligence systems Domestic night vision; Ground EW, Commercial imagery payloads C4ISR Segment (1) 2012 Adjusted Operating Income/Margin excludes charges incurred in 2012 related to the October 31, 2011 spin‐off from ITT Corporation. For Non‐GAAP reconciliations, refer to appendix and www.exelisinc.com/investors Q2 2013 Results $ millions, except per share amounts 2013 vs. Adj. 2012(1) Funded Orders $ 690 29% Revenue $ 518 ‐16% Operating Income, as reported $ 40 ‐55% Operating Margin, as reported 7.7% (650) bps 6
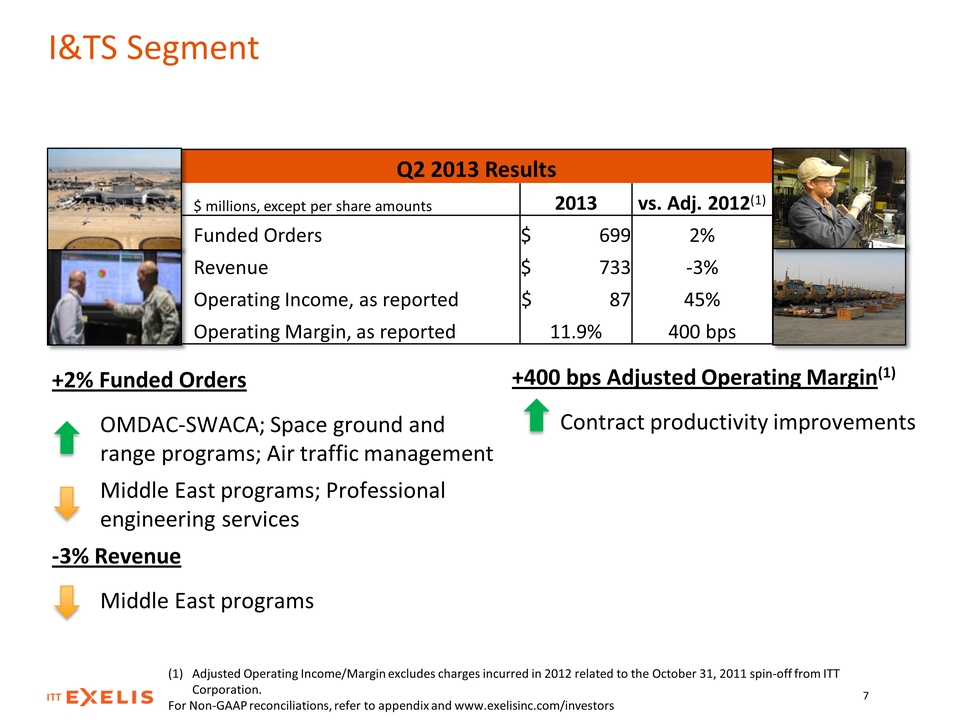
+400 bps Adjusted Operating Margin(1) Contract productivity improvements +2% Funded Orders OMDAC‐SWACA; Space ground and range programs; Air traffic management Middle East programs; Professional engineering services ‐3% Revenue Middle East programs I&TS Segment (1) Adjusted Operating Income/Margin excludes charges incurred in 2012 related to the October 31, 2011 spin‐off from ITT Corporation. For Non‐GAAP reconciliations, refer to appendix and www.exelisinc.com/investors Q2 2013 Results $ millions, except per share amounts 2013 vs. Adj. 2012(1) Funded Orders $ 699 2% Revenue $ 733 ‐3% Operating Income, as reported $ 87 45% Operating Margin, as reported 11.9% 400 bps 7
SUMMARY �� Strong orders and growth in backlog drive confidence in full year expectations �� Proactive pension plan management and market conditions driving pension funded status improvement �� Margin profile expected to normalize in Q3’13 Reaffirming Full Year Outlook 8

Appendix
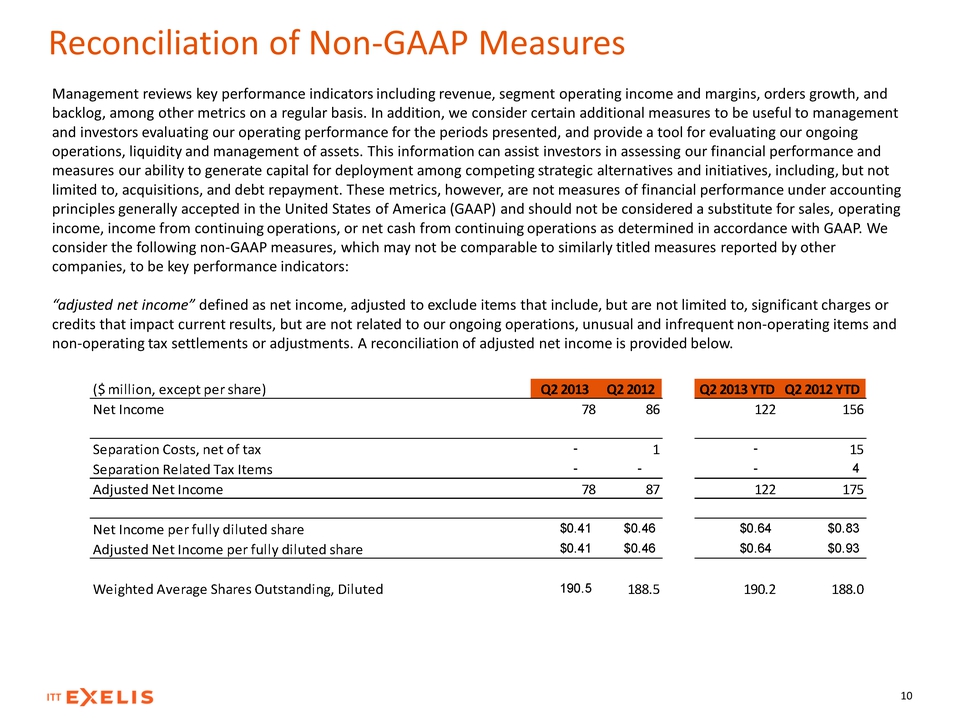
Reconciliation of Non‐GAAP Measures Management reviews key performance indicators including revenue, segment operating income and margins, orders growth, and backlog, among other metrics on a regular basis. In addition, we consider certain additional measures to be useful to management and investors evaluating our operating performance for the periods presented, and provide a tool for evaluating our ongoing operations, liquidity and management of assets. This information can assist investors in assessing our financial performance and measures our ability to generate capital for deployment among competing strategic alternatives and initiatives, including, but not limited to, acquisitions, and debt repayment. These metrics, however, are not measures of financial performance under accounting principles generally accepted in the United States of America (GAAP) and should not be considered a substitute for sales, operating income, income from continuing operations, or net cash from continuing operations as determined in accordance with GAAP. We consider the following non‐GAAP measures, which may not be comparable to similarly titled measures reported by other companies, to be key performance indicators: “adjusted net income” defined as net income, adjusted to exclude items that include, but are not limited to, significant charges or credits that impact current results, but are not related to our ongoing operations, unusual and infrequent non‐operating items and non‐operating tax settlements or adjustments. A reconciliation of adjusted net income is provided below. 10 ($ million, except per share) Q2 2013 Q2 2012 Q2 2013 YTD Q2 2012 YTD Net Income 78 86 122 156 Separation Costs, net of tax - 1 – 15 Separation Related Tax Items - - - 4 Adjusted Net Income 78 87 122 175 Net Income per fully diluted share $0.41 $0.46 $0.64 $0.83 Adjusted Net Income per fully diluted share $0.41 $0.46 $0.64 $0.93 Weighted Average Shares Outstanding, Diluted 190.5 188.5 190.2 188.0
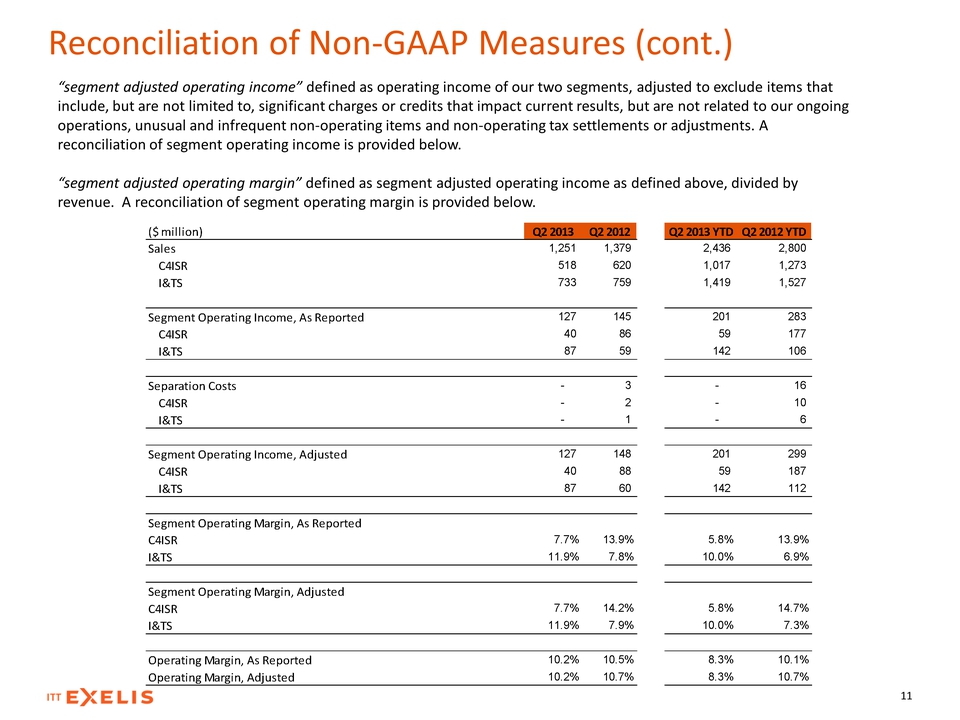
Reconciliation of Non‐GAAP Measures (cont.) “segment adjusted operating income” defined as operating income of our two segments, adjusted to exclude items that include, but are not limited to, significant charges or credits that impact current results, but are not related to our ongoing operations, unusual and infrequent non‐operating items and non‐operating tax settlements or adjustments. A reconciliation of segment operating income is provided below. “segment adjusted operating margin” defined as segment adjusted operating income as defined above, divided by revenue. A reconciliation of segment operating margin is provided below. 11 ($ million) Q2 2013 Q2 2012 Q2 2013 YTD Q2 2012 YTD Sales 1,251 1,379 2,436 2,800 C4ISR 518 620 1,017 1,273 I&TS 733 759 1,419 1,527 Segment Operating Income, As Reported 127 145 201 283 C4ISR 40 86 59 177 I&TS 87 59 142 106 Separation Costs - 3 – 16 C4ISR - 2 - 10 I&TS - 1 – 6 Segment Operating Income, Adjusted 127 148 201 299 C4ISR 40 88 59 187 I&TS 87 60 142 112 Segment Operating Margin, As Reported C4ISR 7.7% 13.9% 5.8% 13.9% I&TS 11.9% 7.8% 10.0% 6.9% Segment Operating Margin, Adjusted C4ISR 7.7% 14.2% 5.8% 14.7% I&TS 11.9% 7.9% 10.0% 7.3% Operating Margin, As Reported 10.2% 10.5% 8.3% 10.1% Operating Margin, Adjusted 10.2% 10.7% 8.3% 10.7%
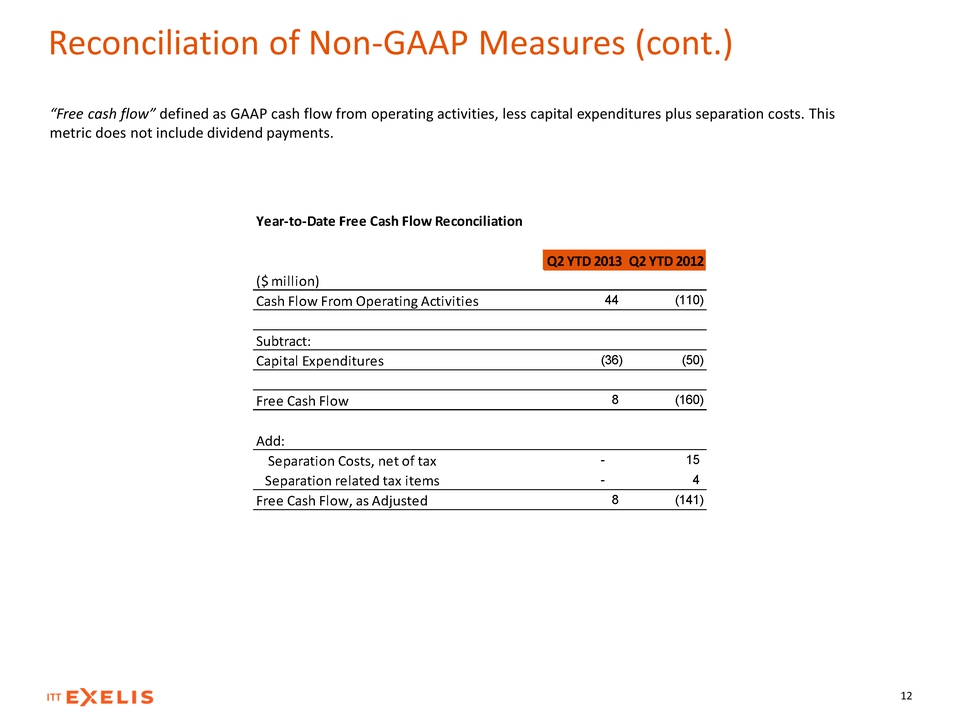
Reconciliation of Non‐GAAP Measures (cont.) “Free cash flow” defined as GAAP cash flow from operating activities, less capital expenditures plus separation costs. This metric does not include dividend payments. 12 Year‐to‐Date Free Cash Flow Reconciliation Q2 YTD 2013 Q2 YTD 2012 ($ million) Cash Flow From Operating Activities 44 (110) Subtract: Capital Expenditures (36) (50) Free Cash Flow 8 (160) Add: Separation Costs, net of tax – 15 Separation related tax items – 4 Free Cash Flow, as Adjusted 8 (141)
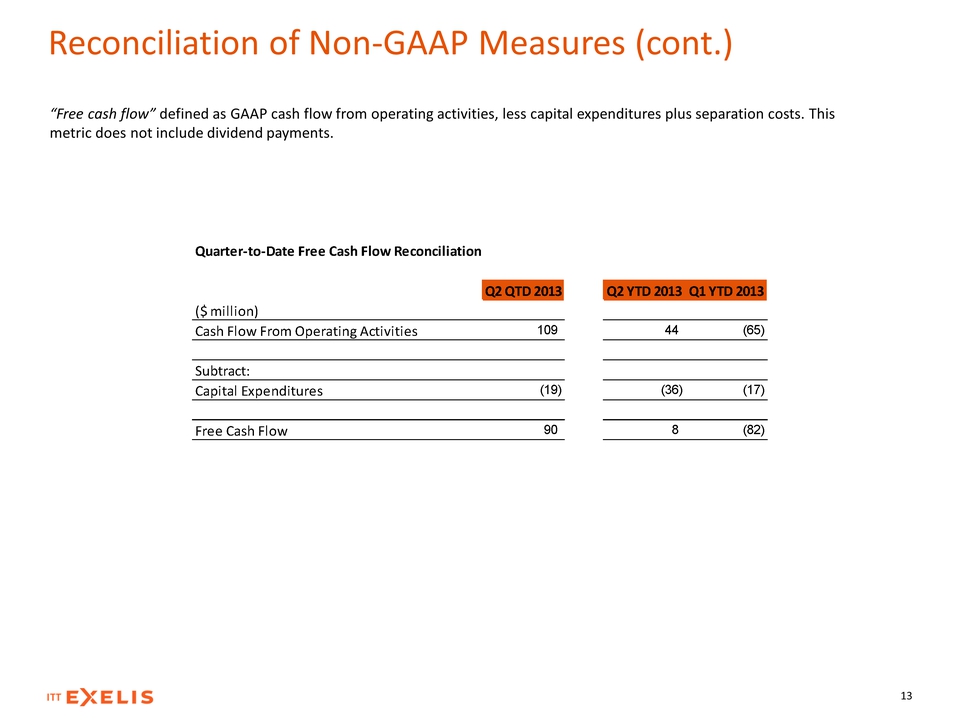
Reconciliation of Non‐GAAP Measures (cont.) “Free cash flow” defined as GAAP cash flow from operating activities, less capital expenditures plus separation costs. This metric does not include dividend payments. 13 Quarter‐to‐Date Free Cash Flow Reconciliation Q2 QTD 2013 Q2 YTD 2013 Q1 YTD 2013 ($ million) Cash Flow From Operating Activities 109 44 (65) Subtract: Capital Expenditures (19) (36) (17) Free Cash Flow 90 8 (82)