Attached files
| file | filename |
|---|---|
| 8-K - 8-K - Cloud Peak Energy Resources LLC | a13-17142_28k.htm |
Exhibit 99.1
|
|
INVESTOR PRESENTATION August 2013 |

|
|
1 Cloud Peak Energy Inc. Financial Data Cloud Peak Energy Inc. is the sole owner of Cloud Peak Energy Resources LLC. Unless expressly stated otherwise in this presentation, all financial data included herein is consolidated financial data of Cloud Peak Energy Inc. Cautionary Note Regarding Forward-Looking Statements This presentation contains “forward-looking statements” within the meaning of the safe harbor provisions of Section 27A of the Securities Act of 1933 and Section 21E of the Securities Exchange Act of 1934. Forward-looking statements are not statements of historical facts, and often contain words such as “may,” “will,” “expect,” “believe,” “anticipate,” “plan,” “estimate,” “seek,” “could,” “should,” “intend,” “potential,” or words of similar meaning. Forward-looking statements are based on management’s current expectations, beliefs, assumptions and estimates regarding our company, industry, economic conditions, government regulations, energy policies and other factors. These statements are subject to significant risks, uncertainties and assumptions that are difficult to predict and could cause actual results to differ materially and adversely from those expressed or implied in the forward-looking statements. For a description of some of the risks and uncertainties that may adversely affect our future results, refer to the risk factors described from time to time in the reports and registration statements we file with the Securities and Exchange Commission, including those in Item 1A "Risk Factors" of our most recent Form 10-K and any updates thereto in our Forms 10-Q and current reports on Forms 8-K. There may be other risks and uncertainties that are not currently known to us or that we currently believe are not material. We make forward-looking statements based on currently available information, and we assume no obligation to, and expressly disclaim any obligation to, update or revise publicly any forward-looking statements made in our presentation, whether as a result of new information, future events or otherwise, except as required by law. Non-GAAP Financial Measures This presentation includes the non-GAAP financial measures of (1) Adjusted EBITDA (on a consolidated basis and for our reporting segments) and (2) Adjusted Earnings Per Share (“Adjusted EPS”). Adjusted EBITDA and Adjusted EPS are intended to provide additional information only and do not have any standard meaning prescribed by generally accepted accounting principles in the U.S. (“GAAP”). A quantitative reconciliation of historical net income to Adjusted EBITDA and EPS (as defined below) to Adjusted EPS is found in the tables accompanying this presentation. EBITDA represents net income, or income from continuing operations, as applicable, before (1) interest income (expense) net, (2) income tax provision, (3) depreciation and depletion, (4) amortization, and (5) accretion. Adjusted EBITDA represents EBITDA as further adjusted to exclude specifically identified items that management believes do not directly reflect our core operations. For the periods presented herein, the specifically identified items are: (1) adjustments to exclude the updates to the tax agreement liability, including tax impacts of our 2009 initial public offering and 2010 secondary offering, (2) adjustments for derivative financial instruments, excluding fair value mark-to-market gains or losses and including cash amounts received or paid, and (3) adjustments to exclude a significant broker contract that expired in the first quarter of 2010. Because of the inherent uncertainty related to the items identified above, management does not believe it is able to provide a meaningful forecast of the comparable GAAP measures or a reconciliation to any forecasted GAAP measures. Adjusted EBITDA is an additional tool intended to assist our management in comparing our performance on a consistent basis for purposes of business decision-making by removing the impact of certain items that management believes do not directly reflect our core operations. Adjusted EBITDA is a metric intended to assist management in evaluating operating performance, comparing performance across periods, planning and forecasting future business operations and helping determine levels of operating and capital investments. Period-to-period comparisons of Adjusted EBITDA are intended to help our management identify and assess additional trends potentially impacting our company that may not be shown solely by period-to-period comparisons of net income or income from continuing operations. Our chief operating decision maker uses Adjusted EBITDA as a measure of segment performance. Consolidated Adjusted EBITDA is also used as part of our incentive compensation program for our executive officers and others. We believe Adjusted EBITDA and Adjusted EPS are also useful to investors, analysts and other external users of our consolidated financial statements in evaluating our operating performance from period to period and comparing our performance to similar operating results of other relevant companies. Adjusted EBITDA allows investors to measure a company’s operating performance without regard to items such as interest expense, taxes, depreciation and depletion, amortization and accretion and other specifically identified items that are not considered to directly reflect our core operations. Similarly, we believe our use of Adjusted EPS provides an appropriate measure to use in assessing our performance across periods given that this measure provides an adjustment for certain specifically identified significant items that are not considered to directly reflect our core operations, the magnitude of which may vary significantly from period to period and, thereby, have a disproportionate effect on the earnings per share reported for a given period. Our management recognizes that using Adjusted EBITDA and Adjusted EPS as performance measures has inherent limitations as compared to net income, income from continuing operations, EPS or other GAAP financial measures, as these non-GAAP measures exclude certain items, including items that are recurring in nature, which may be meaningful to investors. Adjusted EBITDA and Adjusted EPS should not be considered in isolation and do not purport to be alternatives to net income, income from continuing operations, EPS or other GAAP financial measures as a measure of our operating performance. Because not all companies use identical calculations, our presentations of Adjusted EBITDA and Adjusted EPS may not be comparable to other similarly titled measures of other companies. Moreover, our presentation of Adjusted EBITDA is different than EBITDA as defined in our debt financing agreements. |
|
|
2 Cloud Peak Energy Profile One of the largest U.S. coal producers 2012 coal shipments from Owned and Operated Mines of 90.6 million tons 2012 proven & probable reserves of 1.3 billion tons Only pure-play PRB coal company Extensive NPRB base for long-term growth opportunities Employs approximately 1,700 people NYSE: CLD (7/30/13) $16.44 Market Capitalization (7/30/13) ~$1.0 billion Total Available Liquidity (6/30/13) $767 million 2012 Revenue $1.5 billion Senior Debt (B1/BB-) (6/30/13) $600 million Market and Financial Overview Company Overview |
|
|
3 Low-Risk Surface Operations Highly productive, non-unionized workforce at all company-operated mines Proportionately low, long-term operational liabilities Surface mining reduces liabilities and allows for high-quality reclamation Strong environmental compliance programs and ISO-14001 certified |

|
|
4 Top Coal Producing Companies - 2012 Incident Rates (MSHA) Source: MSHA. Note: Total Incident Rate = (total number of employee incidents x 200,000) / total man-hours. Good Safety Record Indicates Well-Run Operations |
|
|
Extensive Coal Reserves and Significant Projects 5 Spring Creek Mine – MT 2012 Tons Sold 17.2M tons 2012 Proven & Probable Reserves 293M tons Reserve Coal Quality 9,350 Btu/lb Average lbs SO2 0.73/mmBtu Antelope Mine – WY 2012 Tons Sold 34.3M tons 2012 Proven & Probable Reserves 649M tons Reserve Coal Quality 8,875 Btu/lb Average lbs SO2 0.52/mmBtu Cordero Rojo Mine – WY 2012 Tons Sold 39.2M tons 2012 Proven & Probable Reserves 331M tons Reserve Coal Quality 8,425 Btu/lb Average lbs SO2 0.69/mmBtu 2012 Proven & Probable Reserves 1.3B Tons Antelope Mine 9M tons Cordero Rojo Mine 160M tons Spring Creek Mine 8M tons Youngs Creek Project 287M tons Non-Reserve Coal Deposits Source: SNL Energy |

|
|
(1) TTM Adjusted EBITDA of $283M as of 6/30/13 Liquidity & Obligations (as of June 30, 2013) Liquidity ($ in millions) 6 No Near-Term Debt Maturities until 2017 (1) As of 6/30/2013, revolver undrawn Cash and cash equivalents $ 200 Marketable securities 8 0 $280 Total available liquidity $ 767 $500M Revolver (Baa3- rating) $ 0 8.25% Senior Notes due 2017 (B1/BB - rating) 300 8.5% Senior Notes due 2019 (B1/BB - rating) 300 Total senior debt $ 600 Total borrowed debt/Adjusted EBITDA (1) 2.14x Net d ebt/Adjusted EBITDA (1) 1.14x |

|
|
Shipments and Adjusted EBITDA 7 (1) Reconciliation tables for Adjusted EBITDA are included in the Appendix Adjusted EBITDA (1) Shipments from Company-Operated Mines |
|
|
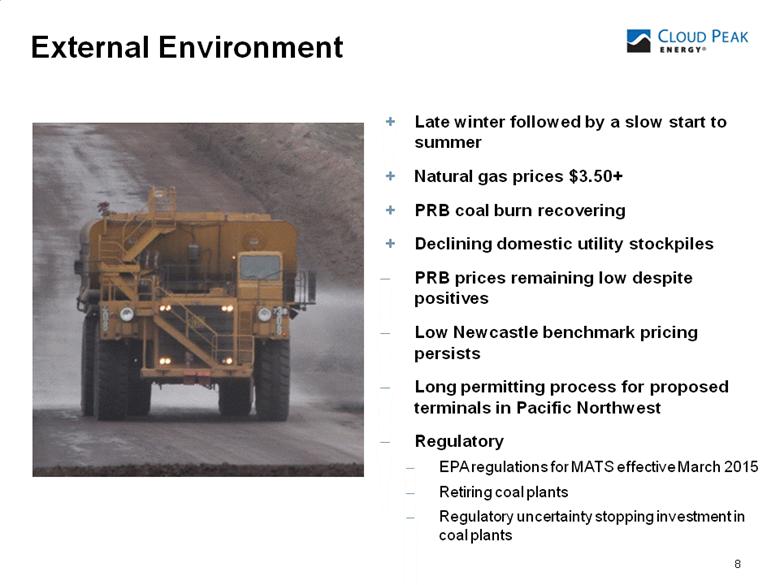
8 External Environment + Late winter followed by a slow start to summer + Natural gas prices $3.50+ + PRB coal burn recovering + Declining domestic utility stockpiles PRB prices remaining low despite positives Low Newcastle benchmark pricing persists Long permitting process for proposed terminals in Pacific Northwest Regulatory EPA regulations for MATS effective March 2015 Retiring coal plants Regulatory uncertainty stopping investment in coal plants |
|
|
9 Near Term Focus on delivery of tons to meet second half contracted position Focus on controlling costs and reducing cost per ton in second half Reduce 2013 expected capital spend to $60 to $70 million to enhance cash flows Extending equipment lives based on condition monitoring Availability of good used equipment and delaying non-critical projects Longer Term Match production and sales contracting to demand Evaluate capital investments required to sustain production levels Optimize capital allocation to highest margin properties Evaluating reducing shipments at Cordero Rojo Mine by 10 million tons from 2015 Response to Market Conditions |
|
|
10 Prudent Financial Strategy 10 Sustain strong balance sheet through cyclical troughs Maintain strong cash/liquidity position As of 6/30/13 = $280 million cash/$767 million total available liquidity Control capital expenditures while appropriately maintaining equipment Financial flexibility to build and invest across price cycles No debt maturities until 2017 |
|
|
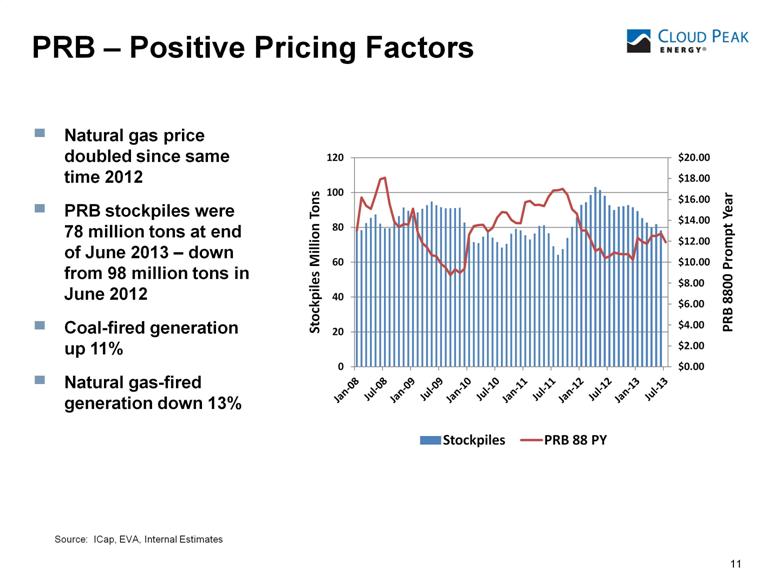
PRB – Positive Pricing Factors 11 Natural gas price doubled since same time 2012 PRB stockpiles were 78 million tons at end of June 2013 – down from 98 million tons in June 2012 Coal-fired generation up 11% Natural gas-fired generation down 13% Source: ICap, EVA, Internal Estimates |
|
|
12 Cloud Peak Energy’s Strategy Focus on operational/financial performance Disciplined approach to capital expenditures Generating liquidity for growth opportunities Optimize demand for low-sulfur, pure-play PRB reserves Build from Existing Foundation Optimize Development Opportunities Business Development Evaluate numerous options to develop NPRB projects around Spring Creek complex Support low sodium domestic demand Support potential for expanded export demand Target acquisitions building on core operational strengths Aim to increase export exposure Develop opportunities through acquisition of complementary operations or companies, e.g., Western U.S., Canada Maximize Exports Leverage NPRB’s advantageous location and coal quality Optimize export logistics (rails and ports) Expand/develop other port options (U.S. Pacific Northwest, Canada) Have established in-country Korean representative to build export opportunities for our Logistics business Foster relationships for new export opportunities in China and other Asian countries, including Taiwan and Japan |
|
|
13 Domestic Strategy Consistent Forward Selling Strategy Focus on Matching Production to Market Demand Optimize Operational Focus on Cost Control and Improvement Programs Disciplined Capital Expenditures and Significant Reserve Base |

|
|
14 Reliable and Productive Operations Procedures and inspections protect equipment Advanced testing supports comparison vs. baseline (vibration, fluid analysis, ultrasound, infrared, etc.) Track component life and degradation to avoid unplanned failures Continuous improvement Strain gauge monitoring Scorecards (operator and mechanical feedback) Preventive Maintenance (change fluids, inspect thoroughly, etc.) Understanding equipment allows for better utilization Example, payload measurement supports better loading procedures leading to tighter distribution and increased payloads on haul trucks Centralized GPS dispatch optimizes truck & shovel productivity Improving Coal Load Per Haul Truck Improved asset utilization 320 280 240 200 160 120 3.0% 2.5% 2.0% 1.5% 1.0% 0.5% 2007 2012 |

|
|
15 Strong Forward Sales Position (tons in millions) (1) Production from Owned and Operated Mines. 2013 has 90.5 million tons committed at weighted-average price of $13.11/ton 2014 has 62.7 million tons committed at weighted-average price of $13.40/ton Coal - Total Committed Tons (as of 7/19/13)(1) |
|
|
16 PRB Forward Coal Prices U.S. PRB 8800 Btu Coal Price (per ton) Source: ICap $7.00 $8.00 $9.00 $10.00 $11.00 $12.00 $13.00 $14.00 $15.00 $16.00 $17.00 $18.00 $19.00 2012 2013 2014 2015 2016 Q1-11 Q4-11 Q1-12 Q4-12 7/19/2013 |
|
|
17 Export Strategy Strong International Demand Cloud Peak Energy Logistics established as the Primary Exporter of PRB Coal Youngs Creek Asset Acquisition Crow Exploration and Option Agreements Secured Port Throughput |
|
|
China and India’s Strong Demand Requires Increasing Thermal Imports 18 China Net Imports Urban and industrialization investment will continue to fuel these economies Importing coal essential for anticipated future electric generation growth Production costs in Australia and Indonesia increasing making PRB coal importing more financially viable, although the impact is influenced by currency exchange rates Diversity of supply crucial +63% Source: Fenwel Energy Consulting and Industry Reports Estimated Asian Coal-Fired Generation (BkW) Source: AME India Net Imports |
|
|
19 Asian utilities seeking diversity and surety of long-term supply Our logistics business is the largest U.S. exporter of thermal coal into South Korea Other Asian countries form a growing pipeline for our targeted future exports Taiwan India Australia Indonesia Increasing International Demand Supports PRB Exports |
|
|
20 Spring Creek Complex Export Assets – Geographic Advantage Spring Creek Complex to Ridley - 1,893 or 2,697 Miles Spring Creek Complex to Westshore - 1,591 Miles Spring Creek Complex 235 miles closer than SPRB SPRB to NPRB rail is some of the busiest in U.S. Logistically more complex to ship from SPRB to Pacific Northwest Source: SNL Energy |
|
|
Spring Creek Complex – Export Quality Advantage 21 Demand for subbituminous coal is growing in international markets Indonesian coal (primary market competitor) is declining in quality Northern PRB (Spring Creek and Youngs Creek) coal: Coal quality ~ 9,200 – 9,350 Btu Converts to ~ 4,770 – 4,850 Kcal/kg NAR Premium subbituminous coal in the international market 4770-4850 4544 Average Source: Company estimates Desired Calorific Values (CV) by South Korean Utilities Between 3700 - 5000 Kcal/kg NAR NPRB SPRB Indonesian Coal |

|
|
Key Projects 22 Youngs Creek Acquisition 287 million tons classified as non-reserve coal deposits at YE 2012. 38,800 acres of surface land connecting Youngs Creek, Spring Creek, and Crow. Crow Agreements Exploration agreement and options to lease up to 1.4 billion tons of in-place coal on the Crow Indian Reservation. BIA issued approval of agreements in June 2013. Potential Decker Divestment Agreement to divest our 50% share of Decker to Ambre Energy. Subject to closing. |
|
|
23 Spring Creek Complex – Potential Development Options |
|
|
24 Cloud Peak Energy Port Position Westshore Terminal Capesize vessels – deep-water port 2012 expanded to 33 million tonnes total throughput Cloud Peak Energy has throughput agreement to 2022 for a portion of our anticipated exports Cloud Peak Energy expects to ship 4.5 million tonnes (5 million tons) in 2013 Gateway Pacific Terminal (multi-commodity) Capesize vessels – deep-water port 48 million tonnes of coal at planned full development Cloud Peak Energy secured option for up to 16 million tonnes throughput, depending on ultimate terminal size Scoping concluded January 2013 – EIS process continues Initial opening expected ~2018 Millennium Bulk Terminal – Potential Option Agreement Panamax vessels 44 million tonnes of coal at planned full development Cloud Peak Energy potential option for up to 5 million tonnes at full development; subject to closing sale of 50% interest in Decker mine to Ambre Energy EIS process continues Initial opening expected ~2018 |

|
|
25 Growing “Pro-Coal” Efforts Cloud Peak Energy is working with others to counter opposition of export development and to further expansion of ports, construction of new ports, and alternative shipping options Count on Coal Count on Coal was established to promote pro-coal messages, specifically highlighting the direct benefits to the local MT economy during the run up to the ’12 election. Based upon interest levels, there is now an effort underway to create a new cross-industry organization, promoting the broad economic benefits to MT from coal. www.countoncoal.org Alliance for Northwest Jobs and Exports The Alliance for Northwest Jobs and Exports is anon-profit trade organization that supports new export projects in Oregon and Washington State that will create thousands of new jobs and raise millions in tax revenue for local schools and other services. The Alliance has a diverse cross section of 52 members, representing more than 396,000 workers and 41,000 businesses across WA, OR, ID and MT. www.createnwjobs.com |
|
|
26 Executing on our Export Strategy Strong International Demand Cloud Peak Energy Logistics Established as the Primary Exporter of PRB Coal Youngs Creek Asset Acquisition Crow Exploration and Option Agreements Secured Port Throughput China and India expected to continue to drive significant demand growth Other Asian countries seeking security and diversity of supply Australian and Indonesian supply being hit by increasing capital and operating costs and regulatory uncertainty U.S. PRB coal no longer at top of cost curve Geographic advantage of Spring Creek complex, closer to ports Quality advantage compares well with seaborne competitive coal 287 million tons non-reserve coal deposits 38,800 acres strategic land Multiple development options with Spring Creek complex 1.4 billion in-place tons Exploration agreement Option to lease agreement Multiple development options with Spring Creek complex BIA approved agreements June 2013 Westshore 2022 Gateway Pacific option for up to 16 million tonnes Millennium potential option for up to 5 million tonnes Other opportunities |

|
|
27 Looking Forward - 2013 (1) Large, resilient domestic business 92.5 million tons committed for 2013 Strong balance sheet provides financial flexibility Actively working on terminal projects in Pacific Northwest Increasing PRB coal burn Natural gas prices stabilizing Declining domestic utility stockpiles |
|
|
Appendices (Cloud Peak Energy Inc.) 28 |
|
|
29 2013 Guidance – Estimates and 2012 Actuals 2013 (estimated) 2012 (actual) (1) (2) (3) Inclusive of intersegment sales Non-GAAP financial measure Excluding impact of Tax Receivable Agreement. (4) Excluding capitalized interest and federal coal lease payments. Coal shipments for our three operated mines (1) 88 – 92 million tons 90.6 million tons Committed sales with fixed prices Approximately 91 million tons n/a Anticipated realized price of produced coal with fixed prices Approximately $13.11 per ton $13.19 per ton Adjusted EBITDA (2) $210 – $250 million $338.8 million Net interest expense Approximately $40 million $36.3 million Depreciation, depletion and accretion $110 – $120 million $107.8 million Effective income tax rate (3) Approximately 36% 26.7% Capital expenditures (4) $60 – $70 million $53.6 million Committed federal coal lease payments $79 million $129.2 million |
|
|
30 Average Cost of Produced Coal * Represents average cost of product sold for produced coal for our three owned and operated mines. Owned and Operated Mines* $9.57/ton Owned and Operated Mines* $9.12/ton 2011 2012 |

|
|
Operating Segments 31 Owned and Operated Mines - mine site sales from our three owned and operated mines Key metrics: Tons sold Realized price per ton Cost of product sold per ton Logistics and Related Activities – delivered sales from our logistics and transportation services business to international and domestic customers Key profitability drivers: Tons delivered Cost of transportation services contracted Benchmark price of Newcastle for international deliveries Corporate and Other Broker activity Results from 50% interest in Decker mine Unallocated corporate costs |

|
|
Owned and Operated Mines 32 Our Owned and Operated Mines segment comprises the results of mine site sales from our three owned and operated mines primarily to our domestic utility customers and also to our Logistics and Related Activities segment. (in millions, except per ton amounts) Q2 2013 Q2 2012 YTD 2013 YTD 2012 Tons sold 20.1 20.1 41.2 42.6 Realized price per ton sold $13.05 $13.11 $13.07 $13.21 Average cost of product sold per ton $10.81 $10.09 $10.58 $ 9.93 Adjusted EBITDA (1) $ 34.2 $ 51.6 $ 79.9 $118.8 Match production to demand Largely fixed cost business – as coal tons vary, costs per ton will vary Manage variable costs and capital expenditures Reduced use of contractors Matching hiring to market needs Using condition monitoring and maintenance programs to extend equipment lives safely (1) Reconciliation tables for Adjusted EBITDA are included in the Appendix |

|
|
Logistics and Related Activities 33 Our Logistics and Related Activities segment comprises the results of our logistics and transportation services to our domestic and international customers. Lower Newcastle prices resulting in reduced revenue Curtailed international deliveries through Ridley Terminal, saving logistics costs At June 30, 2013, $11 million Newcastle derivatives mark-to-market asset in respect of 2013 deliveries (1) Reconciliation tables for Adjusted EBITDA are included in the Appendix (in millions) Q2 2013 Q2 2012 YTD 2013 YTD 2012 Tons delivered 1.4 1.3 2.8 2.6 Revenue $ 67.1 $ 83.5 $ 132.9 $ 163.0 Cost of product sold (delivered tons) $ 64.4 $ 67.5 $ 127.3 $ 134.6 Adjusted EBITDA (1) $ 2.8 $ 12.5 $ 4.1 $ 22.9 |
|
|
34 Statement of Operations Data (in millions, except per share amounts) Three Months Ended June 30, Six Months Ended June 30, 2013 2012 2013 2012 Revenue $ 330.0 $ 343.2 $ 668.0 $ 716.1 Operating income 17.1 58.7 51.7 105.8 Net income 4.7 33.7 20.1 60.3 Earnings per common share – basic Net income $ 0.08 $ 0.56 $ 0.33 $ 1.00 Earnings per share – diluted Net income $ 0.08 $ 0.55 $ 0.33 $ 0.99 |
|
|
35 Statement of Operations Data (in millions, except per share amounts) Revenue $ 1,516.8 $ 1,553.7 $ 1,370.8 $1,398.2 $1,239.7 Operating income 241.9 250.5 211.9 255.0 124.9 Income from continuing operations 173.7 189.8 117.2 182.5 88.3 Income (loss) from discontinued operations — — — 211.1 (25.2) Net income 173.7 189.8 117.2 393.6 63.1 Amounts attributable to controlling interest: Income from continuing operations 173.7 189.8 33.7 170.6 88.3 Income (loss) from discontinued operations — — — 211.1 (25.2) Net income attributable to controlling interest $ 173.7 $ 189.8 $ 33.7 $ 381.7 $ 63.1 Earnings per share – basic Income from continuing operations $ 2.89 $ 3.16 $ 1.06 $ 3.01 $ 1.47 Income (loss) from discontinued operations — — — 3.73 (0.42) Net income $ 2.89 $ 3.16 $ 1.06 $ 6.74 $ 1.05 Earnings per share attributed to controlling interest – diluted Income from continuing operations $ 2.85 $ 3.13 $ 1.06 $ 2.97 $ 1.47 Income (loss) from discontinued operations — — — 3.52 (0.42) Net income $ 2.85 $ 3.13 $ 1.06 $ 6.49 $ 1.05 Year Ended December 31, 2012 2011 2010 2009 2008 |
|
|
36 Balance Sheet Data (in millions) Cash, cash equivalents and investments $ 280.2 $ 278.0 $ 479.5 $ 340.1 $ 268.3 $ 15.9 Restricted cash — — 71.2 182.1 80.2 — Property, plant and equipment, net 1,679.7 1,678.3 1,350.1 1,008.3 987.1 927.9 Total assets 2,401.7 2,351.3 2,319.3 1,915.1 1,677.6 1,785.2 Senior notes, net of unamortized discount 596.7 596.5 596.1 595.7 595.3 — Federal coal lease obligations 177.3 186.1 288.3 118.3 169.1 206.3 Asset retirement obligations, net of current portion 239.6 239.0 192.7 182.2 175.9 164.2 Total liabilities 1,446.6 1,420.3 1,568.9 1,383.9 1,232.1 800.0 Controlling interest equity 955.1 931.0 750.4 531.2 252.9 985.2 Noncontrolling interest equity — — — — 192.6 — June 30, December 31, 2013 2012 2011 2010 2009 2008 |
|
|
37 Reconciliation of Non-GAAP Measures – Adjusted EBITDA (in millions) Nine Months Ended September 30, 2010 2009 (1) Changes to related deferred taxes are included in income tax expense. (2) Derivative fair value mark-to-market (gains) losses reflected on the statement of operations. (3) Derivative cash gains and losses reflected within operating cash flows. Net income $ 4.7 $ 33.7 $ 20.1 $ 60.3 $ 133.5 Interest income (0.1) (0.3) (0.2) (0.8) (0.5) Interest expense 10.3 7.9 20.8 13.8 43.3 Income tax expense 2.5 18.8 11.3 33.9 40.0 Depreciation and depletion 25.5 22.3 48.7 45.7 97.6 Accretion 4.1 3.4 8.3 6.1 15.4 EBITDA $ 47.0 $ 85.8 $ 108.9 $ 159.0 $ 329.3 Tax agreement benefit(1) — — — — (29.0) Derivative financial instruments: Exclusion of fair value mark-to-market (gains) losses(2) $ (12.3) $ (20.2) $(25.9) $ (18.1) $ (30.5) Inclusion of cash amounts received (paid)(3) 2.6 — 2.5 0.5 13.2 Total derivative financial instruments (9.7) (20.2) (23.4) (17.6) (17.3) Expired significant broker contract — — — — — Adjusted EBITDA $ 37.3 $ 65.6 $ 85.5 $ 141.4 $283.0 Three Months Ended June 30, Six Months Ended June 30, Trailing Twelve Months Ended 2013 2012 2013 2012 June 30, 2013 |
|
|
38 Reconciliation of Non-GAAP Measures – Adjusted EBITDA (in millions) Year Ended December 31, 2012 2011 2010 2009 2008 Net income $ 173.7 $ 189.8 $ 117.2 $ * $ * Net income from continuing operations * * * 182.5 88.3 Interest income (1.1) (0.6) (0.6) (0.3) (2.9) Interest expense 36.3 33.9 46.9 6.0 20.4 Income tax expense (benefit) 62.6 11.4 32.0 68.2 25.3 Depreciation and depletion 94.6 87.1 100.0 97.9 89.0 Amortization — — 3.2 28.7 46.0 Accretion 13.2 12.5 12.5 12.6 12.7 EBITDA $ 379.3 $ 334.1 $ 311.3 $ 395.6 $ 278.9 Tax agreement expense(1) (29.0) 19.9 19.7 — — Derivative financial instruments: Exclusion of fair value mark-to-market (gains) losses(2) (22.8) 2.3 — — — Inclusion of cash amounts received (paid)(3) 11.2 — — — — Total derivative financial instruments (11.5) 2.3 — — — Expired significant broker contract — — (8.2) (75.0) (71.6) Adjusted EBITDA $ 338.8 $ 351.7 $ 322.7 $ 320.6 $ 207.2 * For 2009 and prior periods, Cloud Peak Energy reported discontinued operations. Accordingly, for such periods, net income from continuing operations is the comparable U.S. GAAP financial measure for Adjusted EBITDA. (1) Changes to related deferred taxes are included in income tax expense. (2) Derivative fair value mark-to-market (gains) losses reflected on the statement of operations. (3) Derivative cash gains and losses reflected within operating cash flows. |
|
|
Three Months Ended June 30, Six Months Ended June 30, 2013 2012 2013 2012 39 Reconciliation of Non-GAAP Measures – Adjusted EPS Diluted earnings per common share $ 0.08 $ 0.55 $ 0.33 $ 0.99 Tax agreement expense including tax impacts of IPO and Secondary Offering — — — — Derivative financial instruments: Exclusion of fair value mark-to-market (gains) losses $(0.13) $ (0.21) $(0.27) $ (0.19) Inclusion of cash amounts received (paid) 0.03 — (0.03) 0.01 Total derivative financial instruments (0.10) (0.21) (0.25) (0.19) Expired significant broker contract — — — — Adjusted EPS $ (0.02) $ 0.34 $ 0.08 $ 0.81 Weighted-average dilutive shares outstanding (in millions) 61.2 60.9 61.1 60.8 |
|
|
40 Diluted earnings per common share attributable to controlling interest $ 2.85 $ 3.13 $ 1.06 $ * $ * Diluted earnings per common share attributable to controlling interest from continuing operations * * * 2.97 1.47 Tax agreement expense including tax impacts of IPO and Secondary Offering (0.58) (0.63) 0.78 — — Derivative financial instruments: Exclusion of fair value mark-to-market (gains) losses (0.24) (0.02) — — — Inclusion of cash amounts received (paid) 0.12 — — — — Total derivative financial instruments (0.12) (0.02) — — — Expired significant broker contract — — (0.10) (0.49) (0.41) Adjusted EPS $ 2.15 $ 2.47 $ 1.74 $ 2.48 $ 1.06 Weighted-average shares outstanding (in millions) 60.9 60.6 31.9 60.0 60.0 Reconciliation of Non-GAAP Measures – Adjusted EPS Year Ended December 31, 2012 2011 2010 2009 2008 * For 2009 and prior periods, Cloud Peak Energy reported discontinued operations. Accordingly, for such periods, diluted earnings (loss) per share attributable to controlling interest from continuing operations is the comparable U.S. GAAP financial measure for Adjusted EPS. |
|
|
Adjusted EBITDA by Segment Three Months Ended June 30, Six Months Ended June 30, 2013 2012 2013 2012 Owned and Operated Mines Adjusted EBITDA $ 34.2 $ 51.6 $ 79.9 $ 118.8 Depreciation and depletion (23.9) (21.1) (47.2) (42.7) Accretion (2.8) (2.2) (5.7) (4.5) Derivative financial instruments: Exclusion of fair value mark-to-market gains (losses) $ (0.1) $ 0.1 $ (0.2) $ 0.1 Inclusion of cash amounts (received) paid 0.1 — 0.1 — Total derivative financial instruments — 0.1 (0.1) 0.1 Other (0.1) — 0.2 — Operating income 7.4 28.4 27.1 71.7 Logistics and Related Activities Adjusted EBITDA 2.8 12.5 4.1 22.9 Derivative financial instruments: Exclusion of fair value mark-to-market gains (losses) 12.4 20.1 26.2 18.1 Inclusion of cash amounts (received) paid (2.6) — (2.6) (0.5) Total derivative financial instruments 9.8 20.1 23.6 17.6 Operating income 12.5 32.6 27.6 40.4 Corporate and Other Adjusted EBITDA 0.2 1.6 1.7 — Depreciation and depletion (1.5) (1.2) (1.5) (2.9) Accretion (1.3) (1.2) (2.6) (1.6) Earnings from unconsolidated affiliates, net of tax (0.3) (1.5) (0.5) (1.5) Operating loss (2.8) (2.3) (2.9) (6.2) Eliminations Adjusted EBITDA — — (0.2) (0.2) Operating income — — (0.2) (0.2) Consolidated operating income 17.1 58.7 51.7 105.7 Interest income 0.1 0.3 0.2 0.8 Interest expense (10.3) (7.9) (20.8) (13.8) Other, net — (0.1) (0.2) (0.1) Income tax expense (2.5) (18.8) (11.3) (33.9) Earnings from unconsolidated affiliates, net of tax 0.3 1.5 0.5 1.5 Net income $ 4.7 $ 33.7 $ 20.1 $ 60.3 |
|
|
42 Other Data (1) Represents only the three company-operated mines. Q2 Q1 Q4 Q3 Q2 Q1 Year Year (in thousands) 2013 2013 2012 2012 2012 2012 2012 2011 Tons sold Antelope 7,371 8,086 9,029 9,111 7,424 8,752 34,316 37,075 Cordero Rojo 8,359 9,231 9,970 10,201 9,027 10,007 39,205 39,456 Spring Creek 4,362 3,742 4,616 5,072 3,625 3,788 17,101 19,106 Decker (50% interest) 382 165 395 417 384 245 1,441 1,549 Total tons sold 20,473 21,224 24,009 24,802 20,460 22,792 92,063 97,186 Average realized price per ton sold (in millions) (1) $13.05 $13.09 $13.07 $13.28 $13.11 $13.31 $13.19 $12.92 Average cost of product sold per ton (1) $10.81 $10.37 $ 9.38 $ 9.14 $10.09 $ 9.78 $ 9.57 $ 9.12 |
|
|
43 Other Data (in millions) Tons sold – company owned and operated mines 90.6 95.6 93.7 90.9 93.7 Total tons sold– Decker Mine (50% share) 1.4 1.5 1.5 2.3 3.3 Tons sold from all production * 92.1 97.2 95.1 93.2 97.0 Tons purchased and resold 0.9 1.6 1.7 10.1 8.1 Year Ended December 31, 2012 2011 2010 2009 2008 * Total reflects rounding |
|
|
44 44 44 Sulfur Content by Basin 44 Source: SNL U.S. Coal Consumption by Region Region/ Avg Btu Average lbs SO2 PRB/ 8,600 0.5 – 1.0/mmBtu Rocky Mountain 11,500 0.9 – 1.4/mmBtu Illinois Basin 11,500 2.5 – 6.0/mmBtu Appalachia 12,000 1.2 – 7.0/mmBtu Lignite 6,000 1.4 – 4.0/mmBtu Cloud Peak Energy Mines Antelope 8,875 0.52/mmBtu Cordero Rojo 8,425 0.69/mmBtu Spring Creek 9,350 0.73/mmBtu Source: Public record |
|
|
45 Lease By Application Source: Cloud Peak Energy management. Note: Acquired tonnage is not classified as reserve until verified with sufficient technical and economic analysis. Maps not to scale. Cordero Rojo Mine (8425 Btu) Maysdorf II North Tract Maysdorf II LBA is expected to be bid 2013. Tonnages below are as estimated by the BLM. Maysdorf II North Tract – 149 million minable tons (1) (2) Maysdorf II South Tract – 234 million minable tons (1) (1) In October 2012, an environmental group filed a notice of appeal with the Interior Board of Land Appeals, challenging the Bureau of Land Management’s record of decision authorizing the sale and issuance of the Maysdorf II North and South tracts. After the appeal was filed, BLM successfully asked the Board to remand the part of the leasing decision that applied to the North tract in order to correct some administrative errors. Before the Board ruled on the remaining appeal of the South Tract, the environmental group requested to dismiss the appeal, which was granted by the Board of Land Appeals. Additional legal challenges may be made in the future. (2) Lease sale notice issued for Maysdorf II North Tract sale date of August 21, 2013. WAII North and South Tracts – 383 million proven and probable reserves(1) Ridgerunner lease previously acquired – 81 million proven and probable reserves Extends mine life by approximately 12 years at current production rates (1) Environmental organizations challenged certain actions of the BLM and Secretary of the Interior relating to the North and South tract leases. On July 30, 2012, the U.S. District Court for D.C. rejected these challenges. In September 2012, the environmental organizations appealed the District Court’s decision to the D.C. Court of Appeals. Any adverse outcome of the appeal could adversely impact or delay our ability to mine the coal subject to the leases. Antelope Mine (8875 Btu) Ridgerunner Lease South Tract Acquired 2011 North Tract Acquired 2011 AWARDED LBA Mined Area (2009/1010) Leased Coal Maysdorf II South Tract |
