Attached files
| file | filename |
|---|---|
| 8-K - 8-K - US BANCORP \DE\ | d577121d8k.htm |
Exhibit 99.1

| The CFA Society of Minnesota Investor Conference John ElmoreVice Chairman Community Banking and Branch DeliveryKent StoneVice Chairman Consumer Banking Sales and Support August 1, 2013 |
| Forward-looking Statements and Additional Information The following information appears in accordance with the Private Securities Litigation Reform Act of 1995: This presentation contains forward-looking statements about U.S. Bancorp. Statements that are not historical or current facts, including statements about beliefs and expectations, are forward-looking statements and are based on the information available to, and assumptions and estimates made by, management as of the date made. These forward-looking statements cover, among other things, anticipated future revenue and expenses and the future plans and prospects of U.S. Bancorp. Forward-looking statements involve inherent risks and uncertainties, and important factors could cause actual results to differ materially from those anticipated. Global and domestic economies could fail to recover from the recent economic downturn or could experience another severe contraction, which could adversely affect U.S. Bancorp's revenues and the values of its assets and liabilities. Global financial markets could experience a recurrence of significant turbulence, which could reduce the availability of funding to certain financial institutions and lead to a tightening of credit, a reduction of business activity, and increased market volatility. Continued stress in the commercial real estate markets, as well as a delay or failure of recovery in the residential real estate markets, could cause additional credit losses and deterioration in asset values. In addition, U.S. Bancorp's business and financial performance is likely to be negatively impacted by recently enacted and future legislation and regulation. U.S. Bancorp's results could also be adversely affected by deterioration in general business and economic conditions; changes in interest rates; deterioration in the credit quality of its loan portfolios or in the value of the collateral securing those loans; deterioration in the value of securities held in its investment securities portfolio; legal and regulatory developments; increased competition from both banks and non-banks; changes in customer behavior and preferences; effects of mergers and acquisitions and related integration; effects of critical accounting policies and judgments; and management's ability to effectively manage credit risk, residual value risk, market risk, operational risk, interest rate risk and liquidity risk. For discussion of these and other risks that may cause actual results to differ from expectations, refer to U.S. Bancorp's Annual Report on Form 10-K for the year ended December 31, 2012, on file with the Securities and Exchange Commission, including the sections entitled "Risk Factors" and "Corporate Risk Profile" contained in Exhibit 13, and all subsequent filings with the Securities and Exchange Commission under Sections 13(a), 13(c), 14 or 15(d) of the Securities Exchange Act of 1934. However, factors other than these could also adversely affect U.S. Bancorp's results, and you should not consider these factors to be a complete set of all potential risks. Forward-looking statements speak only as of the date they are made, and U.S. Bancorp undertakes no obligation to update them in light of new information or future events.This presentation includes non-GAAP financial measures to describe U.S. Bancorp's performance. The reconciliations of those measures to GAAP measures are provided within or in the appendix of the presentation. These disclosures should not be viewed as a substitute for operating results determined in accordance with GAAP, nor are they necessarily comparable to non-GAAP performance measures that may be presented by other companies. |
| U.S. Bancorp OverviewCapital ManagementConsumer and Small Business BankingSummary |
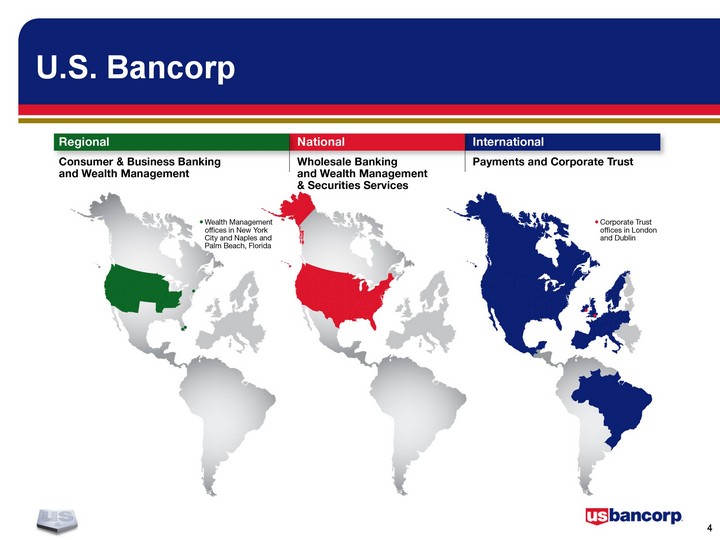
| U.S. Bancorp |
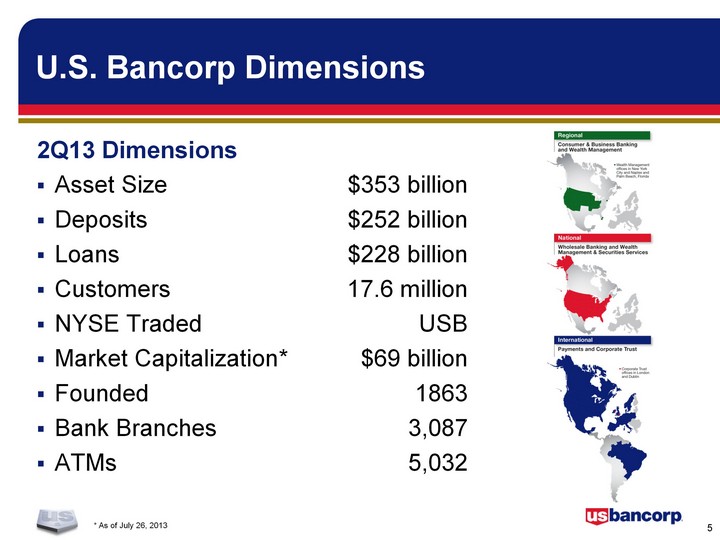
| U.S. Bancorp Dimensions * As of July 26, 2013 Asset Size $353 billionDeposits $252 billionLoans $228 billionCustomers 17.6 millionNYSE Traded USBMarket Capitalization* $69 billionFounded 1863Bank Branches 3,087ATMs 5,032 2Q13 Dimensions |
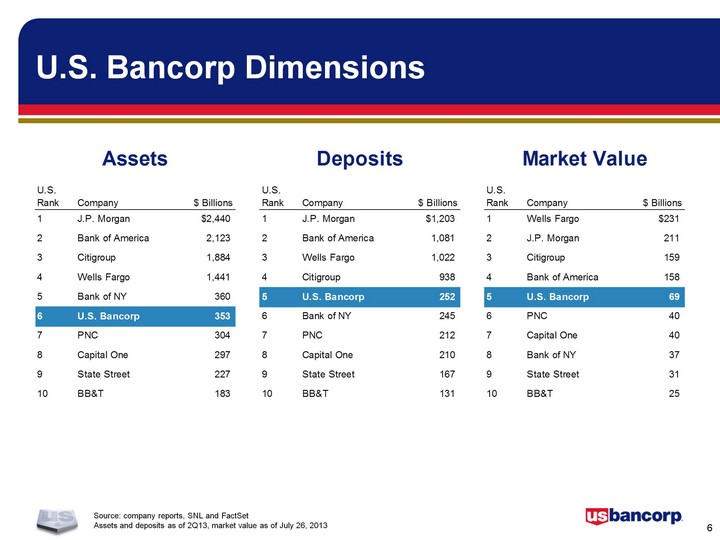
| U.S. Bancorp Dimensions Source: company reports, SNL and FactSetAssets and deposits as of 2Q13, market value as of July 26, 2013 |
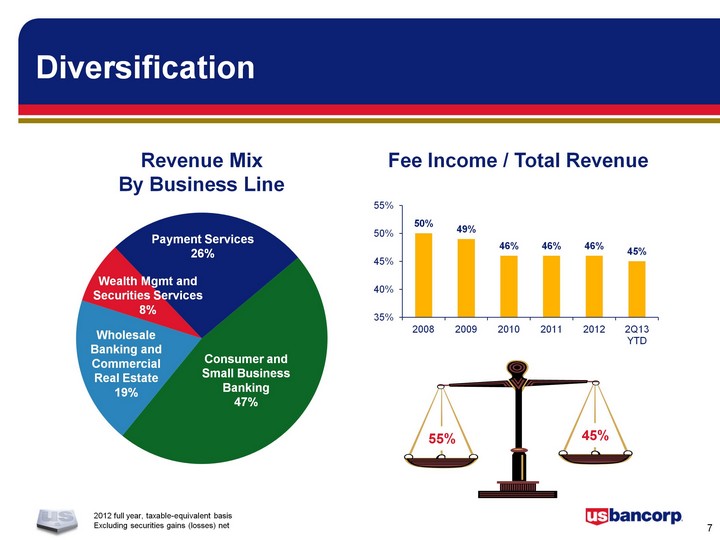
| Diversification 2012 full year, taxable-equivalent basisExcluding securities gains (losses) net Revenue MixBy Business Line (CHART) Consumer andSmall Business Banking47% Payment Services26% Wealth Mgmt and Securities Services8% Wholesale Banking and Commercial Real Estate19% Fee Income / Total Revenue 55% 45% (CHART) |
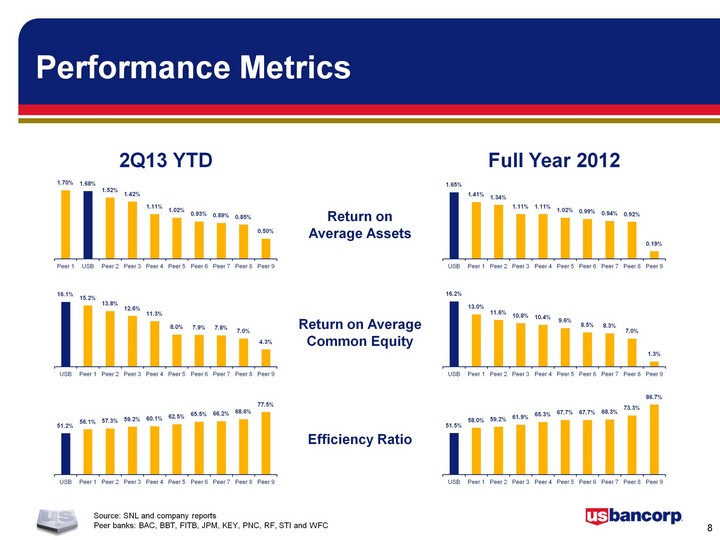
| Performance Metrics Return onAverage Assets Return on AverageCommon Equity Efficiency Ratio Full Year 2012 2Q13 YTD (CHART) (CHART) (CHART) (CHART) (CHART) (CHART) Source: SNL and company reportsPeer banks: BAC, BBT, FITB, JPM, KEY, PNC, RF, STI and WFC |
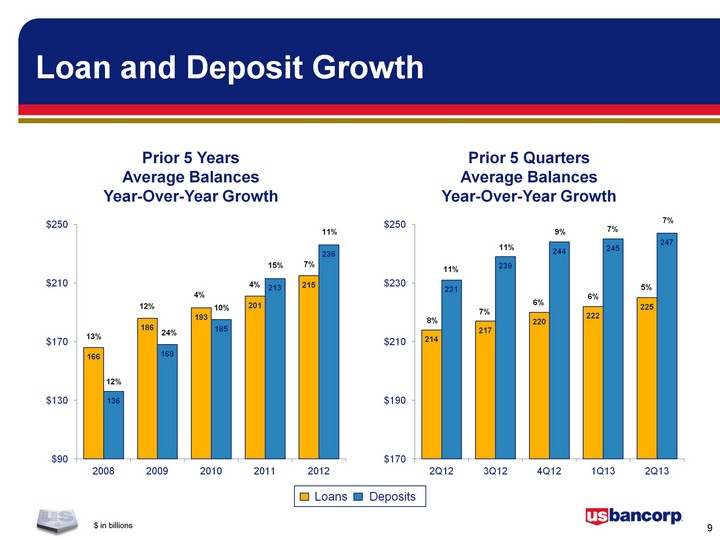
| Loan and Deposit Growth $ in billions (CHART) (CHART) 6% 7% 8% 6% 9% 5% 11% 11% 7% 4% 4% 11% 13% 12% 10% 15% 7% 12% 24% Loans Deposits Prior 5 YearsAverage BalancesYear-Over-Year Growth Prior 5 QuartersAverage BalancesYear-Over-Year Growth 7% |
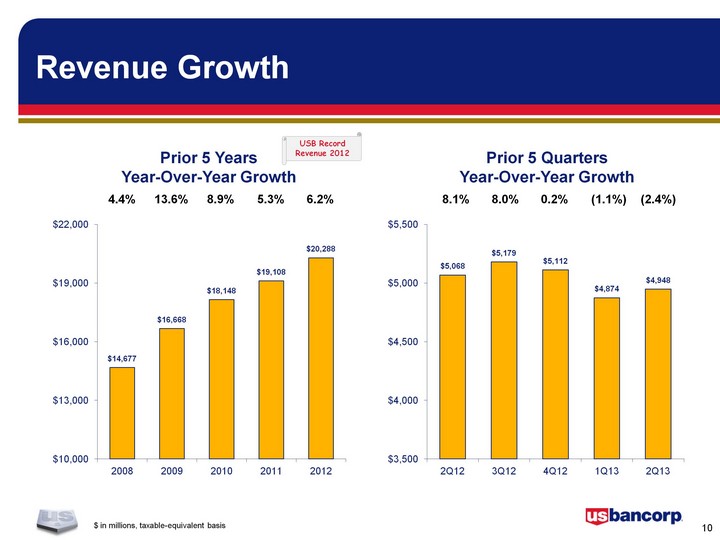
| Revenue Growth $ in millions, taxable-equivalent basis (CHART) (CHART) Prior 5 YearsYear-Over-Year Growth 4.4% 13.6% 8.9% 5.3% 6.2% Prior 5 QuartersYear-Over-Year Growth 8.1% 8.0% 0.2% (1.1%) (2.4%) USB RecordRevenue 2012 |
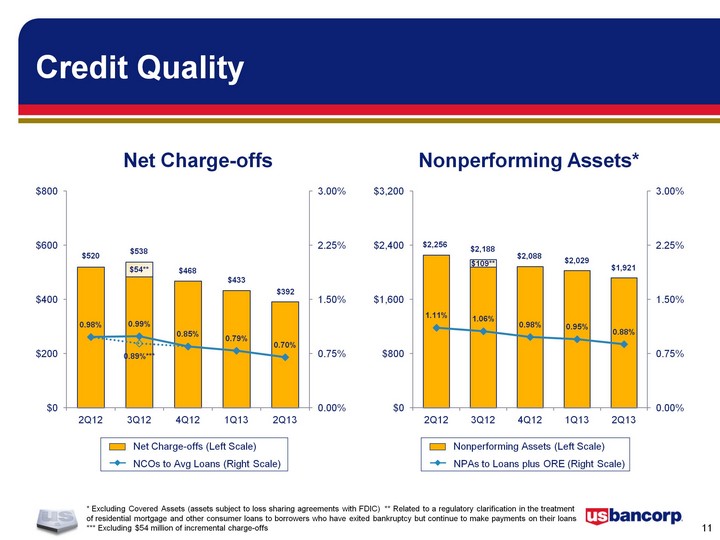
| Credit Quality * Excluding Covered Assets (assets subject to loss sharing agreements with FDIC) ** Related to a regulatory clarification in the treatment of residential mortgage and other consumer loans to borrowers who have exited bankruptcy but continue to make payments on their loans *** Excluding $54 million of incremental charge-offs Net Charge-offs Nonperforming Assets* Net Charge-offs (Left Scale) NCOs to Avg Loans (Right Scale) Nonperforming Assets (Left Scale) NPAs to Loans plus ORE (Right Scale) (CHART) $468 (CHART) $433 $520 $538 $2,029 $2,256 $2,188 $2,088 $392 $1,921 |
| U.S. Bancorp OverviewCapital ManagementConsumer and Small Business BankingSummary |
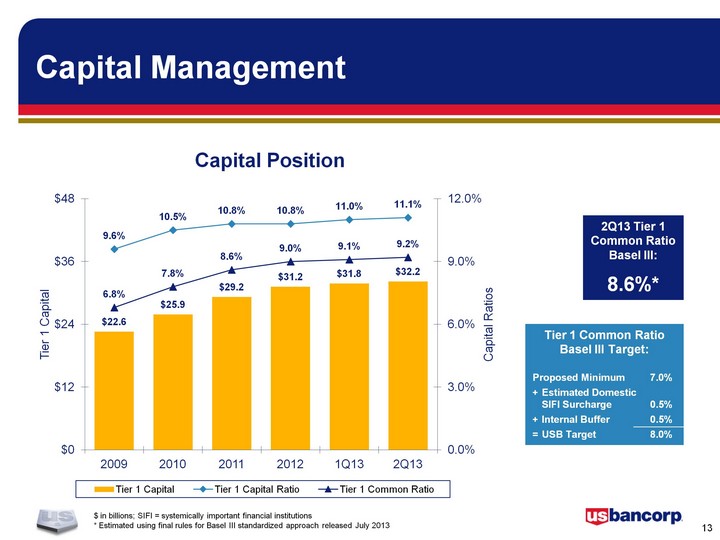
| Capital Management $ in billions; SIFI = systemically important financial institutions* Estimated using final rules for Basel III standardized approach released July 2013 (CHART) 2Q13 Tier 1Common RatioBasel III:8.6%* Tier 1 Common RatioBasel III Target:Proposed Minimum 7.0%+ Estimated Domestic SIFI Surcharge 0.5%+ Internal Buffer 0.5%= USB Target 8.0% Capital Position |
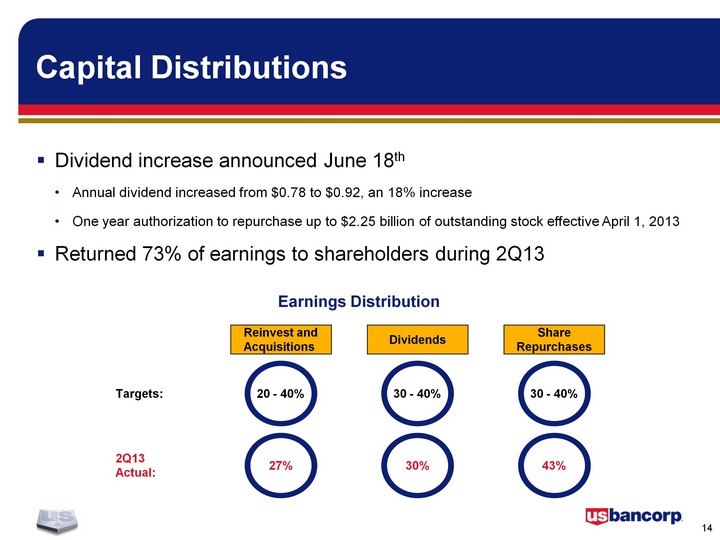
| Capital Distributions Dividend increase announced June 18thAnnual dividend increased from $0.78 to $0.92, an 18% increaseOne year authorization to repurchase up to $2.25 billion of outstanding stock effective April 1, 2013Returned 73% of earnings to shareholders during 2Q13 Reinvest andAcquisitions Dividends ShareRepurchases 20 - 40% Targets: 30 - 40% 30 - 40% 27% 2Q13Actual: 43% 30% Earnings Distribution |
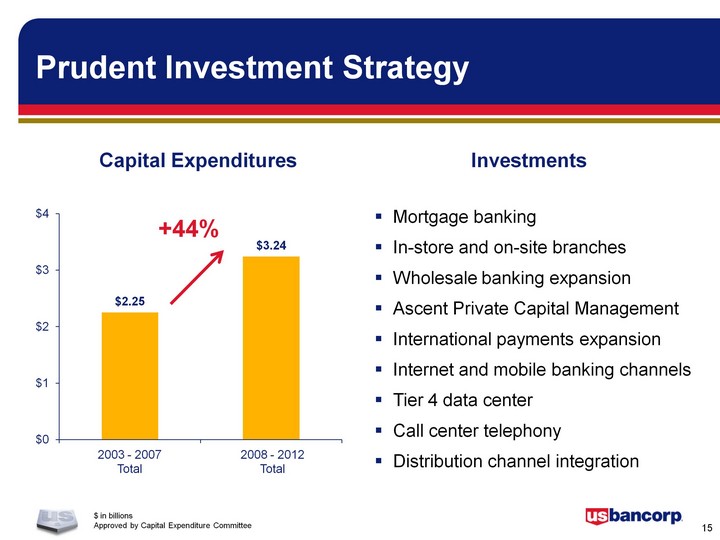
| Prudent Investment Strategy $ in billionsApproved by Capital Expenditure Committee Mortgage bankingIn-store and on-site branchesWholesale banking expansionAscent Private Capital ManagementInternational payments expansionInternet and mobile banking channelsTier 4 data centerCall center telephonyDistribution channel integration (CHART) 2003 - 2007Total 2008 - 2012Total +44% Investments Capital Expenditures |
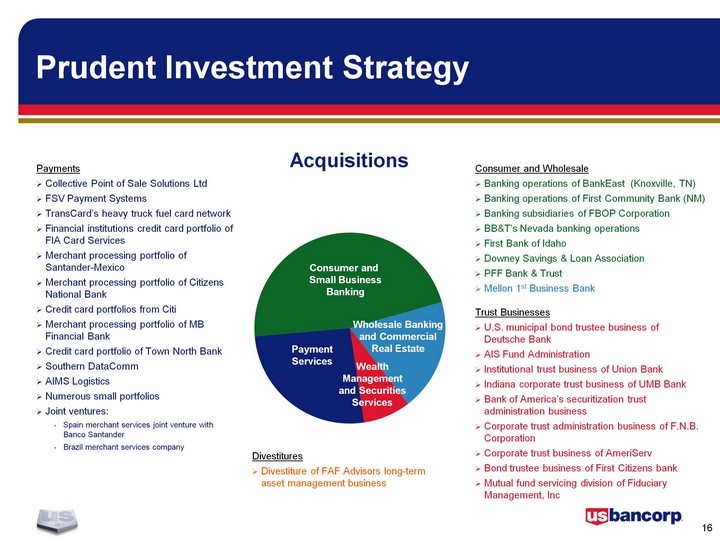
| Prudent Investment Strategy PaymentsCollective Point of Sale Solutions LtdFSV Payment SystemsTransCard's heavy truck fuel card networkFinancial institutions credit card portfolio of FIA Card ServicesMerchant processing portfolio of Santander-MexicoMerchant processing portfolio of Citizens National Bank Credit card portfolios from CitiMerchant processing portfolio of MB Financial BankCredit card portfolio of Town North BankSouthern DataCommAIMS LogisticsNumerous small portfoliosJoint ventures:Spain merchant services joint venture with Banco SantanderBrazil merchant services company Consumer and WholesaleBanking operations of BankEast (Knoxville, TN)Banking operations of First Community Bank (NM)Banking subsidiaries of FBOP CorporationBB&T's Nevada banking operationsFirst Bank of IdahoDowney Savings & Loan AssociationPFF Bank & TrustMellon 1st Business Bank Trust BusinessesU.S. municipal bond trustee business of Deutsche BankAIS Fund AdministrationInstitutional trust business of Union BankIndiana corporate trust business of UMB BankBank of America's securitization trust administration businessCorporate trust administration business of F.N.B. CorporationCorporate trust business of AmeriServBond trustee business of First Citizens bankMutual fund servicing division of Fiduciary Management, Inc DivestituresDivestiture of FAF Advisors long-term asset management business (CHART) Consumer and Small BusinessBanking PaymentServices WealthManagementand SecuritiesServices Wholesale Bankingand CommercialReal Estate Acquisitions |
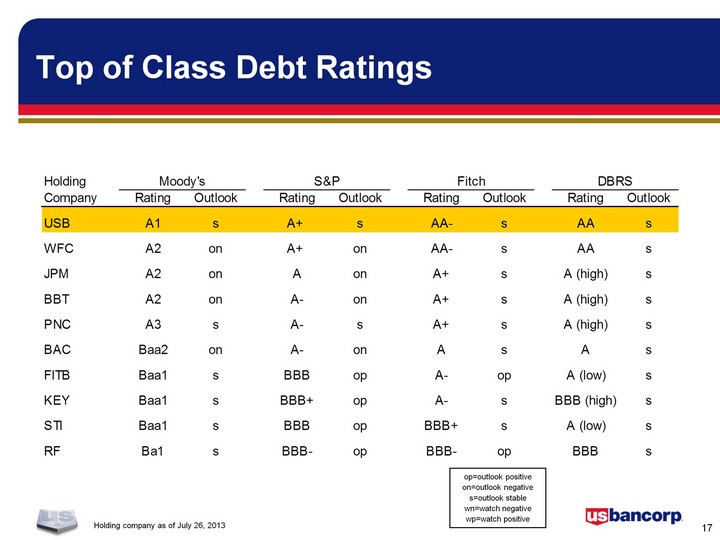
| Holding company as of July 26, 2013 Top of Class Debt Ratings op=outlook positiveon=outlook negatives=outlook stablewn=watch negativewp=watch positive |
| U.S. Bancorp OverviewCapital ManagementConsumer and Small Business BankingSummary |
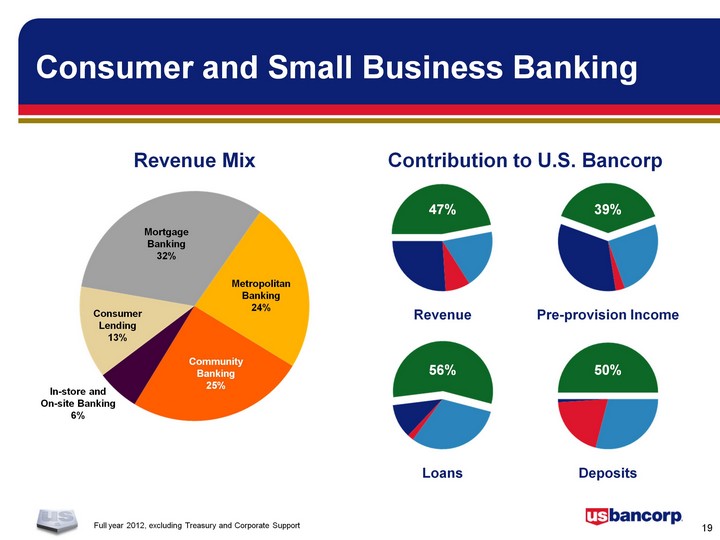
| Full year 2012, excluding Treasury and Corporate Support Contribution to U.S. Bancorp Revenue Pre-provision Income Loans Deposits 47% 39% 56% 50% Revenue Mix In-store and On-site Banking6% MetropolitanBanking24% CommunityBanking25% MortgageBanking32% ConsumerLending13% Consumer and Small Business Banking |
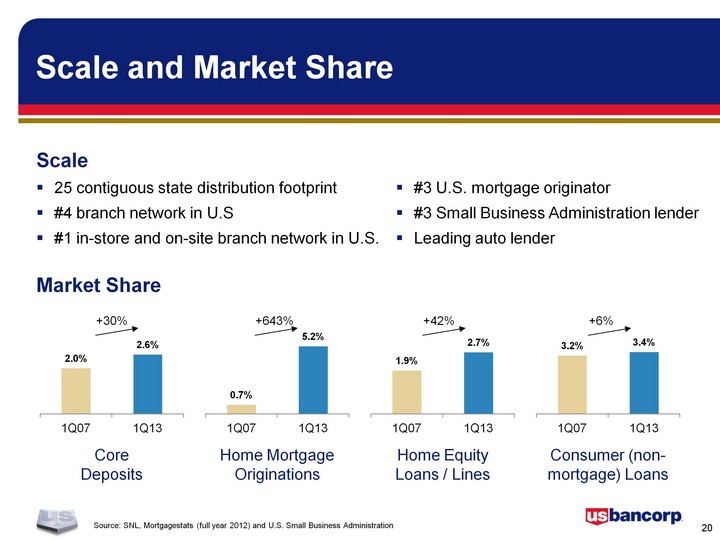
| Scale25 contiguous state distribution footprint#4 branch network in U.S#1 in-store and on-site branch network in U.S. #3 U.S. mortgage originator#3 Small Business Administration lenderLeading auto lender Source: SNL, Mortgagestats (full year 2012) and U.S. Small Business Administration Scale and Market Share CoreDeposits (CHART) Market Share +30% Home Mortgage Originations (CHART) +643% Home EquityLoans / Lines (CHART) +42% Consumer (non- mortgage) Loans (CHART) +6% |
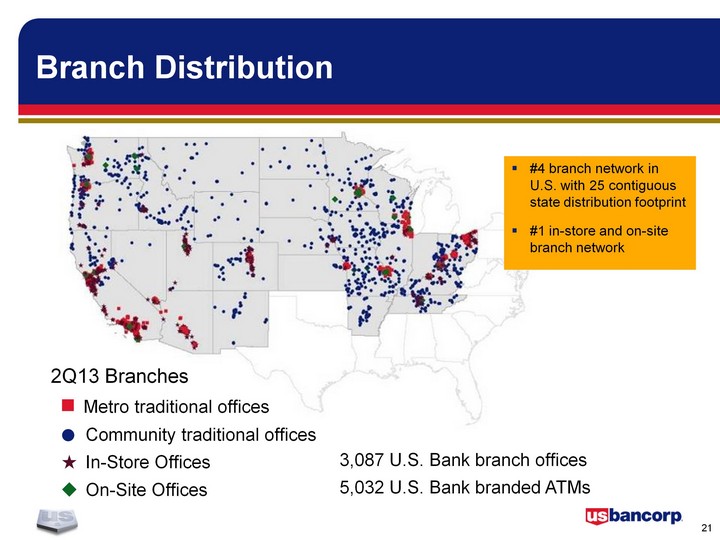
| 2Q13 Branches Metro traditional offices Community traditional offices In-Store Offices On-Site Offices Branch Distribution 3,087 U.S. Bank branch offices5,032 U.S. Bank branded ATMs #4 branch network in U.S. with 25 contiguous state distribution footprint#1 in-store and on-site branch network |
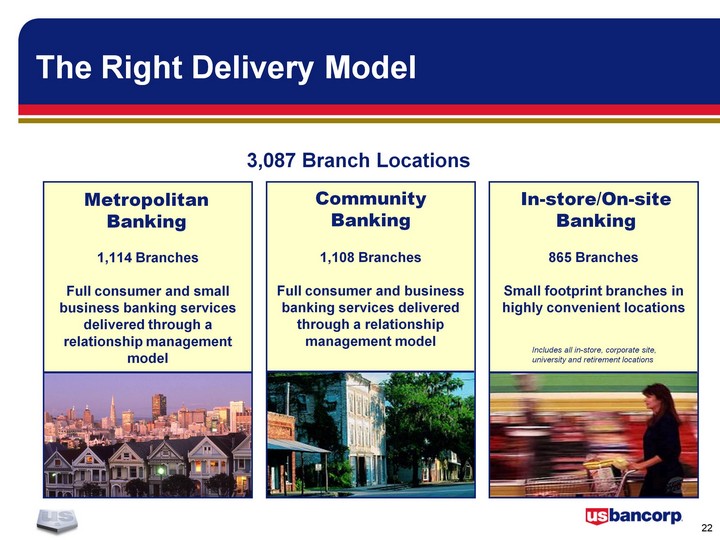
| The Right Delivery Model Community Banking 1,108 Branches Full consumer and business banking services delivered through a relationship management model Metropolitan Banking 1,114 Branches Full consumer and small business banking services delivered through a relationship management model In-store/On-site Banking 865 Branches Small footprint branches in highly convenient locations Includes all in-store, corporate site, university and retirement locations 3,087 Branch Locations |
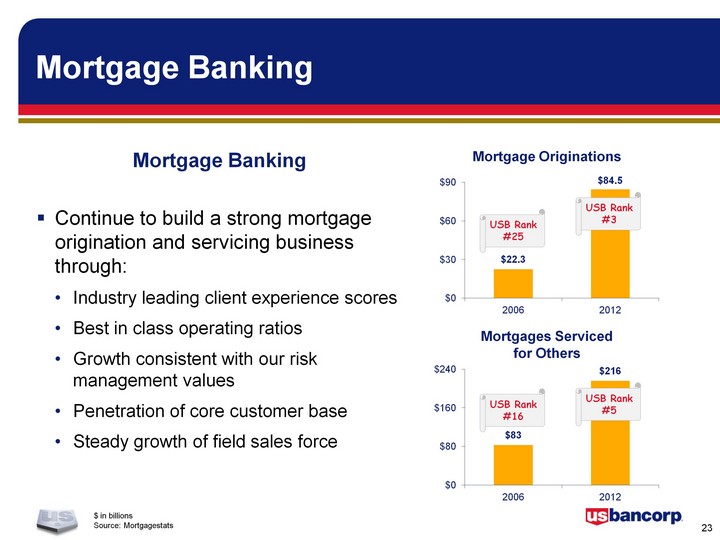
| Mortgage Banking $ in billionsSource: Mortgagestats Source: Mortgagestats Source: Mortgagestats (CHART) Mortgage Originations Mortgages Servicedfor Others USB Rank#25 USB Rank#3 USB Rank#5 USB Rank#16 Continue to build a strong mortgage origination and servicing business through:Industry leading client experience scoresBest in class operating ratiosGrowth consistent with our risk management valuesPenetration of core customer baseSteady growth of field sales force Mortgage Banking |
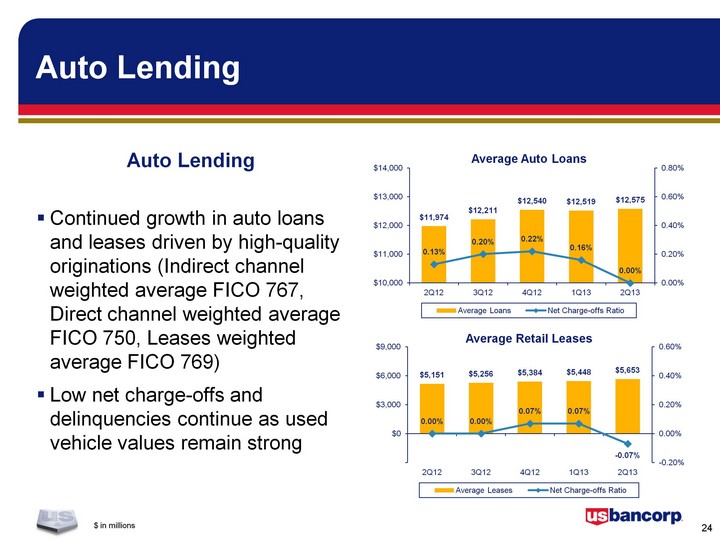
| Auto Lending $ in millions Continued growth in auto loans and leases driven by high-quality originations (Indirect channel weighted average FICO 767, Direct channel weighted average FICO 750, Leases weighted average FICO 769)Low net charge-offs and delinquencies continue as used vehicle values remain strong Auto Lending (CHART) (CHART) |
| U.S. Bancorp OverviewCapital ManagementConsumer and Small Business BankingSummary |
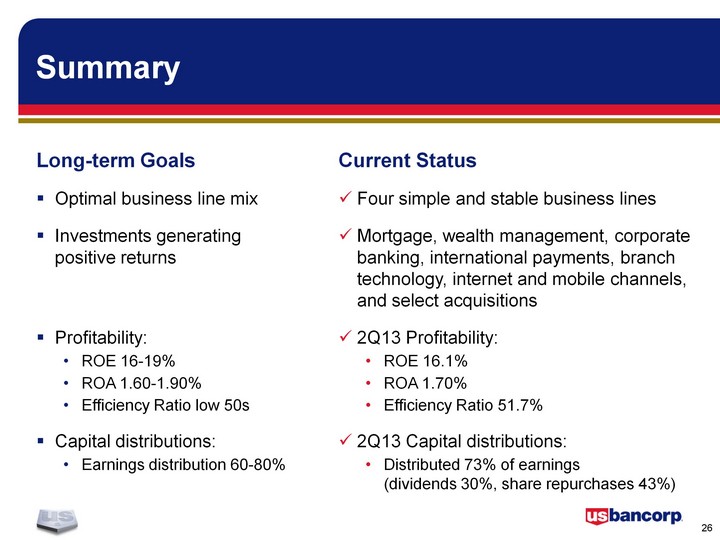
| Summary Long-term GoalsOptimal business line mixInvestments generating positive returns Profitability:ROE 16-19%ROA 1.60-1.90%Efficiency Ratio low 50sCapital distributions:Earnings distribution 60-80% Current StatusFour simple and stable business linesMortgage, wealth management, corporate banking, international payments, branch technology, internet and mobile channels, and select acquisitions2Q13 Profitability:ROE 16.1%ROA 1.70%Efficiency Ratio 51.7%2Q13 Capital distributions:Distributed 73% of earnings (dividends 30%, share repurchases 43%) |
| Appendix The CFA Society of Minnesota Investor Conference |
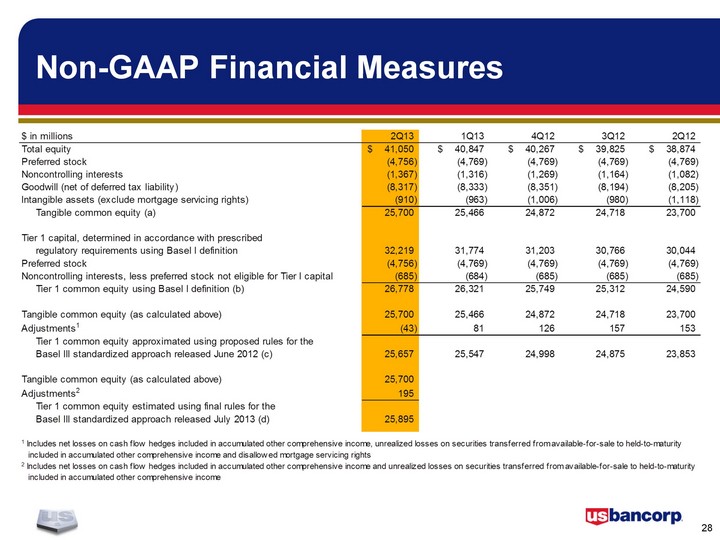
| Non-GAAP Financial Measures |
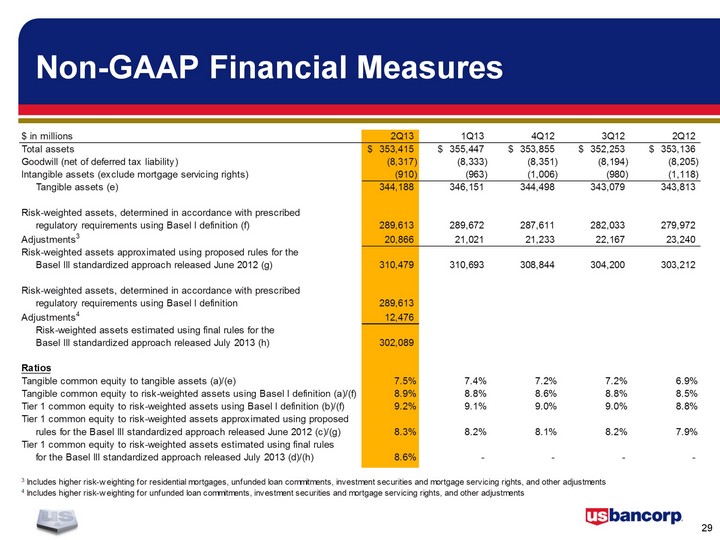
| Non-GAAP Financial Measures |

| The CFA Society of Minnesota Investor Conference |