Attached files
| file | filename |
|---|---|
| EX-99.1 - EXHIBIT 99.1 - PPL Corp | form8k-exhibit99_1.htm |
| 8-K - FORM 8-K - PPL Corp | form8k.htm |

© PPL Corporation 2013
2nd Quarter Earnings Call
PPL Corporation
August 1, 2013
August 1, 2013
Exhibit 99.2

© PPL Corporation 2013
2
Cautionary Statements and Factors
That May Affect Future Results
That May Affect Future Results
Any statements made in this presentation about future operating
results or other future events are forward-looking statements
under the Safe Harbor Provisions of the Private Securities
Litigation Reform Act of 1995. Actual results may differ materially
from such forward-looking statements. A discussion of factors
that could cause actual results or events to vary is contained in
the Appendix to this presentation and in the Company’s SEC
filings.

© PPL Corporation 2013
3
Second Quarter Earnings Results, Operational
Overview and 2013 Earnings Forecast
Overview and 2013 Earnings Forecast
Segment Results and Financial Overview
Q&A
W. H. Spence
P. A. Farr
Agenda
© PPL Corporation 2013
4
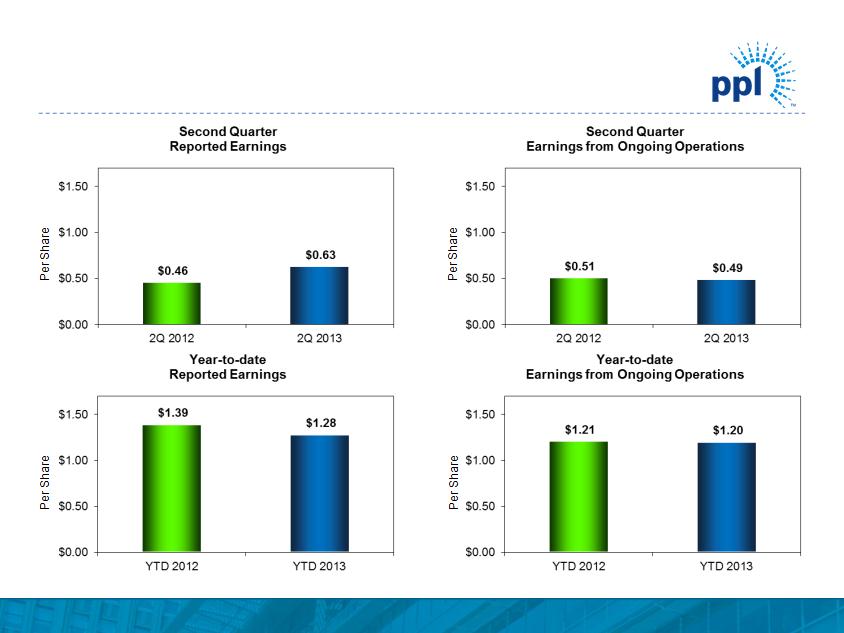
Note: See Appendix for the reconciliation of earnings from ongoing operations to reported earnings.
Earnings Results
© PPL Corporation 2013
5
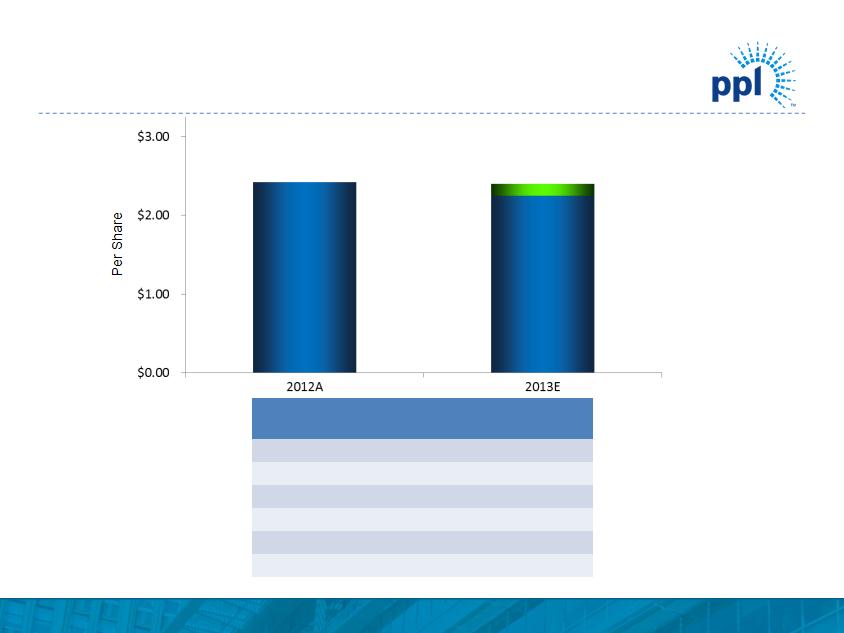
Note: See Appendix for the reconciliation of earnings from ongoing operations to reported earnings.
Increasing 2013 Ongoing Earnings Forecast
|
Segment
|
2012A
|
2013E
Midpoint |
|
Kentucky Regulated
|
$0.33
|
$0.46
|
|
U.K. Regulated
|
1.19
|
1.28
|
|
PA Regulated
|
0.22
|
0.27
|
|
Supply
|
0.68
|
0.34
|
|
Corporate and Other
|
|
(0.03)
|
|
Total
|
$2.42
|
$2.32
|
$2.42
$2.25
$2.40
$2.25

© PPL Corporation 2013
6
• RIIO-ED1 Business Plans Filed
– Initial assessment and fast-track Draft Determination in November
• Pennsylvania DSIC Implemented
– Effective July 1, 2013
• PPL Electric Utilities Transmission Updates
Regulated Operational Overview
© PPL Corporation 2013
7
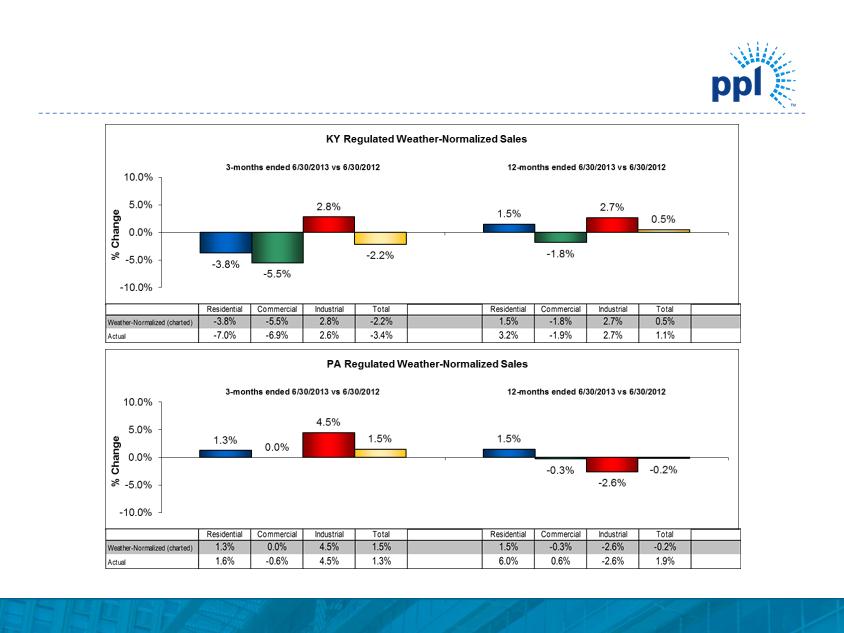
Note: Total includes Residential, Commercial and Industrial customer classes as well as “Other”, which is not depicted on the charts above.
Regulated Volume Variances

© PPL Corporation 2013
8
• Susquehanna Update
• Colstrip Unit 4 Generator Outage
Supply Operational Overview

© PPL Corporation 2013
9
Q2 2013
Q2 2012
Change
Kentucky Regulated
$0.08
$0.07
$0.01
U.K. Regulated
0.35
0.31
0.04
Pennsylvania Regulated
0.07
0.05
0.02
Supply
0.01
0.08
(0.07)
Corporate and Other
(0.02)
(0.02)
Total
$0.49
$0.51
$(0.02)
Ongoing Earnings Overview
Note: See Appendix for the reconciliation of earnings from ongoing operations to reported earnings.

© PPL Corporation 2013
10
|
|
2nd Quarter
|
|
|
2012 EPS - Ongoing Earnings
|
|
$0.07
|
|
Gross margins
|
0.03
|
|
|
Income taxes and other
|
(0.02)
|
|
|
Total
|
|
0.01
|
|
2013 EPS - Ongoing Earnings
|
|
$0.08
|
Kentucky Regulated Segment
Earnings Drivers
Earnings Drivers
Note: See Appendix for the reconciliation of earnings from ongoing operations to reported earnings.

© PPL Corporation 2013
11
|
|
2nd Quarter
|
|
|
2012 EPS - Ongoing Earnings
|
|
$0.31
|
|
Utility revenue
|
0.09
|
|
|
Depreciation
|
(0.01)
|
|
|
Income taxes and other
|
(0.01)
|
|
|
Dilution
|
(0.03)
|
|
|
Total
|
|
0.04
|
|
2013 EPS - Ongoing Earnings
|
|
$0.35
|
U.K. Regulated Segment
Earnings Drivers
Earnings Drivers
Note: See Appendix for the reconciliation of earnings from ongoing operations to reported earnings.

© PPL Corporation 2013
12
|
|
2nd Quarter
|
|
|
2012 EPS - Ongoing Earnings
|
|
$0.05
|
|
Gross delivery margins
|
0.02
|
|
|
O&M
|
0.01
|
|
|
Dilution
|
(0.01)
|
|
|
Total
|
|
0.02
|
|
2013 EPS - Ongoing Earnings
|
|
$0.07
|
Pennsylvania Regulated Segment
Earnings Drivers
Earnings Drivers
Note: See Appendix for the reconciliation of earnings from ongoing operations to reported earnings.

© PPL Corporation 2013
13
|
|
2nd Quarter
|
|
|
2012 EPS - Ongoing Earnings
|
|
$0.08
|
|
East energy margins
|
(0.07)
|
|
|
West energy margins
|
(0.02)
|
|
|
O&M
|
0.02
|
|
|
Depreciation
|
(0.01)
|
|
|
Income taxes and other
|
0.01
|
|
|
Total
|
|
(0.07)
|
|
2013 EPS - Ongoing Earnings
|
|
$0.01
|
Supply Segment Earnings Drivers
Note: See Appendix for the reconciliation of earnings from ongoing operations to reported earnings.

© PPL Corporation 2013
14
Appendix
© PPL Corporation 2013
15
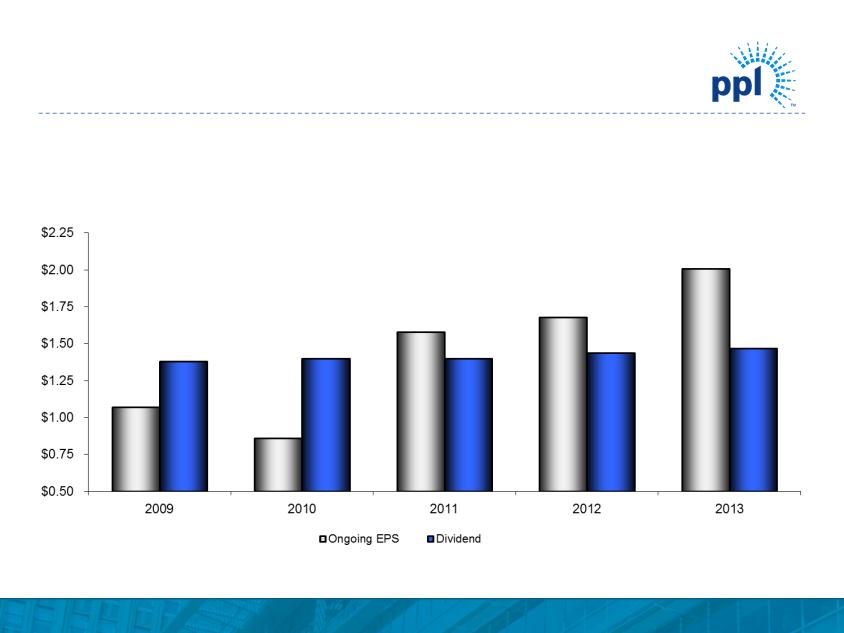
A predominant rate-regulated business mix provides strong support for
current dividend and a platform for future growth
current dividend and a platform for future growth
(1) Based on midpoint of revised forecast. Annualized dividend based on 2nd quarter declaration. Actual dividends to be determined by Board of Directors.
(2) From only regulated segments.
(3) See Appendix for the reconciliation of earnings from ongoing operations to reported earnings.
$/Share
Annualized
(2)
(1)
Dividend Profile
(3)

© PPL Corporation 2013
16
P
U.K. Electricity Distribution Price Control
Review Schedule
Review Schedule
|
RIIO-ED1 Timetable
|
|
|
Provisional Timing
|
Milestone
|
|
September 2012
|
Publication of Strategy Consultation
|
|
March 2013
|
Strategy decision published
|
|
July 2013
|
DNOs submit and publish business plans
|
|
November 2013
|
Initial assessment and fast-track Draft Determination published
|
|
March 2014
|
Fast-track Final Determination published
|
|
March 2014
|
Non-fast-track DNOs resubmit & publish business plans
|
|
July 2014
|
Non-fast-track Draft Determination published
|
|
November 2014
|
Non-fast-track Final Determination published
|
|
December 2014
|
Statutory Consultation on license modifications
|
|
April 1, 2015
|
New price control period commences
|
Source: Ofgem, June 2013
Completed
P
P
P
© PPL Corporation 2013
17
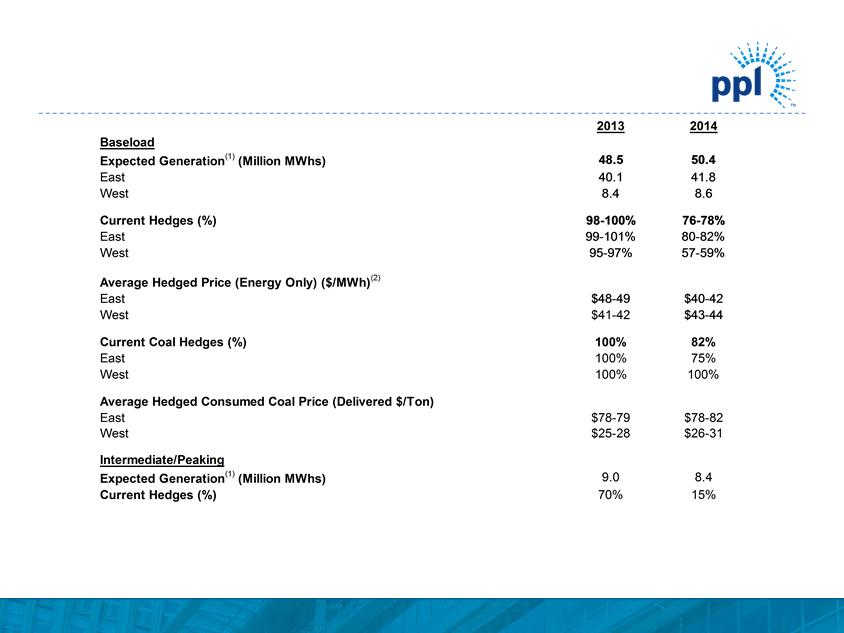
Enhancing Value Through Active Hedging
Capacity revenues are expected to be $590 million and $560 million for 2013 and 2014, respectively.
Note: As of June 30, 2013
(1) Represents expected sales of Supply segment based on current business plan assumptions.
(2) The 2014 ranges of average energy prices for existing hedges were estimated by determining the impact on the existing collars resulting from 2014 power prices at the
5th and 95th percentile confidence levels.
5th and 95th percentile confidence levels.
2013 2014 Baseload Expected Generation(1) (Million MWhs)48.550.4 East 40.141.8 West 8.48.6 Current Hedges (%)98-100%76-78% East 99-101%80-82% West95-97%57-59% Average Hedged Price (Energy Only) ($/MWh)(2) East$48-49$40-42West $41-42$43-44Current Coal Hedges (%)100%82% East 100%75% West100%100% Average Hedged Consumed Coal Price (Delivered $/Ton) East $78-79 $78-82 West $25-28 $26-31 Intermediate/Peaking Expected Generation(1) (Million MWhs)9.08.4 Current Hedges (%)70% 15%
© PPL Corporation 2013
18
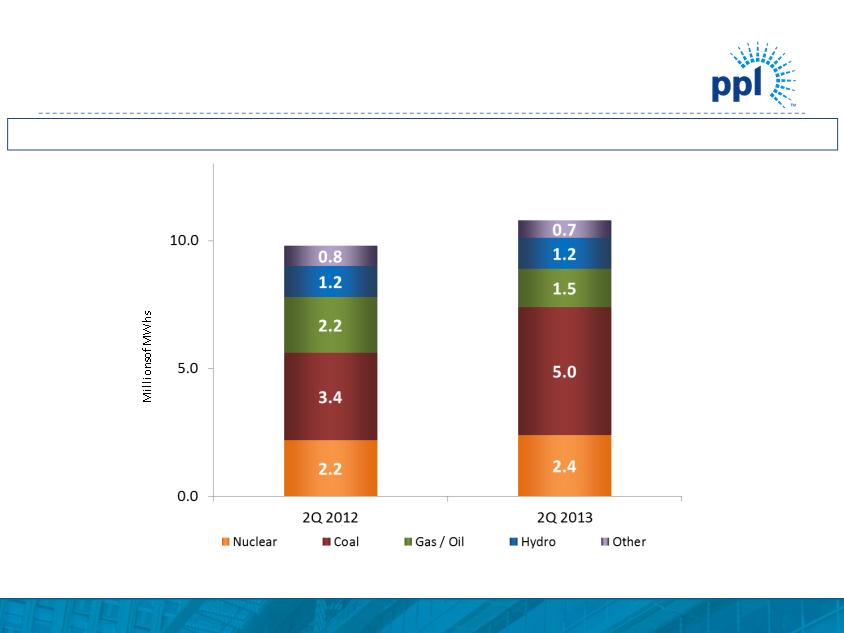
Competitive Generation Overview
Note: As of June 30, 2013
(1) Includes owned and contracted generation.
(2) Other includes PPAs, renewables and NUGS.
9.8
10.8
Total 2Q generation output(1) improved by more than 10% compared to 2Q 2012
(2)
© PPL Corporation 2013
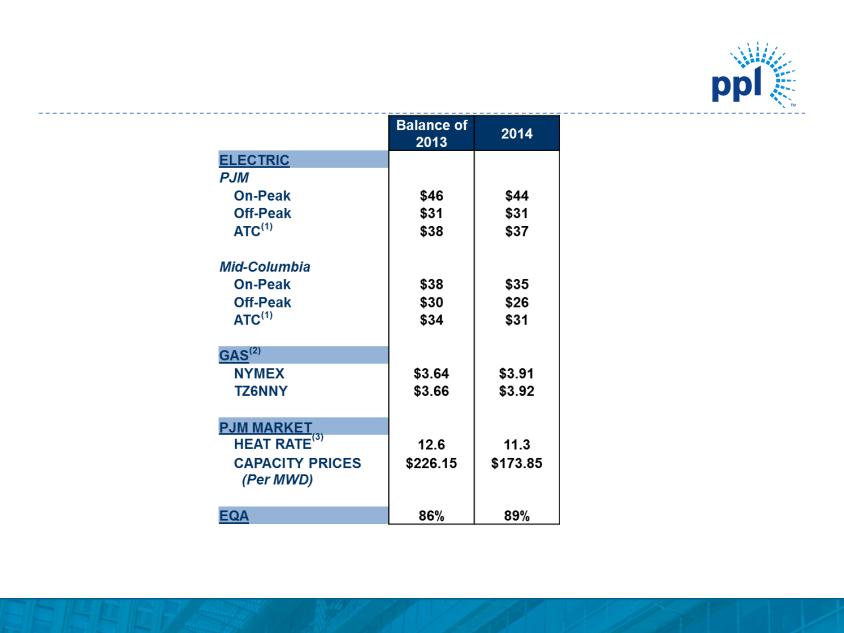
19
|
(1)
|
24-hour average.
|
|
(2)
|
NYMEX and TZ6NNY forward gas prices on 6/30/2013.
|
|
(3)
|
Market Heat Rate = PJM on-peak power price divided by TZ6NNY gas price.
|
Market Prices
Balance of 2013 2014 ELECTRIC PJM On-Peak $46 $44 Off-Peak $31 $31 ATC(1) $38 $37 Mid-Columbia On-Peak $38 $35 Off-Peak $30 $26 ATC(1) $34 $31 GAS(2) NYMEX $3.64 $3.91 TZ6NNY $3.66 $3.92 PJM MARKET HEAT RATE(3) 12.6 11.3 CAPACITY PRICES $226.15 $173.85 (Per MWD) EQA 86% 89%
© PPL Corporation 2013
20
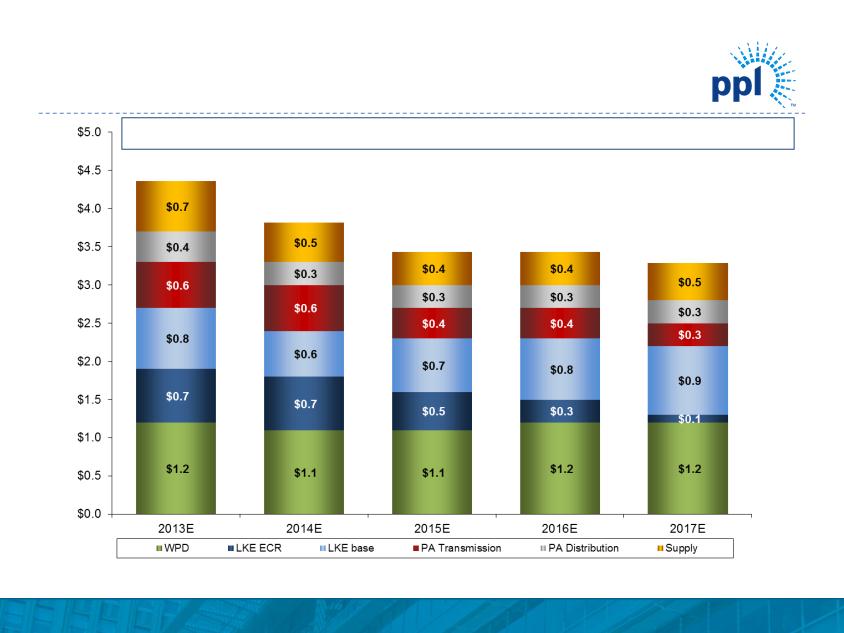
($ in billions)
Note: Corporate and Other capital expenditures average approximately $50 million per year.
(1) Figures based on assumed exchange rate of $1.58 / GBP.
(2) Expect between 80% and 90% to receive timely returns via ECR mechanism based on historical experience and future projections.
(1)
(2)
$4.4
$3.8
$3.4
$3.4
Operating Segment Capital Expenditures
Declining capital expenditures provide additional financial flexibility
$3.3
© PPL Corporation 2013
21
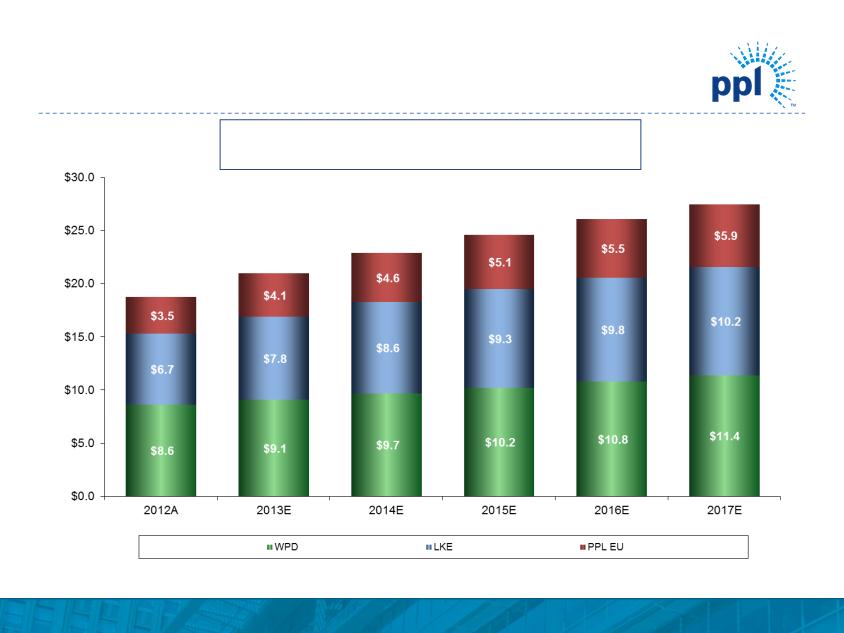
($ in billions)
(1) Represents capitalization for LKE, as LG&E and KU rate constructs are based on capitalization. Represents Regulatory Asset Value (RAV) for WPD.
(2) Figures based on assumed exchange rate of $1.58 / GBP and the RIIO-ED1 business plan as filed on July 1, 2013.
$18.8
$21.0
$22.9
$24.6
(2)
5-Year Regulatory Asset Base(1) CAGR: 7.9%
$26.1
Projected Regulated Rate Base Growth
$27.5
© PPL Corporation 2013
22
Weighted-Average Shares - Diluted EPS
(1) Original Forecast of average common shares outstanding included the issuance of common stock to satisfy the 2012 forward equity sale, the DRIP and the settlement of the
PPL Capital Funding equity units in 2013 and 2014.
(2) Revised Forecast reflects PPL’s projected average shares outstanding after adjusting for the removal of equity issuances under the DRIP, the dilutive impact of the 2012
forward equity sale, and the full expected impact of common shares under the 2010 and 2011 Equity Units including the accelerated recognition of equity unit shares
in the calculation of earnings per share effective January 1, 2013. The terms of the equity units have not changed, and the actual issuance of common stock under the
terms of the 2010 Equity Units occurred July 1, 2013 and is still scheduled to occur May 1, 2014 for the 2011 Equity Units.
Average Common Shares Outstanding
(in millions)
|
For the Year Ended
|
Original Forecast(1)
|
Revised Forecast(2)
|
|
December 31, 2013
|
615
|
665
|
|
December 31, 2014
|
670
|
670
|
|
December 31, 2015
|
680
|
670
|
© PPL Corporation 2013
23
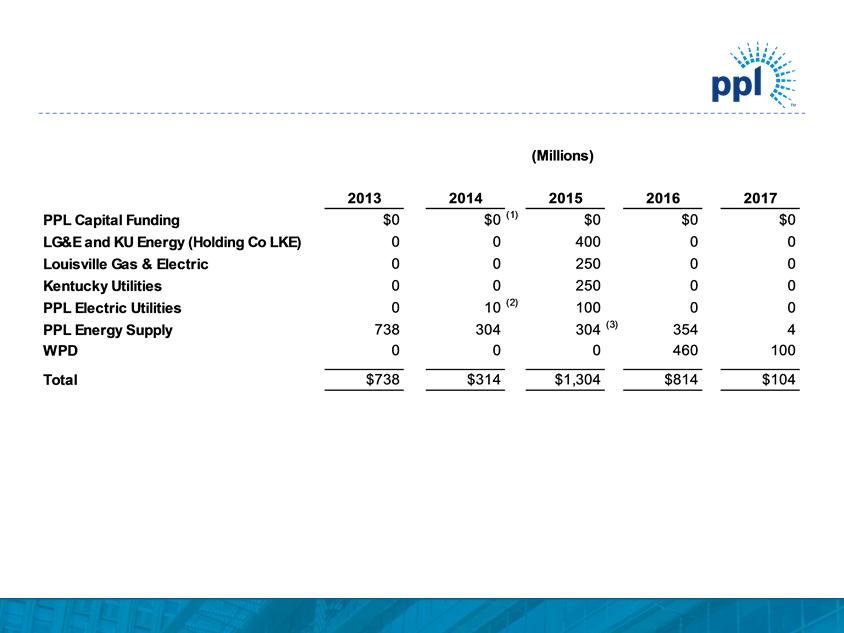
Note: As of June 30, 2013
(1) Excludes $978 million of junior subordinated notes due 2019 that are a component of PPL’s 2011 Equity Units and may be put back to PPL Capital
Funding if the remarketing in 2014 is not successful.
(2) Bonds defeased in substance in 2008 by depositing sufficient funds with the trustee.
(3) Includes $300 million of REset Put Securities due 2035 that are required to be put by the holders in October 2015 either for (a) purchase and
remarketing by a remarketing dealer or (b) repurchase by PPL Energy Supply.
Debt Maturities
2013 2014 2015 2016 2017 PPL Capital Funding $0 $0(1)$0 $0 $0 LG&E and KU Energy (Holding Co LKE)0 0 400 0 0 Louisville Gas & Electric 0 0 250 0 0 Kentucky Utilities 0 0 250 0 0 PPL Electric Utilities 0 10(2) 100 0 0 PPL Energy Supply 738 304 304(3) 354 4 WPD 0 0 0 460 100 Total $738 $314 $1,304 $814 $104(Millions) Debt Maturities
© PPL Corporation 2013
24
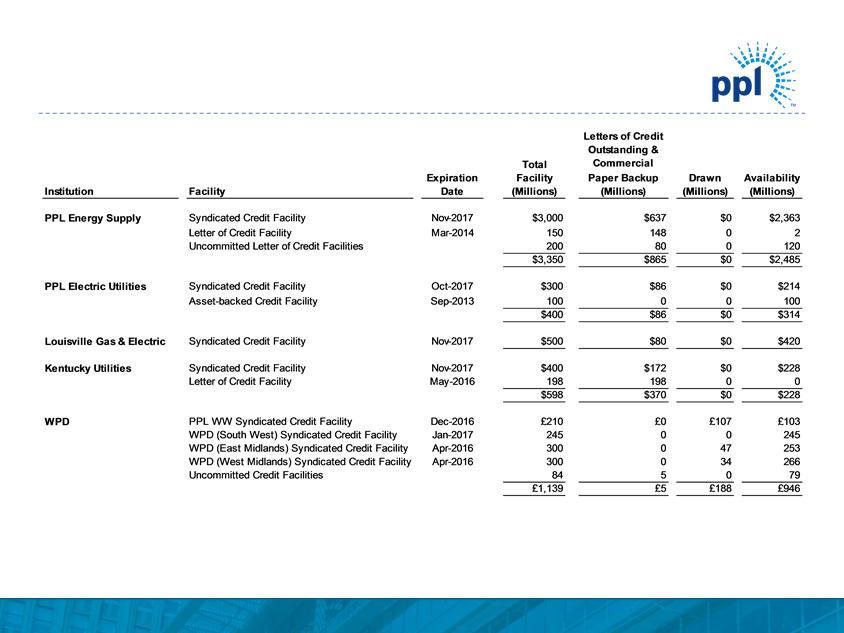
Liquidity Profile
Note: As of June 30, 2013
• Credit facilities consist of a diverse bank group, with no bank and its affiliates providing an aggregate commitment of more than 8% of the total committed
capacity for the domestic facilities and 13% of the total committed capacity for WPD’s facilities.
Institution Facility Expiration Date Total Facility(Millions) Letters of Credit Outstanding & Commercial Paper Backup (Millions) Drawn (Millions) Availability (Millions) PPL Energy Supply Syndicated Credit Facility Nov-2017 $3,000$637$0$2,363 Letter of Credit Facility Mar-2014 15014802 Uncommitted Letter of Credit Facilities 200800120$3,350$865$0$2,485PPL Electric Utilities Syndicated Credit Facility Oct-2017 $300$86$0$214 Asset-backed Credit Facility Sep-201310000100$400$86$0$314 Louisville Gas & Electric Syndicated Credit Facility Nov-2017$500$80$0$420 Kentucky Utilities Syndicated Credit Facility Nov-2017$400$172$0$228 Letter of Credit Facility May-201619819800$598$370$0$228WPDPPL WW Syndicated Credit Facility Dec-2016£210£0£107£103 WPD (South West) Syndicated Credit Facility Jan-201724500245 WPD (East Midlands) Syndicated Credit Facility Apr-2016300047253 WPD (West Midlands) Syndicated Credit Facility Apr-2016300034266 Uncommitted Credit Facilities 845079£1,139£5£188£946 24 Liquidity Profile Note: As of June 30, 2013 • Credit facilities consist of a diverse bank group, with no bank and its affiliates providing an aggregate commitment of more than 8% of the total committed capacity for the domestic facilities and 13% of the total committed capacity for WPD’s facilities.
© PPL Corporation 2013
25
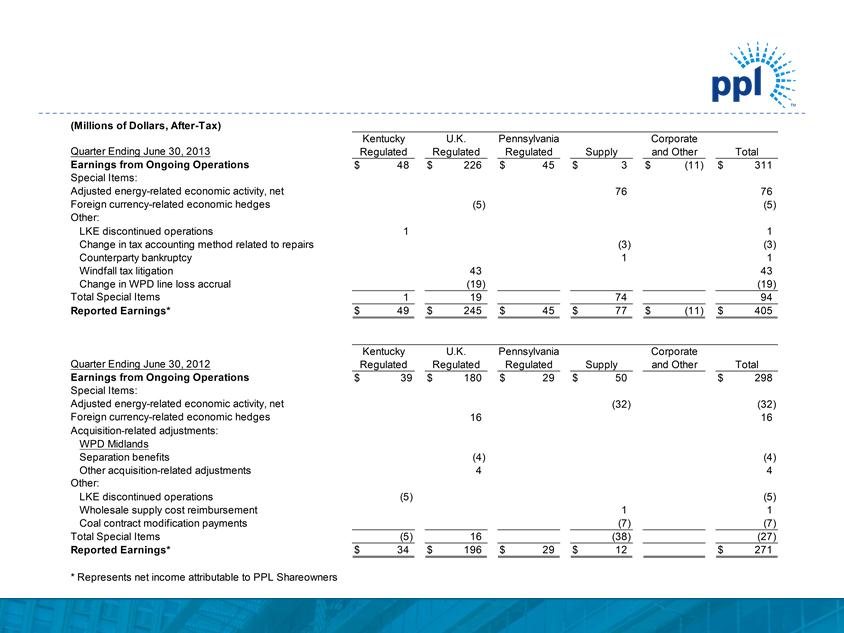
Reconciliation of Second Quarter Earnings from
Ongoing Operations to Reported Earnings
Ongoing Operations to Reported Earnings
Reconciliation of Second Quarter Earnings from Ongoing Operations to Reported Earnings $48 $226 $45 $3 $(11) $311 76 76 (5) (5) LKE discontinued operations1 1 Change in tax accounting method related to repairs(3) (3) Counterparty bankruptcy1 1 Windfall tax litigation43 43 Change in WPD line loss accrual(19) (19) 1 19 74 94 $49 $245 $45 $77 $(11) $405 Kentucky Regulated $39$180 $29 $50 $298 (32) (32) 16 16 Acquisition-related adjustments: WPD Midlands Separation benefits(4) (4) Other acquisition-related adjustments 4 4 LKE discontinued operations(5) (5) Wholesale supply cost reimbursement1 1 Coal contract modification payments(7) (7) Total Special Items(5) 16 (38) (27) $34 $196 $29 $12 $271 * Represents net income attributable to PPL Shareowners Foreign currency-related economic hedges Other: Reported Earnings* Earnings from Ongoing Operations Special Items: Adjusted energy-related economic activity, net Quarter Ending June 30, 2012 Regulated Regulated Supply and Other Total Total Special Items Reported Earnings* U.K. Pennsylvania Corporate Adjusted energy-related economic activity, net Foreign currency-related economic hedges Other: Earnings from Ongoing Operations Special Items: Total Quarter Ending June 30, 2013 Regulated Regulated Regulated Supply and Other(Millions of Dollars, After-Tax) Kentucky U.K. Pennsylvania Corporate
© PPL Corporation 2013
26
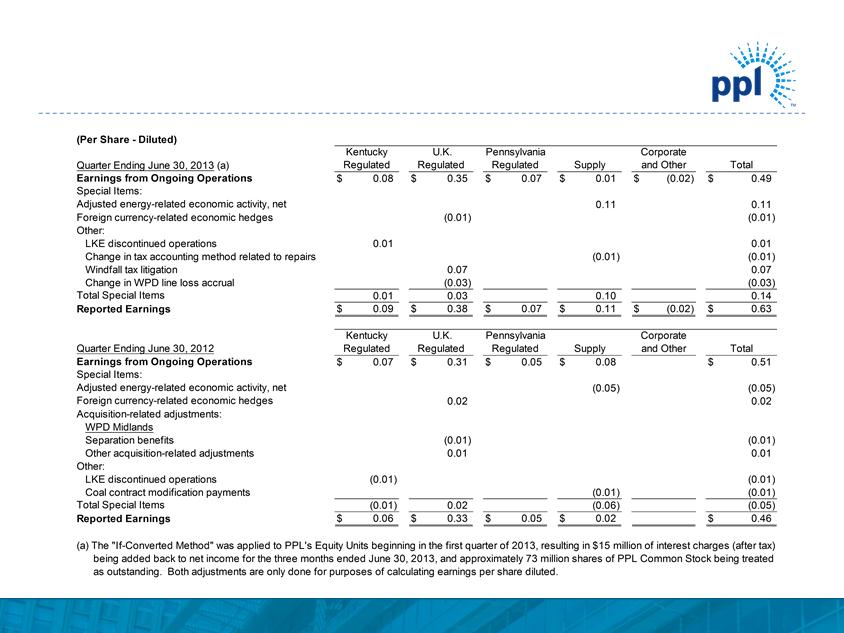
Reconciliation of Second Quarter Earnings from
Ongoing Operations to Reported Earnings
Ongoing Operations to Reported Earnings
Reconciliation of Second Quarter Earnings from Ongoing Operations to Reported Earnings (Per Share - Diluted) $0.08 $0.35 $0.07 $0.01 $(0.02) $0.49 0.11 0.11 Foreign currency-related economic hedges(0.01) (0.01) Other: LKE discontinued operations0.01 0.01 Change in tax accounting method related to repairs(0.01) (0.01) Windfall tax litigation0.07 0.07 Change in WPD line loss accrual(0.03) (0.03) 0.01 0.03 0.10 0.14 $0.09 $0.38 $0.07 $0.11 $(0.02) $0.63 $0.07 $0.31 $0.05 $0.08 $0.51 (0.05) (0.05) 0.02 0.02 Acquisition-related adjustments: WPD Midlands Separation benefits(0.01) (0.01) Other acquisition-related adjustments0.01 0.01 Other: LKE discontinued operations(0.01) (0.01) Coal contract modification payments(0.01) (0.01) (0.01) 0.02 (0.06) (0.05) $0.06 $0.33 $0.05 $0.02 $0.46 (a) The "If-Converted Method" was applied to PPL's Equity Units beginning in the first quarter of 2013, resulting in $15 million of interest charges (after tax) being added back to net income for the three months ended June 30, 2013, and approximately 73 million shares of PPL Common Stock being treated as outstanding. Both adjustments are only done for purposes of calculating earnings per share diluted. Reported Earnings Total Special Items Total Supply and Other Kentucky U.K. Pennsylvania Corporate Total Special Items Quarter Ending June 30, 2013 (a)Regulated Regulated Regulated Earnings from Ongoing Operations Special Items: Adjusted energy-related economic activity, net Reported Earnings Kentucky U.K. Pennsylvania Corporate Total Earnings from Ongoing Operations Special Items: Adjusted energy-related economic activity, net Foreign currency-related economic hedges Quarter Ending June 30, 2012 Regulated Regulated Regulated Supply and Other
© PPL Corporation 2013
27
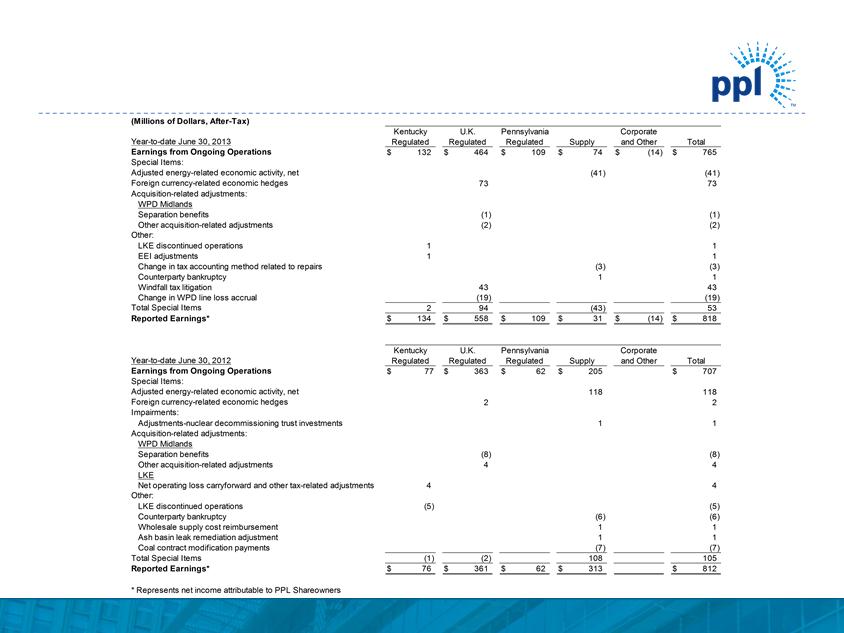
Reconciliation of Year-to-date Earnings from
Ongoing Operations to Reported Earnings
Ongoing Operations to Reported Earnings
Reconciliation of Year-to-date Earnings from Ongoing Operations to Reported Earnings $132 $464 $109 $74 $(14) $765 (41) (41) 73 73 Acquisition-related adjustments: WPD Midlands Separation benefits(1) (1) Other acquisition-related adjustments(2) (2) LKE discontinued operations1 1 EEI adjustments1 1 Change in tax accounting method related to repairs(3) (3) Counterparty bankruptcy1 1 Windfall tax litigation43 43 Change in WPD line loss accrual(19) (19) 2 94 (43) 53 $134 $558 $109 $31 $(14) $818 KentuckyRegulated$77$363 $62 $205 $707 118 118 2 2 Adjustments-nuclear decommissioning trust investments1 1 Acquisition-related adjustments: WPD Midlands Separation benefits(8) (8) Other acquisition-related adjustments 4 4 LKE Net operating loss carryforward and other tax-related adjustments4 4 LKE discontinued operations(5) (5) Counterparty bankruptcy(6) (6) Wholesale supply cost reimbursement1 1 Ash basin leak remediation adjustment1 1 Coal contract modification payments(7) (7) Total Special Items(1) (2) 108 105 $76 $361 $62 $313 $812 * Represents net income attributable to PPL Shareowners Regulated Regulated Reported Earnings* U.K. Pennsylvania Corporate Total Special Items Foreign currency-related economic hedges Impairments: Other: Reported Earnings* Other: Foreign currency-related economic hedges Adjusted energy-related economic activity, net(Millions of Dollars, After-Tax) Kentucky U.K. Pennsylvania Corporate Earnings from Ongoing Operations Special Items: Total Year-to-date June 30, 2013 Regulated Supply and Other Earnings from Ongoing Operations Special Items: Year-to-date June 30, 2012 Regulated Regulated Supply and Other Adjusted energy-related economic activity, net Total
© PPL Corporation 2013
28
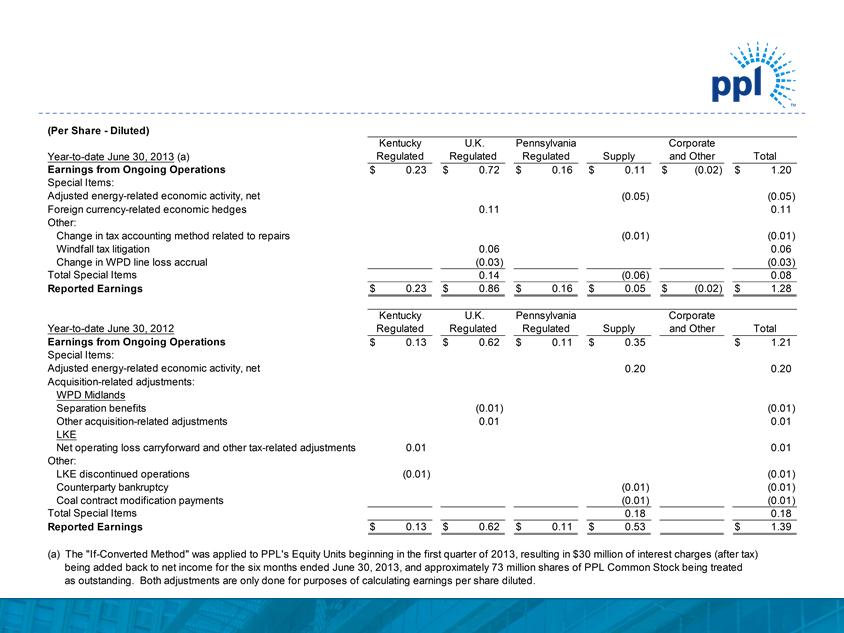
Reconciliation of Year-to-date Earnings from
Ongoing Operations to Reported Earnings
Ongoing Operations to Reported Earnings
Reconciliation of Year-to-date Earnings from Ongoing Operations to Reported Earnings (Per Share - Diluted) $0.23 $0.72 $0.16 $0.11 $(0.02) $1.20 (0.05) (0.05) Foreign currency-related economic hedges0.11 0.11 Other: Change in tax accounting method related to repairs(0.01) (0.01) Windfall tax litigation0.06 0.06 Change in WPD line loss accrual(0.03) (0.03) 0.14 (0.06) 0.08 $0.23 $0.86 $0.16 $0.05 $(0.02) $1.28 $0.13 $0.62 $0.11 $0.35 $1.21 0.20 0.20 Acquisition-related adjustments: WPD Midlands Separation benefits(0.01) (0.01) Other acquisition-related adjustments0.01 0.01 LKE Net operating loss carryforward and other tax-related adjustments0.01 0.01 Other: LKE discontinued operations(0.01) (0.01) Counterparty bankruptcy(0.01) (0.01) Coal contract modification payments(0.01) (0.01) 0.18 0.18 $0.13 $0.62 $0.11 $0.53 $1.39 (a) The "If-Converted Method" was applied to PPL's Equity Units beginning in the first quarter of 2013, resulting in $30 million of interest charges (after tax) being added back to net income for the six months ended June 30, 2013, and approximately 73 million shares of PPL Common Stock being treated as outstanding. Both adjustments are only done for purposes of calculating earnings per share diluted. Reported Earnings Total Special Items Total Supply and Other Kentucky U.K. Pennsylvania Corporate Total Special Items Year-to-date June 30, 2013 (a)Regulated Regulated Earnings from Ongoing Operations Special Items: Total Year-to-date June 30, 2012 Regulated Regulated Regulated Supply and Other Adjusted energy-related economic activity, net Reported Earnings U.K. Pennsylvania Corporate Kentucky Regulated Earnings from Ongoing Operations Special Items: Adjusted energy-related economic activity, net
© PPL Corporation 2013
29
Reconciliation of PPL’s Earnings from
Ongoing Operations to Reported Earnings
Ongoing Operations to Reported Earnings
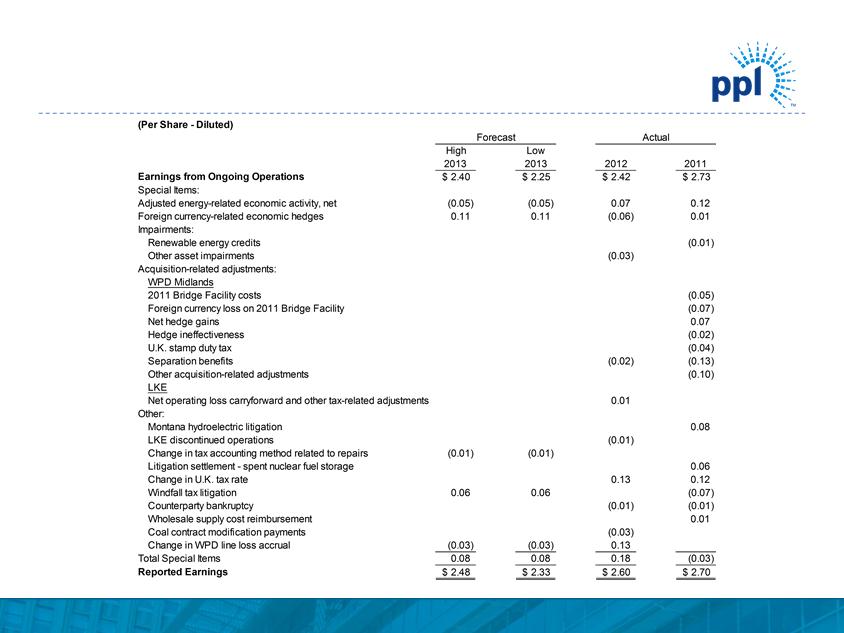
Reconciliation of PPL’s Earnings from Ongoing Operations to Reported Earnings High Low 20132013201220112.40$ 2.25$ 2.42$ 2.73$ (0.05) (0.05) 0.07 0.12 0.11 0.11 (0.06) 0.01 Renewable energy credits (0.01) Other asset impairments(0.03) WPD Midlands 2011 Bridge Facility costs (0.05) Foreign currency loss on 2011 Bridge Facility (0.07) Net hedge gains 0.07 Hedge ineffectiveness (0.02) U.K. stamp duty tax (0.04) Separation benefits(0.02) (0.13) Other acquisition-related adjustments (0.10) LKE Net operating loss carryforward and other tax-related adjustments0.01 Montana hydroelectric litigation 0.08 LKE discontinued operations(0.01) Change in tax accounting method related to repairs(0.01) (0.01) Litigation settlement - spent nuclear fuel storage 0.06 Change in U.K. tax rate0.13 0.12 Windfall tax litigation0.06 0.06 (0.07) Counterparty bankruptcy(0.01) (0.01) Wholesale supply cost reimbursement 0.01 Coal contract modification payments(0.03) Change in WPD line loss accrual(0.03) (0.03) 0.13 0.08 0.08 0.18 (0.03) 2.48$ 2.33$ 2.60$ 2.70$ Special Items: (Per Share - Diluted) Forecast Actual Earnings from Ongoing Operations Reported Earnings Adjusted energy-related economic activity, net Foreign currency-related economic hedges Impairments: Acquisition-related adjustments: Other: Total Special Items
© PPL Corporation 2013
30
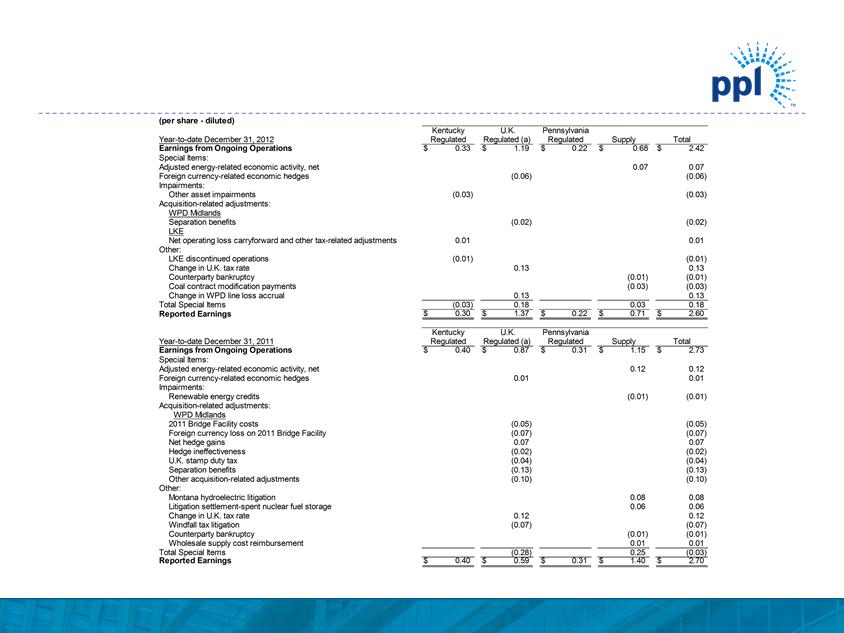
(a) The results of operations for 2012 are not comparable with 2011 due to the acquisition of WPD Midlands. WPD Midlands' results are consolidated on a one-month lag, and include eight months of results in 2011, as the date of
acquisition was April 1, 2011.
Reconciliation of PPL’s Earnings from
Ongoing Operations to Reported Earnings
Ongoing Operations to Reported Earnings
(a) The results of operations for 2012 are not comparable with 2011 due to the acquisition of WPD Midlands. WPD Midlands' results are consolidated on a one-month lag, and include eight months of results in 2011, as the date of acquisition was April 1, 2011. (per share - diluted) Year-to-date December 31, 2012 Earnings from Ongoing Operations$0.33 $1.19 $0.22 $0.68$2.42 Special Items: Adjusted energy-related economic activity, net0.070.07 Foreign currency-related economic hedges(0.06) (0.06) Impairments: Other asset impairments(0.03) (0.03) Acquisition-related adjustments: WPD Midlands Separation benefits(0.02) (0.02) LKE Net operating loss carryforward and other tax-related adjustments0.01 0.01 Other: LKE discontinued operations(0.01) (0.01) Change in U.K. tax rate0.13 0.13 Counterparty bankruptcy(0.01) (0.01) Coal contract modification payments(0.03) (0.03) Change in WPD line loss accrual0.13 0.13 Total Special Items(0.03) 0.18 0.03 0.18 Reported Earnings$0.30 $1.37 $0.22 $0.71 $2.60 Year-to-date December 31, 2011Earnings from Ongoing Operations$0.40 $0.87 $0.31 $1.15 $2.73 Special Items: Adjusted energy-related economic activity, net0.12 0.12 Foreign currency-related economic hedges0.01 0.01 Impairments: Renewable energy credits(0.01) (0.01) Acquisition-related adjustments: WPD Midlands 2011 Bridge Facility costs(0.05) (0.05) Foreign currency loss on 2011 Bridge Facility(0.07) (0.07) Net hedge gains0.07 0.07 Hedge ineffectiveness(0.02) (0.02) U.K. stamp duty tax(0.04) (0.04) Separation benefits(0.13) (0.13) Other acquisition-related adjustments(0.10) (0.10) Other: Montana hydroelectric litigation0.08 0.08 Litigation settlement-spent nuclear fuel storage0.06 0.06 Change in U.K. tax rate0.12 0.12 Windfall tax litigation(0.07) (0.07) Counterparty bankruptcy(0.01) (0.01) Wholesale supply cost reimbursement0.01 0.01 Total Special Items(0.28) 0.25 (0.03) Reported Earnings$0.40 $0.59 $0.31 $1.40 $2.70 Regulated Regulated (a)Regulated Supply Total Kentucky U.K. Pennsylvania Regulated Regulated (a)Regulated Kentucky U.K. Pennsylvania Supply Total Reconciliation of PPL’s Earnings from Ongoing Operations to Reported Earnings
© PPL Corporation 2013
31
Reconciliation of PPL’s Earnings from
Ongoing Operations to Reported Earnings
Ongoing Operations to Reported Earnings
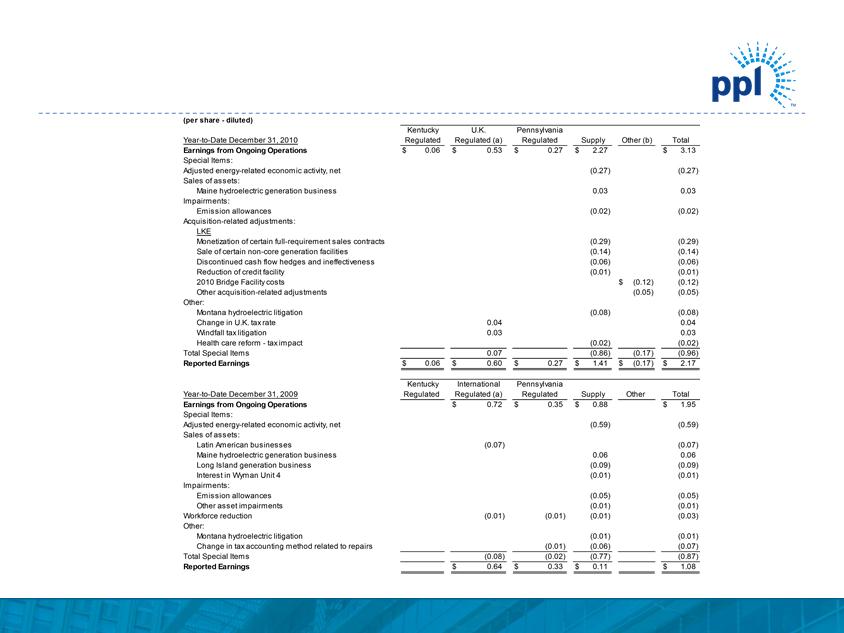
(a) Following the sale of PPL's Latin American Businesses, this segment was primarily engaged in regulated electricity delivery operations in the U.K. As a result, the "International Regulated" segment was renamed "U.K. Regulated."
(b) Includes certain costs incurred prior to the November 1, 2010 acquisition of LKE.
Reconciliation of PPL’s Earnings from Ongoing Operations to Reported Earnings (a) Following the sale of PPL's Latin American Businesses, this segment was primarily engaged in regulated electricity delivery operations in the U.K. As a result, the "International Regulated" segment was renamed "U.K. Regulated.“ (b) Includes certain costs incurred prior to the November 1, 2010 acquisition of LKE. Year-to-Date December 31, 2010$0.06 $0.53 $0.27 $2.27 $3.13 (0.27) (0.27) Maine hydroelectric generation business0.03 0.03 Emission allowances(0.02) (0.02) LKE Monetization of certain full-requirement sales contracts(0.29) (0.29) Sale of certain non-core generation facilities(0.14) (0.14) Discontinued cash flow hedges and ineffectiveness(0.06) (0.06) Reduction of credit facility(0.01) (0.01) 2010 Bridge Facility costs$(0.12) (0.12) Other acquisition-related adjustments(0.05) (0.05) Montana hydroelectric litigation(0.08) (0.08) Change in U.K. tax rate0.04 0.04 Windfall tax litigation0.03 0.03 Health care reform - tax impact(0.02) (0.02) 0.07 (0.86) (0.17) (0.96) $0.06 $0.60 $0.27 $1.41 $(0.17) $2.17 Year-to-Date December 31, 2009$0.72 $0.35 $0.88 $1.95 (0.59) (0.59) Latin American businesses(0.07) (0.07) Maine hydroelectric generation business0.06 0.06 Long Island generation business(0.09) (0.09) Interest in Wyman Unit 4(0.01) (0.01) Emission allowances(0.05) (0.05) Other asset impairments(0.01) (0.01) (0.01) (0.01) (0.01) (0.03) Montana hydroelectric litigation(0.01) (0.01) Change in tax accounting method related to repairs(0.01) (0.06) (0.07) (0.08) (0.02) (0.77) (0.87) $0.64 $0.33 $0.11 $1.08 Other International Regulated Regulated (a)Supply Pennsylvania Sales of assets: Other: Sales of assets: Impairments: Reported Earnings Acquisition-related adjustments: Adjusted energy-related economic activity, net Special Items: Earnings from Ongoing Operations Total Regulated Kentucky Kentucky U.K. Pennsylvania Special Items: Adjusted energy-related economic activity, net Regulated Supply Other (b) (per share - diluted) Total Regulated Regulated (a) Earnings from Ongoing Operations Total Special Items Impairments: Reported Earnings Total Special Items Other: Workforce reduction
© PPL Corporation 2013
32
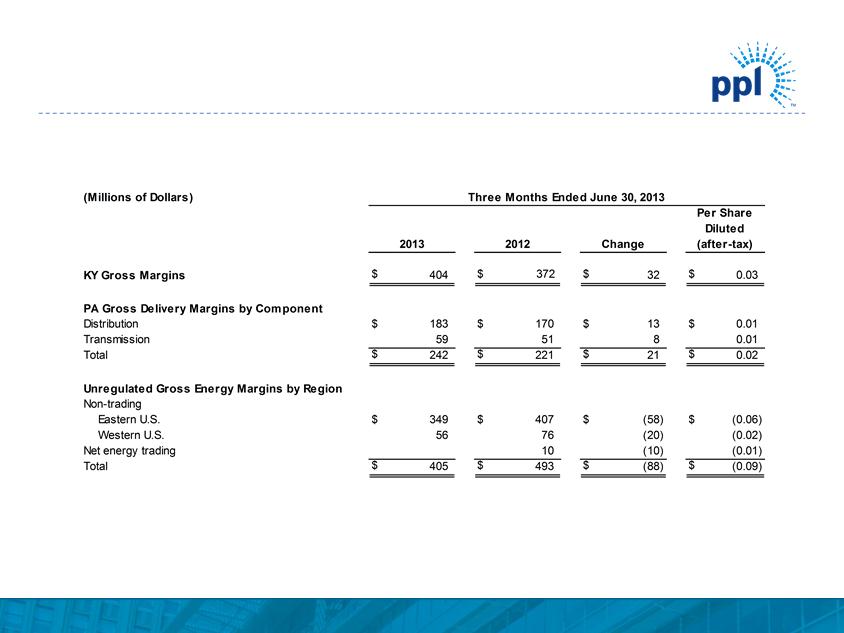
Gross Margins Summary
Gross Margins Summary $404$ 372 $32$0.03 $183 $170 $13$0.01 59 51 8 0.01 $242 $221 $21$0.02 Eastern U.S. $349 $407 $(58)$(0.06) Western U.S. 56 76 (20) (0.02) 10 (10) (0.01) $405 $493 $(88) $(0.09) (Millions of Dollars)Three Months Ended June 30, 2013Per Share Diluted 2013 2012 Change (after-tax) Non-trading Net energy trading Total KY Gross Margins PA Gross Delivery Margins by Component Distribution Transmission Total Unregulated Gross Energy Margins by Region
© PPL Corporation 2013
33
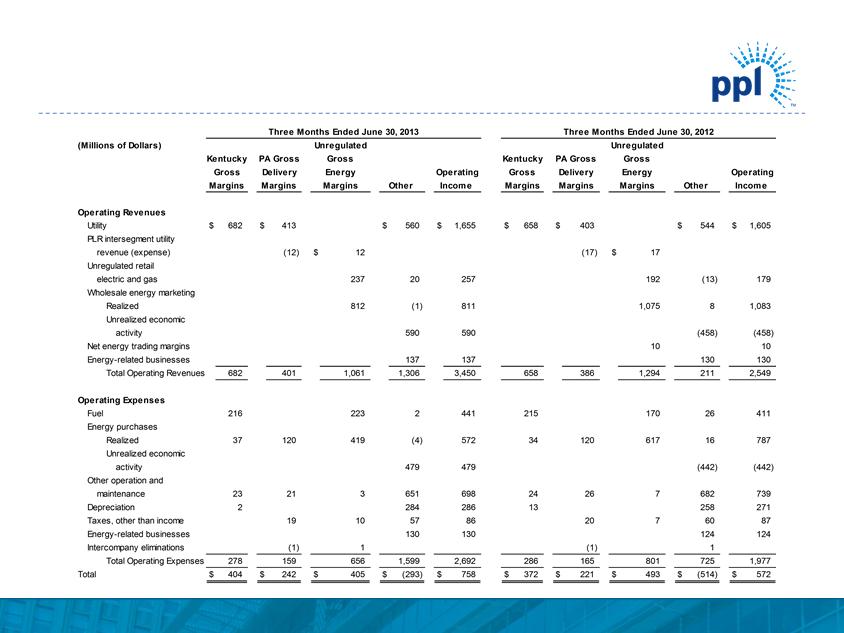
Reconciliation of Second Quarter
Margins to Operating Income
Margins to Operating Income
Reconciliation of Second Quarter Margins to Operating Income $682 $413 $560 $1,655 $658 $403 $544 $1,605 PLR intersegment utility(12) $12 (17) $17 237 20 257 192 (13) 179 812 (1) 811 1,075 8 1,083 activity590 590 (458) (458) 10 10 137 137 130 130 682 401 1,061 1,306 3,450 658 386 1,294 211 2,549 216 223 2 441 215 170 26 411 37 120 419 (4) 572 34 120 617 16 787 activity479 479 (442) (442) 23 21 3 651 698 24 26 7 682 739 2 284 286 13 258 271 19 10 57 86 20 7 60 87 130 130 124 124 (1) 1 (1) 1 278 159 656 1,599 2,692 286 165 801 725 1,977 $404 $242 $405 $(293) $758 $372 $221 $493 $(514) $572 Total maintenance Depreciation Taxes, other than income Energy-related businesses Intercompany eliminations Total Operating Expenses Operating Expenses Fuel Energy purchases Realized Unrealized economic Other operation and Wholesale energy marketing Realized Unrealized economic Net energy trading margins Energy-related businesses Total Operating Revenues Operating Revenues Utility revenue (expense) Unregulated retail electric and gas Income Operating Margins Margins Margins Other Income Margins Margins Margins Other Gross Gross Delivery Energy Operating Gross Delivery Energy Kentucky PA Gross Gross Kentucky PA Gross Three Months Ended June 30, 2013Three Months Ended June 30, 2012(Millions of Dollars)Unregulated Unregulated

© PPL Corporation 2013
34
Statements contained in this presentation, including statements with respect to future earnings, cash flows, financing, regulation and
corporate strategy are "forward-looking statements" within the meaning of the federal securities laws. Although PPL Corporation
believes that the expectations and assumptions reflected in these forward-looking statements are reasonable, these statements are
subject to a number of risks and uncertainties, and actual results may differ materially from the results discussed in the statements.
The following are among the important factors that could cause actual results to differ materially from the forward-looking statements:
market demand and prices for energy, capacity and fuel; weather conditions affecting customer energy usage and operating costs;
competition in power markets; the effect of any business or industry restructuring; the profitability and liquidity of PPL Corporation, its
subsidiaries and customers; new accounting requirements or new interpretations or applications of existing requirements; operating
performance of plants and other facilities; the length of scheduled and unscheduled outages at our generating plants; environmental
conditions and requirements and the related costs of compliance, including environmental capital expenditures and emission allowance
and other expenses; system conditions and operating costs; development of new projects, markets and technologies; performance of
new ventures; asset or business acquisitions and dispositions, and PPL Corporation’s ability to realize the expected benefits from
acquired businesses, including the 2010 acquisition of Louisville Gas and Electric Company and Kentucky Utilities Company and the
2011 acquisition of the Central Networks electricity distribution businesses in the U.K.; any impact of hurricanes or other severe
weather on our business, including any impact on fuel prices; receipt of necessary government permits, approvals, rate relief and
regulatory cost recovery; capital market conditions and decisions regarding capital structure; the impact of state, federal or foreign
investigations applicable to PPL Corporation and its subsidiaries; the outcome of litigation against PPL Corporation and its
subsidiaries; stock price performance; the market prices of equity securities and the impact on pension income and resultant cash
funding requirements for defined benefit pension plans; the securities and credit ratings of PPL Corporation and its subsidiaries;
political, regulatory or economic conditions in states, regions or countries where PPL Corporation or its subsidiaries conduct business,
including any potential effects of threatened or actual terrorism or war or other hostilities; foreign exchange rates; new state, federal or
foreign legislation, including new tax legislation; and the commitments and liabilities of PPL Corporation and its subsidiaries. Any such
forward-looking statements should be considered in light of such important factors and in conjunction with PPL Corporation's Form 10-
K and other reports on file with the Securities and Exchange Commission.
Forward-Looking Information Statement

© PPL Corporation 2013
35
Definitions of Non-GAAP Financial Measures
"Earnings from ongoing operations," also referred to as "ongoing earnings," should not be considered as an alternative to reported earnings, or
net income attributable to PPL shareowners, which is an indicator of operating performance determined in accordance with U.S. generally
accepted accounting principles (GAAP). PPL believes that "earnings from ongoing operations," although a non-GAAP financial measure, is also
useful and meaningful to investors because it provides management's view of PPL's fundamental earnings performance as another criterion in
making investment decisions. PPL's management also uses "earnings from ongoing operations" in measuring certain corporate performance
goals. Other companies may use different measures to present financial performance.
"Earnings from ongoing operations" is adjusted for the impact of special items. Special items include:
• Adjusted energy-related economic activity (as discussed below).
• Foreign currency-related economic hedges.
• Gains and losses on sales of assets not in the ordinary course of business.
• Impairment charges (including impairments of securities in the company's nuclear decommissioning trust funds).
• Workforce reduction and other restructuring effects.
• Acquisition-related adjustments.
• Other charges or credits that are, in management's view, not reflective of the company's ongoing operations.
Adjusted energy-related economic activity includes the changes in fair value of positions used to economically hedge a portion of the economic
value of PPL's competitive generation assets, full-requirement sales contracts and retail activities. This economic value is subject to changes in
fair value due to market price volatility of the input and output commodities (e.g., fuel and power) prior to the delivery period that was hedged.
Also included in adjusted energy-related economic activity is the premium amortization associated with options and the ineffective portion of
qualifying cash flow hedges and realized economic activity associated with the monetization of certain full-requirement sales contracts in 2010.
This economic activity was deferred, with the exception of the full-requirement sales contracts that were monetized, and included in earnings
from ongoing operations over the delivery period of the item that was hedged or upon realization. Management believes that adjusting for such
amounts provides a better matching of earnings from ongoing operations to the actual amounts settled for PPL's underlying hedged assets.
Please refer to the Notes to the Consolidated Financial Statements and MD&A in PPL Corporation's periodic filings with the Securities and
Exchange Commission for additional information on adjusted energy-related economic activity.

© PPL Corporation 2013
36
Definitions of Non-GAAP Financial Measures
PPL uses "Kentucky Gross Margins," "Pennsylvania Gross Delivery Margins" and "Unregulated Gross Energy Margins." These non-GAAP financial measures
are not intended to replace "Operating Income," which is determined in accordance with GAAP, as an indicator of overall operating performance. Other
companies may use different measures to analyze and to report on the results of their operations. PPL believes that these measures provide additional criteria
to make investment decisions. These performance measures are used, in conjunction with other information, internally by senior management and the Board of
Directors to manage the Kentucky Regulated, Pennsylvania Regulated and Supply segment operations, analyze each respective segment's actual results
compared with budget and, in certain cases, to measure certain corporate financial goals used in determining variable compensation.
"Kentucky Gross Margins" is a single financial performance measure of the Kentucky Regulated segment's electricity generation, transmission and distribution
operations as well as its distribution and sale of natural gas. In calculating this measure, fuel and energy purchases are deducted from revenues. In addition,
utility revenues and expenses associated with approved cost recovery mechanisms are offset. These mechanisms allow for recovery of certain expenses, return
on capital investments and performance incentives. Certain costs associated with these mechanisms, primarily ECR, DSM and GLT, are recorded as "Other
operation and maintenance" and "Depreciation." As a result, this measure represents the net revenues from the Kentucky Regulated segment's operations.
"Pennsylvania Gross Delivery Margins" is a single financial performance measure of the Pennsylvania Regulated segment's electric delivery operations, which
includes transmission and distribution activities. In calculating this measure, utility revenues and expenses associated with approved recovery mechanisms,
including energy provided as a PLR, are offset with minimal impact on earnings. Costs associated with these mechanisms are recorded in "Energy purchases,"
"Other operation and maintenance," which is primarily Act 129 costs, and "Taxes, other than income," which is primarily gross receipts tax. This performance
measure includes PLR energy purchases by PPL Electric from PPL EnergyPlus, which are reflected in "PLR intersegment utility revenue (expense)." As a
result, this measure represents the net revenues from the Pennsylvania Regulated segment's electric delivery operations.
"Unregulated Gross Energy Margins" is a single financial performance measure of the Supply segment's competitive energy non-trading and trading activities. In
calculating this measure, the Supply segment's energy revenues are offset by the cost of fuel, energy purchases, certain other operation and maintenance
expenses, primarily ancillary charges and gross receipts tax, which is recorded in "Taxes, other than income." This performance measure is relevant to PPL due
to the volatility in the individual revenue and expense lines on the Statements of Income that comprise "Unregulated Gross Energy Margins." This volatility
stems from a number of factors, including the required netting of certain transactions with ISOs and significant fluctuations in unrealized gains and losses. Such
factors could result in gains or losses being recorded in either "Wholesale energy marketing" or "Energy purchases" on the Statements of Income. This
performance measure includes PLR revenues from energy sales to PPL Electric by PPL EnergyPlus, which are recorded in "PLR intersegment utility revenue
(expense)." PPL excludes from "Unregulated Gross Energy Margins" the Supply segment's adjusted energy-related economic activity, which includes the
changes in fair value of positions used to economically hedge a portion of the economic value of PPL's competitive generation assets, full-requirement sales
contracts and retail activities. This economic value is subject to changes in fair value due to market price volatility of the input and output commodities (e.g., fuel
and power) prior to the delivery period that was hedged. Also included in adjusted energy-related economic activity is the premium amortization associated with
options, the ineffective portion of qualifying cash flow hedges and realized economic activity associated with the monetization of certain full-requirement sales
contracts in 2010. This economic activity was deferred, with the exception of the full-requirement sales contracts that were monetized, and included in
"Unregulated Gross Energy Margins" over the delivery period that was hedged or upon realization.