Attached files
| file | filename |
|---|---|
| 8-K - 8-K - CVR Refining, LP | a13-17320_28k.htm |
Exhibit 99.1
|
|
2nd Quarter 2013 Earnings Report August 1, 2013 0 |
|
|
Forward Looking Statements 1 This presentation should be reviewed in conjunction with CVR Refining, LP’s Second Quarter earnings conference call held on August 1, 2013. The following information contains forward-looking statements based on management’s current expectations and beliefs, as well as a number of assumptions concerning future events. These statements are subject to risks, uncertainties, assumptions and other important factors. You are cautioned not to put undue reliance on such forward-looking statements (including forecasts and projections regarding our future performance) because actual results may vary materially from those expressed or implied as a result of various factors, including, but not limited those set forth under “Risk Factors” in CVR Refining, LP’s Annual Report on Form 10-K, Quarterly Reports on Form 10-Q and any other filings CVR Refining, LP makes with the Securities and Exchange Commission. CVR Refining, LP assumes no obligation to, and expressly disclaims any obligation to, update or revise any forward-looking statements, whether as a result of new information, future events or otherwise. |
|
|
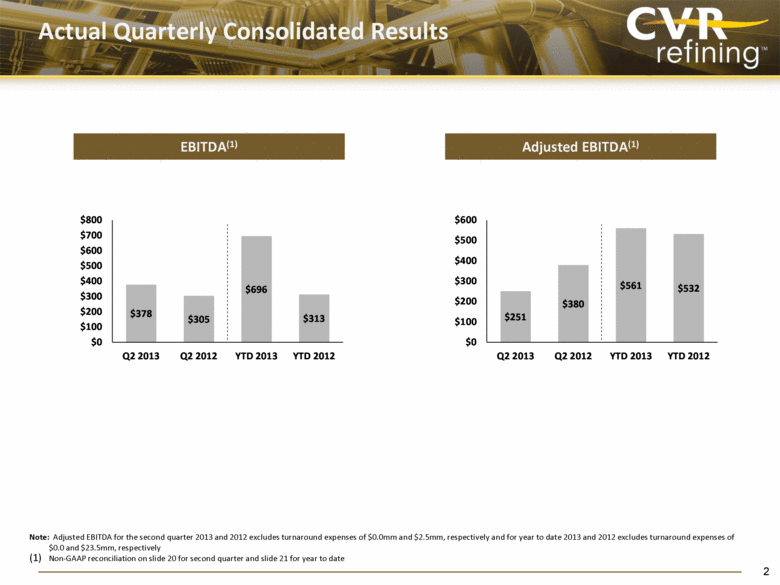
Actual Quarterly Consolidated Results Note: Adjusted EBITDA for the second quarter 2013 and 2012 excludes turnaround expenses of $0.0mm and $2.5mm, respectively and for year to date 2013 and 2012 excludes turnaround expenses of $0.0 and $23.5mm, respectively (1) Non-GAAP reconciliation on slide 20 for second quarter and slide 21 for year to date 2 EBITDA(1) Adjusted EBITDA(1) $251 $380 $561 $532 $0 $100 $200 $300 $400 $500 $600 Q2 2013 Q2 2012 YTD 2013 YTD 2012 $378 $305 $696 $313 $0 $100 $200 $300 $400 $500 $600 $700 $800 Q2 2013 Q2 2012 YTD 2013 YTD 2012 |
|
|
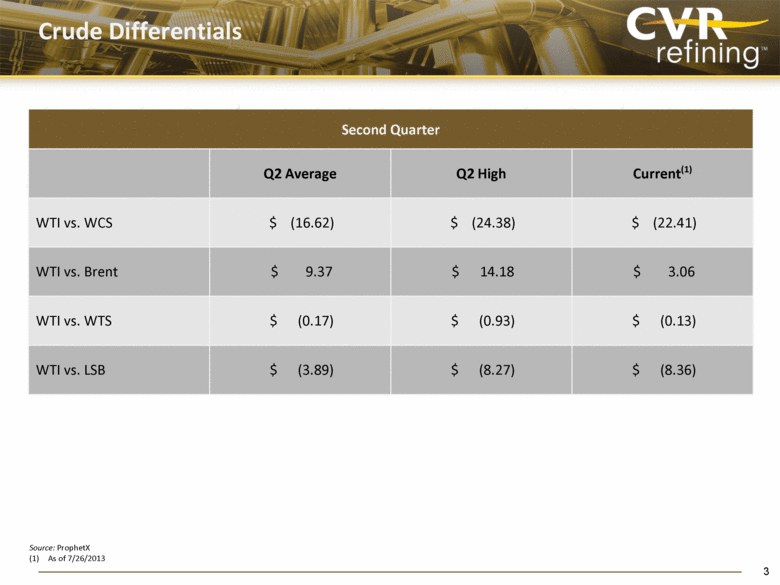
Crude Differentials Source: ProphetX (1) As of 7/26/2013 Second Quarter Q2 Average Q2 High Current(1) WTI vs. WCS $ (16.62) $ (24.38) $ (22.41) WTI vs. Brent $ 9.37 $ 14.18 $ 3.06 WTI vs. WTS $ (0.17) $ (0.93) $ (0.13) WTI vs. LSB $ (3.89) $ (8.27) $ (8.36) 3 |
|
|
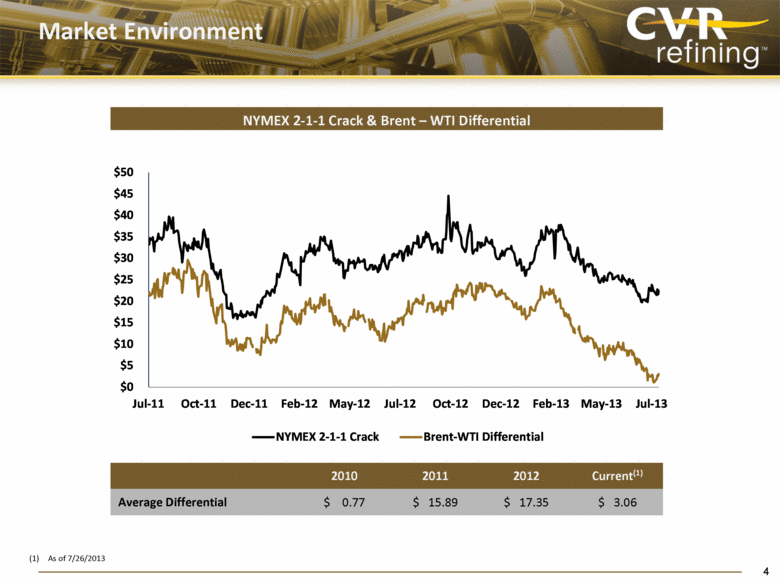
Market Environment (1) As of 7/26/2013 2010 2011 2012 Current(1) Average Differential $ 0.77 $ 15.89 $ 17.35 $ 3.06 4 NYMEX 2-1-1 Crack & Brent – WTI Differential $0 $5 $10 $15 $20 $25 $30 $35 $40 $45 $50 Jul-11 Oct-11 Dec-11 Feb-12 May-12 Jul-12 Oct-12 Dec-12 Feb-13 May-13 Jul-13 NYMEX 2-1-1 Crack Brent-WTI Differential |
|
|
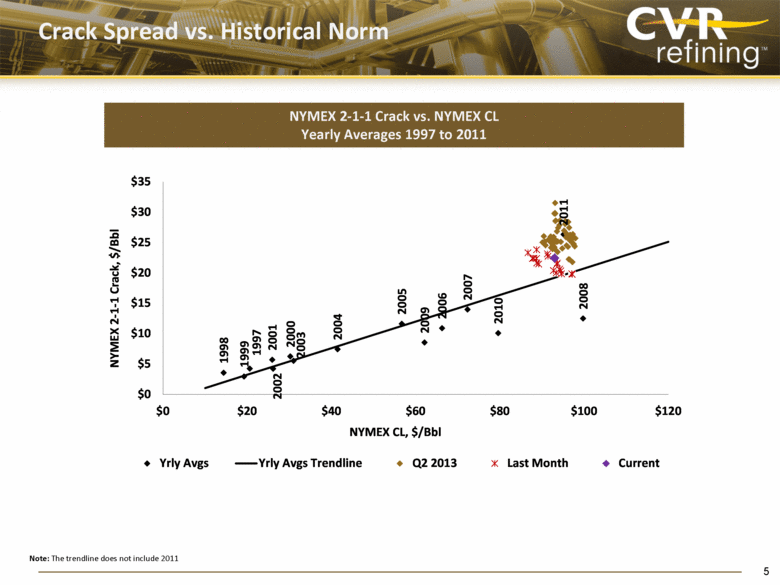
Crack Spread vs. Historical Norm Note: The trendline does not include 2011 5 NYMEX 2-1-1 Crack vs. NYMEX CL Yearly Averages 1997 to 2011 1997 1998 1999 2000 2001 2002 2003 2004 2005 2006 2007 2008 2009 2010 2011 $0 $5 $10 $15 $20 $25 $30 $35 $0 $20 $40 $60 $80 $100 $120 NYMEX 2 - 1 - 1 Crack, $/Bbl NYMEX CL, $/Bbl Yrly Avgs Yrly Avgs Trendline Q2 2013 Last Month Current |
|
|
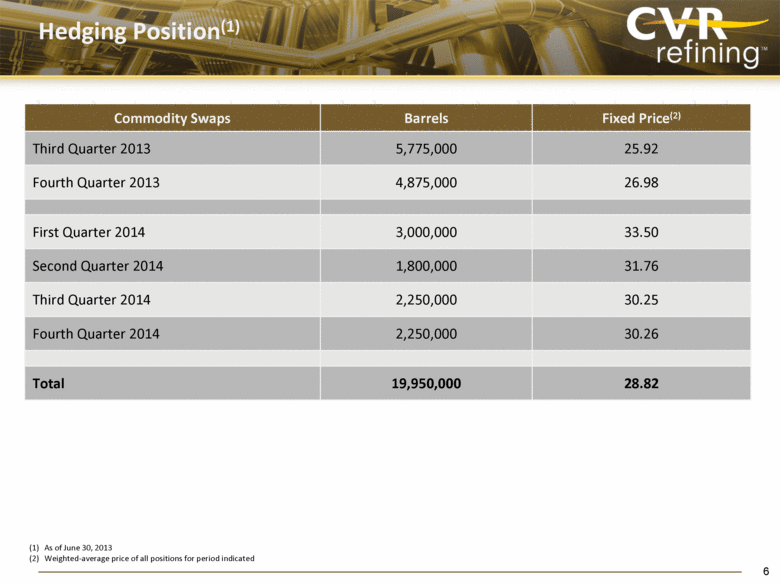
Hedging Position(1) (1) As of June 30, 2013 (2) Weighted-average price of all positions for period indicated Commodity Swaps Barrels Fixed Price(2) Third Quarter 2013 5,775,000 25.92 Fourth Quarter 2013 4,875,000 26.98 First Quarter 2014 3,000,000 33.50 Second Quarter 2014 1,800,000 31.76 Third Quarter 2014 2,250,000 30.25 Fourth Quarter 2014 2,250,000 30.26 Total 19,950,000 28.82 6 |
|
|
Financial |

|
|
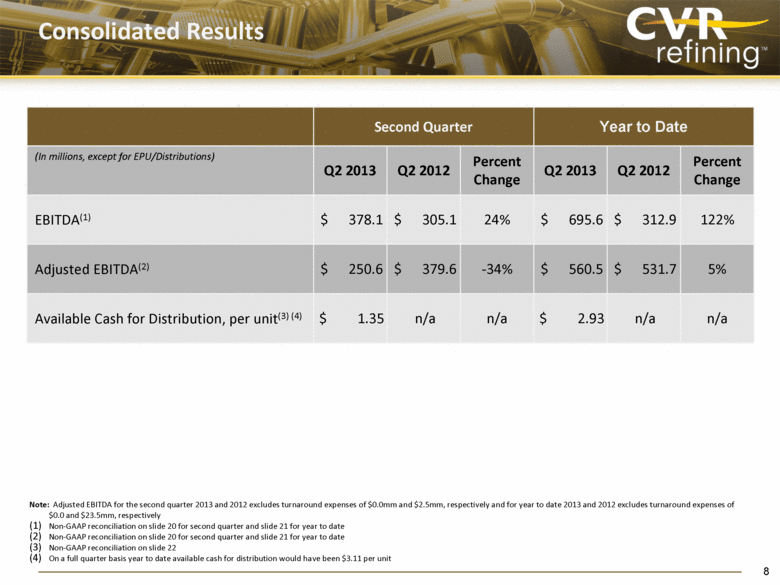
Consolidated Results Note: Adjusted EBITDA for the second quarter 2013 and 2012 excludes turnaround expenses of $0.0mm and $2.5mm, respectively and for year to date 2013 and 2012 excludes turnaround expenses of $0.0 and $23.5mm, respectively Non-GAAP reconciliation on slide 20 for second quarter and slide 21 for year to date Non-GAAP reconciliation on slide 20 for second quarter and slide 21 for year to date Non-GAAP reconciliation on slide 22 On a full quarter basis year to date available cash for distribution would have been $3.11 per unit Second Quarter Year to Date (In millions, except for EPU/Distributions) Q2 2013 Q2 2012 Percent Change Q2 2013 Q2 2012 Percent Change EBITDA(1) $ 378.1 $ 305.1 24% $ 695.6 $ 312.9 122% Adjusted EBITDA(2) $ 250.6 $ 379.6 -34% $ 560.5 $ 531.7 5% Available Cash for Distribution, per unit(3) (4) $ 1.35 n/a n/a $ 2.93 n/a n/a 8 |
|
|
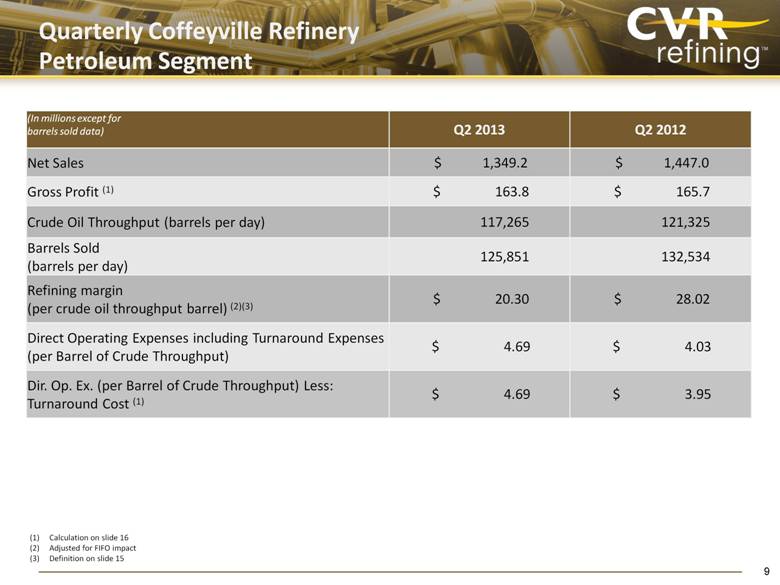
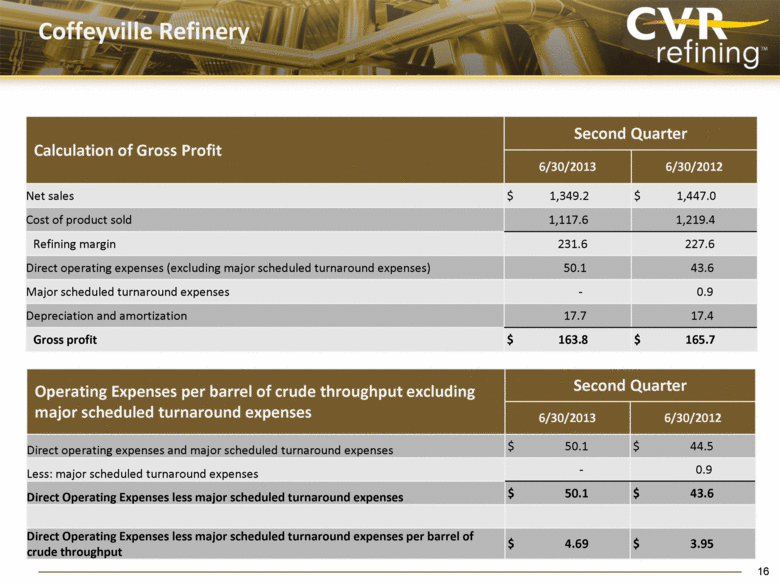
Quarterly Coffeyville Refinery Petroleum Segment (In millions except for barrels sold data) Q2 2013 Q2 2012 Net Sales $ 1,349.2 $ 1,447.0 Gross Profit (1) $ 163.8 $ 165.7 Crude Oil Throughput (barrels per day) 117,265 121,325 Barrels Sold (barrels per day) 125,851 132,534 Refining margin (per crude oil throughput barrel) (2)(3) $ 20.30 $ 28.02 Direct Operating Expenses including Turnaround Expenses (per Barrel of Crude Throughput) $ 4.69 $ 4.03 Dir. Op. Ex. (per Barrel of Crude Throughput) Less: Turnaround Cost (1) $ 4.69 $ 3.95 Calculation on slide 16 Adjusted for FIFO impact Definition on slide 15 Excluding major scheduled turnaround expenses 9 Gross Profit Bridge (4) $165.7 $163.8 $77.3 $15.6 $6.5 $96.6 $0.9 $0 $20 $40 $60 $80 $100 $120 $140 $160 $180 $200 Q2 2012 Gross Profit Refining Margin Other (D&A, FIFO) Volume Direct Oper. Cost Turn- around Q2 2013 Gross Profit $ in millions |
|
|
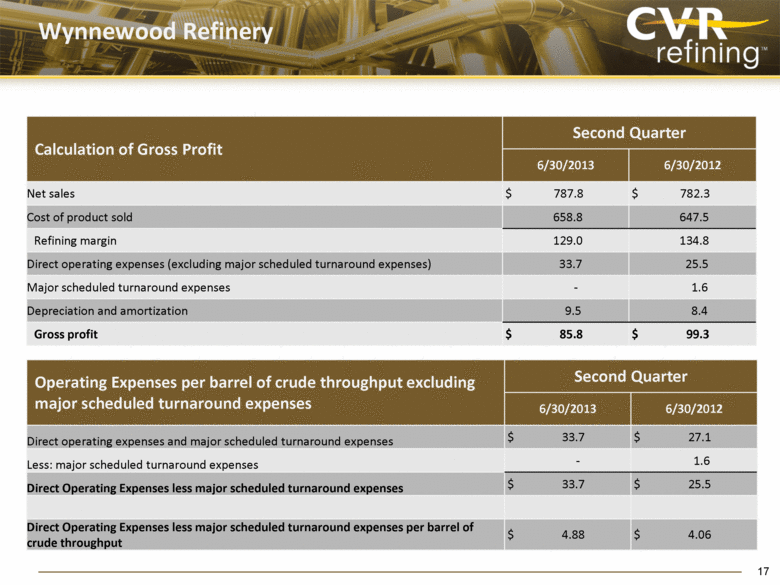
Quarterly Wynnewood Refinery Petroleum Segment Calculation on slide 17 Adjusted for FIFO impact Definition on slide 15 Excluding major scheduled turnaround expenses 10 (In millions except for barrels sold data) Q2 2013 Q2 2012 Net Sales $ 787.8 $ 782.3 Gross Profit (1) $ 85.8 $ 99.3 Crude Oil Throughput (barrels per day) 75,936 69,046 Barrels Sold (barrels per day) 74,463 74,072 Refining margin (per crude oil throughput barrel) (2)(3) $ 17.34 $ 25.23 Direct Operating Expenses including Turnaround Expenses (per Barrel of Crude Throughput) $ 4.88 $ 4.30 Dir. Op. Ex. (per Barrel of Crude Throughput) Less: Turnaround Cost (1) $ 4.88 $ 4.06 Gross Profit Bridge (4) $99.3 $85.8 $39.5 $8.2 $31.8 $0.8 $1.6 $0 $20 $40 $60 $80 $100 $120 Q2 2012 Gross Profit Refining Margin Other (D&A, FIFO) Volume Direct Oper. Cost Turn- around Q2 2013 Gross Profit $ in millions |

|
|
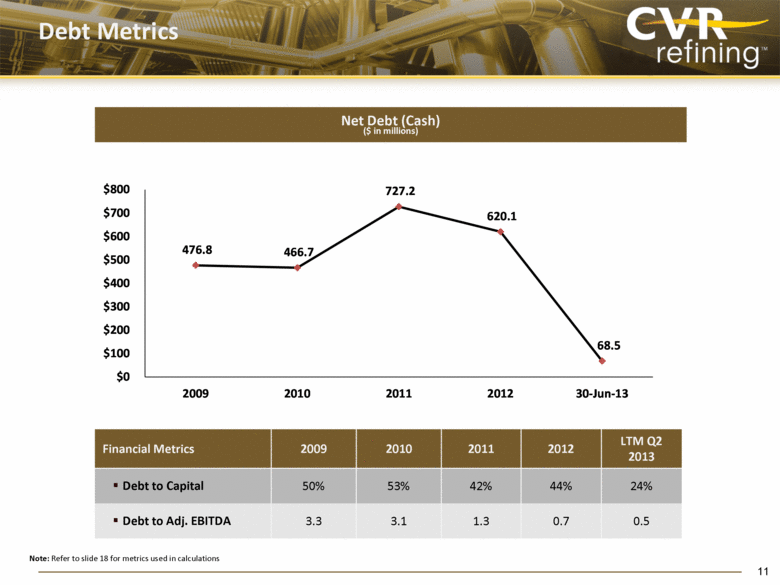
Debt Metrics Note: Refer to slide 18 for metrics used in calculations Financial Metrics 2009 2010 2011 2012 LTM Q2 2013 Debt to Capital 50% 53% 42% 44% 24% Debt to Adj. EBITDA 3.3 3.1 1.3 0.7 0.5 11 Net Debt (Cash) ($ in millions) 476.8 466.7 727.2 620.1 68.5 $0 $100 $200 $300 $400 $500 $600 $700 $800 2009 2010 2011 2012 30-Jun-13 |
|
|
Appendix |
|
|
Non-GAAP Financials Measures 13 To supplement the actual results in accordance with GAAP for the applicable periods, the Company also uses non-GAAP measures as discussed below, which are reconciled to GAAP-based results. These non-GAAP financial measures should not be considered an alternative for GAAP results. The adjustments are provided to enhance an overall understanding of the Company’s financial performance for the applicable periods and are indicators management believes are relevant and useful for planning and forecasting future periods. |

|
|
Non-GAAP Financials Measures EBITDA and Adjusted EBITDA. EBITDA represents net income before (i) interest expense and other financing costs, net of interest income, (ii) income tax expense and (iii) depreciation and amortization. Adjusted EBITDA represents EBITDA adjusted for FIFO impacts (favorable) unfavorable; share-based compensation, non-cash; major scheduled turnaround expenses; loss on disposition of fixed assets; unrealized gains and losses on derivatives; loss on extinguishment of debt and expenses associated with the Gary-Williams acquisition. We present Adjusted EBITDA because it is the starting point for our available cash for distribution. EBITDA and Adjusted EBITDA are not recognized terms under GAAP and should not be substituted for net income or cash flow from operations. Management believes that EBITDA and Adjusted EBITDA enables investors to better understand our ability to make distributions to our common unitholders, evaluate our ongoing operating results and allows for greater transparency in reviewing our overall financial, operational and economic performance. EBTIDA and Adjusted EBITDA presented by other companies may not be comparable to our presentation, since each company may define these terms differently. 14 Available cash for distribution is not a recognized term under GAAP. Available cash should not be considered in isolation or as an alternative to net income or operating income, as a measure of operating performance. In addition, available cash for distribution is not presented as, and should not be considered an alternative to cash flows from operations or as a measure of liquidity. Available cash as reported by the Partnership may not be comparable to similarly title measures of other entities; thereby limiting its usefulness as a comparative measure. Gross profit per crude oil throughput barrel is a measure calculated as the total dollar figures for gross profit divided by the applicable number of crude oil throughput barrels for the period. |
|
|
Non-GAAP Financials Measures 15 Refining margin per crude oil throughput barrel is a measurement calculated as the difference between net sales and cost of product sold (exclusive of depreciation and amortization). Refining margin is a non-GAAP measure that we believe is important to investors in evaluating our refineries' performance as a general indication of the amount above our cost of product sold that we are able to sell refined products. Each of the components used in this calculation (net sales and cost of product sold exclusive of depreciation and amortization) can be taken directly from our Statement of Operations. Our calculation of refining margin may differ from similar calculations of other companies in our industry, thereby limiting its usefulness as a comparative measure. In order to derive the refining margin per crude oil throughput barrel, we utilize the total dollar figures for refining margin as derived above and divide by the applicable number of crude oil throughput barrels for the period. We believe that refining margin is important to enable investors to better understand and evaluate our ongoing operating results and allow for greater transparency in the review of our overall financial, operational and economic performance. Refining margin per crude oil throughput barrel adjusted for FIFO impact is a measurement calculated as the difference between net sales and cost of product sold (exclusive of depreciation and amortization) adjusted for FIFO impacts. Refining margin adjusted for FIFO impact is a non-GAAP measure that we believe is important to investors in evaluating our refineries’ performance as a general indication of the amount above our cost of product sold (taking into account the impact of our utilization of FIFO) that we are able to sell refined products. Our calculation of refining margin adjusted for FIFO impact may differ from calculations of other companies in our industry, thereby limiting its usefulness as a comparative measure. Under our FIFO accounting method, changes in crude oil prices can cause fluctuations in the inventory valuation of our crude oil, work in process and finished goods, thereby resulting in favorable FIFO impacts when crude oil prices increase and unfavorable FIFO impacts when crude oil prices decrease. |
|
|
Coffeyville Refinery Calculation of Gross Profit Second Quarter 6/30/2013 6/30/2012 Net sales $ 1,349.2 $ 1,447.0 Cost of product sold 1,117.6 1,219.4 Refining margin 231.6 227.6 Direct operating expenses (excluding major scheduled turnaround expenses) 50.1 43.6 Major scheduled turnaround expenses - 0.9 Depreciation and amortization 17.7 17.4 Gross profit $ 163.8 $ 165.7 16 Operating Expenses per barrel of crude throughput excluding major scheduled turnaround expenses Second Quarter 6/30/2013 6/30/2012 Direct operating expenses and major scheduled turnaround expenses $ 50.1 $ 44.5 Less: major scheduled turnaround expenses - 0.9 Direct Operating Expenses less major scheduled turnaround expenses $ 50.1 $ 43.6 Direct Operating Expenses less major scheduled turnaround expenses per barrel of crude throughput $ 4.69 $ 3.95 |
|
|
Wynnewood Refinery Calculation of Gross Profit Second Quarter 6/30/2013 6/30/2012 Net sales $ 787.8 $ 782.3 Cost of product sold 658.8 647.5 Refining margin 129.0 134.8 Direct operating expenses (excluding major scheduled turnaround expenses) 33.7 25.5 Major scheduled turnaround expenses - 1.6 Depreciation and amortization 9.5 8.4 Gross profit $ 85.8 $ 99.3 17 Operating Expenses per barrel of crude throughput excluding major scheduled turnaround expenses Second Quarter 6/30/2013 6/30/2012 Direct operating expenses and major scheduled turnaround expenses $ 33.7 $ 27.1 Less: major scheduled turnaround expenses - 1.6 Direct Operating Expenses less major scheduled turnaround expenses $ 33.7 $ 25.5 Direct Operating Expenses less major scheduled turnaround expenses per barrel of crude throughput $ 4.88 $ 4.06 |
|
|
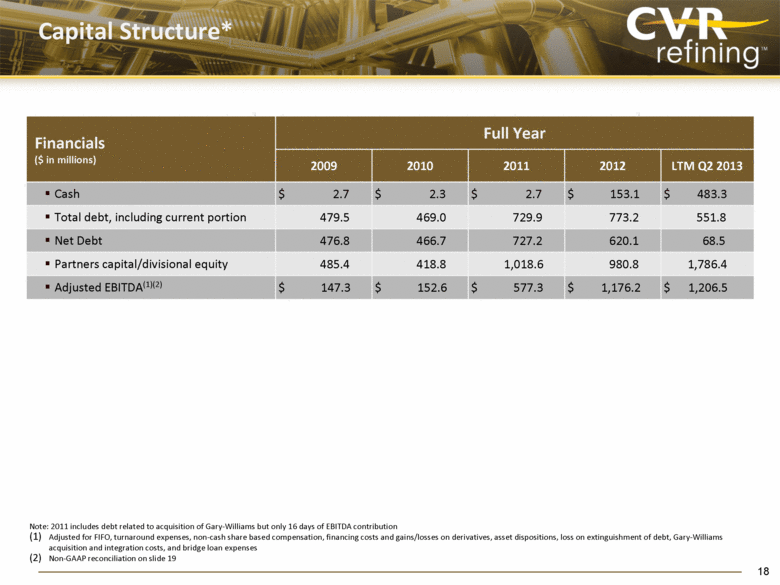
Capital Structure* Note: 2011 includes debt related to acquisition of Gary-Williams but only 16 days of EBITDA contribution Adjusted for FIFO, turnaround expenses, non-cash share based compensation, financing costs and gains/losses on derivatives, asset dispositions, loss on extinguishment of debt, Gary-Williams acquisition and integration costs, and bridge loan expenses Non-GAAP reconciliation on slide 19 Financials ($ in millions) Full Year 2009 2010 2011 2012 LTM Q2 2013 Cash $ 2.7 $ 2.3 $ 2.7 $ 153.1 $ 483.3 Total debt, including current portion 479.5 469.0 729.9 773.2 551.8 Net Debt 476.8 466.7 727.2 620.1 68.5 Partners capital/divisional equity 485.4 418.8 1,018.6 980.8 1,786.4 Adjusted EBITDA(1)(2) $ 147.3 $ 152.6 $ 577.3 $ 1,176.2 $ 1,206.5 18 |
|
|
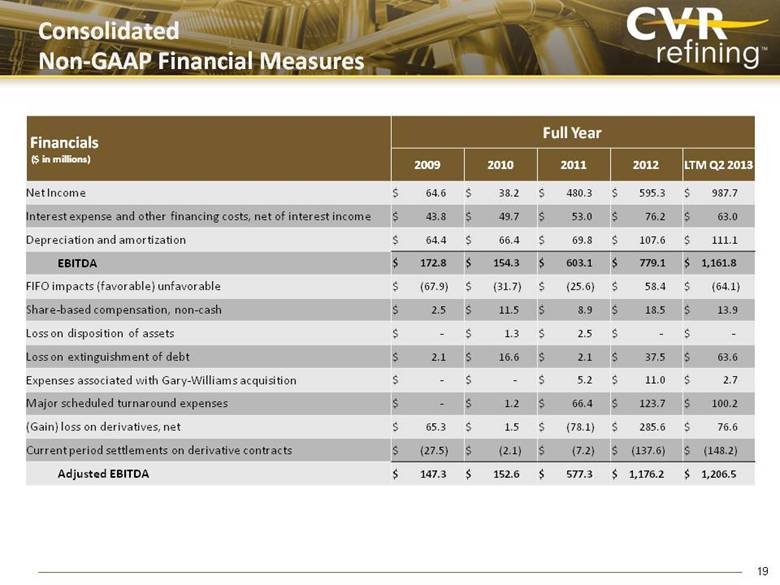
Consolidated Non-GAAP Financial Measures Financials ($ in millions) Full Year 2009 2010 2011 2012 LTM Q2 2013 Net Income $ 64.6 $ 38.2 $ 480.3 $ 595.3 $ 987.7 Interest expense and other financing costs, net of interest income $ 43.8 $ 49.7 $ 53.0 $ 76.2 $ 63.0 Depreciation and amortization $ 64.4 $ 66.4 $ 69.8 $ 107.6 $ 111.1 EBITDA $ 172.8 $ 154.3 $ 603.1 $ 779.1 $ 1,161.8 FIFO impacts (favorable) unfavorable $ (67.9) $ (31.7) $ (25.6) $ 58.4 $ (64.1) Share-based compensation, non-cash $ 2.5 $ 11.5 $ 8.9 $ 18.5 $ 13.9 Loss on disposition of assets $ - $ 1.3 $ 2.5 $ - $ - Loss on extinguishment of debt $ 2.1 $ 16.6 $ 2.1 $ 37.5 $ 63.6 Expenses associated with Gary-Williams acquisition $ - $ - $ 5.2 $ 11.0 $ 2.7 Major scheduled turnaround expenses $ - $ 1.2 $ 66.4 $ 123.7 $ 100.2 (Gain) loss on derivatives, net $ 65.3 $ 1.5 $ (78.1) $ 285.6 $ 76.6 Current period settlements on derivative contracts $ (27.5) $ (2.1) $ (7.2) $ (137.6) $ (148.2) Adjusted EBITDA $ 147.3 $ 152.6 $ 577.3 $ 1,176.2 $ 1,206.5 19 |
|
|
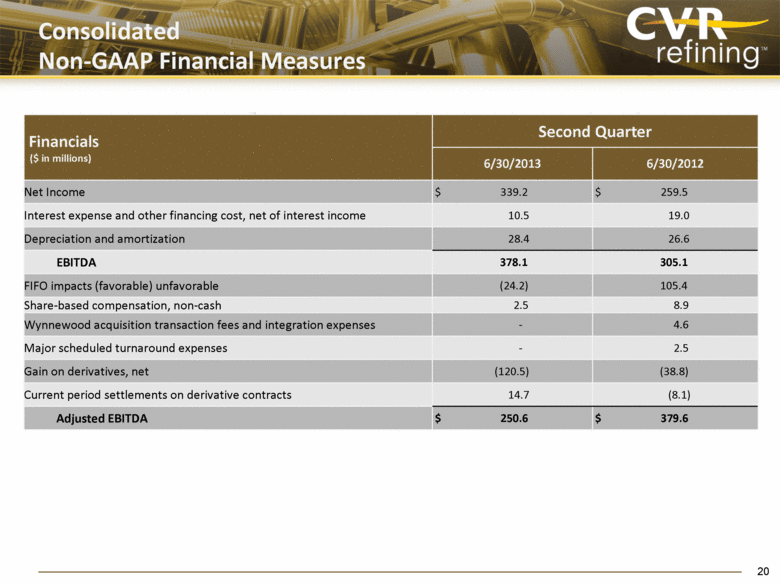
Consolidated Non-GAAP Financial Measures Financials ($ in millions) Second Quarter 6/30/2013 6/30/2012 Net Income $ 339.2 $ 259.5 Interest expense and other financing cost, net of interest income 10.5 19.0 Depreciation and amortization 28.4 26.6 EBITDA 378.1 305.1 FIFO impacts (favorable) unfavorable (24.2) 105.4 Share-based compensation, non-cash 2.5 8.9 Wynnewood acquisition transaction fees and integration expenses - 4.6 Major scheduled turnaround expenses - 2.5 Gain on derivatives, net (120.5) (38.8) Current period settlements on derivative contracts 14.7 (8.1) Adjusted EBITDA $ 250.6 $ 379.6 20 |
|
|
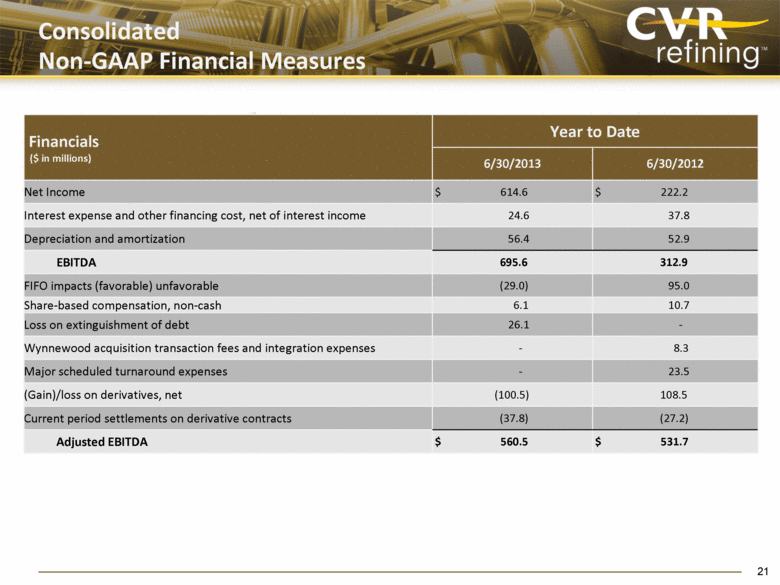
Consolidated Non-GAAP Financial Measures Financials ($ in millions) Year to Date 6/30/2013 6/30/2012 Net Income $ 614.6 $ 222.2 Interest expense and other financing cost, net of interest income 24.6 37.8 Depreciation and amortization 56.4 52.9 EBITDA 695.6 312.9 FIFO impacts (favorable) unfavorable (29.0) 95.0 Share-based compensation, non-cash 6.1 10.7 Loss on extinguishment of debt 26.1 - Wynnewood acquisition transaction fees and integration expenses - 8.3 Major scheduled turnaround expenses - 23.5 (Gain)/loss on derivatives, net (100.5) 108.5 Current period settlements on derivative contracts (37.8) (27.2) Adjusted EBITDA $ 560.5 $ 531.7 21 |
|
|
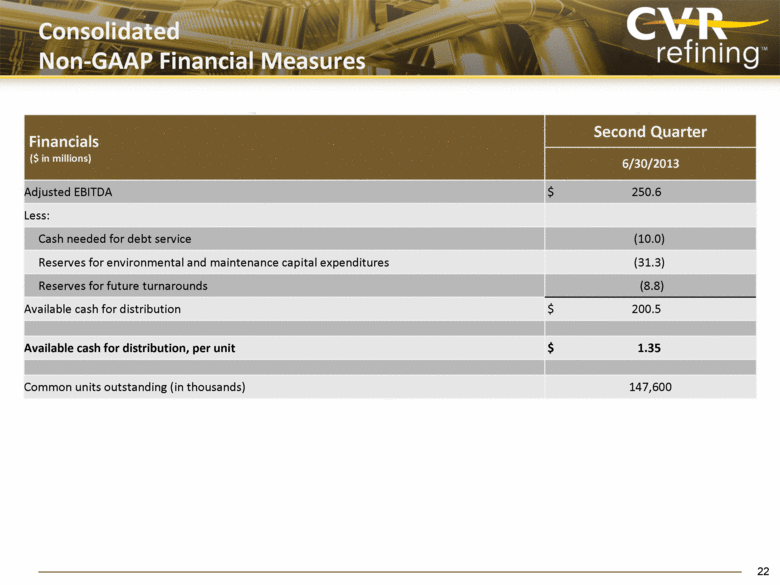
Consolidated Non-GAAP Financial Measures Financials ($ in millions) Second Quarter 6/30/2013 Adjusted EBITDA $ 250.6 Less: Cash needed for debt service (10.0) Reserves for environmental and maintenance capital expenditures (31.3) Reserves for future turnarounds (8.8) Available cash for distribution $ 200.5 Available cash for distribution, per unit $ 1.35 Common units outstanding (in thousands) 147,600 22 |