Attached files
| file | filename |
|---|---|
| 8-K - 8-K - Apollo Commercial Real Estate Finance, Inc. | d576928d8k.htm |
| EX-99.1 - EX-99.1 - Apollo Commercial Real Estate Finance, Inc. | d576928dex991.htm |
 August 1, 2013
Supplemental Financial Information Presentation
Q2 2013
Information is as of June 30, 2013 except as otherwise noted.
It should not be assumed that investments made in the future will be
profitable or will equal the performance of investments in this document.
Exhibit 99.2 |
 1
COMMERCIAL REAL ESTATE FINANCE, INC. (“ARI”)
Legal Disclaimer
We make forward-looking statements in this presentation and other
filings we make with the Securities and Exchange Commission (“SEC”) within the meaning
of Section 27A of the Securities Act of 1933, as amended, and Section
21E of the Securities Exchange Act of 1934, as amended, and such statements are intended
to be covered by the safe harbor provided by the same.
Forward-looking statements are subject to substantial risks and uncertainties, many of which are difficult
to predict and are generally beyond our control. These
forward-looking statements include information about possible or assumed future results of our business,
financial condition, liquidity, results of operations, plans and
objectives. When we use the words “believe,” “expect,” “anticipate,” “estimate,” “plan,”
“continue,” “intend,” “should,”
“may” or similar expressions, we intend to identify forward-looking statements. Statements regarding the following subjects,
among others, may be forward-looking: our business and investment
strategy; our operating results; our ability to obtain and maintain financing arrangements;
the return on equity; the yield on investments; the ability to borrow
to finance assets; and risks associated with investing in real estate assets, including changes
in business conditions and the general economy.
The forward-looking statements are based on our beliefs,
assumptions and expectations of our future performance, taking into account all information currently
available to us. Forward-looking statements are not predictions of
future events. These beliefs, assumptions and expectations can change as a result of many
possible events or factors, not all of which are known to us. Some of
these factors are described under “Risk Factors,” and “Management’s Discussion and
Analysis of Financial Condition and Results of Operations” as
included in ARI’s Annual Report on Form 10-K for the fiscal year ended December 31, 2012 and
other periodic reports filed with the Securities and Exchange
Commission. If a change occurs, our business, financial condition, liquidity and results of
operations may vary materially from those expressed in our
forward-looking statements. Any forward-looking statement speaks only as of the date on which it is
made. New risks and uncertainties arise over time, and it is not
possible for us to predict those events or how they may affect us. Except as required by law, we
are not obligated to, and do not intend to, update or revise any
forward-looking statements, whether as a result of new information, future events or otherwise.
This presentation may contain statistics and other data that in some
cases has been obtained from or compiled from information made available by third-party
service providers. Past performance is not indicative nor a
guarantee of future returns. |
 2
COMMERCIAL REAL ESTATE FINANCE, INC. (“ARI”)
Apollo Commercial Real Estate Finance, Inc.
2013 Second Quarter Earnings Call
August 1, 2013
Stuart Rothstein
Chief Executive Officer and President
Scott Weiner
Chief Investment Officer of the Manager
Megan Gaul
Chief Financial Officer
Hilary Ginsberg
Investor Relations Manager |
 3
COMMERCIAL REAL ESTATE FINANCE, INC. (“ARI”)
ARI –
Financial Summary
(1)
Operating Earnings is a non-GAAP financial measure that is used by
the Company to approximate cash available for distribution and is defined by the Company as net income, computed in accordance with GAAP, adjusted for (i) equity-based compensation expense
(a portion of which may become cash-based upon final vesting and
settlement of awards should the holder elect net share settlement to satisfy income tax withholding) and (ii) any unrealized gains or losses or other non-cash items included in net income. Please see
slide 21 for a reconciliation of Operating Earnings and Operating
Earnings per Share to GAAP net income and GAAP net income per share.
(2)
Fixed charge coverage is EBITDA divided by interest expense plus
the preferred stock dividends.
Income Statement
June 30, 2013
June 30, 2012
% Change
June 30, 2013
June 30, 2012
% Change
18,188
$
13,880
$
31.0%
36,324
$
28,309
$
28.3%
(955)
$
(1,929)
$
-50.5%
(2,024)
$
(5,171)
$
-60.9%
Net interest income (in thousands)
17,233
$
11,951
$
44.2%
34,300
$
23,138
$
48.2%
0.31
$
0.41
$
-24.4%
0.70
$
0.83
$
-15.7%
37,373,885
20,991,450
78.0%
33,946,329
20,978,938
61.8%
Balance sheet
June 30, 2013
December 31, 2012
% Change
733,431
$
669,478
$
9.6%
542,119
$
444,320
$
22.0%
Common stockholders equity
599,744
$
460,674
$
30.2%
86,250
$
86,250
$
-
191,312
$
225,158
$
-15.0%
0.4x
0.5x
5.2x
3.3x
Three Months Ended
Six Months Ended
Interest income (in thousands)
Interest expense (in thousands)
Operating earnings per share
(1)
Basic and diluted weighted average common
shares outstanding
Investments at amortized cost (in thousands)
Net equity in investments at cost (in thousands)
Preferred stockholders equity
Debt to common equity
Floating rate debt
(in thousands)
Fixed charge coverage
(2) |
 4
COMMERCIAL REAL ESTATE FINANCE, INC. (“ARI”)
$0.20
$0.29
$0.42
$0.39
$0.31
$0.40
$0.41
$0.31
$0.00
$0.20
$0.40
$0.60
$0.80
$1.00
Six Months Ended
June 30, 2010
Six Months Ended
June 30, 2011
Six Months Ended
June 30, 2012
Six Months Ended
June 30, 2013
ARI –
Historical Overview
Operating Earnings per Share
(1)
Dividends per Common Share
Net Interest Income ($000s)
Return
on
Common
Equity
Based
on
Operating
Earnings
(2)
(1)
Operating Earnings is a non-GAAP financial measure that is used by
the Company to approximate cash available for distribution and is defined by the Company as net income, computed in accordance with GAAP, adjusted for (i) equity-based compensation expense (a portion of which may become
cash-based upon final vesting and settlement of awards should the
holder elect net share settlement to satisfy income tax withholding) and (ii) any unrealized gains or losses or other non-cash items included in net income. Please see slide 21 for a reconciliation of Operating Earnings and Operating
Earnings per Share to GAAP net income and GAAP net income per
share. (2)
Return on common equity is calculated as annualized Operating Earnings
for the period as a percentage of average stockholders equity for the period.
$0.35
$0.40
$0.40
$0.40
$0.35
$0.40
$0.40
$0.40
$0.00
$0.20
$0.40
$0.60
$0.80
$1.00
Six Months Ended
June 30, 2010
Six Months Ended
June 30, 2011
Six Months Ended
June 30, 2012
Six Months Ended
June 30, 2013
$0.70
$0.80
$0.80
$0.80
$3,902
$7,599
$11,187
$17,067
$5,056
$9,684
$11,951
$17,233
$0
$5,000
$10,000
$15,000
$20,000
$25,000
$30,000
$35,000
$40,000
Six Months Ended
June 30, 2010
Six Months Ended
June 30, 2011
Six Months Ended
June 30, 2012
Six Months Ended
June 30, 2013
4.3%
6.8%
10.4%
9.6%
6.7%
9.6%
10.0%
7.8%
0.0%
2.0%
4.0%
6.0%
8.0%
10.0%
12.0%
Six Months Ended
June 30, 2010
Six Months Ended
June 30, 2011
Six Months Ended
June 30, 2012
Six Months Ended
June 30, 2013
Q1
Q1
Q1
Q1
Q2
Q2
Q2
Q2
$0.51
$0.69
$0.83
$0.70
$34,300
$23,138
$17,283
$8,958 |
 5
COMMERCIAL REAL ESTATE FINANCE, INC. (“ARI”)
ARI –
Historical Overview
Operating Earnings per Share
(1)
(1)
Operating Earnings is a non-GAAP financial measure that is used by
the Company to approximate cash available for distribution and is defined by the Company as net income, computed in accordance with GAAP, adjusted for (i) equity-based compensation expense (a portion of which may become
cash-based upon final vesting and settlement of awards should the
holder elect net share settlement to satisfy income tax withholding) and (ii) any unrealized gains or losses or other non-cash items included in net income. Please see slide 21 for a reconciliation of Operating Earnings and Operating
Earnings per Share to GAAP net income and GAAP net income per
share. (2)
Return on common equity is calculated as annualized Operating Earnings
for the period as a percentage of average stockholders equity for the period.
Dividends per Common Share
Net Interest Income ($000s)
Return on Common Equity Based on Operating Earnings
(2)
$1.50
$1.60
$1.60
$0.40
$0.40
$0.00
$0.40
$0.80
$1.20
$1.60
$2.00
2010
2011
2012
YTD 2013
$0.80
$1.09
$1.47
$1.50
$0.39
$0.31
$0.00
$0.40
$0.80
$1.20
$1.60
$2.00
2010
2011
2012
YTD 2013
$0.70
$21,771
$38,464
$48,677
$17,067
$17,233
$0
$10,000
$20,000
$30,000
$40,000
$50,000
$60,000
2010
2011
2012
YTD 2013
$34,300
10.8%
6.9%
9.6%
7.8%
0.0%
3.0%
6.0%
9.0%
12.0%
Q3 2012
Q4 2012
Q1 2013
Q2 2013 |
 6
COMMERCIAL REAL ESTATE FINANCE, INC. (“ARI”)
ARI –
Q2 Highlights
Financial Results & Earnings Per Share
Operating
Earnings
for
the
quarter
ended
June
30,
2013
of
$11.7
million,
or
$0.31
per
diluted
common
share
(1)
–
Net interest income of $17.2 million for Q2 2013
–
Total expenses of $4.0 million, comprised of management fees of $2.6
million, G&A of $1.0 million and non-cash stock based
compensation of $0.4 million –
GAAP
net
income
available
to
common
stockholders
for
the
quarter
ended
June
30,
2013
of
$9.9
million,
or
$0.27
per
diluted common share
Dividends
Declared a dividend of $0.40 per share of common stock for the quarter
ended September 30, 2013 –
10.0%
annualized
dividend
yield
based
on
$15.98
closing
price
on
July
30,
2013
Declared
a
dividend
on
the
Company’s
8.625%
Series
A
Cumulative
Redeemable
Perpetual
Preferred
Stock
of
$0.5391 per share for stockholders of record on June 28, 2013
(1)
Operating Earnings is a non-GAAP financial measure that is used by
the Company to approximate cash available for distribution and is defined by the Company as net income, computed in accordance with GAAP, adjusted
for (i) equity-based compensation expense (a portion of which may
become cash-based upon final vesting and settlement of awards should the holder elect net share settlement to satisfy income tax withholding) and (ii) any
unrealized gains or losses or other non-cash items included in net
income. Please see slide 21 for a reconciliation of Operating Earnings and Operating Earnings per Share to GAAP net income and GAAP net income per
share. |
 7
COMMERCIAL REAL ESTATE FINANCE, INC. (“ARI”)
ARI –
Q2 Highlights
Investment and Portfolio Activity
Mezzanine
Loan
–
National
Warehouse
Portfolio
–
$32
million
fixed
rate
mezzanine
loan
secured
by
a
pledge
of
the
equity
interests
in
the
owner
of 15 warehouse facilities totaling 2.8 million square feet spanning
nine states –
10-year term
–
Underwritten
LTV
–
75%
–
Underwritten IRR
(1)
~ 12%
Mezzanine Loan –
Multifamily Conversion, New York, NY
–
$44 million floating rate mezzanine loan secured by a pledge of the
equity interests in the owner of five adjacent commercial
buildings totaling approximately 411,000 gross square feet that
are expected to be converted into multifamily rental apartments in the Gramercy Park
section of New York City
–
15-month term (one-year initial term and one three-month
extension) –
Underwritten
LTV
–
78%
–
Underwritten IRR
(1)
~ 14%
(1)
The internal rates of return (“IRR”) for the investments
listed reflect the returns underwritten by ACREFI Management, LLC (the “Manager”), calculated on a weighted average basis assuming no dispositions, early prepayments or defaults but assumes that
extension options are exercised and that the cost of borrowings and
derivative instruments under the Company’s master repurchase agreement with Wells Fargo Bank, N.A. (“Wells Facility”) remains constant over the remaining terms and extension terms under
the facility. There can be no assurance the actual IRRs will equal the
underwritten IRRs shown. See “Risk Factors” in the Company’s Annual Report on Form 10-K for the year ended December 31, 2012 for a discussion of some of the factors that could adversely
impact the returns received by the Company from the investments over
time. |
 8
COMMERCIAL REAL ESTATE FINANCE, INC. (“ARI”)
ARI –
Q2 Highlights
Investment and Portfolio Activity
Repayments
–
Principal
repayment
on
a
$15
million
mezzanine
loan
secured
by
a
hotel
in
New
York
City
–
Received
$1.2
million
yield
maintenance
payment;
Total
realized
IRR
on
investment
–
19%
(1)
Portfolio Summary
Total
investments
with
an
amortized
cost
of
$733
million
at
June
30,
2013
Current
weighted
average
underwritten
IRR
of
approximately
13.1%
and
levered
weighted
average
underwritten
IRR
of
approximately
14.2%
at
June
30,
2013
(1)
Book Value Per Share
GAAP book value of $16.26 per share as of June 30, 2013
Fair
value
of
$16.55
per
share
as
of
June
30,
2013
(2)
(1)
The IRR for the investments listed reflect the returns
underwritten by the Manager, calculated on a weighted average basis assuming no dispositions, early prepayments or defaults but assumes extensions are exercised and that the cost of borrowings and derivative instruments under
the Wells Facility remains constant over the remaining terms and
extension terms under the facility. The calculation also assumes
extension options on the Wells Facility with respect to the Hilton CMBS are exercised.With respect to the mezzanine loan for the New York City
multifamily condominium conversion that closed in December 2012 and the
mezzanine loan for the New York City condominium construction that closed in January 2013, the IRR calculation assumes certain estimates with respect to the timing and magnitude of future fundings for the
remaining commitments and associated loan repayments, as well as
assuming no defaults. IRR is the annualized effective compounded
return rate that accounts for the time-value of money and represents the rate of return on an investment over a holding period expressed as a
percentage
of
the
investment.
It
is
the
discount
rate
that
makes
the
net
presentvalue
of
all
cash
outflows
(the
costs
of
investment)
equal
to
the
net
present
value
of
cash
inflows
(returns
on
investment).It
is
derived
from
the
negative
and
positivecash
flows
resulting
from
or
produced
by
each transaction (or for a transaction involving more than one
investment, cash flows resulting from or produced by each of the investments), whether positive, such as investment returns, or negative, such as transaction expenses or other costs of investment, taking into account the
dates on which such cash flows occurred or are expected to occur, and
compounding interest accordingly. See “Risk
Factors” in the Company’s Annual Report on Form
10-K for the year ended December 31, 2012 for a discussion of some of the factors that could adversely impact
the
returns
received
by
the
Company
from
the
investments
over
time.
Substantially
all
of
the
Company’s
borrowings
under
the
Company's
master
repurchase
facility
with
JPMorgan
Chase
Bank,
N.A.
(the
"JPMorgan
Facility")
were
repaid.
The
Company's
ability
to
achieve
its
levered weighted average underwritten IRR is additionally dependent upon
the Company re-borrowing approximately $53 million under the JPMorgan Facility or any replacement facility.
Without such re-borrowing, the levered weighted average IRR with
regard to its portfolio of first mortgage loan will be
significantly lower than the amount shown above, as indicated by the current weighted average underwritten IRR above.
(2)
The Company carries loans at amortized cost and its commercial
mortgage-backed securities (“CMBS”) are marked to market. Management has estimated that the fair value of the Company’s financial assets at June 30, 2013 was approximately $10,6 million greater than the
carrying value of the Company’s investment portfolio as of the same
date. This represents a premium of $0.29 per share over the Company's GAAP book value as of June 30, 2013. |
 9
COMMERCIAL REAL ESTATE FINANCE, INC. (“ARI”)
ARI –
Subsequent Events
Investment Activity
Mezzanine Loan –
Office Building, New York, NY
–
$14.0 million fixed rate mezzanine loan (purchased for $13.6 million or
~ 97% of face value) secured by a pledge of the equity interests
in the owner of the office component of a 432,717 square foot
building located in downtown New York City –
10-year term
–
Underwritten LTV –
70%
–
Underwritten IRR
(1)
~ 13%
(1)
The IRRs for the investments listed reflect the returns underwritten by
the Manager, calculated on a weighted average basis assuming no dispositions, early prepayments or defaults but assumes extensions are exercised and that the cost of borrowings and derivative
instruments under the Wells Facility remains constant over the remaining
terms and extension terms under this facility. There can be no assurance the actual IRRs will equal the underwritten IRRs shown. See “Risk Factors”
in the Company’s Annual Report on Form 10-K
for the year ended December 31, 2012 for a discussion of some of
the factors that could adversely impact the returns received by
the Company from the investments over time.
|
 10
COMMERCIAL REAL ESTATE FINANCE, INC. (“ARI”)
ARI –
Portfolio Overview
Asset Type
($000s)
Amortized
Cost
Borrowings
Equity
at Cost
Remaining
Weighted
Average Life
(years )
(1)
Current
Weighted
Average
IRR
(2)(3)
Levered
Weighted
Average
IRR
(4)
First Mortgage Loans
(2)
$143,492
$3
$143,489
2.1
11.0%
15.8%
Subordinate Loans
354,865
-
354,865
4.2
13.8
13.8
CMBS -
AAA
165,553
144,200
21,353
1.4
15.8
15.8
CMBS -
Hilton
69,521
47,109
22,412
2.4
12.6
12.6
Investments at June 30, 2013
$733,431
$191,312
$542,119
3.0 Years
13.1%
14.2%
(1)
(2)
(3)
(4)
As of June 30, 2013.
Remaining Weighted Average Life assumes all extension options are
exercised. Borrowings under the Company’s master repurchase facility with
JPMorgan (the “JPMorgan Facility”) bear interest at LIBOR plus 250 basis points, or 2.7% at June 30, 2013. The IRR calculation further assumes the JPMorgan Facility or any
replacement facility will remain available over the life of these
investments. The IRR for the investments shown in the
above table reflect the returns underwritten by the Manager, calculated on a weighted average basis assuming no dispositions, early prepayments or defaults but assumes extensions are exercised and that
the cost of borrowings and derivative instruments under the Wells
Facility remains constant over the remaining terms and extension terms under this facility. The calculation also assumes extension options on the Wells Facility with respect to the
Hilton CMBS are exercised. With respect to the mezzanine loan for the
New York City multifamily condominium conversion that closed in December 2012 and the mezzanine loan for the New York City condominium construction that closed in
January 2013, the IRR calculation assumes certain estimates with respect
to the timing and magnitude of future fundings for the remaining commitments and associated loan repayments, as well as assuming no defaults. IRR is the annualized
effective compounded return rate that accounts for the time-value of
money and represents the rate of return on an investment over a holding period expressed as a percentage of the investment. It is the discount rate that makes the net present
value of all cash outflows (the costs of investment) equal to the net
present value of cash inflows (returns on investment). It is derived from the negative and positive cash flows resulting from or produced by each transaction (or for a transaction
involving more than one investment, cash flows resulting from or
produced by each of the investments), whether positive, such as investment returns, or negative, such as transaction expenses or other costs of investment, taking into account the
dates on which such cash flows occurred or are expected to occur, and
compounding interest accordingly. There can be no assurance the actual IRRs will equal the underwritten IRRs shown in the table. See “Risk Factors” in the Company’s
Annual Report on Form 10-K for the year ended December 31, 2012 for
a discussion of some of the factors that could adversely impact the returns received by the Company from the investments shown in the table over time.
Substantially all of the Company’s borrowings under the JPMorgan
Facility were repaid. The Company's ability to achieve its underwritten levered weighted average IRR with regard to its portfolio of first mortgage loans is additionally
dependent upon the Company re-borrowing approximately $53,000 under
the JPMorgan Facility or any replacement facility. Without such re-borrowing, the levered weighted average IRRs will be as indicated in the current weighted average
IRR column above.
|
 11
COMMERCIAL REAL ESTATE FINANCE, INC. (“ARI”)
ARI –
Portfolio Overview
Diversified Investment Portfolio with Amortized Cost Basis of $733
million Net Invested Equity at Amortized Cost Basis
Gross Assets at Amortized Cost Basis
CMBS -
AAA
23%
CMBS -
Hilton
9%
First Mortgages
20%
Subordinate
Loans
48%
CMBS -
AAA
4%
CMBS -
Hilton
4%
First Mortgages
27%
Subordinate
Loans
65% |
 12
COMMERCIAL REAL ESTATE FINANCE, INC. (“ARI”)
ARI –
Portfolio Diversification
The portfolio is diversified by property type and geographic location
Geographic Diversification by Net Equity
Property Type by Net Equity
(1)
Other category includes the subordinate financing on a ski resort and a
first mortgage loan on a development site with income producing parking lots.
Securities
8%
Residential
30%
Hotel
32%
Office
9%
Retail
4%
Mixed
Use/Other(2)
11%
Industrial
6%
New York City
49%
Northeast
(excluding NYC)
3%
Securities
8%
Southeast
2%
Mid-Atlantic
9%
Midwest
11%
West
13%
Southwest
5% |
 13
COMMERCIAL REAL ESTATE FINANCE, INC. (“ARI”)
ARI –
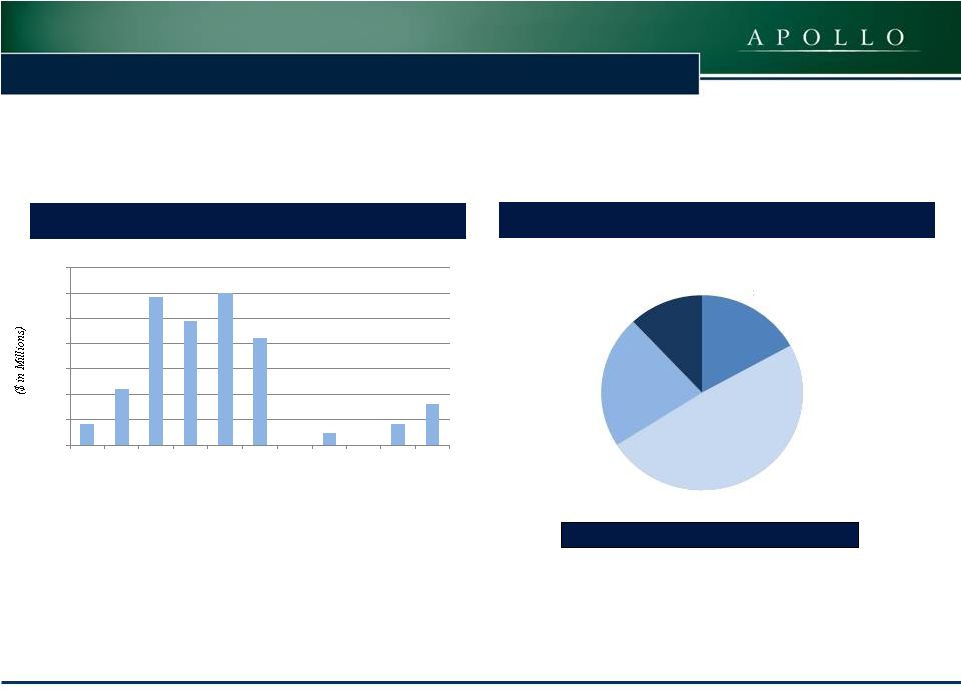
Loan Portfolio -
Maturity and Type
Fully Extended Loan Maturity Schedule ($000s)
(1)(2)
(1)
Based upon Face Amount of Loans; Does not include CMBS (AAA or
Hilton). (2)
For the NYC condominium conversion loan that closed in December 2012 and
the NYC condominium construction loan that closed in January 2013, the maturities reflect the fully funded amounts of the loans.
Loan Position and Rate Type
(1)
$16.9
$44.0
$116.8
$98.1
$120.0
$84.9
$-
$8.9
$-
$16.4
$32.0
$0
$20
$40
$60
$80
$100
$120
$140
2013
2014
2015
2016
2017
2018
2019
2020
2021
2022
2023
66%
Fixed
Rate/34%
Floating
Rate
Senior Loan Fixed
17%
Subordinate Loan
49%
Subordinate Loan
22%
Senior Loan
12%
Fixed
Floating
Floating |
 14
COMMERCIAL REAL ESTATE FINANCE, INC. (“ARI”)
ARI –
Loan Portfolio –
Loan Level LTV (Through Last Invested Dollar)
First Mortgage Loans
Subordinate Financings
0%
10%
20%
30%
40%
50%
60%
70%
80%
90%
100%
Description ($ in thousands)
Location
Balance at
June 30, 2013
Starting
LTV
Ending
LTV
First Mortgage -
Condo Conversion
(1)
New York
45,000
$
0%
31%
First Mortgage -
Hotel
New York
31,443
$
0%
42%
First Mortgage -
Office
New York
27,293
$
0%
35%
First Mortgage -
Hotel
Maryland
25,111
$
0%
62%
First Mortgage -
Parking/Development Site
Massachusetts
16,890
$
0%
21%
Total
145,737
$
(1)
Both loans are for the same property; Ending LTV for the Condominium
Conversion mezzanine loan is based upon the committed amount of $35 million.
(2)
Ending LTV is based upon the aggregate face value ($23.8 million) of the
senior sub-participation interests at the date of investment; ARI purchased the senior sub-participation interests for $17.8 million
(approximately 75% of face value).
(2)
Description ($ in thousands)
Location
Balance at
June 30, 2013
Starting
LTV
Ending
LTV
Subordinate -
Condo Development
New York
58,699
$
33%
45%
Subordinate -
Hotel Portfolio
Various
49,516
$
53%
60%
Subordinate -
Multifamily Conversion
New York
44,000
$
51%
78%
Subordinate -
Ski Resort
California
40,000
$
34%
54%
Subordinate -
Industrial Portfolio
Various
32,000
$
67%
75%
Subordinate -
Hotel Portfolio
New York
25,000
$
56%
60%
Subordinate -
Hotel Portfolio
Minnesota
24,904
$
57%
69%
Subordinate -
Retail
Virginia
23,605
$
60%
73%
Subordinate -
Multifamily Conversion
New York
18,000
$
48%
60%
Subordinate -
Hotel
New York
15,000
$
56%
69%
Subordinate -
Office
Missouri
9,914
$
61%
71%
Subordinate -
Office
Michigan
8,888
$
42%
54%
Subordinate -
Mixed Use
North Carolina
6,525
$
64%
77%
Subordinate -
Condo Conversion
(1)
New York
350
$
31%
55%
Total
356,402
$
0%
10%
20%
30%
40%
50%
60%
70%
80%
90%
100% |
 15
COMMERCIAL REAL ESTATE FINANCE, INC. (“ARI”)
ARI –
CMBS Portfolio
Face
Amortized
Cost
Remaining Weighted
Average Life with
Extensions (years)
Estimated
Fair Value
Debt
Net
Equity at
Cost
CMBS –
AAA
$163,162
$165,553
1.4
$165,173
$144,200
$21,353
CMBS –
Hilton
71,498
69,521
2.4
71,944
47,109
22,412
CMBS –
Total
$234,660
$235,074
1.8 Year
$237,117
$191,309
$43,765
CMBS -
AAA
CUSIP
Description
07388YAB8
BSCMS 07-PW16 A2
07401DAB7
BSCMS 2007-PW18 A2
12513YAC4
CD 2007-CD4 A2B
61754KAC9
MSC 07-IQ14 A2
92978YAB6
WBCMT 07-C32 A2
CMBS -
AAA
CUSIP
Description
36246LAB7
GSMS 2007-GG10 A2
46630JAK5
JPMCC 2007-LDPX A2S
61751NAD4
MSC 2007-HQ11 A31
92978TAB7
WBCMT 2007-C31 A2
CMBS –
Hilton
CUSIP
Description
05956KAA6
BALL 2010-HLTN |
 16
COMMERCIAL REAL ESTATE FINANCE, INC. (“ARI”)
Portfolio Metrics –
Quarterly Migration Summary
Portfolio Metrics ($ in thousands)
Q2 2013
Q1 2013
Q4 2012
Q3 2012
Q2 2012
(Investment balances represent amortized cost)
First Mortgage Loans
143,492
$
142,833
$
142,921
$
104,101
$
103,320
$
Subordinate Loans
354,865
286,569
246,246
196,177
179,602
Repurchase Agreement
-
-
6,598
10,975
41,696
CMBS -
AAA
165,553
188,824
203,463
223,781
280,697
CMBS -
Hilton
69,521
69,912
70,250
70,521
70,719
Total Investments
733,431
$
688,138
$
669,478
$
605,555
$
676,034
$
(Investment balances represent net equity, at cost)
First Mortgage Loans
143,489
$
142,830
$
142,918
$
104,098
$
50,260
$
Subordinate Loans
354,865
286,569
246,246
196,177
179,602
Repurchase Agreement
-
-
6,598
10,975
41,696
CMBS -
AAA
21,353
24,620
26,636
29,712
32,520
CMBS -
Hilton
22,412
22,175
21,922
21,623
21,260
Net Equity in Investments at Cost
542,119
$
476,194
$
444,320
$
362,585
$
325,338
$
Weighted Average IRR
(1)
14.2%
(2)
14.2%
(2)
14.1%
(2)
14.9%
(2)
15.0%
Weighted Average Duration
3.0 Years
3.0 Years
3.1 Years
3.3 Years
2.9 Years
Loan
Portfolio
Weighted
Average
Ending
LTV
(3)
56.0%
53.6%
55.6%
58.0%
57.1%
Borrowings
191,312
$
211,944
$
225,158
$
242,970
$
350,696
$
The IRR for the investments shown in the above table reflect the returns
underwritten by the Manager, calculated on a weighted average basis assuming no dispositions, early prepayments or defaults but assumes extensions are exercised and that the cost of
borrowings and derivative instruments under the Wells Facility remains
constant over the remaining terms and extension terms under this facility. The calculation also assumes extension options on the Wells Facility with respect to the Hilton CMBS are
exercised. With respect to the mezzanine loan for the New York City
multifamily condominium conversion that closed in December 2012 and the mezzanine loan for the New York City condominium construction that closed in January 2013, the IRR calculation
assumes certain estimates with respect to the timing and magnitude of
future fundings for the remaining commitments and associated loan repayments, as well as assuming no defaults. IRR is the annualized effective compounded return rate that accounts for
the time-value of money and represents the rate of return on an
investment over a holding period expressed as a percentage of the investment. It is the discount rate that makes the net present value of all cash outflows (the costs of investment) equal to the net
present value of cash inflows (returns on investment). It is derived
from the negative and positive cash flows resulting from or produced by each transaction (or for a transaction involving more than one investment, cash flows resulting from or produced by
each of the investments), whether positive, such as investment returns,
or negative, such as transaction expenses or other costs of investment, taking into account the dates on which such cash flows occurred or are expected to occur, and compounding interest
accordingly. There can be no assurance the actual IRRs will equal the
underwritten IRRs shown in the table. See “Risk Factors” in the Company’s Annual Report on Form 10-K for the year ended December 31, 2012 for a discussion of some of the factors that
could adversely impact the returns received by the Company from the
investments shown in the table over time. Represents an
underwritten levered weighted average IRR. The Company's ability to achieve the underwritten levered weighted average IRR, additionally depends upon the Company re-borrowing approximately $53,000 under the JPMorgan Facility or any
replacement facility with regard to its portfolio of first
mortgage loans. Without such re-borrowing, the levered weighted average IRR will be significantly lower than the amount shown above, as indicated in the weighted average IRR column on page 10.
Does not include CMBS (AAA or Hilton). (1)
(2)
(3) |
 17
COMMERCIAL REAL ESTATE FINANCE, INC. (“ARI”)
ARI had total borrowings outstanding of $191.3 million at June 30,
2013 ARI’s borrowings had the following remaining maturities
at June 30, 2013: Financing Overview
Facility ($000s)
Debt Balance
Weighted
Average
Remaining
Maturity
(1)
Cost of
Funds
Hedged
Cost of
Funds
Wells
Facility
(1)
$191,309
1.1
1.4%
1.5%
JPMorgan Facility
3
1.6
2.7%
2.7%
Total Borrowings at June 30, 2013
$191,312
1.1 Years
1.4%
1.5%
Facility ($000s)
Less than 1
year
1 to 3 years
3 to 5 years
Total
Wells
Facility
(1)
$146,401
$44,908
$-
$191,309
JPMorgan Facility
-
3
-
3
Total Borrowings at June 30, 2013
$146,401
$44,911
$-
$191,312
(1)
Assumes extension options on both the JP Morgan Facility and the Wells
Facility are exercised. At June 30, 2013, the interest rate with respect to outstanding borrowings used to finance AAA CMBS was LIBOR plus
105bps and the interest rate with respect to outstanding borrowings used
to finance the Hilton CMBS was LIBOR plus 175bps.
|
 18
COMMERCIAL REAL ESTATE FINANCE, INC. (“ARI”)
Financials |
 19
COMMERCIAL REAL ESTATE FINANCE, INC. (“ARI”)
Consolidated Balance Sheets
(in thousands—except share and per share data)
June 30, 2013
December 31, 2012
Assets:
Cash
156,797
$
108,619
$
Securities
available-for-sale, at estimated fair value 52,909
67,079
Securities, at
estimated fair value 184,208
211,809
Commercial mortgage loans,
held for investment 143,492
142,921
Subordinate loans, held for
investment 354,865
246,246
Repurchase agreements, held
for investment -
6,598
Interest receivable
4,830
4,277
Deferred financing costs, net
1,018
678
Other assets
-
203
Total Assets
898,119
$
788,430
$
Liabilities and Stockholders'
Equity Liabilities:
Borrowings under repurchase agreements
191,312
$
225,158
$
Derivative instruments, net
25
155
Accounts payable and accrued expenses
1,367
1,265
Payable to related party
2,600
2,037
Dividends payable
16,821
12,891
Total
Liabilities 212,125
241,506
Stockholders' Equity:
Preferred stock, $0.01 par value, 50,000,000 shares authorized and
3,450,000 shares issued and outstanding in 2013 and 2012
35
35
Common stock, $0.01 par value, 450,000,000 shares authorized 36,880,410
and 28,044,106 shares issued and outstanding in 2013 and 2012,
respectively 369
280
Additional paid-in-capital
695,572
546,065
Retained earnings
(accumulated deficit) (9,320)
574
Accumulated other comprehensive loss
(662)
(30)
Total Stockholders' Equity
685,994
546,924
Total Liabilities and
Stockholders' Equity 898,119
$
788,430
$
|
 20
COMMERCIAL REAL ESTATE FINANCE, INC. (“ARI”)
Consolidated Statement of Operations
June 30, 2013
June 30, 2012
June 30, 2013
June 30, 2012
Net interest income:
Interest income from securities
3,014
$
3,230
$
6,101
$
8,552
$
Interest income from commercial mortgage
loans 3,676
2,791
7,268
5,026
Interest income from subordinate
loans 11,498
5,859
22,953
11,172
Interest income from repurchase
agreements -
2,000
2
3,559
Interest expense
(955)
(1,929)
(2,024)
(5,171)
Net interest income
17,233
11,951
34,300
23,138
Operating expenses:
General and administrative expenses (includes $428 and $1,311 of
equity-based compensation in 2013 and $886 and $1,969 in 2012,
respectively)
(1,437)
(2,762)
(3,333)
(4,798)
Management fees to related party
(2,600)
(1,292)
(4,759)
(2,581)
Total operating expenses
(4,037)
(4,054)
(8,092)
(7,379)
Interest income from cash balances
16
-
16
1
Realized gain on sale of securities
-
-
-
262
Unrealized gain (loss)
on securities (1,421)
2,078
(2,500)
3,463
Loss on derivative instruments
(includes unrealized gains of $57 and $130 in 2013 and $192 and
$187 in 2012, respectively) (2)
(65)
(3)
(482)
Net income
11,789
$
9,910
$
23,721
$
19,003
$
Preferred dividends
(1,860)
-
(3,720)
-
Net Income available to common shareholders
9,929
$
9,910
$
20,001
$
19,003
$
Basic and diluted net income per share of common
stock 0.27
$
0.47
$
0.59
$
0.91
$
Basic and diluted weighted average
shares of common stock outstanding 37,373,885
20,991,450
33,946,329
20,978,938
Dividend declared per share of common stock
0.40
$
0.40
$
0.80
$
0.80
$
Three months ended
Six months ended |
 21
COMMERCIAL REAL ESTATE FINANCE, INC. (“ARI”)
Reconciliation of Operating Earnings to Net Income
June 30, 2013
Earnings Per Share
(Diluted)
June 30, 2012
Earnings Per Share
(Diluted)
Operating Earnings:
Net income available to common stockholders
$9,929
$0.27
$9,910
$0.47
Adjustments:
Unrealized (gain)/loss on securities
1,421
0.03
(2,078)
(0.09)
Unrealized gain on derivative instruments
(57)
-
(192)
(0.01)
Equity-based compensation expense
428
0.01
886
0.04
Total adjustments:
1,792
0.04
(1,384)
(0.06)
Operating Earnings
11,721
$0.31
$8,526
$0.41
Basic and diluted weighted average common shares outstanding
37,373,885
20,991,450
Three Months Ended
June 30, 2013
Earnings Per Share
(Diluted)
June 30, 2012
Earnings Per Share
(Diluted)
Operating Earnings:
Net income available to common stockholders
$20,001
$0.59
$19,003
$0.91
Adjustments:
Unrealized (gain)/loss on securities
2,500
0.07
(3,463)
(0.16)
Unrealized gain on derivative instruments
(130)
-
(187)
(0.01)
Equity-based compensation expense
1,311
0.04
1,969
0.09
Total adjustments:
3,681
0.11
(1,681)
(0.08)
Operating Earnings
23,682
$0.70
$17,322
$0.83
Basic and diluted weighted average common shares outstanding
33,946,329
20,978,938
Six Months Ended |
 22
COMMERCIAL REAL ESTATE FINANCE, INC. (“ARI”)
Financial Metrics –
Quarterly Migration Summary
(1)
Operating Earnings is a non-GAAP financial measure that is used by
the Company to approximate cash available for distribution and is defined by the Company as net income, computed in accordance with GAAP, adjusted for (i) equity-based compensation expense
(a portion of which may become cash-based upon final vesting and
settlement of awards should the holder elect net share settlement to satisfy income tax withholding)
and (ii) any unrealized gains or losses or other non-cash items
included in net income. Please see slide 21 for a
reconciliation of Operating Earnings and Operating Earnings per Share to GAAP net income and GAAP net income per share.
(2)
The Company carries loans at amortized cost and its CMBS securities are
marked to market. Management estimates the fair value of the Company’s financial assets.
(3)
Return on common equity is calculated as annualized Operating Earnings
for the period as a percentage of average stockholders equity for the period.
Financial Metrics
($ in thousands, except per share data)
Q2 2013
Q1 2013
Q4 2012
Q3 2012
Q2 2012
Net Interest Income
17,233
$
17,067
$
12,303
$
13,236
$
11,951
$
Management Fee
2,600
2,160
2,040
1,518
1,292
General and Administrative Costs
1,009
1,012
935
1,154
1,876
Non-Cash Stock Based Compensation
428
883
380
1,276
886
Net Income Available to Common Stockholders
9,929
$
10,072
$
7,108
$
10,992
$
9,910
$
GAAP Diluted EPS
0.27
$
0.33
$
0.26
$
0.52
$
0.47
$
Operating Earnings
(1)
11,721
$
11,963
$
7,375
$
9,218
$
8,526
$
Operating EPS
(1)
0.31
$
0.39
$
0.27
$
0.44
$
0.41
$
Distributions Declared to Common Stockholders
0.40
$
0.40
$
0.40
$
0.40
$
0.40
$
GAAP Book Value per Common Share
16.26
$
16.41
$
16.43
$
16.58
$
16.59
$
Fair Value per Common Share
(2)
16.55
$
16.71
$
16.84
$
17.16
$
17.22
$
Total Stockholders' Equity
685,994
$
691,185
$
546,924
$
427,421
$
341,518
$
Basic and diluted weighted average common shares
outstanding
37,373,885
30,105,939
27,608,787
20,992,312
20,991,450
Return on Common Equity Based on Operating Earnings
7.8%
9.6%
6.8%
10.8%
10.0%
(3) |