Attached files
| file | filename |
|---|---|
| EX-99.1 - EX-99.1 - AUXILIUM PHARMACEUTICALS INC | a13-17611_1ex99d1.htm |
| 8-K - 8-K - AUXILIUM PHARMACEUTICALS INC | a13-17611_18k.htm |
Exhibit 99.2
|
|
Second Quarter 2013 Earnings Call August 1, 2013 |
|
|
We will make various remarks during this presentation that constitute “forward-looking statements” for purposes of the safe harbor provisions under The Private Securities Litigation Reform Act of 1995, including statements regarding: whether our strategic commercial and tactical initiatives will help us achieve our corporate goals; our continued profitability for the year; the Company’s expected financial performance, including the degree to which we will achieve our financial guidance, strategic priorities, and development and operational goals for 2013; the Company’s expected tax benefit and the amount of such benefit as a result of our acquisition of Actient, that the acquisition will be immediately accretive on a non-GAAP basis to our 2013 adjusted net income; whether the Company will receive a step-up in basis resulting in tax deductible amortization of goodwill as a result of the acquisition of Actient; whether the acquisition of Actient will enable the Company to drive its future earnings growth, achieve greater leverage in the commercial infrastructure and potentially higher operating margins; whether the Company will realize run-rate cost synergies and the value of such synergies from its acquisition of Actient, including the consolidation of certain contracts and services, and in what time frame; whether there are cross-selling opportunities that create revenue synergies from the Company’s acquisition of Actient; whether the acquisition of Actient will expand the Company’s portfolio; the degree to which the Company will remain committed to urology and the TRT market; whether the Actient acquisition will enhance the Company’s growth trajectory and create value for shareholders; whether Auxilium and the Company will benefit from a broader spectrum of specialty pharmaceutical products, complementary commercial capabilities or an expanded sales force; whether our realigned sales force structure and responsibilities will result in the anticipated benefits; the ability of Auxilium to better serve TRT physician customers; whether the Actient acquisition will increase the Company’s commercial efforts, calling points, reach or expertise; whether the Company will achieve other expected benefits from its acquisition of Actient; whether the TRT market will remain an opportunity for growth across multiple testosterone delivery options; the degree to which the Company’s cash from operations will be available or used for amortizing outstanding indebtedness; and the speed with which debt may be amortized; whether the Company will achieve anticipated top-line growth over the next several years; whether the Actient acquisition will provide the Company with a return on invested capital; whether the Actient acquisition will create sustainable base of cash flow, which when combined with the Company’s expanded operating margins, will enable the combined Company to generate operating cash flow; whether the consolidation of the corporate headquarters, the development of a shared culture or the achievement of core strategic objectives will generate shareholder value; the degree to which the Company’s execution on its strategic goals will lead to increased shareholder value; the degree to which XIAFLEX® becomes the standard of care for the treatment of Dupuytren's contracture; our ability to obtain and the timing of the potential approval of XIAFLEX for the treatment of Peyronie’s disease in the U.S. as well as the timing of related regulatory milestones; the timing of our U.S. launch, if any, of XIAFLEX for the treatment of Peyronie’s disease; our strategies for marketing XIAFLEX for the treatment of Peyronie’s disease if approval is received; the time to market, size of market, growth potential and therapeutic benefits of the Company’s products and product candidates; the size and development of, and the Company’s strategies for further developing, the markets for our XIAFLEX products and XIAFLEX sales in the U.S., the EU and the rest of the world; the potential for XIAFLEX to be used in multiple indications; the size of the user base and number of target sites we believe exist in the U.S. for XIAFLEX and our ability to narrow the gap between prescribing sites and sites that have enrolled but not yet used XIAFLEX; the potential benefits and efficacy of XIAFLEX for the treatment of Peyronie’s disease, if approved; the size and growth potential of the testosterone replacement therapy market and the influence of our competitors on market growth; future Testim® market share, prescriptions and sales growth and factors that may drive such growth; the Company’s ability to address what it believes to be the causes of previously weak Testim sales and the effect of the new sales strategies, resources and tactics that will be deployed to defend Testim’s market position; competitive developments affecting the Company’s products and product candidates, including generic competition in the testosterone replacement therapy market; the timing of reporting top-line results of our phase IIIb studies for XIAFLEX for the potential treatment of multiple Dupuytren’s contractures and our phase IIa study for Collagenase Clostridium Histolyticum for the treatment of Frozen Shoulder Syndrome; the commencement of additional clinical studies; whether we can begin to enroll patients in our studies of CCH in adhesive capsulitis and cellulite as and when expected; the receipt of top-line data by the end of 2013 from our potentially label-expanding Dupuytren’s contracture multicord trial, if approved; the effect of the termination of our partnership with GlaxoSmithKline; the potential benefits of our partnership with Sobi; whether our collaboration with Sobi will improve on the growth of XIAPEX in the EU territories; whether regulatory approval will be obtained for XIAPEX in any of Sobi’s licensed territories within the anticipated timeframes, if at all; whether our collaboration with Sobi will enable us to bring XIAPEX to a global market; whether Sobi will be successful in developing and commercializing XIAPEX in its licensed territories; or whether we will receive the indicated milestone or royalty payments from Sobi; our ability to regain access to managed care plans with which we experienced disruption in the Fourth Quarter of 2012; whether the $7 million of Testopel revenues recorded in the period January 1 through April 25, 2013 were fulfillment of backorders from the 2012 out of stock situation; the strength and duration of our intellectual property protections, including our ability to prevail in the Actavis and Upsher-Smith litigations involving Testim; business development efforts and opportunities to build out the Company’s pipeline; and the opportunities and strategies to build shareholder value. All remarks other than statements of historical facts made during this presentation, including but not limited to, statements regarding future expectations, plans and prospects for the Company, statements regarding forward-looking financial information and other statements containing words such as ''may'', ''will'', ''should'', ''would'', ''expect'', ''intend'', ''plan'', ''anticipate'', ''believe'', ''estimate'', ''predict'', ''potential'', ''seem'', ''seek'', ''future'', ''continue'', or ''appear'' or the negative of these terms or similar expressions, as they relate to the Company, constitute forward-looking statements. Actual results may differ materially from those reflected in these forward-looking statements due to various factors, including general financial, economic, regulatory and political conditions affecting the biotechnology, medical device and pharmaceutical industries and those discussed in the Company’s Annual Report on Form 10-K for the year ended December 31, 2012 filed on February 26, 2013, as updated in Item 8.01 of the Current Report on Form 8-K that we filed with the SEC on April 29, 2013, and as updated from time to time in its periodic reports, in each case, under the heading “Risk Factors,” which is on file with the Securities and Exchange Commission (the “SEC”) and may be accessed electronically by means of the SEC’s home page on the Internet at http://www.sec.gov or by means of the Company’s home page on the Internet at http://www.auxilium.com under the heading “For Investors - SEC Filings.” There may be additional risks that the Company does not presently know or that the Company currently believes are immaterial which could also cause actual results to differ from those contained in the forward-looking statements. Given these risks and uncertainties, any or all of these forward-looking statements may prove to be incorrect. Therefore, you should not rely on any such factors or forward-looking statements. In addition, forward-looking statements provide the Company’s expectations, plans or forecasts of future events and views as of the date of this presentation. The Company anticipates that subsequent events and developments will cause the Company’s assessments to change. However, while the Company may elect to update these forward-looking statements at some point in the future, the Company specifically disclaims any obligation to do so. These forward-looking statements should not be relied upon as representing the Company’s assessments as of any date subsequent to the date of this presentation. Safe Harbor Statement |
|
|
Introduction 2 |
|
|
Today’s Web Cast Agenda 2Q & YTD 2013 Corporate Performance Adrian Adams Overview of 2Q13 and Recent Events Actient Integration Update Portfolio Performance 2Q & YTD 2013 Financial Performance Jim Fickenscher Non-GAAP Financials Financial Considerations and Guidance 2013 Expectations and Near-Term Priorities Adrian Adams Pipeline Opportunities and Progress Summary and Conclusions Q&A |
|
|
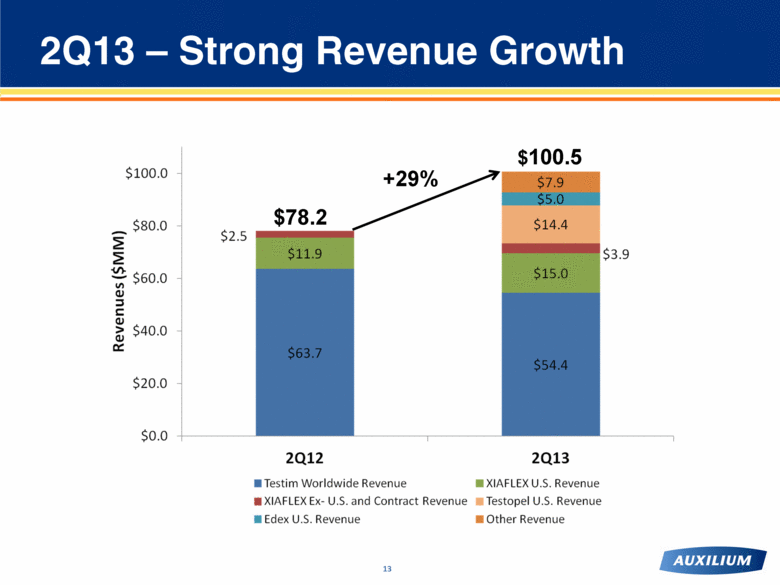
Overview of 2Q13 and Recent Events FINANCIAL and COMMERCIAL(1) Total net revenues of $100.5MM (+29% vs. 2Q12 ) Global Testim® revenue of $54.4MM (-15% vs. 2Q12) Global XIAFLEX® revenue of $18.9MM; U.S. XIAFLEX revenue of $15.0MM (+26% vs. 2Q12) Testopel® revenue of $14.4MM and Edex® revenue of $5.0MM. Revenue from other Actient products of $7.9MM Non-GAAP net income of $11.0MM vs. non-GAAP net income of $11.6MM in 2Q12 Implemented new sales force structure and product allocations RESEARCH and DEVELOPMENT Progress on clinical trial design for FSS and cellulite, on track for initiation of Phase 2 trials Completed enrollment of Dupuytren’s contracture multicord trial, results now expected end 2013 CORPORATE DEVELOPMENT and LICENSING Mutual termination of U.S. GSK co-promotion agreement effective August 2 Initiation of collaboration agreement with SOBI for XIAPEX in 71 countries in Eurasia and Africa 1 See Appendix for reconciliation of the pro forma non-GAAP financial measures to the closest GAAP financial measures |
|
|
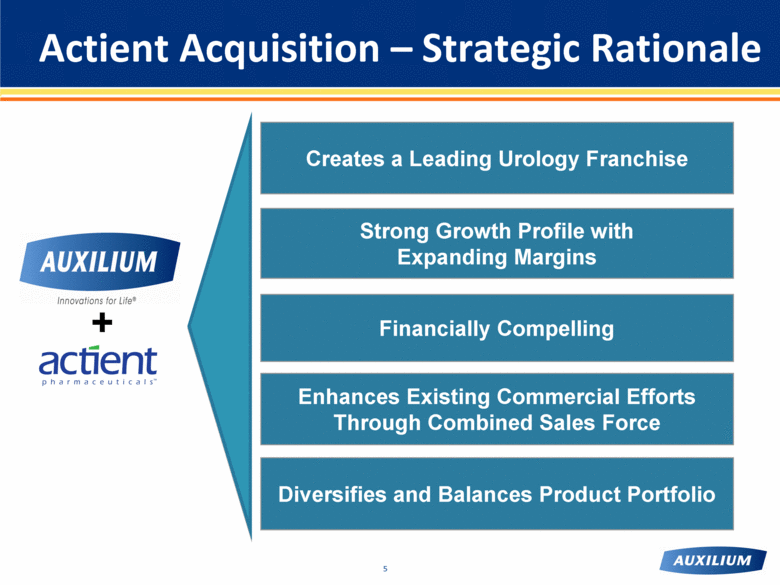
Actient Acquisition – Strategic Rationale Creates a Leading Urology Franchise Diversifies and Balances Product Portfolio Enhances Existing Commercial Efforts Through Combined Sales Force Strong Growth Profile with Expanding Margins Financially Compelling + |
|
|
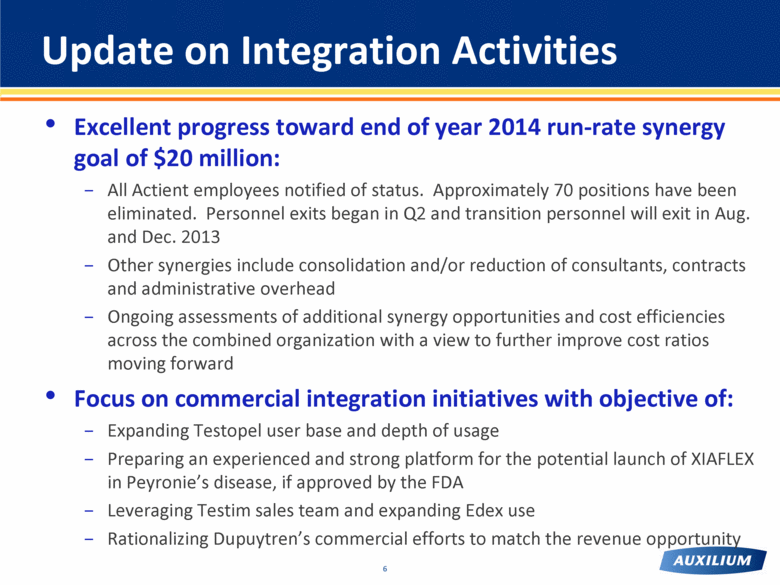
Excellent progress toward end of year 2014 run-rate synergy goal of $20 million: All Actient employees notified of status. Approximately 70 positions have been eliminated. Personnel exits began in Q2 and transition personnel will exit in Aug. and Dec. 2013 Other synergies include consolidation and/or reduction of consultants, contracts and administrative overhead Ongoing assessments of additional synergy opportunities and cost efficiencies across the combined organization with a view to further improve cost ratios moving forward Focus on commercial integration initiatives with objective of: Expanding Testopel user base and depth of usage Preparing an experienced and strong platform for the potential launch of XIAFLEX in Peyronie’s disease, if approved by the FDA Leveraging Testim sales team and expanding Edex use Rationalizing Dupuytren’s commercial efforts to match the revenue opportunity Update on Integration Activities |
|
|
Primera Innovia Agilis Number of Territories 150 60 47 Customer Focus Uro, Endo, PCP Uro Ortho Channel Focus Retail Buy & Bill Buy & Bill Current Products Future Products* Sales Force Structure and Responsibilities 7 * If approved by the FDA for Peyronie’s disease indication, Innovia sales force will have primary responsibility for XIAFLEX in this indication and the Primera team will be in a support role. |
|
|
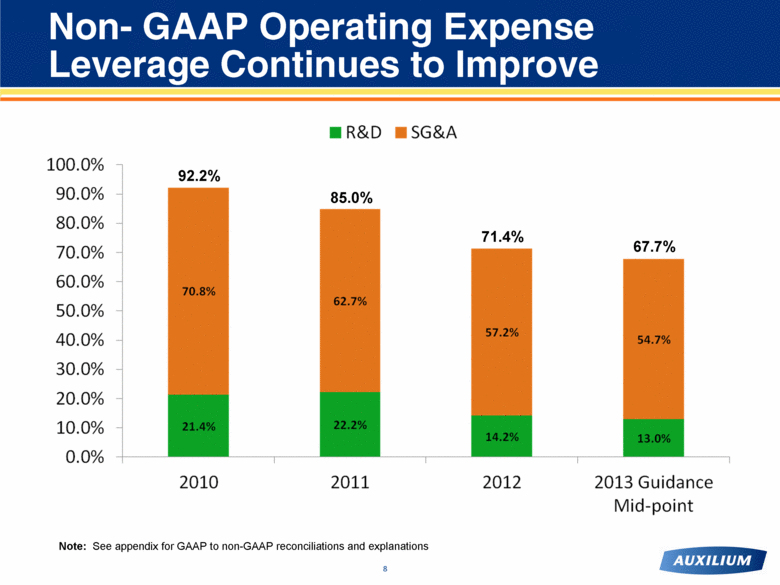
Non- GAAP Operating Expense Leverage Continues to Improve 92.2% 85.0% 71.4% Note: See appendix for GAAP to non-GAAP reconciliations and explanations 67.7% |
|
|
Testim – 2Q13 Commercial Performance TRT Gel Market Dynamics 2Q13 Prescriptions: +4.4% vs. 2Q12 1H13 Prescriptions: +7.4% vs. 1H12 Now estimating full-year market growth in mid- to high single digits Testim Overview 2Q13 U.S. net revenue of $53.2MM; -15% vs. 2Q12 Testim quarterly market share loss slowing, with weekly share stabilizing around 14% Recent NBRx share trends encouraging Sales force of 150 to continue support for Testim and broaden reach for Edex Ongoing litigation with Actavis and Upsher Smith Source: IMS NPA Weekly Data – July 2013; Market Share calculated based on Gel Market (Testim, Androgel 1%, Androgel 1.62%, Axiron, Fortesta |
|
|
XIAFLEX-2Q13 Commercial Performance 632 Vials sold to 230 Sites in Q2 ‘10 3,070 Vials sold to 774 Sites in Q2 ‘11 4,182 Vials sold to 1,049 Sites in Q2 ‘12 1Minor historical adjustments may affect historical demand figures over time 4,802 Vials sold to 1,194 Sites in Q2 ‘13 XIAFLEX Performance 2Q13 XIAFLEX U.S. net revenues of $15.0MM; +26% vs. 2Q12 2Q13 XIAFLEX ex-U.S. net revenues of $3.9MM; +54% vs. 2Q12 XIAFLEX Overview Promotion Resized 47-person sales force retains coverage of 98% of injector base New targeted universe of 4,700 physicians Performance Increase of 14.8% in vials shipped to physicians in 2Q13 vs. 2Q12 Grew vial sales to Leaders and Adopters segments (85% of total) 29% in 2Q 2013 vs. 2Q 2012 Market share trending higher in 2Q 2013, with April 2013 share of 27.9% vs. 1Q 2013 share of 24.9% Number of Dupuytren’s procedures increased 6.0% year-over-year through April 2013 XIAFLEX® Purchases & Sites Ordering by Quarter (1) |
|
|
Testopel Performance April 261 – June 2013 Testopel U.S. net revenues were $14.4 MM We believe Q2 pellet sales reflect fulfillment of back orders due to stock-out situation in Q4 2012 Testopel Overview Approximately 2,000 unique physicians or sites purchased Testopel in the past 12 months URO Buy and Bill sales force increased by 50% to 60 FTE’s to: Increase depth of Testopel utilization in existing user audience Provide greater penetration into remaining untapped URO audience2,3 Prepare for XIAFLEX Peyronie’s Disease indication, with planned launch in 4Q 2013, subject to FDA approval Testopel - 2Q13 Commercial Performance 1 April 26, 2013 was date Actient was purchased 2Cegedim SK&A nationwide physician specialty report reports ~14,000 UROs in the US 3IMS Xponent reports ~8,500 active URO prescribers of testosterone replacement therapy and PDE-5 therapy |
|
|
Edex Performance April 261 – June Edex U.S. net revenues were $ 5.0 MM Retail market share grew 2% in 2Q13 vs. 1Q13, and 8% vs. 2Q122 Mar 2013 12-Month Institutional share: 48%2 ~7,300 physicians prescribed Edex in the retail setting the last 12 months Edex Overview Now being promoted alongside Testim by Auxilium 150-person retail sales force focused on UROs, ENDOs, and Primary Care Improves access to existing non-oral ED writers by ~35% Introduces Edex to an additional 9,000 high decile (5-10) PDE-5 prescribers Edex - 2Q13 Commercial Performance 1 April 26, 2013 was date Actient was purchased 2 ~50% of Edex injections are sold through retail & mail order channels, and ~50% are sold through the Institutional (VA) channel. Effective April 2013, VA no longer reports sales to data collection agencies such as IMS and Symphony Health. Therefore, starting in 2Q 2013, Edex institutional share and total brand share cannot be measured or reported. Source: Symphony Health Source® Pharmaceutical Audit Suite (PHAST) |
|
|
2Q13 – Strong Revenue Growth $78.2 $100.5 +29% |
|
|
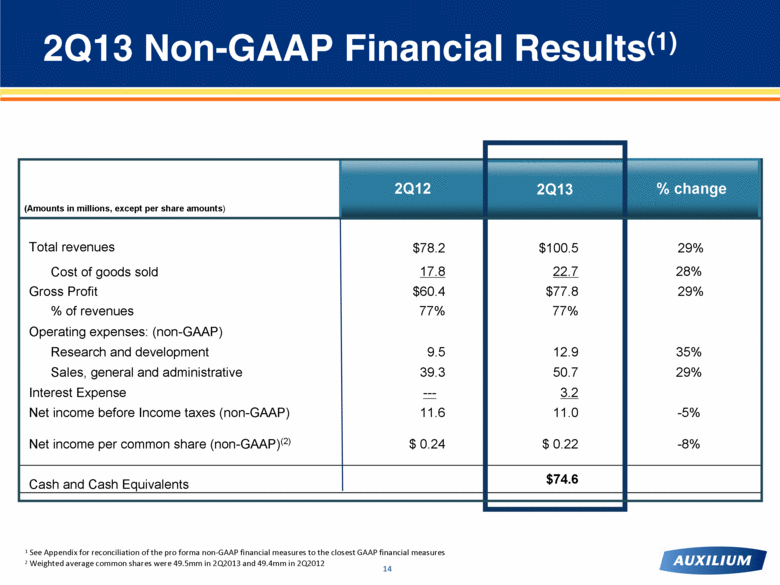
1 See Appendix for reconciliation of the pro forma non-GAAP financial measures to the closest GAAP financial measures 2 Weighted average common shares were 49.5mm in 2Q2013 and 49.4mm in 2Q2012 Total revenues $78.2 $100.5 29% Cost of goods sold 17.8 22.7 28% Gross Profit $60.4 $77.8 29% % of revenues 77% 77% Operating expenses: (non-GAAP) Research and development 9.5 12.9 35% Sales, general and administrative 39.3 50.7 29% Interest Expense --- 3.2 Net income before Income taxes (non-GAAP) 11.6 11.0 -5% Net income per common share (non-GAAP)(2) $ 0.24 $ 0.22 -8% Cash and Cash Equivalents $74.6 2Q13 Non-GAAP Financial Results(1) 2Q12 (Amounts in millions, except per share amounts) % change 2Q13 |
|
|
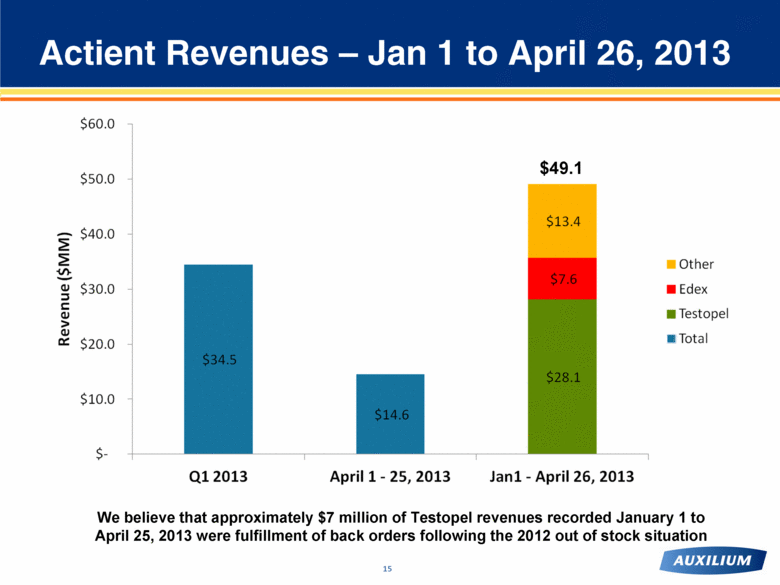
Actient Revenues – Jan 1 to April 26, 2013 We believe that approximately $7 million of Testopel revenues recorded January 1 to April 25, 2013 were fulfillment of back orders following the 2012 out of stock situation $49.1 |
|
|
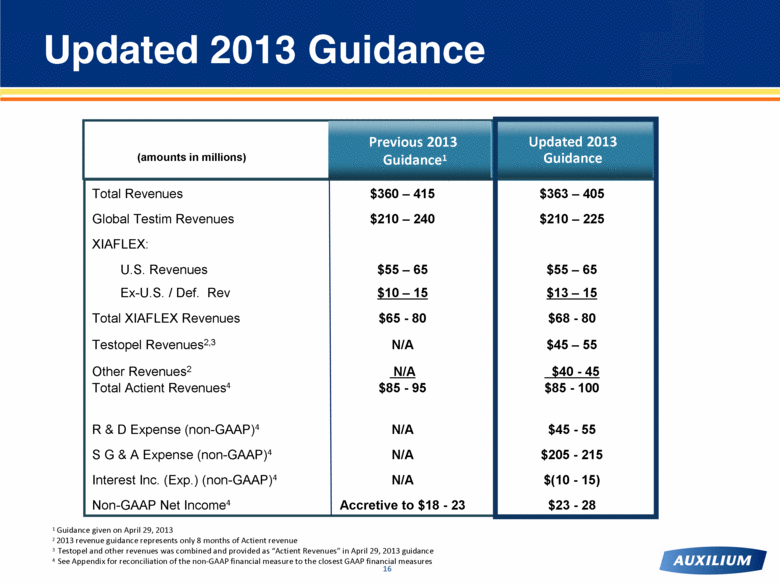
Total Revenues $360 – 415 $363 – 405 Global Testim Revenues $210 – 240 $210 – 225 XIAFLEX: U.S. Revenues $55 – 65 $55 – 65 Ex-U.S. / Def. Rev $10 – 15 $13 – 15 Total XIAFLEX Revenues $65 - 80 $68 - 80 Testopel Revenues2,3 N/A $45 – 55 Other Revenues2 N/A $40 - 45 Total Actient Revenues4 $85 - 95 $85 - 100 R & D Expense (non-GAAP)4 N/A $45 - 55 S G & A Expense (non-GAAP)4 N/A $205 - 215 Interest Inc. (Exp.) (non-GAAP)4 N/A $(10 - 15) Non-GAAP Net Income4 Accretive to $18 - 23 $23 - 28 Updated 2013 Guidance (amounts in millions) Updated 2013 Guidance 1 Guidance given on April 29, 2013 2 2013 revenue guidance represents only 8 months of Actient revenue 3 Testopel and other revenues was combined and provided as “Actient Revenues” in April 29, 2013 guidance 4 See Appendix for reconciliation of the non-GAAP financial measure to the closest GAAP financial measures Previous 2013 Guidance1 |
|
|
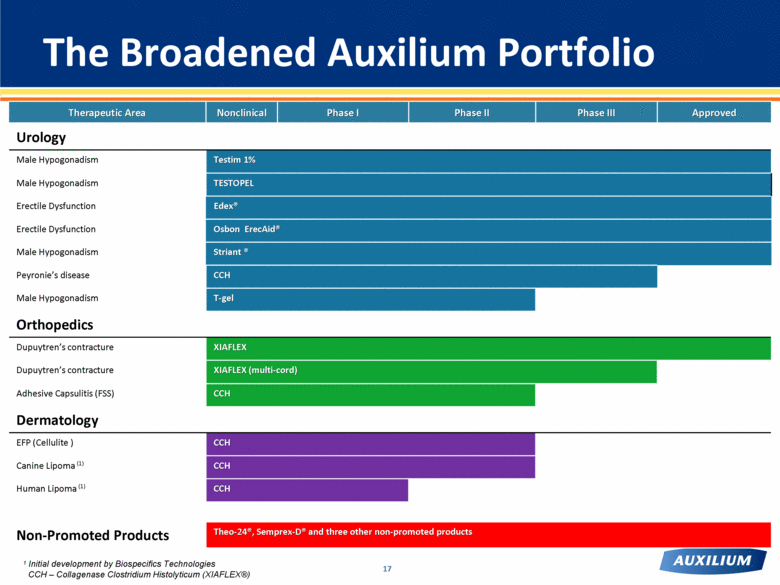
Therapeutic Area Nonclinical Phase I Phase II Phase III Approved Urology Male Hypogonadism Testim 1% Male Hypogonadism TESTOPEL Erectile Dysfunction Edex® Erectile Dysfunction Osbon ErecAid® Male Hypogonadism Striant ® Peyronie’s disease CCH Male Hypogonadism T-gel Orthopedics Dupuytren’s contracture XIAFLEX Dupuytren’s contracture XIAFLEX (multi-cord) Adhesive Capsulitis (FSS) CCH Dermatology EFP (Cellulite ) CCH Canine Lipoma (1) CCH Human Lipoma (1) CCH Non-Promoted Products Theo-24®, Semprex-D® and three other non-promoted products The Broadened Auxilium Portfolio 17 CCH – Collagenase Clostridium Histolyticum (XIAFLEX®) 1 Initial development by Biospecifics Technologies |
|
|
Auxilium: Our Near Term Priorities Efficiently integrate Actient, deliver on synergies/cost efficiencies Maximize value of current portfolio Stabilize Testim market share & increase unit sales Drive to standard of care in Dupuytren’s for XIAFLEX Grow TESTOPEL and Edex use with Urologists Prepare for and successfully launch XIAFLEX in Peyronie’s disease, if approved Successfully advance R&D pipeline Announce top-line Multicord Ph. IIIb study data (4Q13) Announce top-line 5-year XIAFLEX recurrence data (4Q13) Initiate Cellulite phase 2 study (3Q13) Initiate Adhesive Capsulitis later stage study (4Q13) Deliver strong and sustainable financial performance Auxilium is well positioned to drive shareholder value |
|
|
Questions & Answers |
|
|
Second Quarter 2013 Earnings Call August 1, 2013 |
|
|
Appendix |
|
|
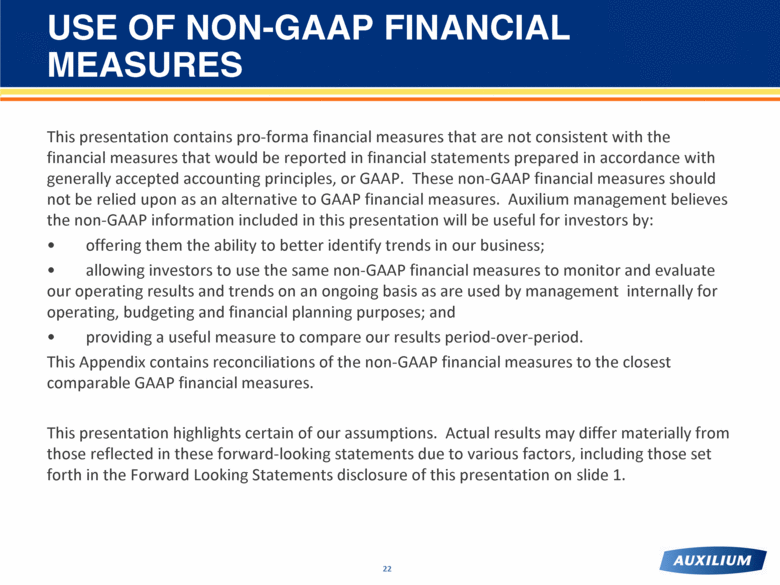
This presentation contains pro-forma financial measures that are not consistent with the financial measures that would be reported in financial statements prepared in accordance with generally accepted accounting principles, or GAAP. These non-GAAP financial measures should not be relied upon as an alternative to GAAP financial measures. Auxilium management believes the non-GAAP information included in this presentation will be useful for investors by: • offering them the ability to better identify trends in our business; • allowing investors to use the same non-GAAP financial measures to monitor and evaluate our operating results and trends on an ongoing basis as are used by management internally for operating, budgeting and financial planning purposes; and • providing a useful measure to compare our results period-over-period. This Appendix contains reconciliations of the non-GAAP financial measures to the closest comparable GAAP financial measures. This presentation highlights certain of our assumptions. Actual results may differ materially from those reflected in these forward-looking statements due to various factors, including those set forth in the Forward Looking Statements disclosure of this presentation on slide 1. USE OF NON-GAAP FINANCIAL MEASURES 22 |
|
|
Auxilium Reconciliation of GAAP to Non-GAAP Net Income (Loss) 3 Months Ended June 30, 2013 3 Months Ended June 30, 2012 GAAP Adjustments Non-GAAP GAAP Adjustments Non-GAAP Net revenues* 100.5 $ - $ 100.5 $ 78.2 $ - $ 78.2 $ Operating expenses: Cost of goods sold 27.2 (4.5) (a) 22.7 17.8 0.0 (a) 17.8 Research and development 13.6 (0.7) (b) 12.9 10.2 (0.6) (b) 9.5 Selling, general and administrative 74.9 (24.2) (c) 50.7 42.6 (3.2) (c) 39.3 Amortization of purchased intangibles 10.9 (10.9) (d) - - - Contingent consideration 2.3 (2.3) (e) - - - Total operating expenses 128.9 (42.6) 86.3 70.6 (3.9) 66.7 Income (loss) from operations (28.4) 42.6 14.3 7.6 3.9 11.5 Interest income (expense), net (6.9) 3.7 (f) (3.2) 0.1 - 0.1 Income (loss) before Income taxes (35.3) 46.3 11.0 7.7 3.9 11.6 Income tax benefit 92.4 (92.4) (g) - - - Net income (loss) 57.1 $ (46.1) $ 11.0 $ 7.7 $ 3.9 $ 11.6 $ Net income (loss) per common share: Basic 1.16 $ 0.22 $ 0.16 $ 0.24 $ Diluted 1.15 $ 0.22 $ 0.16 $ 0.24 $ Shares used to compute net income (loss) per share: Basic 49.3 49.3 48.6 48.6 Diluted 49.6 49.6 49.2 49.2 * Actient revenues are included for the time period from April 26, 2013 to June 30, 2013 |
|
|
Auxilium Reconciliation of GAAP to Non-GAAP Net Income (Loss) 3 Months 3 Months Ended June 30, 2013 Ended June 30, 2012 Adjustments to: (a) Costs of goods sold: Employee stock-based compensation (1) (0.0) $ 0.0 $ Acquired inventory step -up value (2) (4.5) - Total (4.5) $ 0.0 $ (b) Research and development: Employee stock-based compensation (1) (0.7) (0.6) (c) Selling, general and administrative: Employee stock-based compensation (1) (3.5) (3.2) Acquisition related severence costs (3) (10.0) - Acquisition related transaction and integration costs (3) (10.7) - Total (24.2) $ (3.2) $ (d) Amortization of purchased intangibles (4) (10.9) - (e) Contingent consideration (5) (2.3) - (f) Interest income (expense), net Non-cash interest expense related to convertible debt and term loan (6) 3.7 - (g) Income tax benefit (7) (92.4) - (1) (2) (3) (4) (5) (6) (7) The effects of non-cash interest related to the convertible senior notes due 2018 and the term loan due 2017 are excluded. We believe such exclusion facilitates an understanding of the effects of the debt service obligations on the Company's liquidity and comparisons to peer group companies, and is reflective of how Auxilium management internally manages the business. The effects of non-cash tax benefit related to the acquisition of Actient is excluded because of its non-recurring nature. We believe such exclusion facilitates investors ability to more accurately compare our operating results to those of our peer companies. The effects of employee stock-based compensation are excluded because of varying available valuation methodologies and subjective assumptions. We believe this is a useful measure for employees because such exclusion facilitates comparison to peer companies who also provide similar non-GAAP disclosures and is reflective of how Auxilium management internally manages the business. The effects of recognition of the step-up in value of inventory acquired in the Actient acquisition are excluded because this expense is non-cash and, consequently, we believe investors are able to more accurately compare our operating results to those of our peer companies. Additionally, the amounts excluded are not indicative of anticipated ongoing operations. The effects of non-recurring expenses related to the acquisition and integration are excluded because of the non-cash nature of these expenses and, we believe, such exclusion facilitates investors ability to more accurately compare our operating results to those of our peer companies. Additionally, the amounts excluded are not indicative of anticipated ongoing operations. The effects of amortization of intangible assets acquired in the Actient acquisition are excluded because this expense is non-cash and, we believe, such exclusion facilitates investors ability to more accurately compare our operating results to those of our peer companies. The effects of change in contingent consideration are excluded due to the nature of this charge, which is related to the change in the fair value of the liability for contingent consideration in connection with the acquisition of Actient. We believe such exclusion facilitates investors ability to more accurately compare our operating results to those of our peer companies and is reflective of how Auxilium management internally manages the business. |
|
|
Auxilium Reconciliation of GAAP to Non-GAAP Net Income (Loss) 6 Months Ended June 30, 2013 6 Months Ended June 30, 2012 GAAP Adjustments Non-GAAP GAAP Adjustments Non-GAAP Net revenues* 166.7 $ - $ 166.7 $ 151.8 $ - $ 151.8 $ Operating expenses: Cost of goods sold 42.3 (4.6) (a) 37.7 34.4 (0.0) (a) 34.4 Research and development 25.5 (1.4) (b) 24.1 22.2 (1.2) (b) 20.9 Selling, general and administrative 119.2 (27.3) (c) 91.9 89.5 (6.3) (c) 83.2 Amortization of purchased intangibles 10.9 (10.9) (d) - - - - Contingent consideration 2.3 (2.3) (e) - - - - Total operating expenses 200.1 (46.4) 153.8 146.1 (7.6) 138.5 Income (loss) from operations (33.5) 46.4 12.9 5.7 7.6 13.2 Interest income (expense), net (10.0) 5.8 (f) (4.2) 0.3 - 0.3 Income (loss) before Income taxes (43.4) 52.2 8.7 6.0 7.6 13.5 Income tax benefit 92.4 (92.4) (g) - - - Net income (loss) 48.9 $ (40.2) $ 8.7 $ 6.0 $ 7.6 $ 13.5 $ Net income (loss) per common share: Basic 0.99 $ 0.18 $ 0.12 $ 0.28 $ Diluted 0.99 $ 0.18 $ 0.12 $ 0.27 $ Shares used to compute net income (loss) per share: Basic 49.3 49.3 48.6 48.6 Diluted 49.6 49.6 49.3 49.3 * Actient revenues are included for the time period from April 26, 2013 to June 30, 2013 |
|
|
Auxilium Reconciliation of GAAP to Non-GAAP Net Income (Loss) 6 Months 6 Months Ended June 30, 2013 Ended June 30, 2012 Adjustments to: (a) Costs of goods sold: Employee stock-based compensation (1) (0.1) $ (0.0) $ Acquired inventory step -up value (2) (4.5) - Total (4.6) $ (0.0) $ (b) Research and development: Employee stock-based compensation (1) (1.4) (1.2) (c) Selling, general and administrative: Employee stock-based compensation (1) (6.5) (6.3) Acquisition related severance costs (3) (10.0) - Acquisition related transaction and integration costs (3) (10.7) - Total (27.3) $ (6.3) $ (d) Amortization of purchased intangibles (4) (10.9) - (e) Contingent consideration (5) (2.3) - (f) Interest income (expense), net Non-cash interest expense related to convertible debt and term loan (6) 5.8 - (g) Income tax benefit (7) (92.4) - (1) (2) (3) (4) (5) (6) (7) The effects of recognition of the step-up in value of inventory acquired in the Actient acquisition are excluded because this expense is non-cash and, consequently, we believe investors are able to more accurately compare our operating results to those of our peer companies. Additionally, the amounts excluded are not indicative of anticipated ongoing operations. The effects of non-recurring expenses related to the acquisition and integration are excluded because of the non-cash nature of these expenses and, we believe, such exclusion facilitates investors ability to more accurately compare our operating results to those of our peer companies. Additionally, the amounts excluded are not indicative of anticipated ongoing operations. The effects of amortization of intangible assets acquired in the Actient acquisition are excluded because this expense is non-cash and, we believe, such exclusion facilitates investors ability to more accurately compare our operating results to those of our peer companies. The effects of change in contingent consideration are excluded due to the nature of this charge, which is related to the change in the fair value of the liability for contingent consideration in connection with the acquisition of Actient. We believe such exclusion facilitates investors ability to more accurately compare our operating results to those of our peer companies and is reflective of how Auxilium management internally manages the business. The effects of non-cash interest related to the convertible senior notes due 2018 and the term loan due 2017 are excluded. We believe such exclusion facilitates an understanding of the effects of the debt service obligations on the Company's liquidity and comparisons to peer group companies, and is reflective of how Auxilium management internally manages the business. The effects of non-cash tax benefit related to the acquisition of Actient is excluded because of its non-recurring nature. We believe such exclusion facilitates investors ability to more accurately compare our operating results to those of our peer companies. The effects of employee stock-based compensation are excluded because of varying available valuation methodologies and subjective assumptions. We believe this is a useful measure for employees because such exclusion facilitates comparison to peer companies who also provide similar non-GAAP disclosures and is reflective of how Auxilium management internally manages the business. |
|
|
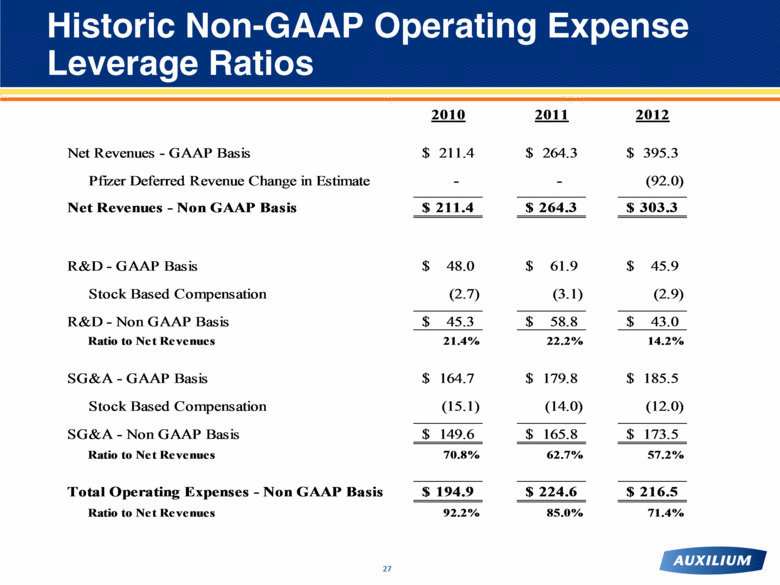
Historic Non-GAAP Operating Expense Leverage Ratios 27 2010 2011 2012 Net Revenues - GAAP Basis 211.4 $ 264.3 $ 395.3 $ Pfizer Deferred Revenue Change in Estimate - - (92.0) Net Revenues - Non GAAP Basis 211.4 $ 264.3 $ 303.3 $ R&D - GAAP Basis 48.0 $ 61.9 $ 45.9 $ Stock Based Compensation (2.7) (3.1) (2.9) R&D - Non GAAP Basis 45.3 $ 58.8 $ 43.0 $ Ratio to Net Revenues 21.4% 22.2% 14.2% SG&A - GAAP Basis 164.7 $ 179.8 $ 185.5 $ Stock Based Compensation (15.1) (14.0) (12.0) SG&A - Non GAAP Basis 149.6 $ 165.8 $ 173.5 $ Ratio to Net Revenues 70.8% 62.7% 57.2% Total Operating Expenses - Non GAAP Basis 194.9 $ 224.6 $ 216.5 $ Ratio to Net Revenues 92.2% 85.0% 71.4% |

