Attached files
| file | filename |
|---|---|
| 8-K - FORM 8-K DATED JULY 31, 2013 - PG&E Corp | form8k2qeps.htm |
| EX-99.1 - PG&E CORPORATION EARNINGS ANNOUNCEMENT DATED JULY 31, 2013 - PG&E Corp | ex9901.htm |

PG&E Corporation Second Quarter Earnings Call July 31, 2013 This presentation is not complete without the accompanying statements made by management during the webcast conference call held on July 31, 2013. This presentation, including Exhibits, and the accompanying press release, were attached to PG&E Corporation’s Current Report on Form 8-K that was furnished to the Securities and Exchange Commission on July 31, 2013 and, along with the replay of the conference call, are also available on PG&E Corporation’s website at www.pge-corp.com.

* Key Focus Areas Position company for success Partner effectively Resolve gas issues Execute critical gas work Complete regulatory proceedings as soon as possible Rigorous multi-year planning Drive continuous improvement Strengthen local presence Engage in public policy development
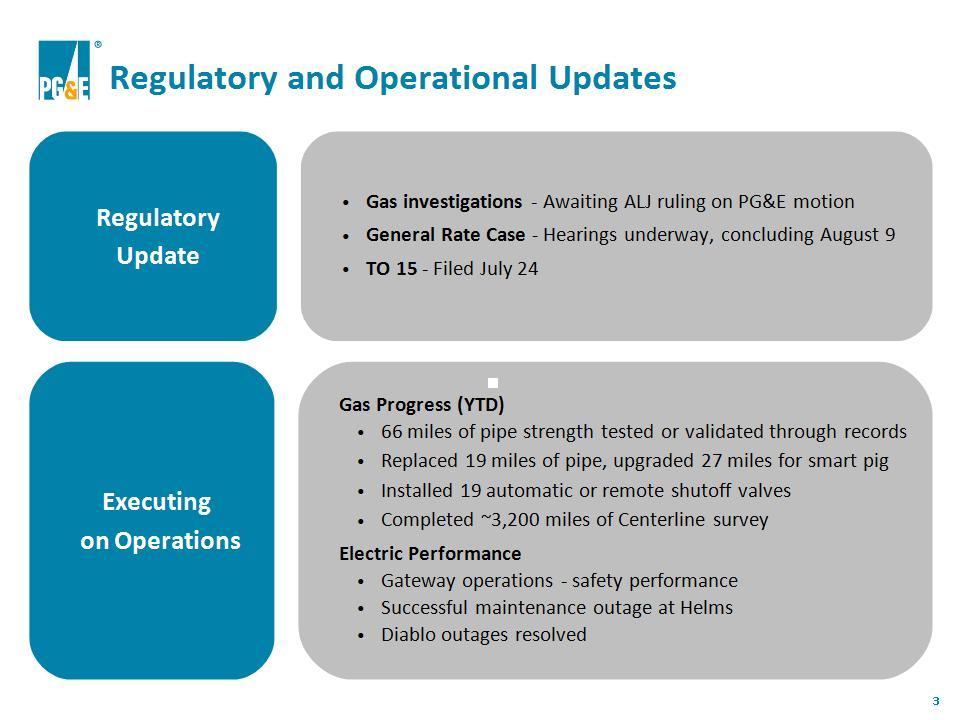
* Regulatory and Operational Updates Executing on Operations Gas Progress (YTD) 66 miles of pipe strength tested or validated through records Replaced 19 miles of pipe, upgraded 27 miles for smart pig Installed 19 automatic or remote shutoff valves Completed ~3,200 miles of Centerline survey Electric Performance Gateway operations – safety performance Successful maintenance outage at Helms Diablo outages resolved Regulatory Update Gas investigations – Awaiting ALJ ruling on PG&E motion General Rate Case – Hearings underway, concluding August 9 TO 15 – Filed July 24

* Q2 2013: Earnings Results See Exhibit A for additional detail.

* EPS from Operations Q2 2013: Q over Q Comparison EPS from Operations is not calculated in accordance with GAAP and excludes items impacting comparability. See Exhibit A for a reconciliation of EPS from Operations to EPS on a GAAP basis. (1) Other reflects lower gas transmission revenues, financing and depreciation costs for capital spending in excess of authorized levels, higher below-the-line costs, and miscellaneous other items. See Exhibit B for additional detail. (1)

* (1) The guidance range for 2013 does not include future insurance recoveries or potential penalties (other than those already accrued) or any potential punitive damages. 2013 EPS Guidance See Exhibit 1 for factors that could cause actual results to differ materially from the guidance presented and underlying assumptions. See Exhibit E for additional detail.

Appendix Appendix

* Table of Contents Appendix 1 – Safe Harbor Statements and Regulatory and Guidance Matters Exhibit 1: Safe Harbor Statements page 10 Exhibit 2: Gas Regulatory Proceedings Calendar page 11 Exhibit 3: Gas Pipeline Safety Costs page 12 Exhibit 4: CPSD Recommended Penalty – Total Shareholder Impact page 13 Exhibit 5: Assumptions for 2013 Guidance page 14 Exhibit 6: Earnings from Operations Comparison page 15 Exhibit 7: 2013 Natural Gas Matters page 16 Exhibit 8: 2013 Equity Issuance page 17 Exhibit 9: Looking Ahead: Capital Expenditures page 18 Exhibit 10: Looking Ahead: Rate Base Growth page 19 Exhibit 11: Looking Ahead: Natural Gas Matters page 20 Appendix 2 – Supplemental Earnings Materials Exhibit A: Reconciliation of PG&E Corporation Earnings from Operations to Consolidated page 22 Income Available for Common Shareholders in Accordance with GAAP Exhibit B: Key Drivers of PG&E Corporation Earnings per Common Share from Operations page 23 Exhibit C: Operational Performance Metrics page 24 - 25 Exhibit D: Sales and Sources Summary page 26 Exhibit E: EPS Guidance page 27 Exhibit F: General Earnings Sensitivities page 28 Exhibit G: Summary of Selected Regulatory Cases page 29 - 31

Appendix Appendix 1

* Exhibit 1: Safe Harbor Statements Management's statements regarding guidance for PG&E Corporation’s future financial results and earnings from operations per common share, general earnings sensitivities, and the underlying assumptions about the future levels of capital expenditures, rate base, costs, and equity issuances, constitute forward-looking statements that are necessarily subject to various risks and uncertainties. These statements reflect management’s judgment and opinions which are based on current expectations and various forecasts, estimates, and projections, the realization or resolution of which may be outside of management’s control. PG&E Corporation and Pacific Gas and Electric Company (“Utility”) are not able to predict all the factors that may affect future results. Some of the factors that could cause actual results to differ materially include: the outcome of the CPUC’s pending investigations related to the Utility’s natural gas operating practices and the San Bruno accident, including the ultimate amount of fines payable to the State General Fund and the extent to which the Utility’s past and future unrecovered and unrecoverable costs to perform work associated with its natural gas system are considered in reaching the final outcome; the ultimate amount of third-party liability incurred in connection with the San Bruno accident and the timing and amount of related insurance recoveries; the outcome of the pending criminal investigation related to the San Bruno accident, including the ultimate amount of fines that may be imposed and the impact of remedial measures such as the appointment of an independent monitor; whether PG&E Corporation and the Utility are able to repair the reputational harm that they have suffered, and may suffer in the future, due to the negative publicity surrounding the San Bruno accident, the related civil litigation, and the pending investigations, including any charge or finding of criminal liability; the ultimate amount of costs the Utility incurs in the future that are not recovered through rates, including costs to perform incremental work to improve the safety and reliability of electric and natural gas operations; the outcomes of ratemaking proceedings, such as the 2014 General Rate Case, the electric transmission owner rate cases, and the 2015 Gas Transmission and Storage rate case; the amount and timing of additional common stock issuances by PG&E Corporation the proceeds of which are contributed as equity to maintain the Utility’s authorized capital structure as it incurs charges and costs, including costs and fines associated with natural gas matters, that are not recoverable through rates or insurance; and changes in the availability and cost of borrowing and debt financing; the impact of environmental remediation laws, regulations, and orders; the extent to which the Utility is able to recover environmental remediation costs in rates or from other sources; and the ultimate amount of environmental remediation costs the Utility incurs but does not recover, such as the remediation costs associated with the Utility’s natural gas compressor station site located near Hinkley, California; the impact of new legislation, regulations, recommendations, policies, decisions, or orders relating to the operations, seismic design, security, safety, or decommissioning of nuclear generation facilities, the storage of spent nuclear fuel or cooling water intake; the occurrence of events, including cyber-attacks, that can cause unplanned outages, reduce generating output, disrupt the Utility’s service to customers, or damage or disrupt the facilities, operations, or information technology and systems owned by the Utility, its customers, or third parties on which the Utility relies; and whether the occurrence of such events subject the Utility to third-party liability for property damage or personal injury, or result in the imposition of civil, criminal, or regulatory penalties on the Utility; and the other factors and risks discussed in PG&E Corporation’s and the Utility’s 2012 Annual Report on Form 10-K and other reports filed with the Securities and Exchange Commission.

* 7/18: PG&E motion to reopen record Exhibit 2: Gas Regulatory Proceedings Calendar Recordkeeping OII I. 11-02-016 Class Location OII I. 11-11-009 Gas Pipeline OII I. 12-01-007 Gas Pipeline Safety OIR R. 11-02-019 10/29: PSEP update application 5/24: PG&E coordinated reply briefs on fines & remedies 6/7: Rebuttal briefs on fines & remedies 7/8: CPSD request to file amended reply brief 5/6: Briefs on fines & remedies 7/10: Responses to CPSD request 7/16: CPSD amended brief 7/26: Responses to PG&E motion 7/30: Quarterly compliance filing

* Exhibit 3: Gas Pipeline Safety Costs * Expenses in excess of amounts authorized in 2011-2014 Gas Transmission & Storage Rate Case ("Gas Accord V")

* Exhibit 4: CPSD Recommended Penalty – Total Shareholder Impact (1) Actual and forecast costs borne by shareholders for gas pipeline safety work, 2010 and beyond. See Exhibit 3 for additional detail. (2) The CPSD penalty recommendation proposes a $300 million fine and recognizes only $435 million of shareholder-funded PSEP spending. The CPSD equates its recommendation to a total of $2.25 billion, which would require $1.515 billion in incremental shareholder-funded gas safety work.

* Authorized ROE: 10.4% CPUC 9.1% FERC Cost of Capital Authorized Rate Base (weighted average) ($ billions) Exhibit 5: Assumptions for 2013 Guidance EPS Factors - Incremental O&M spending ($250 M) - Financing and depreciation costs for incremental capex (~$1B) - CWIP earnings 100% offset - Lower gas storage revenues + Energy efficiency incentive revenues Equity Ratio: 52% Capital Expenditures Forecast ($ millions) *Electric Transmission rate base reflects full TO14 request Excerpt from Q4 2012 Earnings Package, Feb 21, 2013

* 2012 EPS from Operations Exhibit 6: Earnings from Ops Comparison ROE reductions Higher shares CWIP earnings 100% offset by below-the-line costs Capital expenditures exceeding authorized + Rate base growth $3.22 $2.55 - 2.75 2013 EPS from Operations Earnings from Operations is not calculated in accordance with GAAP and excludes items impacting comparability. Excerpt from Q4 2012 Earnings Package, Feb 21, 2013

* Exhibit 7: 2013 Natural Gas Matters (1) Unrecovered PSEP Expense includes what was previously called “PSEP” and “PSEP - Not Requested.” Assumes no additional disallowed capital. (2) For 2013 and 2014, right-of-way expense is expected to represent more than half of Emerging Work costs. Excerpt from Q4 2012 Earnings Package, Feb 21, 2013

* 2012 2013(1) ~$775M $1B - 1.2B + Lower earnings from operations + Higher capital expenditures + Q4 2012 PSEP capital charge Exhibit 8: 2013 Equity Issuance (1) The guidance range for 2013 does not include potential penalties (other than those already accrued). See Exhibit 1 for factors that could cause actual results to differ materially from the guidance presented and underlying assumptions. Excerpt from Q4 2012 Earnings Package, Feb 21, 2013
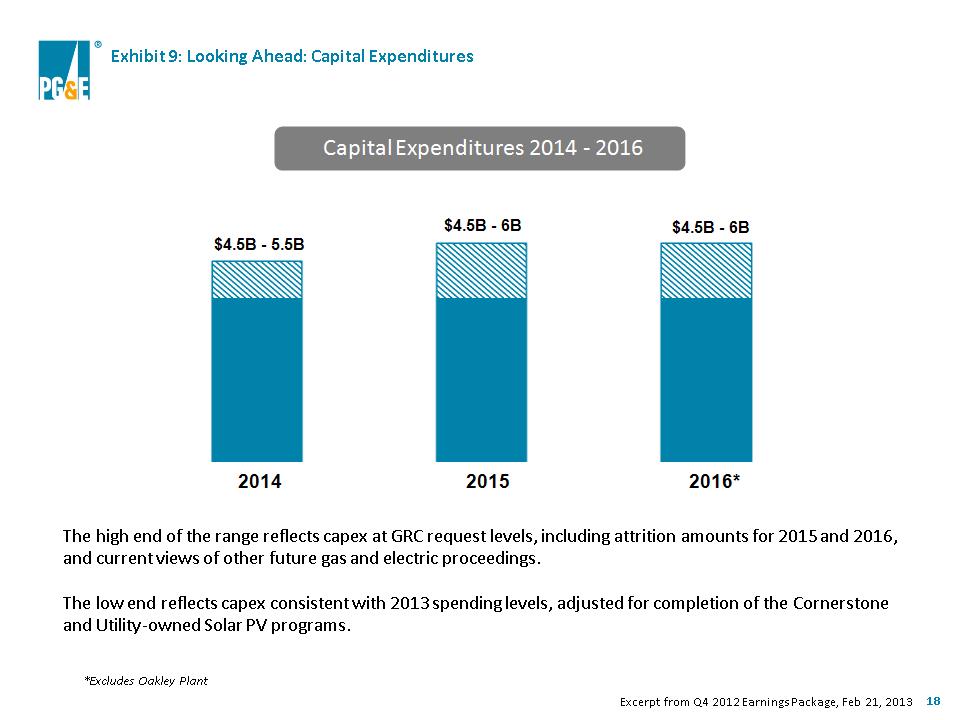
* Exhibit 9: Looking Ahead: Capital Expenditures Capital Expenditures 2014 - 2016 $4.5B - 5.5B $4.5B - 6B $4.5B - 6B 2014 2015 2016* The high end of the range reflects capex at GRC request levels, including attrition amounts for 2015 and 2016, and current views of other future gas and electric proceedings. The low end reflects capex consistent with 2013 spending levels, adjusted for completion of the Cornerstone and Utility-owned Solar PV programs. *Excludes Oakley Plant Excerpt from Q4 2012 Earnings Package, Feb 21, 2013

* 2014 2016* Exhibit 10: Looking Ahead: Rate Base Growth Rate Base Growth 2014 - 2016 *Excludes Oakley Plant The high end of the range reflects capex at GRC request levels, including attrition amounts for 2015 and 2016, and current views of other future gas and electric proceedings. The low end reflects capex consistent with 2013 spending levels, adjusted for completion of the Cornerstone and Utility-owned Solar PV programs. Excerpt from Q4 2012 Earnings Package, Feb 21, 2013

* Exhibit 11: Looking Ahead: Natural Gas Matters Excerpt from Q4 2012 Earnings Package, Feb 21, 2013

Appendix 2 Appendix

* Exhibit A: Reconciliation of PG&E Corporation Earnings from Operations to Consolidated Income Available for Common Shareholders in Accordance with Generally Accepted Accounting Principles (“GAAP”) “Earnings from operations” is not calculated in accordance with GAAP and excludes items impacting comparability as described in Note (2) below. Items impacting comparability reconcile earnings from operations with Consolidated Income Available for Common Shareholders as reported in accordance with GAAP. The Utility incurred net costs of $29 million and $91 million, on a pre-tax basis, during the three and six months ended June 30, 2013, respectively, in connection with natural gas matters. (The after-tax amounts of $17 million and $54 million appear in the table above.) These amounts included pipeline-related costs to validate operating pressures and perform other activities associated with the Utility’s pipeline safety enhancement plan that were disallowed by the CPUC, costs related to the Utility’s multi-year effort to identify and remove encroachments from transmission pipeline rights-of-way and other gas-related work, and legal and other expenses. These costs were partially offset by insurance recoveries. There were no additional charges recorded for this period related to fines or third-party claims. Second Quarter, 2013 vs. 2012 (in millions, except per share amounts) (4) During the three and six months ended June 30, 2013, the Utility recorded a charge of $5 million, pre-tax, for environmental remediation costs associated with the Utility's natural gas compressor site located near Hinkley, California.
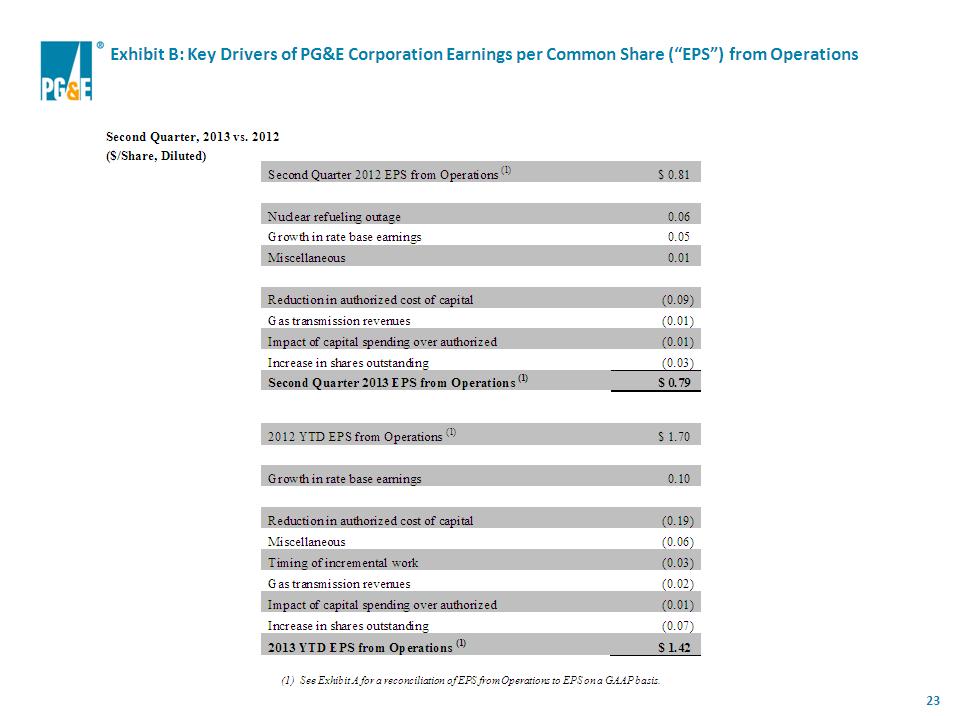
* Exhibit B: Key Drivers of PG&E Corporation Earnings per Common Share (“EPS”) from Operations (1) See Exhibit A for a reconciliation of EPS from Operations to EPS on a GAAP basis. Second Quarter, 2013 vs. 2012 ($/Share, Diluted)
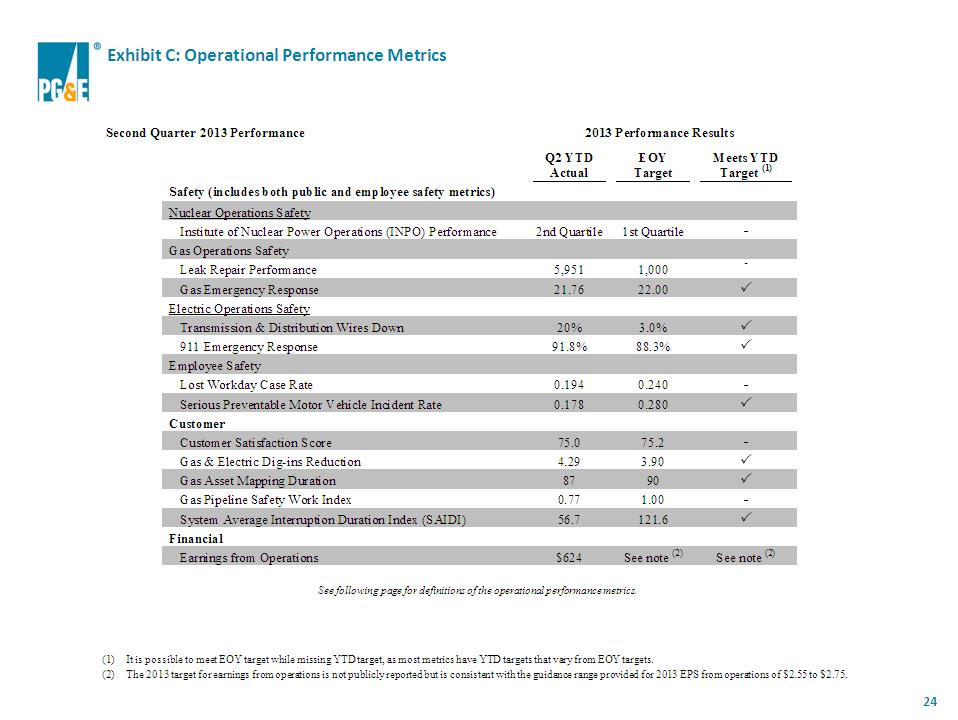
* Exhibit C: Operational Performance Metrics It is possible to meet EOY target while missing YTD target, as most metrics have YTD targets that vary from EOY targets. The 2013 target for earnings from operations is not publicly reported but is consistent with the guidance range provided for 2013 EPS from operations of $2.55 to $2.75. Second Quarter 2013 Performance See following page for definitions of the operational performance metrics.

* Definitions of 2013 Operational Performance Metrics from Exhibit C The Operational Performance Metrics focus on three areas: safety (public and employee), customer service, and financial performance. The column titled “Meets YTD Target” shows illustratively whether or not the metric has met the year-to-date target, which may be different from the EOY target. Safety Public and employee safety are measured in four areas: (1) Nuclear Operations Safety, (2) Gas Operations Safety, (3) Electric Operations Safety, and (4) Employee Safety. The safety of the Utility’s nuclear power operations is represented by 12 performance indicators for nuclear power generation reported to the Institute of Nuclear Power Operations (“INPO”) and compared to industry benchmarks. The safety of the Utility’s natural gas operations is represented by (a) the number of certain open leaks at year-end and (b) the timeliness (measured in minutes) of on-site response to gas emergency service calls. The safety of the Utility’s electric operations is represented by (a) the percentage improvement in the number of wire down events with resulting sustained unplanned outages, and (b) the percentage of time that Utility personnel are on site within 60 minutes after receiving a 911 call of a potential PG&E electric hazard. The safety of the Utility’s employees is represented by (a) the number of lost workday cases incurred per 200,000 hours worked (or for approximately every 100 employees), and (b) the number of serious motor vehicle incidents that the driver could have reasonably avoided, per one million miles driven. Customer Customer satisfaction and service reliability are measured by: The overall satisfaction (measured as a score of zero to 100) of customers with the products and services offered by the Utility, as measured through a quarterly survey performed by an independent third-party research firm. The number of third party “dig-ins” (i.e., damage resulting in repair or replacement of underground facility) to Utility gas and electric assets per 1,000 Underground Service Alert (USA) tickets. The timeliness (measured in days) of gas asset information being entered into the Utility’s gas mapping system after a gas project is completed. The efficient completion of certain committed work for gas operations-related programs. The index is comprised of five components related to the completion of committed work and three components related to the cost of completing the work. The total time (measured in minutes) the average customer is without electric power during a given time period. Financial Earnings from operations measures PG&E Corporation’s earnings power from ongoing core operations. It allows investors to compare the underlying financial performance of the business from one period to another, exclusive of items that management believes do not reflect the normal course of operations (items impacting comparability). The measurement is not in accordance with GAAP. For a reconciliation of earnings from operations to earnings in accordance with GAAP, see Exhibit A.

* Exhibit D: Pacific Gas and Electric Company Sales and Sources Summary Second Quarter, 2013 vs. 2012 Please see the 2012 Annual Report on Form 10-K for additional information about operating statistics. Includes sources of electric energy totaling 298 kWh and 1,303 kWh for the three months ended June 30, 2013 and 2012, respectively, and 2,333 kWh and 3,136 kWh for the six months ended June 30, 2013 and 2012, respectively.
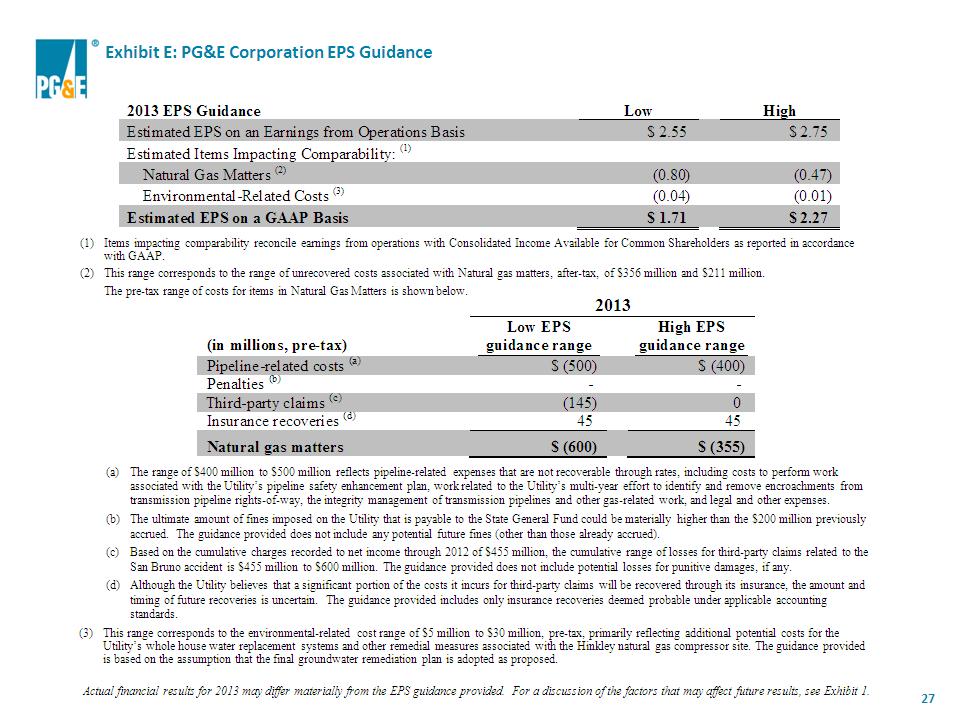
* Items impacting comparability reconcile earnings from operations with Consolidated Income Available for Common Shareholders as reported in accordance with GAAP. This range corresponds to the range of unrecovered costs associated with Natural gas matters, after-tax, of $356 million and $211 million. The pre-tax range of costs for items in Natural Gas Matters is shown below. The range of $400 million to $500 million reflects pipeline-related expenses that are not recoverable through rates, including costs to perform work associated with the Utility’s pipeline safety enhancement plan, work related to the Utility’s multi-year effort to identify and remove encroachments from transmission pipeline rights-of-way, the integrity management of transmission pipelines and other gas-related work, and legal and other expenses. The ultimate amount of fines imposed on the Utility that is payable to the State General Fund could be materially higher than the $200 million previously accrued. The guidance provided does not include any potential future fines (other than those already accrued). Based on the cumulative charges recorded to net income through 2012 of $455 million, the cumulative range of losses for third-party claims related to the San Bruno accident is $455 million to $600 million. The guidance provided does not include potential losses for punitive damages, if any. Although the Utility believes that a significant portion of the costs it incurs for third-party claims will be recovered through its insurance, the amount and timing of future recoveries is uncertain. The guidance provided includes only insurance recoveries deemed probable under applicable accounting standards. (3) This range corresponds to the environmental-related cost range of $5 million to $30 million, pre-tax, primarily reflecting additional potential costs for the Utility’s whole house water replacement systems and other remedial measures associated with the Hinkley natural gas compressor site. The guidance provided is based on the assumption that the final groundwater remediation plan is adopted as proposed. Actual financial results for 2013 may differ materially from the EPS guidance provided. For a discussion of the factors that may affect future results, see Exhibit 1. Exhibit E: PG&E Corporation EPS Guidance

* These general earnings sensitivities on factors that may affect 2013 earnings are forward-looking statements that are based on various assumptions. Actual results may differ materially. For a discussion of the factors that may affect future results, see Exhibit 1. Exhibit F: General Earnings Sensitivities PG&E Corporation and Pacific Gas and Electric Company
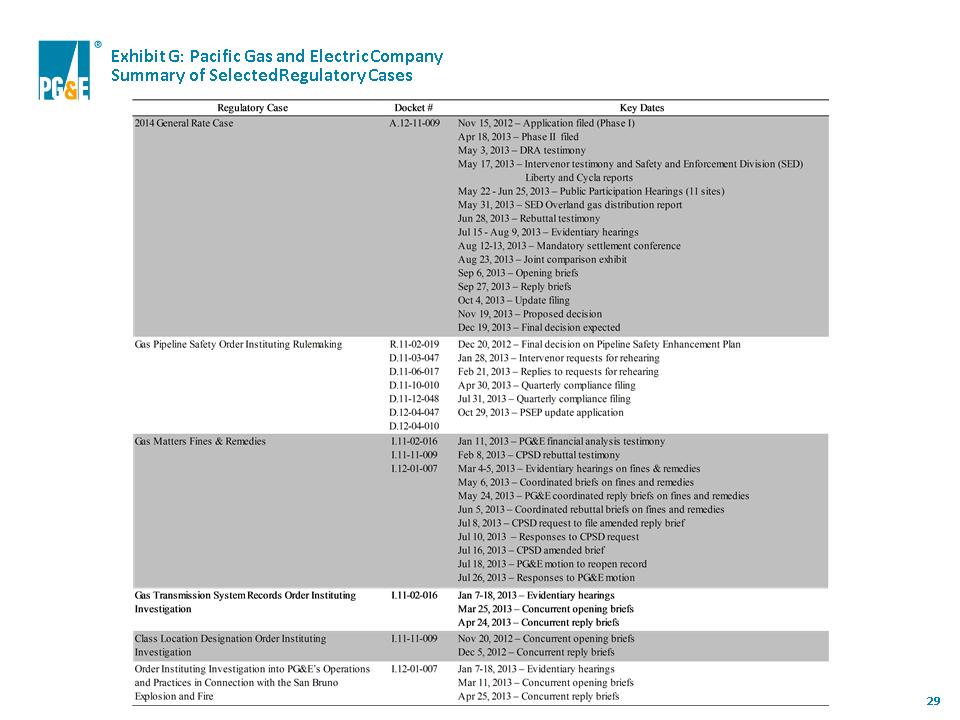
* Exhibit G: Pacific Gas and Electric Company Summary of Selected Regulatory Cases

* Exhibit G: Pacific Gas and Electric Company Summary of Selected Regulatory Cases

* Exhibit G: Pacific Gas and Electric Company Summary of Selected Regulatory Cases