Attached files
| file | filename |
|---|---|
| 8-K - FORM 8-K - JONES LANG LASALLE INC | d576817d8k.htm |
| EX-99.1 - EX-99.1 - JONES LANG LASALLE INC | d576817dex991.htm |
Exhibit 99.2
Supplemental Information Second-Quarter 2013 Earnings Call

Market & Financial Overview
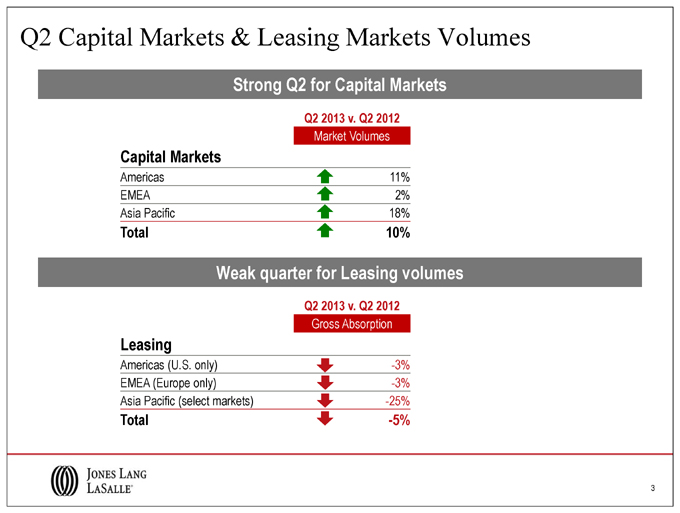
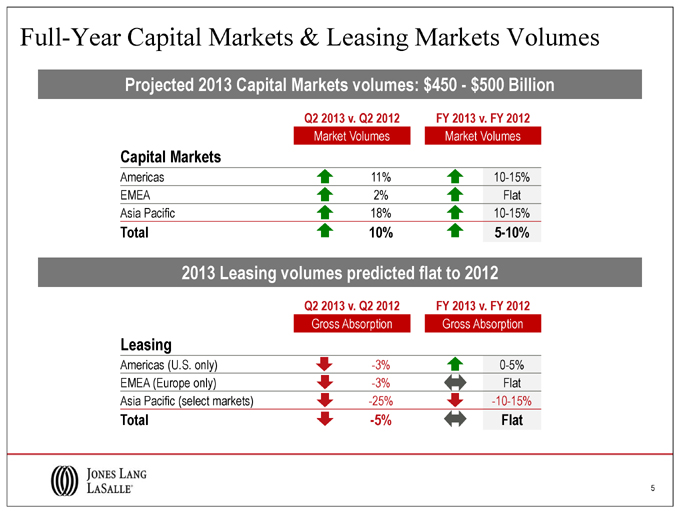
Q2 Capital Markets & Leasing Markets Volumes Strong Q2 for Capital Q2 2013 v. Q2 2012 Market Volumes Capital Markets Americas 11% EMEA 2% Asia Pacific 18% Total 10% Weak quarter for Leasing volumes Q2 2013 v. Q2 2012 Gross Absorption Leasing Americas (U.S. only) -3% EMEA (Europe only) -3% Asia Pacific (select markets) -25% Total -5%
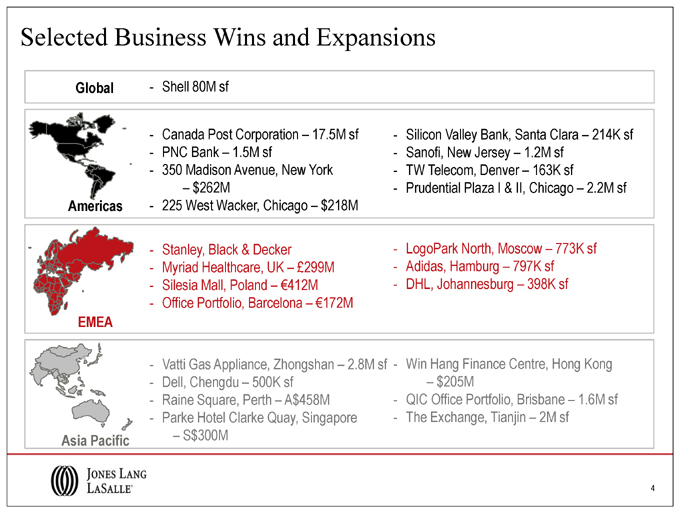
Selected Business Wins and Expansions Global - Shell 80M sf - Canada Post Corporation – 17.5M sf - Silicon Valley Bank, Santa Clara – 214K sf - PNC Bank – 1.5M sf - Sanofi, New Jersey – 1.2M sf - 350 Madison Avenue, New York - TW Telecom, Denver – 163K sf – $262M - Prudential Plaza I & II, Chicago – 2.2M sf - 225 West Wacker, Chicago – $218M - Stanley, Black & Decker - LogoPark North, Moscow – 773K sf - Myriad Healthcare, UK – £299M - Adidas, Hamburg – 797K sf - Silesia Mall, Poland – €412M - DHL, Johannesburg – 398K sf - Office Portfolio, Barcelona – €172M - Vatti Gas Appliance, Zhongshan – 2.8M sf - Win Hang Finance Centre, Hong Kong - Dell, Chengdu – 500K sf – $205M - Raine Square, Perth – A$458M - QIC Office Portfolio, Brisbane – 1.6M sf - Parke Hotel Clarke Quay, Singapore - The Exchange, Tianjin – 2M sf – S$300M
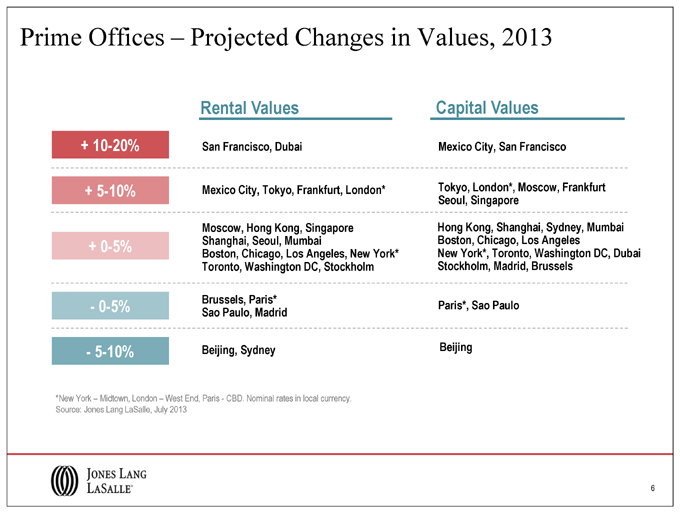
Prime Offices – Projected Changes in Values, 2013 6 + 10-20% + 5-10% + 0-5% - 0-5% - 5-10% Mexico City, Tokyo, Frankfurt, London* Moscow, Hong Kong, Singapore Shanghai, Seoul, Mumbai Boston, Chicago, Los Angeles, New York* Toronto, Washington DC, Stockholm Tokyo, London*, Moscow, Frankfurt Seoul, Singapore Hong Kong, Shanghai, Sydney, Mumbai Boston, Chicago, Los Angeles New York*, Toronto, Washington DC, Dubai Stockholm, Madrid, Brussels Paris*, Sao Paulo San Francisco, Dubai Brussels, Paris* Sao Paulo, Madrid Mexico City, San Francisco *New York – Midtown, London – West End, Paris - CBD. Nominal rates in local currency. Source: Jones Lang LaSalle, July 2013 Rental Values Capital Values Beijing, Sydney Beijing
Financial Information
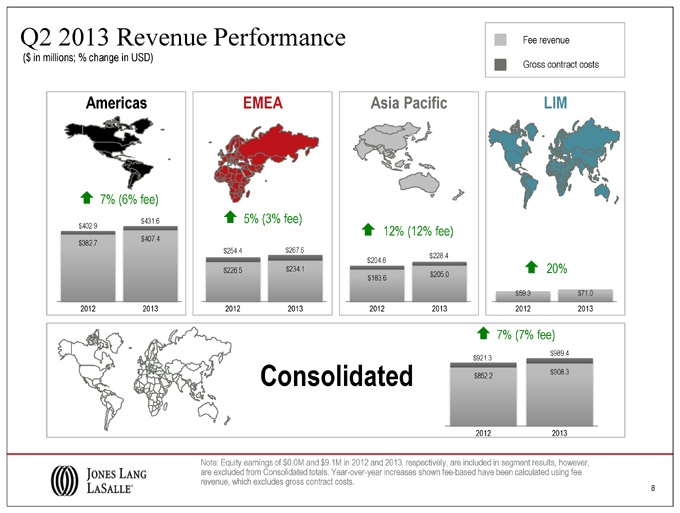
$852.2 $908.3 2012 2013 $382.7 $407.4 2012 2013 8 Q2 2013 Revenue Performance Note: Equity earnings of $0.0M and $9.1M in 2012 and 2013, respectively, are included in segment results, however, are excluded from Consolidated totals. Year-over-year increases shown fee-based have been calculated using fee revenue, which excludes gross contract costs. Americas EMEA Asia Pacific LIM Consolidated ($ in millions; % change in USD) ? 7% (6% fee) $183.6 $205.0 2012 2013 $59.3 $71.0 2012 2013 $226.5 $234.1 2012 2013 ? 5% (3% fee) ? 12% (12% fee) ? 20% ? 7% (7% fee) $402.9 $431.6 $254.4 $267.6 $204.6 $228.4 $921.3 Fee revenue Gross contract costs $989.4
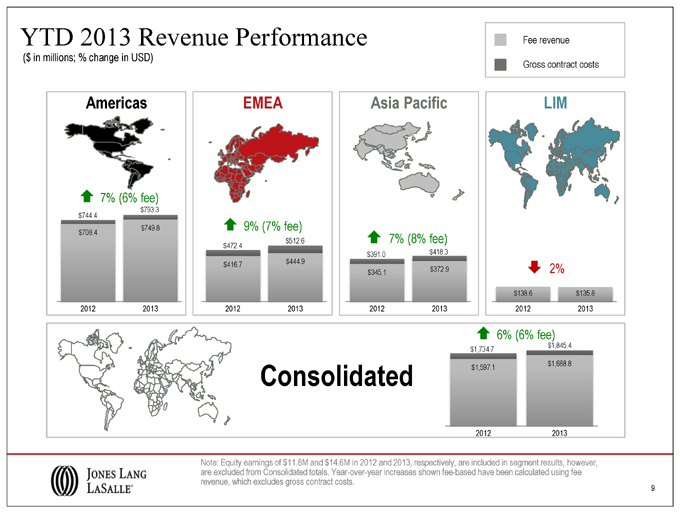
$1,597.1 $1,688.8 2012 2013 $708.4 $749.8 2012 2013 9 YTD 2013 Revenue Performance Note: Equity earnings of $11.8M and $14.6M in 2012 and 2013, respectively, are included in segment results, however, are excluded from Consolidated totals. Year-over-year increases shown fee-based have been calculated using fee revenue, which excludes gross contract costs. Americas EMEA Asia Pacific LIM Consolidated ($ in millions; % change in USD) ? 7% (6% fee) $345.1 $372.9 2012 2013 $138.6 $135.8 2012 2013 $416.7 $444.9 2012 2013 ? 9% (7% fee) ? 7% (8% fee) ? 2% ? 6% (6% fee) $793.3 $744.4 $472.4 $512.6 $391.0 $418.3 $1,734.7 $1,845.4 Fee revenue Gross contract costs
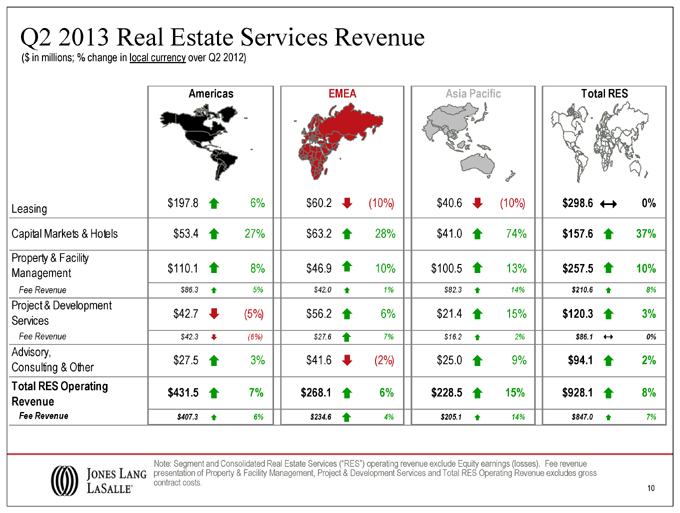
10 Q2 2013 Real Estate Services Revenue ($ in millions; % change in local currency over Q2 2012) Note: Segment and Consolidated Real Estate Services (“RES”) operating revenue exclude Equity earnings (losses). Fee revenue presentation of Property & Facility Management, Project & Development Services and Total RES Operating Revenue excludes gross contract costs. Leasing $197.8 ? 6% $60.2 ? (10%) $40.6 ? (10%) $298.6 ? 0% Capital Markets & Hotels $53.4 ? 27% $63.2 ? 28% $41.0 ? 74% $157.6 ? 37% Property & Facility Management $110.1 ? 8% $46.9 ? 10% $100.5 ? 13% $257.5 ? 10% Fee Revenue $86.3 ? 5% $42.0 ? 1% $82.3 ? 14% $210.6 ? 8% Project & Development Services $42.7 ? (5%) $56.2 ? 6% $21.4 ? 15% $120.3 ? 3% Fee Revenue $42.3 ? (6%) $27.6 ? 7% $16.2 ? 2% $86.1 ? 0% Advisory, Consulting & Other $27.5 ? 3% $41.6 ? (2%) $25.0 ? 9% $94.1 ? 2% Total RES Operating Revenue $431.5 ? 7% $268.1 ? 6% $228.5 ? 15% $928.1 ? 8% Fee Revenue $407.3 ? 6% $234.6 ? 4% $205.1 ? 14% $847.0 ? 7% Americas EMEA Asia Pacific Total RES
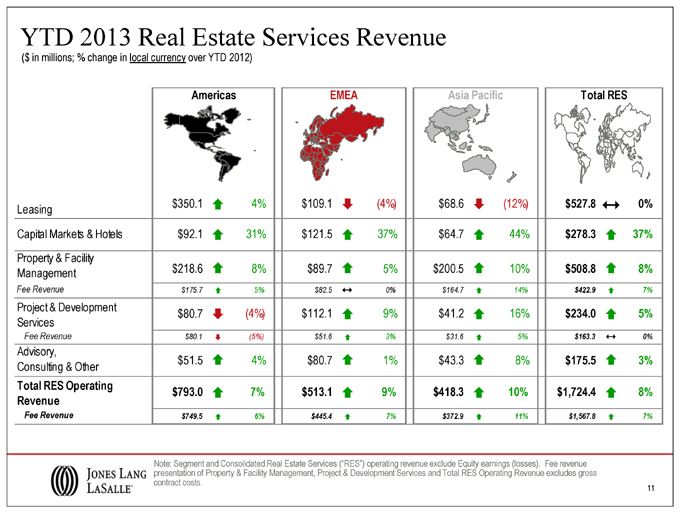
11 YTD 2013 Real Estate Services Revenue ($ in millions; % change in local currency over YTD 2012) Note: Segment and Consolidated Real Estate Services (“RES”) operating revenue exclude Equity earnings (losses). Fee revenue presentation of Property & Facility Management, Project & Development Services and Total RES Operating Revenue excludes gross contract costs. Leasing $350.1 ? 4% $109.1 ? (4%) $68.6 ? (12%) $527.8 ? 0% Capital Markets & Hotels $92.1 ? 31% $121.5 ? 37% $64.7 ? 44% $278.3 ? 37% Property & Facility Management $218.6 ? 8% $89.7 ? 5% $200.5 ? 10% $508.8 ? 8% Fee Revenue $175.7 ? 5% $82.5 ? 0% $164.7 ? 14% $422.9 ? 7% Project & Development Services $80.7 ? (4%) $112.1 ? 9% $41.2 ? 16% $234.0 ? 5% Fee Revenue $80.1 ? (5%) $51.6 ? 3% $31.6 ? 5% $163.3 ? 0% Advisory, Consulting & Other $51.5 ? 4% $80.7 ? 1% $43.3 ? 8% $175.5 ? 3% Total RES Operating Revenue $793.0 ? 7% $513.1 ? 9% $418.3 ? 10% $1,724.4 ? 8% Fee Revenue $749.5 ? 6% $445.4 ? 7% $372.9 ? 11% $1,567.8 ? 7% Americas EMEA Asia Pacific Total RES
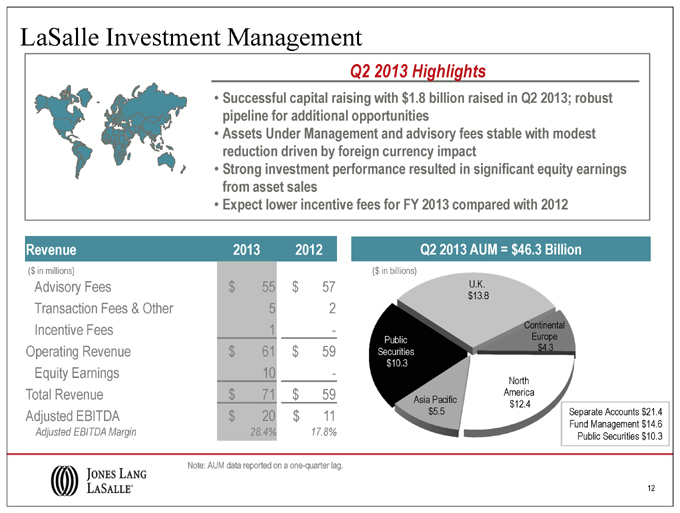
LaSalle Investment Management Note: AUM data reported on a one-quarter lag. Q2 2013 Highlights Successful capital raising with $1.8 billion raised in Q2 2013; robust pipeline for additional opportunities Assets Under Management and advisory fees stable with modest reduction driven by foreign currency impact Strong investment performance resulted in significant equity earnings from asset sales Expect lower incentive fees for FY 2013 compared with 2012 Q2 2013 AUM = $46.3 Billion U.K. $13.8 Continental Europe $4.3 North America Asia Pacific $12.4 $5.5 Public Securities $10.3 Revenue 2013 2012 Advisory Fees $ 55 $ 57 Transaction Fees & Other 5 2 Incentive Fees 1 - Operating Revenue $ 61 $ 59 Equity Earnings 10 - Total Revenue $ 71 $ 59 Adjusted EBITDA $ 20 $ 11 Adjusted EBITDA Margin 28.4% 17.8% ($ in millions) Separate Accounts $21.4 Fund Management $14.6 Public Securities $10.3 ($ in billions) 12
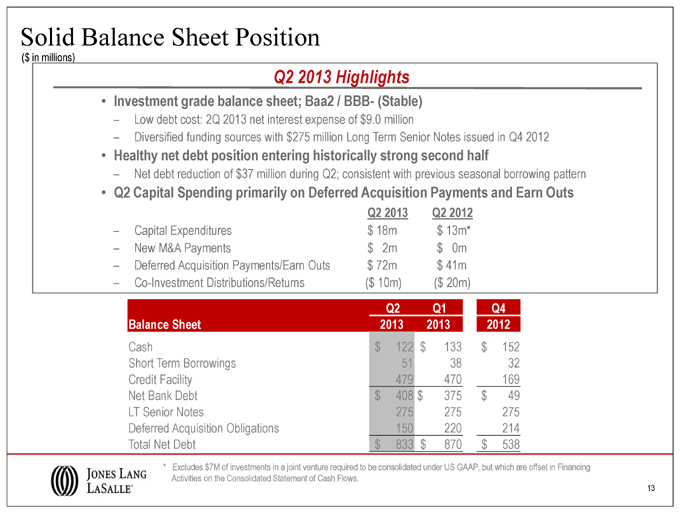
Solid Balance Sheet Position Investment grade balance sheet; Baa2 / BBB- (Stable) – Low debt cost: 2Q 2013 net interest expense of $9.0 million – Diversified funding sources with $275 million Long Term Senior Notes issued in Q4 2012 Healthy net debt position entering historically strong second half – Net debt reduction of $37 million during Q2; consistent with previous seasonal borrowing pattern Q2 Capital Spending primarily on Deferred Acquisition Payments and Earn Outs Q2 2013 Q2 2012 – Capital Expenditures $ 18m $ 13m* – New M&A Payments $ 2m $ 0m – Deferred Acquisition Payments/Earn Outs $ 72m $ 41m – Co-Investment Distributions/Returns ($ 10m) ($ 20m) Q2 2013 Highlights Q2 Q1 Q4 Balance Sheet 2013 2013 2012 Cash $ 122 $ 133 $ 152 Short Term Borrowings 51 38 32 Credit Facility 479 470 169 Net Bank Debt $ 408 $ 375 $ 49 LT Senior Notes 275 275 275 Deferred Acquisition Obligations 150 220 214 Total Net Debt $ 833 $ 870 $ 538 ($ in millions) 13 * Excludes $7M of investments in a joint venture required to be consolidated under US GAAP, but which are offset in Financing Activities on the Consolidated Statement of Cash Flows
Appendix
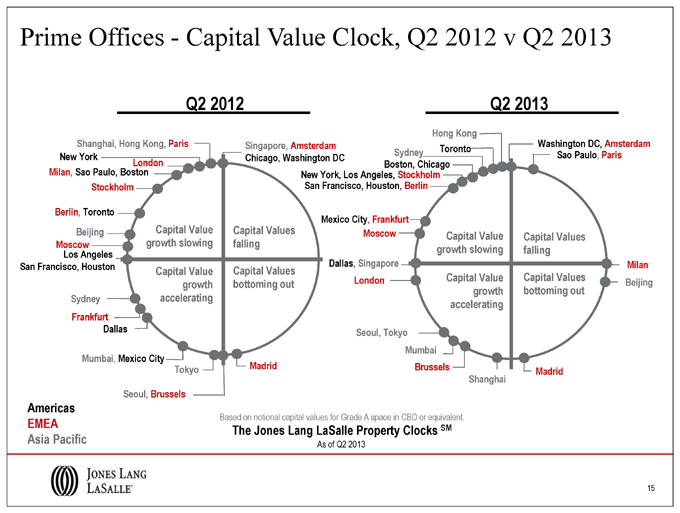
15 Prime Offices - Capital Value Clock, Q2 2012 v Q2 2013 As of Q2 2013 The Jones Lang LaSalle Property Clocks SM Americas EMEA Asia Pacific Based on notional capital values for Grade A space in CBD or equivalent. Q2 2012 Q2 2013 Shanghai, Hong Kong, Paris Capital Value growth slowing Capital Value growth accelerating Capital Values bottoming out Capital Values falling Seoul, Brussels Tokyo Mumbai, Mexico City Sydney Beijing Singapore, Amsterdam Chicago, Washington DC Berlin, Toronto Madrid Frankfurt Moscow Stockholm Milan, Sao Paulo, Boston New York London Los Angeles San Francisco, Houston Dallas Capital Value growth slowing Capital Value growth accelerating Capital Values bottoming out Capital Values falling Boston, Chicago San Francisco, Houston, Berlin Toronto WashSianogtPoanu DloC, ,P Aamrissterdam Mexico City, Frankfurt Dallas, Singapore New York, Los Angeles, Stockholm Beijing Shanghai Mumbai Seoul, Tokyo Sydney Milan Brussels Madrid London Moscow Hong Kong
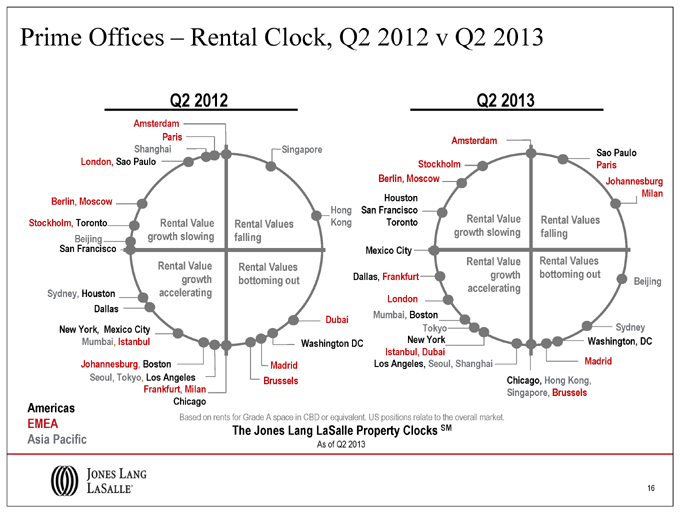
16 Prime Offices – Rental Clock, Q2 2012 v Q2 2013 Americas EMEA Asia Pacific Q2 2012 Q2 2013 As of Q2 2013 The Jones Lang LaSalle Property Clocks SM Based on rents for Grade A space in CBD or equivalent. US positions relate to the overall market. Rental Value growth slowing Rental Value growth accelerating Rental Values bottoming out Rental Values falling Singapore Hong Kong Seoul, Tokyo, Los Angeles Dallas Beijing Shanghai Dubai Madrid Brussels Frankfurt, Milan Chicago Johannesburg, Boston Stockholm, Toronto Berlin, Moscow London, Sao Paulo Paris Amsterdam San Francisco New York, Mexico City Mumbai, Istanbul Washington DC Sydney, Houston Rental Value growth slowing Rental Value growth accelerating Rental Values bottoming out Rental Values falling Chicago, Hong Kong, Singapore, Brussels Dallas, Frankfurt Houston San Francisco Toronto Los Angeles, Seoul, Shanghai Tokyo Washington, DC Mexico City Sao Paulo Paris Mumbai, Boston Sydney Beijing Johannesburg Milan Madrid New York Istanbul, Dubai London Berlin, Moscow Stockholm Amsterdam
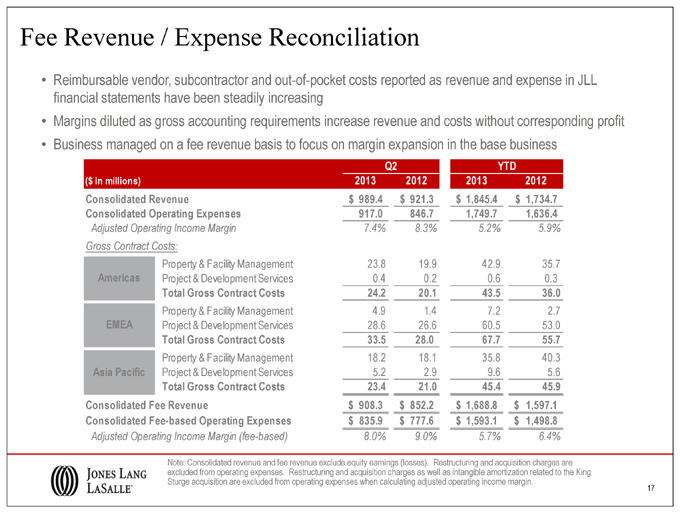
Fee Revenue / Expense Reconciliation Note: Consolidated revenue and fee revenue exclude equity earnings (losses). Restructuring and acquisition charges are excluded from operating expenses. Restructuring and acquisition charges as well as intangible amortization related to the King Sturge acquisition are excluded from operating expenses when calculating adjusted operating income margin. Reimbursable vendor, subcontractor and out-of-pocket costs reported as revenue and expense in JLL financial statements have been steadily increasing Margins diluted as gross accounting requirements increase revenue and costs without corresponding profit Business managed on a fee revenue basis to focus on margin expansion in the base business ($ in millions) 2013 2012 2013 2012 Consolidated Revenue $ 9 89.4 $ 921.3 $ 1,845.4 $ 1,734.7 Consolidated Operating Expenses 917.0 846.7 1 ,749.7 1,636.4 Adjusted Operating Income Margin 7.4% 8.3% 5.2% 5.9% Gross Contract Costs: Property & Facility Management 23.8 19.9 42.9 35.7 Project & Development Services 0.4 0.2 0.6 0.3 Total Gross Contract Costs 24.2 20.1 43.5 36.0 Property & Facility Management 4.9 1.4 7.2 2.7 Project & Development Services 28.6 26.6 60.5 53.0 Total Gross Contract Costs 33.5 28.0 67.7 55.7 Property & Facility Management 18.2 18.1 35.8 40.3 Project & Development Services 5.2 2.9 9.6 5.6 Total Gross Contract Costs 23.4 21.0 45.4 45.9 Consolidated Fee Revenue $ 908.3 $ 852.2 $ 1 ,688.8 $ 1,597.1 Consolidated Fee-based Operating Expenses $ 835.9 $ 777.6 $ 1 ,593.1 $ 1,498.8 Adjusted Operating Income Margin (fee-based) 8.0% 9.0% 5.7% 6.4% Asia Pacific Americas EMEA Q2 YTD 17
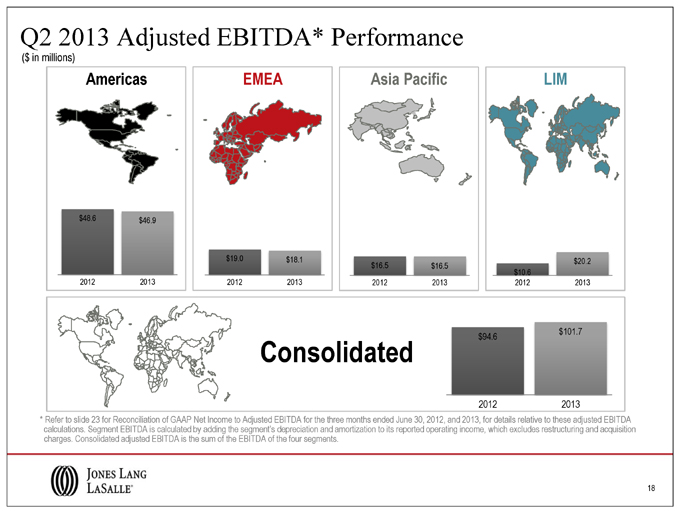
$48.6 $46.9 2012 2013 18 Q2 2013 Adjusted EBITDA* Performance Americas EMEA Asia Pacific LIM Consolidated $94.6 $101.7 2012 2013 * Refer to slide 23 for Reconciliation of GAAP Net Income to Adjusted EBITDA for the three months ended June 30, 2012, and 2013, for details relative to these adjusted EBITDA calculations. Segment EBITDA is calculated by adding the segment’s depreciation and amortization to its reported operating income, which excludes restructuring and acquisition charges. Consolidated adjusted EBITDA is the sum of the EBITDA of the four segments. ($ in millions) $16.5 $16.5 2012 2013 $10.6 $20.2 2012 2013 $19.0 $18.1 2012 2013
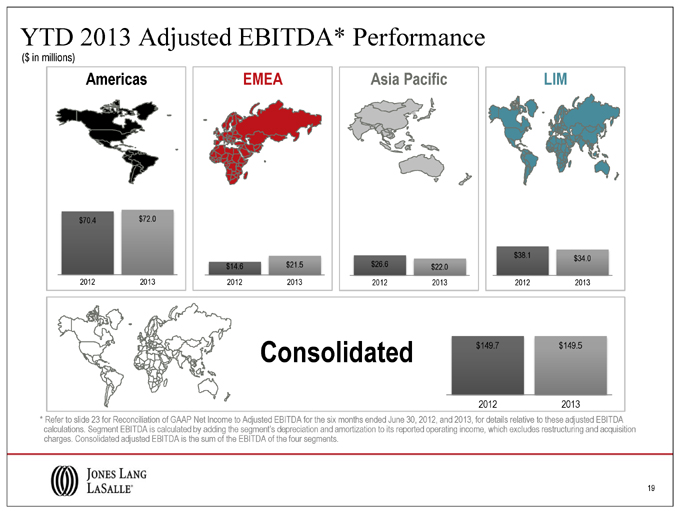
$70.4 $72.0 2012 2013 19 YTD 2013 Adjusted EBITDA* Performance Americas EMEA Asia Pacific LIM Consolidated $149.7 $149.5 2012 2013 * Refer to slide 23 for Reconciliation of GAAP Net Income to Adjusted EBITDA for the six months ended June 30, 2012, and 2013, for details relative to these adjusted EBITDA calculations. Segment EBITDA is calculated by adding the segment’s depreciation and amortization to its reported operating income, which excludes restructuring and acquisition charges. Consolidated adjusted EBITDA is the sum of the EBITDA of the four segments. ($ in millions) $26.6 $22.0 2012 2013 $38.1 $34.0 2012 2013 $14.6 $21.5 2012 2013
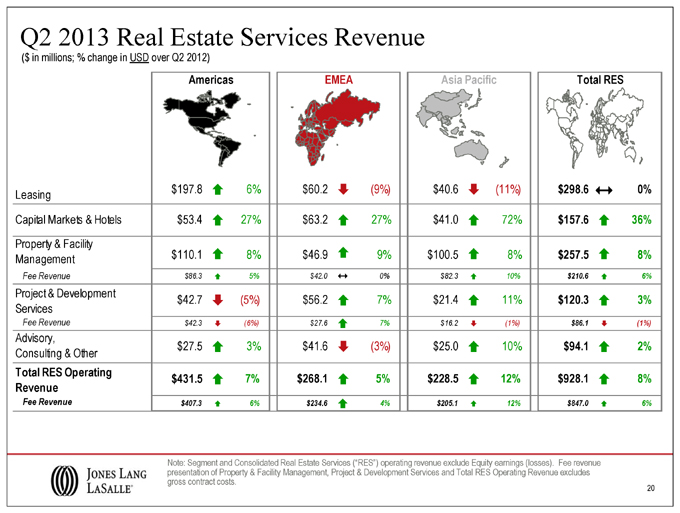
20 Q2 2013 Real Estate Services Revenue ($ in millions; % change in USD over Q2 2012) Note: Segment and Consolidated Real Estate Services (“RES”) operating revenue exclude Equity earnings (losses). Fee revenue presentation of Property & Facility Management, Project & Development Services and Total RES Operating Revenue excludes gross contract costs. Leasing $197.8 ? 6% $60.2 ? (9%) $40.6 ? (11%) $298.6 ? 0% Capital Markets & Hotels $53.4 ? 27% $63.2 ? 27% $41.0 ? 72% $157.6 ? 36% Property & Facility Management $110.1 ? 8% $46.9 ? 9% $100.5 ? 8% $257.5 ? 8% Fee Revenue $86.3 ? 5% $42.0 ? 0% $82.3 ? 10% $210.6 ? 6% Project & Development Services $42.7 ? (5%) $56.2 ? 7% $21.4 ? 11% $120.3 ? 3% Fee Revenue $42.3 ? (6%) $27.6 ? 7% $16.2 ? (1%) $86.1 ? (1%) Advisory, Consulting & Other $27.5 ? 3% $41.6 ? (3%) $25.0 ? 10% $94.1 ? 2% Total RES Operating Revenue $431.5 ? 7% $268.1 ? 5% $228.5 ? 12% $928.1 ? 8% Fee Revenue $407.3 ? 6% $234.6 ? 4% $205.1 ? 12% $847.0 ? 6% Americas EMEA Asia Pacific Total RES
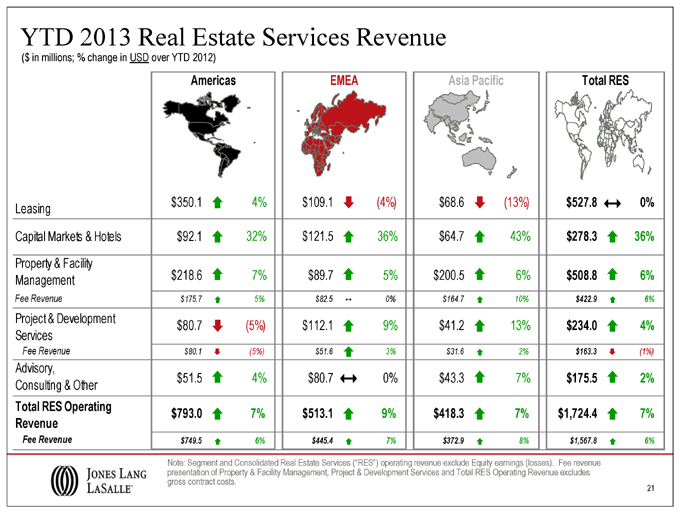
21 YTD 2013 Real Estate Services Revenue ($ in millions; % change in USD over YTD 2012) Note: Segment and Consolidated Real Estate Services (“RES”) operating revenue exclude Equity earnings (losses). Fee revenue presentation of Property & Facility Management, Project & Development Services and Total RES Operating Revenue excludes gross contract costs. Leasing $350.1 ? 4% $109.1 ? (4%) $68.6 ? (13%) $527.8 ? 0% Capital Markets & Hotels $92.1 ? 32% $121.5 ? 36% $64.7 ? 43% $278.3 ? 36% Property & Facility Management $218.6 ? 7% $89.7 ? 5% $200.5 ? 6% $508.8 ? 6% Fee Revenue $175.7 ? 5% $82.5 ? 0% $164.7 ? 10% $422.9 ? 6% Project & Development Services $80.7 ? (5%) $112.1 ? 9% $41.2 ? 13% $234.0 ? 4% Fee Revenue $80.1 ? (5%) $51.6 ? 3% $31.6 ? 2% $163.3 ? (1%) Advisory, Consulting & Other $51.5 ? 4% $80.7 ? 0% $43.3 ? 7% $175.5 ? 2% Total RES Operating Revenue $793.0 ? 7% $513.1 ? 9% $418.3 ? 7% $1,724.4 ? 7% Fee Revenue $749.5 ? 6% $445.4 ? 7% $372.9 ? 8% $1,567.8 ? 6% Americas EMEA Asia Pacific Total RES
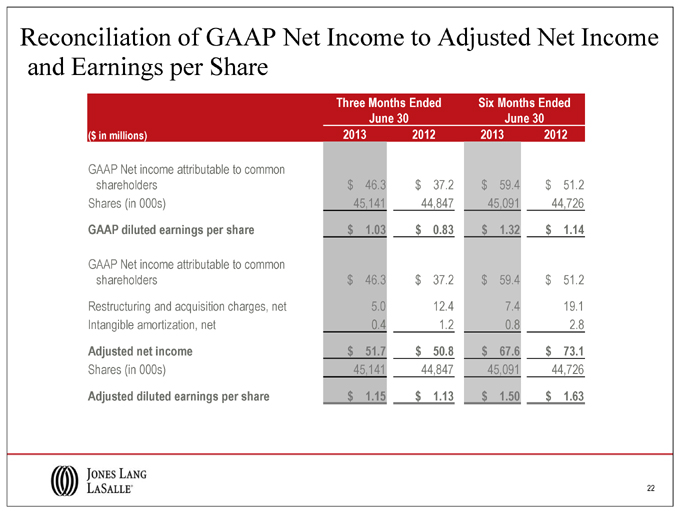
22 Reconciliation of GAAP Net Income to Adjusted Net Income Three Months Ended June 30 Six Months Ended June 30 ($ in millions) 2013 2012 2013 2012 GAAP Net income attributable to common shareholders $ 46.3 $ 37.2 $ 59.4 $ 51.2 Shares (in 000s) 45,141 44,847 45,091 44,726 GAAP diluted earnings per share $ 1.03 $ 0.83 $ 1.32 $ 1.14 GAAP Net income attributable to common shareholders $ 46.3 $ 37.2 $ 59.4 $ 51.2 Restructuring and acquisition charges, net 5.0 12.4 7.4 19.1 Intangible amortization, net 0.4 1.2 0.8 2.8 Adjusted net income $ 51.7 $ 50.8 $ 67.6 $ 73.1 Shares (in 000s) 45,141 44,847 45,091 44,726 Adjusted diluted earnings per share $ 1.15 $ 1.13 $ 1.50 $ 1.63 and Earnings per Share
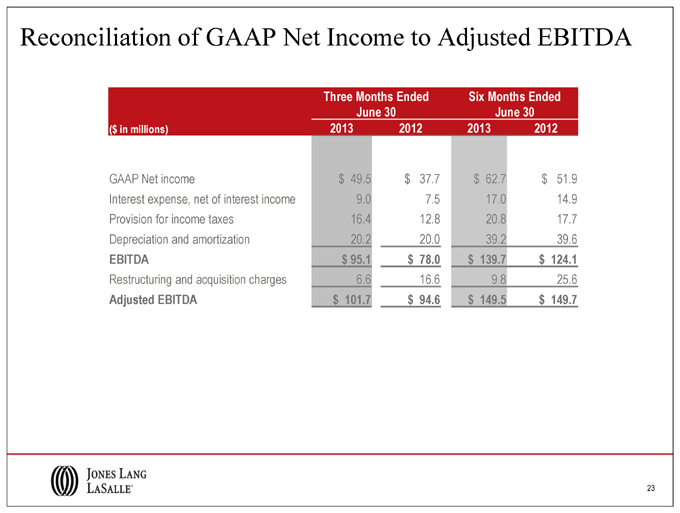
23 Reconciliation of GAAP Net Income to Adjusted EBITDA Three Months Ended June 30 Six Months Ended June 30 ($ in millions) 2013 2012 2013 2012 GAAP Net income $ 49.5 $ 37.7 $ 62.7 $ 51.9 Interest expense, net of interest income 9.0 7.5 17.0 14.9 Provision for income taxes 16.4 12.8 20.8 17.7 Depreciation and amortization 20.2 20.0 39.2 39.6 EBITDA $ 95.1 $ 78.0 $ 139.7 $ 124.1 Restructuring and acquisition charges 6.6 16.6 9.8 25.6 Adjusted EBITDA $ 101.7 $ 94.6 $ 149.5 $ 149.7