Attached files
| file | filename |
|---|---|
| 8-K - FORM 8-K - CMS ENERGY CORP | d576856d8k.htm |
Exhibit 99.1

CMS ENERGY
Investor Meeting
July 31, 2013
Cross Winds Energy Park Consumers Smart Energy Program
Gas Combined Cycle Plant
This presentation is made as of the date hereof and contains “forward-looking statements” as defined in Rule 3b-6 of the Securities Exchange Act of 1934, Rule 175 of the Securities Act of 1933, and relevant legal decisions. The forward-looking statements are subject to risks and uncertainties. All forward-looking statements should be considered in the context of the risk and other Energy’s and Energy’s Securities factors detailed from time to time in CMS Energy s Consumers Energy s and Exchange Commission filings. Forward-looking statements should be read in conjunction with “FORWARD-LOOKING STATEMENTS AND INFORMATION” and “RISK FACTORS” sections of CMS Energy’s and Consumers Energy’s Form 10-K for the year ended December 31, 2012 and as updated in subsequent 10-Qs. CMS Energy’s and Consumers Energy’s “FORWARD-LOOKING STATEMENTS AND INFORMATION” and “RISK FACTORS” sections are incorporated herein by reference and discuss important factors that could cause CMS Energy’s and Consumers Energy’s results to differ materially from those anticipated in such statements. CMS Energy and Consumers Energy undertake no obligation to update any of the information presented herein to reflect facts, events or circumstances after the date hereof.
The presentation also includes non-GAAP measures when describing CMS Energy’s results of operations and financial performance. A reconciliation of each of these measures to the most directly comparable GAAP measure is included in the appendix and posted on our website at www.cmsenergy.com.
CMS Energy provides historical financial results on both a reported (Generally Accepted Accounting Principles) and adjusted (non-GAAP) basis and provides forward-looking guidance on an adjusted basis. Management views adjusted earnings as a key measure of the company’s present operating financial performance, unaffected by discontinued operations, asset sales, impairments, regulatory items from prior years, or other items. These items have the potential to impact, favorably or unfavorably, the company’s reported earnings in future periods. Because the company is not able to estimate the impact of these matters, the company is not providing a reconciliation to the comparable future period reported earnings.
| 1 |
|
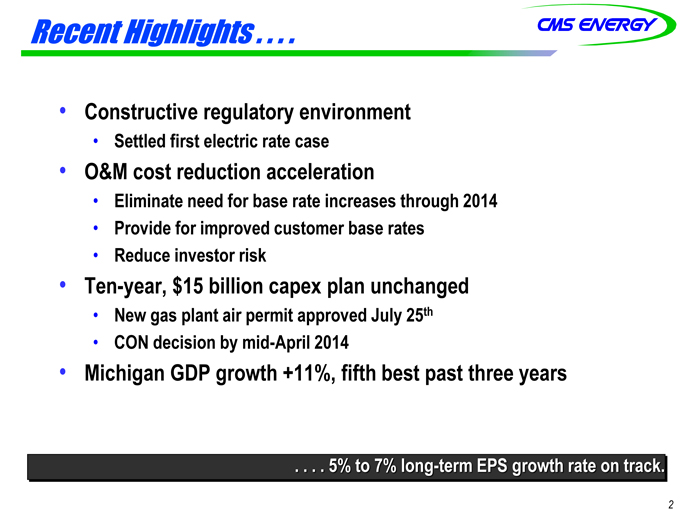
Recent Highlights . . . .
Constructive regulatory environment
Settled first electric rate case
O&M cost reduction acceleration
Eliminate need for base rate increases through 2014
Provide for improved customer base rates
Reduce investor risk
Ten-year, $15 billion capex plan unchanged
New gas plant air permit approved July 25th
CON decision by mid-April 2014
Michigan GDP growth +11%, fifth best past three years
. . . . 5% to 7% long-term EPS growth rate on track.
2
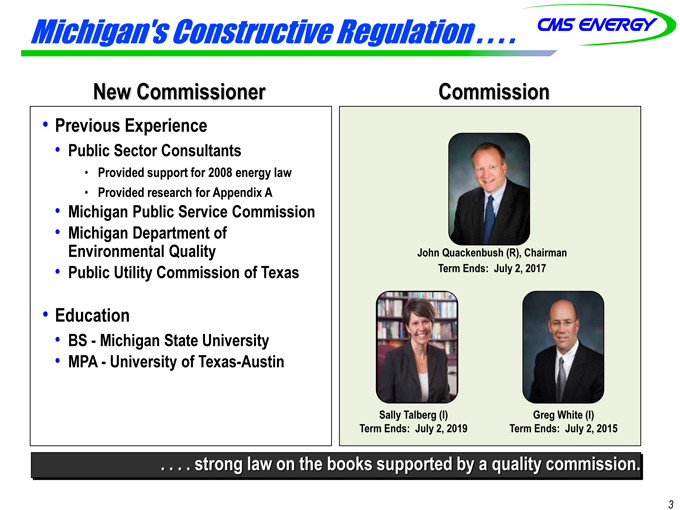
Michigan’s Constructive Regulation . . . .
New Commissioner Commission
Previous Experience
Public Sector Consultants
Provided support for 2008 energy law
Provided research for Appendix A
Michigan Public Service Commission
John Quackenbush (R), Chairman
Term Ends: July 2, 2017
Michigan Department of
Environmental Quality
Public Utility Commission of Texas
Education
BS - Michigan State University
MPA - of Texas-Austin
Sally Talberg (I)
Term Ends: July 2, 2019
Greg White (I)
Term Ends: July 2, 2015
University Texas . . . . strong law on the books supported by a quality commission.
3
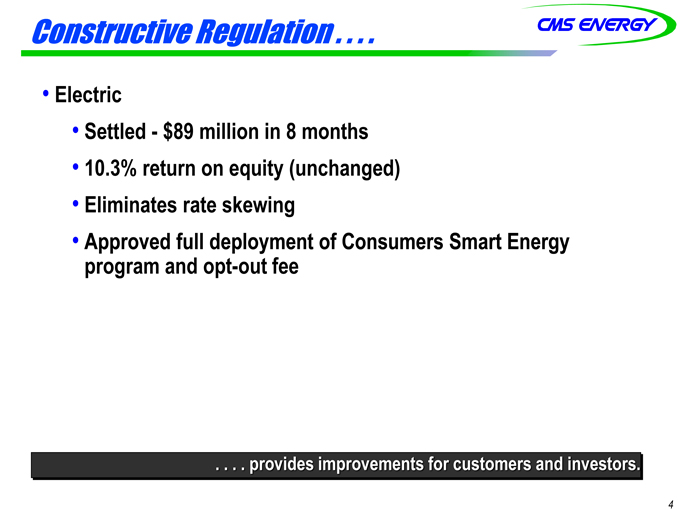
Constructive Regulation . . . .
Electric
Settled - $89 million in 8 months
10.3% return on equity (unchanged)
Eliminates rate skewing
Approved full deployment of Consumers Smart Energy program and opt-out fee
. . . . provides improvements for customers and investors.
4
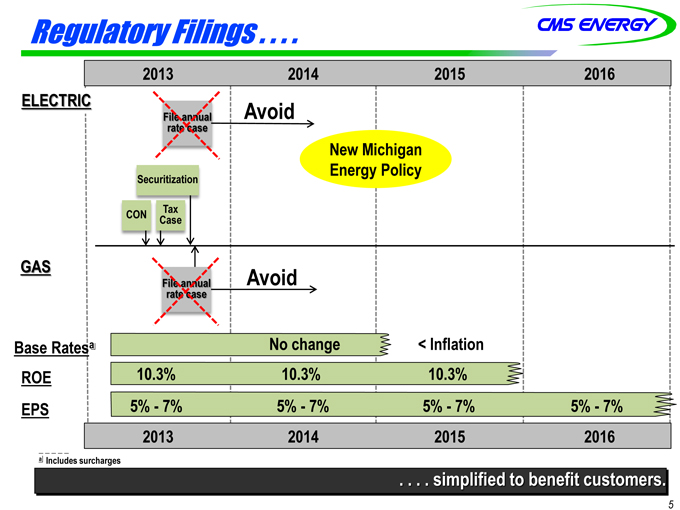
Regulatory Filings . . . .
2013 2014 2015 2016
ELECTRIC
File annual rate case
Avoid
New Michigan Energy Policy
Tax Case
Securitization
CON GAS File annual rate case Avoid
Base Ratesa No change < Inflation
EPS 5% - 7% 5% - 7% 5% -57%% - 7%
ROE 10.3% 10.3% 10.3%
5% - 7%
10.3%
2013 2014 2015 2016
. . . . simplif implified to benefit customers.
a Includes surcharges
| 5 |
|
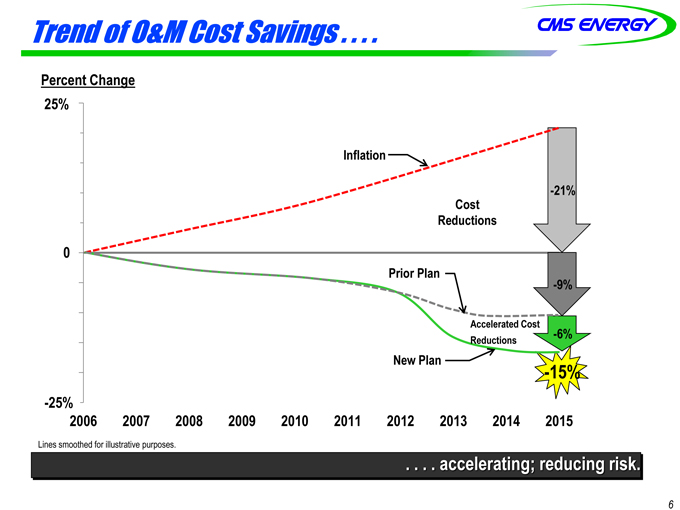
Trend of O&M Cost Savings . . . .
Percent Change
25%
0
Cost Reductions Inflation
-21%
-9%
Prior Plan
-6%
New Plan
Accelerated Cost Reductions
0
0
2006 2007 2008 2009 2010 2011 2012 2013 2014 2015
-15% -25%
. . . . accelerating; reducing risk.
Lines smoothed for illustrative purposes.
| 6 |
|
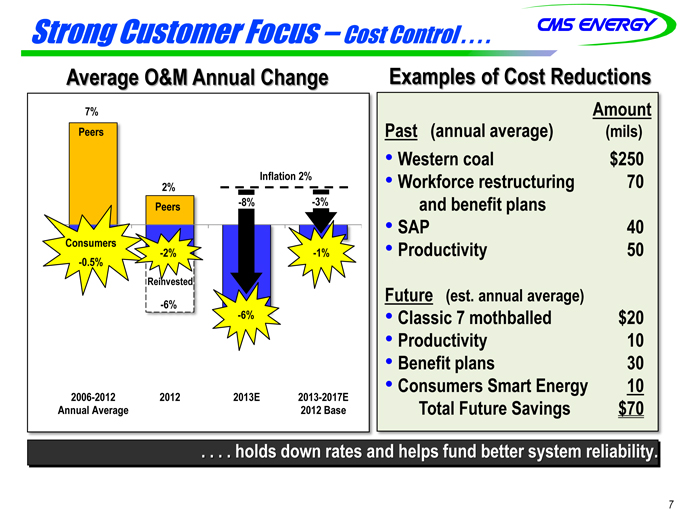
Strong Customer Focus – Cost Control . . . .
Average O&M Annual Change Amount
Past (annual average) (mils)
Average O&M Annual Change Examples of Cost Reductions
7% Peers Western coal $250 Workforce restructuring and benefit plans 70
Inflation 2% Peers -8% -3% 2% SAP 40
Productivity 50 -1%
Reinvested -6% Consumers -0.5%
-2% Future (est. annual average)
Classic 7 mothballed $20
Productivity 10
Benefit plans 30 -6% -6% Consumers Smart Energy 10
Total Future Savings $70 2006-2012
Annual Average
2012 2013E 2013-2017E
2012 Base
7 . . . . holds down rates and helps fund better system reliability.
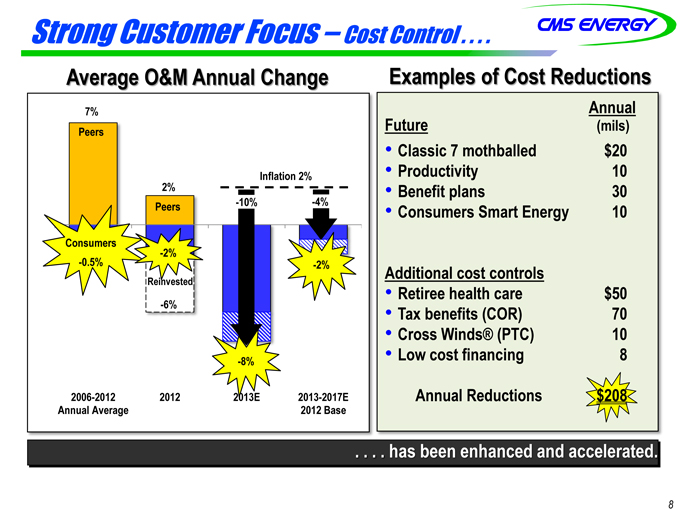
Strong Customer Focus – Cost Control . . . .
Average O&M Annual Change Examples of Cost Reductions
7% Peers Annual Future (mils) $20 Inflation 2% Peers -10% -4%
2% Classic 7 mothballed Productivity 10 Benefit plans 30 Consumers Smart Energy 10
-2% Reinvested 6% Consumers -0.5% -2% Additional cost controls Retiree health care $50
-8% -6% Tax benefits (COR) 70 Cross Winds® (PTC) 10 Low cost financing 8 2006-2012
Annual Average 2012 2013E 2013-2017E 2012 Base Annual Reductions $208
. . . . has been enhanced and accelerated.
8
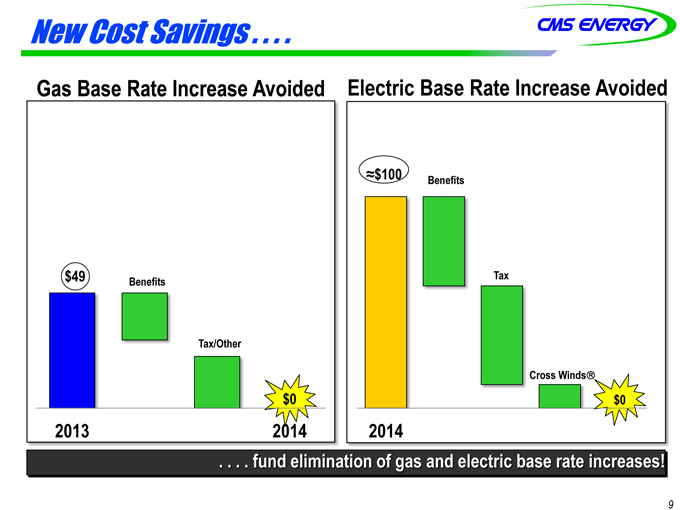
New Cost Savings . . . .
Electric Base Rate Increase Avoided
Gas Base Rate Increase Avoided
$100 Benefits
$49 Benefits Tax
Tax/Other
$0
2014
Cross Winds®
$0
2013 2014
9
. . . . fund elimination of gas and electric base rate increases!
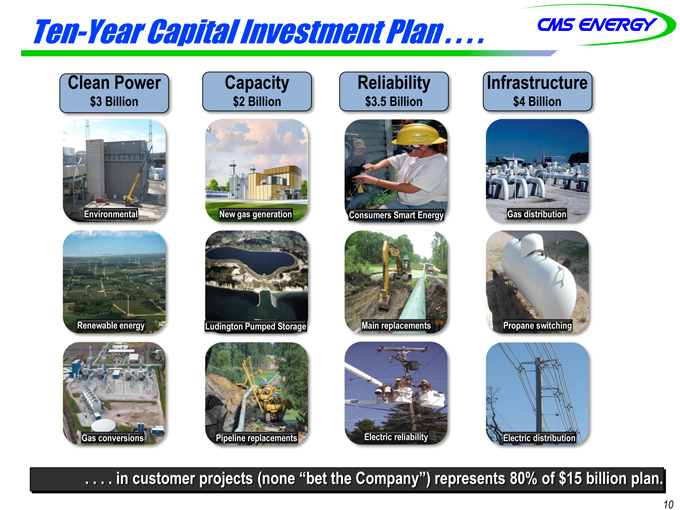
Ten-Year Capital Investment Plan . . . .
Clean Power
$3 Billion
Reliability
$3.5 Billion
Capacity
$2 Billion
Infrastructure
$4 Billion
New gas generation Environmental Consumers Smart Energy Gas distribution
Renewable energy Ludington Pumped Storage Main replacements Propane switching
Gas conversions Pipeline replacements Electric reliability Electric distribution
10
. . . . in customer projects (none “bet the Company”) represents 80% of $15 billion plan.
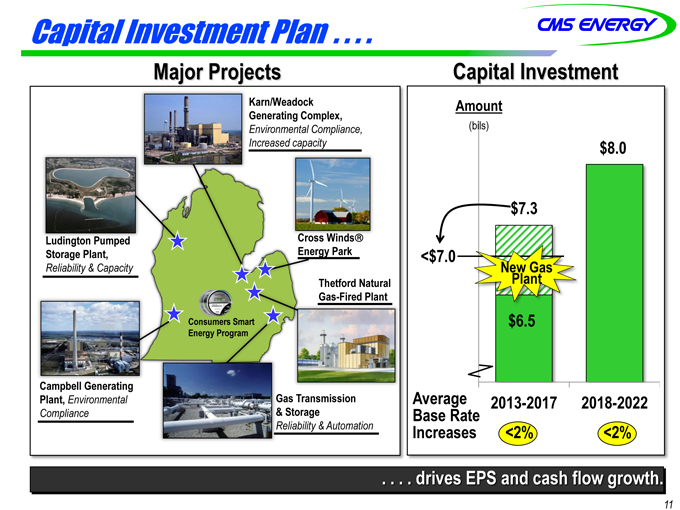
Capital Investment Plan . . . .
Major Projects Capital Investment
| 8 |
|
0 Amount (bils) Karn/Weadock Generating Complex, Environmental Compliance, |
$8.0 $7.3 Increased capacity <$7.0 New Gas Plant Ludington Pumped Storage Plant,
Reliability & Capacity Cross Winds® Energy Park Thetford Natural
$6.5 Gas-Fired Plant Consumers Smart Energy Program Average Base Rate Increases 2013-2017 2018-2022
<2% <2% Gas Transmission & Storage Reliability & Automation
Campbell Generating Plant, Environmental
Compliance
11
. . . . drives EPS and cash flow growth.
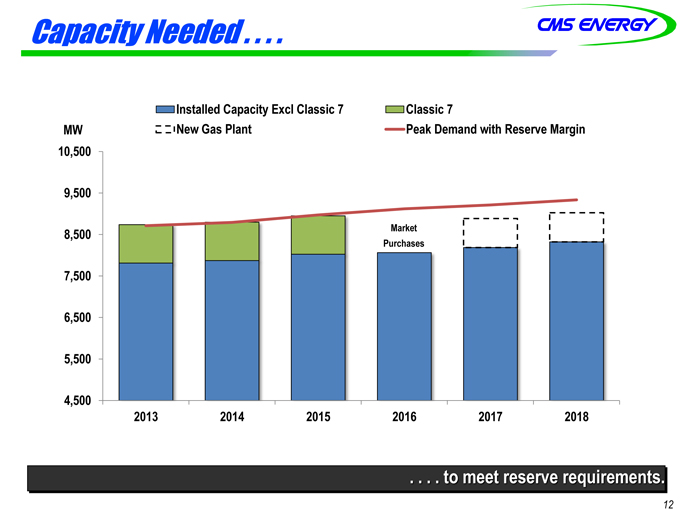
Capacity Needed . . . .
MW
Installed Capacity Excl Classic 7 Classic 7
New Gas Plant Peak Demand with Reserve Margin
9,500
10,500
7,500
8,500 Market
Purchases
5,500
6,500
4,500
2013 2014 2015 2016 2017 2018
12
. . . . to meet reserve requirements.
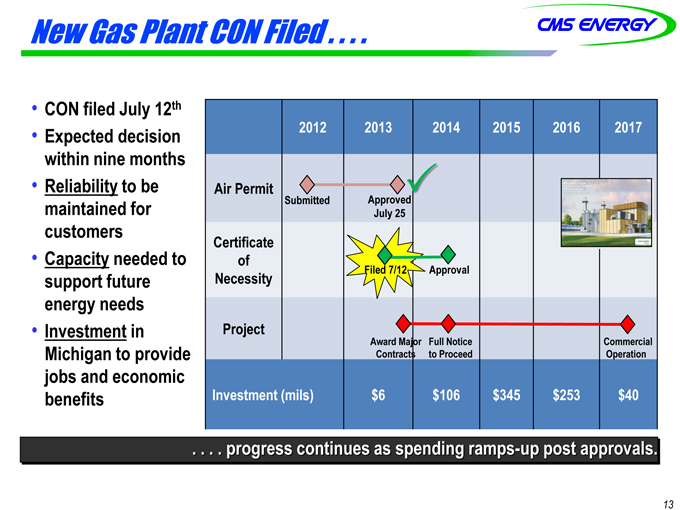
New Gas Plant CON Filed . . . .
CON filed July 12th
Expected decision within nine months
Reliability to be maintained for customers
Air Permit
Submitted Approved July 25
Capacity needed to support future energy needs
Certificate of Necessity Filed 7/12 Approval
Investment in Michigan to provide jobs and economic benefits
Project
Full Notice to Proceed
Commercial Operation
Award Major Contracts
Investment (mils) $6 $106 $345 $253 $40
13
2012 2013 2014 p 2015 2016 2017
. . . . progress continues as spending ramps-up post approvals.
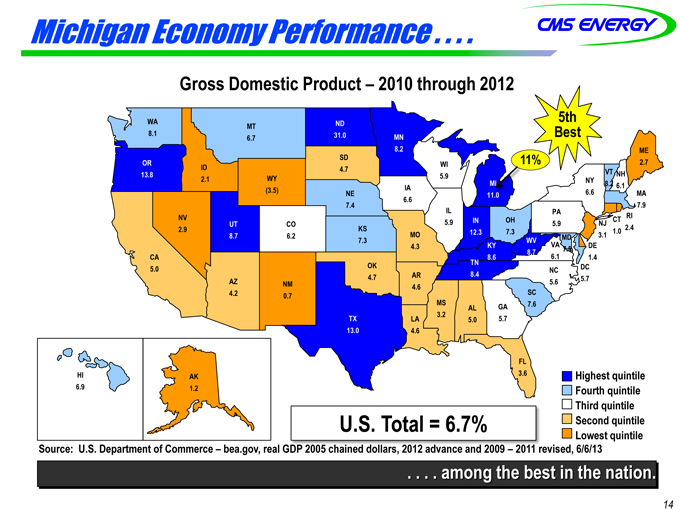
Michigan Economy Performance . . . .
Gross Domestic Product – 2010 through 2012
WA
8.1 MT 6.7 ND 31.0 MN 5th Best OR 11% 13.8 NV ID 2.1 WY (3.5) SD 4.7
NE 7.4 8.2 IA 6.6 WI 5.9 IL MI 11.0 IN OH PA NY 6.6 CT RI NH 6.1 MA 7.9 ME 2.7 VT 8.2 CA 5.0
2.9 UT 8.7 AZ 4 2 NM CO 6.2 KS 7.3 OK 4.7 MO 4.3 AR 4.6 5.9 TN 8.4 12.3 7.3KY 8.6 VA 6.1 WV
8.7 5.9 MD 7.5 DE 1.4 NJ 3.1 1.0 2.4 DC 5.7 SC NC 5.6 4.2 0.7 TX 13.0 LA 4.6 MS 3.2 AL
5.0 FL GA 5.7 7.6 Highest quintile Fourth quintile Third quintile Second quintile Lowest quintile
HI
6.9 AK 1.2 3.6 U.S. Total = 6.7%
14
. . . . among the best in the nation.
Source: U.S. Department of Commerce – bea.gov, real GDP 2005 chained dollars, 2012 advance and 2009 – 2011 revised, 6/6/13
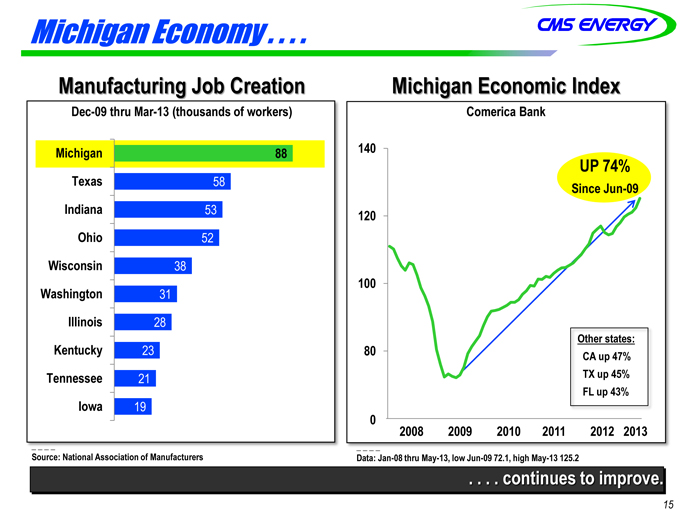
Michigan Economy . . . .
Manufacturing Job Creation
Dec-09 thru Mar-13 (thousands of workers)
Michigan Economic Index
Comerica Bank
140 53 58 88 Indiana Texas Michigan 120 UP 74% Since Jun-09
31 38 52 Washington Wisconsin Ohio 100 23 28 Kentucky Illinois
80 Other states: CA up 47% 19 21 Iowa Tennessee 60
2008 2009 2010 2011 2012 2013 0 TX up 45% FL up 43%
| 15. |
|
. . . continues to improve. |
Source: National Association of Manufacturers
Data: Jan-08 thru May-13, low Jun-09 72.1, high May-13 125.2
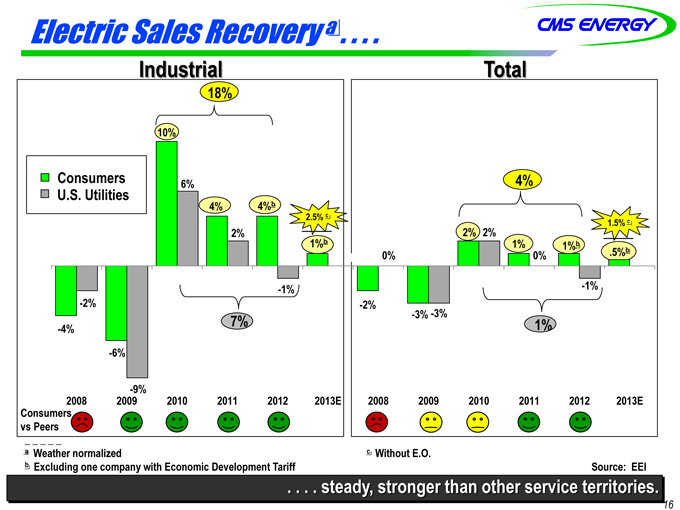
Electric Sales Recovery a . . . .
Industrial Total
10% 18% 4% 4%b 6% U.S. Utilities Consumers 4% 2 5%c1%b
2%1% 1%b.5%b 2%-1%0%2%0%-1%2.5% 1.5% c
-4%-6%-2%-3%-2%7% -3% 1%
Consumersvs Peers
-9%2008 2009 2010 2011 2012 2013E 2008 2009 2010 2011 2012 2013E
| 16. |
|
. . . steady, stronger than other service territories. |
a Weather normalized c Without E.O.
b Excluding one company with Economic Development Tariff Source: EEI
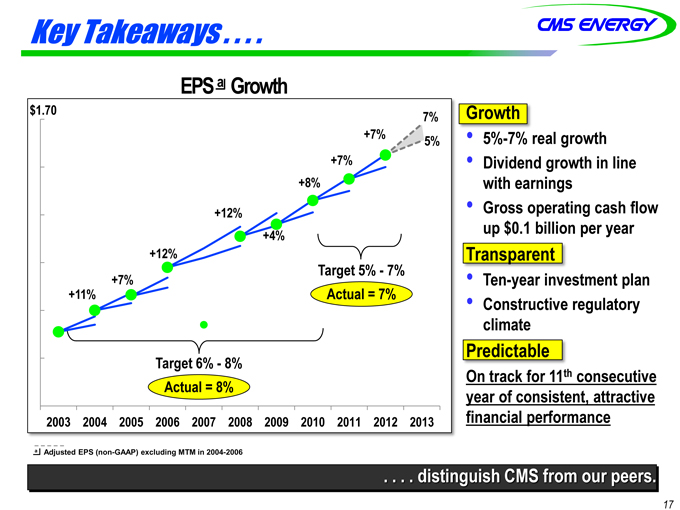
Key Takeaways . . . .
EPS a Growth+7%
$1.70 7%5% Growth• 5%-7% real growth
+12%+8%+7%% g
Dividend growth in line with earnings
Gross operating cash flow
+7% +12% +4% Target 5%—7% Actual = 7%
up $0.1 billion per year Transparent Ten-year investment plan
11% Target 6%—8% Constructive regulatory
climate
Predictable Actual = 8%
2003 2004 2005 2006 2007 2008 2009 2010 2011 2012 2013
On track for 11th consecutive
year of consistent, attractive
financial performance
17
. . . . distinguish CMS from our peers.
a Adjusted EPS (non-GAAP) excluding MTM in 2004-2006

Appendix
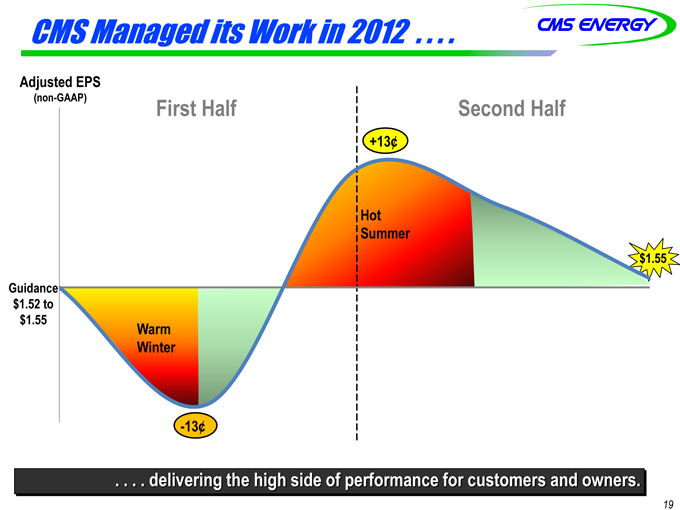
CMS Managed its Work in 2012 . . . .
Adjusted EPS
(non-GAAP)
+13¢
First Half Second Half
Hot Summer
Guidance
$1.55
$1.52 to
$1.55 Warm Winter
-13¢
19
. . . . delivering the high side of performance for customers and owners.
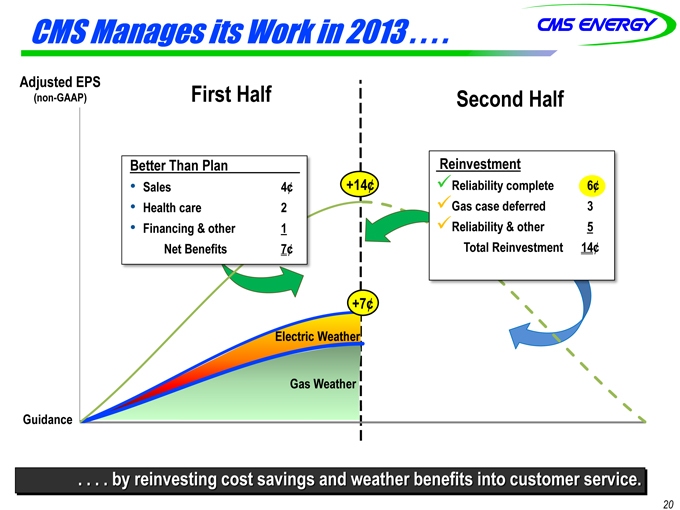
CMS Manages its Work in 2013 . . . .
Adjusted EPS
(non-GAAP)
First Half Second Half
+14¢
Better Than Plan
Sales 4¢
Health care 2
Reinvestment
Reliability complete 6¢
Gas case deferred 3
Financing & other 1
Net Benefits 7¢
Reliability & other 5
Total Reinvestment 14¢
+7¢
Electric Weather
Guidance
Gas Weather
20
. . . . by reinvesting cost savings and weather benefits into customer service.
GAAP Reconciliation
CMS ENERGY CORPORATION
Earnings Per Share By Year GAAP Reconciliation
(Unaudited)
| 2003 |
2004 |
2005 |
2006 |
2007 |
2008 |
2009 |
2010 |
2011 |
2012 |
|||||||||||||||||||||||||||||||
| Reported earnings (loss) per share - GAAP |
($ | 0.30 | ) | $ | 0.64 | ($ | 0.44 | ) | ($ | 0.41 | ) | ($ | 1.02 | ) | $ | 1.20 | $ | 0.91 | $ | 1.28 | $ | 1.58 | $ | 1.42 | ||||||||||||||||
| After-tax items: |
||||||||||||||||||||||||||||||||||||||||
| Electric and gas utility |
0.21 | (0.39 | ) | — | — | (0.07 | ) | 0.05 | 0.33 | 0.03 | 0.00 | 0.17 | ||||||||||||||||||||||||||||
| Enterprises |
0.74 | 0.62 | 0.04 | (0.02 | ) | 1.25 | (0.02 | ) | 0.09 | (0.03 | ) | (0.11 | ) | (0.01 | ) | |||||||||||||||||||||||||
| Corporate interest and other |
0.16 | (0.03 | ) | 0.04 | 0.27 | (0.32 | ) | (0.02 | ) | 0.01 | * | (0.01 | ) | * | ||||||||||||||||||||||||||
| Discontinued operations (income) loss |
(0.16 | ) | 0.02 | (0.07 | ) | (0.03 | ) | 0.40 | ( | *) | (0.08 | ) | 0.08 | (0.01 | ) | (0.03 | ) | |||||||||||||||||||||||
| Asset impairment charges, net |
— | — | 1.82 | 0.76 | 0.60 | — | — | — | — | — | ||||||||||||||||||||||||||||||
| Cumulative accounting changes |
0.16 | 0.01 | — | — | — | — | — | — | — | — | ||||||||||||||||||||||||||||||
| Adjusted earnings per share, including MTM - non-GAAP |
$ | 0.81 | $ | 0.87 | $ | 1.39 | $ | 0.57 | $ | 0.84 | $ | 1.21 | (a) | $ | 1.26 | $ | 1.36 | $ | 1.45 | $ | 1.55 | |||||||||||||||||||
| Mark-to-market impacts |
0.03 | (0.43 | ) | 0.51 | ||||||||||||||||||||||||||||||||||||
| Adjusted earnings per share, excluding MTM - non-GAAP |
NA | $ | 0.90 | $ | 0.96 | $ | 1.08 | NA | NA | NA | NA | NA | NA | |||||||||||||||||||||||||||
| * | Less than $500 thousand or $0.01 per share. |
| (a) | $1.25 excluding discontinued Exeter operations and accounting changes related to convertible debt and restricted stock. |
2003-12 EPS