Attached files
| file | filename |
|---|---|
| 8-K - FORM 8-K - S&T BANCORP INC | d575504d8k.htm |
| EX-99.2 - EX-99.2 - S&T BANCORP INC | d575504dex992.htm |
 Second Quarter 2013
Exhibit 99.1 |
 Todd
Brice President and
Chief Executive Officer
Mark Kochvar
Sr. EVP and
Chief Financial Officer |
 Forward Looking
Statement and Risk Factor
•
This presentation contains certain forward-looking statements within the meaning of Section 27A
of the Securities Act of 1933 and Section 21E of the Securities Exchange Act of 1934.
Forward- looking statements include, among others, statements regarding trends, strategies,
plans, beliefs, intentions, expectations, goals and opportunities. Forward looking
statements are typically identified by words or phrases such as believe, expect, anticipate,
intend, estimate, assume, strategy, plan, outlook, outcome, continue, remain, trend and
variations of such words and similar expressions,
or
future
or
conditional
verbs
such
as
will,
would,
should,
could,
may
or
similar
expressions. Actual results and performance could differ materially from those anticipated by
these forward-looking statements. Factors that could cause such a difference
include, but are not limited to, general economic conditions, changes in interest rates,
deposit flows, loan demand, asset quality, including real estate and other collateral values,
and competition. •
S&T cautions that these forward-looking statements are subject to numerous assumptions, risks
and uncertainties, which change over time. These forward-looking statements speak
only as of the date hereof, and S&T assumes no duty to update forward-looking
statements. Subsequent written
or
oral
statements
attributable
to
S&T
or
persons
acting
on
its
behalf
are
expressly
qualified in their entirety by the cautionary statements contained herein and those in S&T’s
reports previously and subsequently filed with the Securities and Exchange Commission.
3 |
 4
Non-GAAP Financial Measures
•
In
addition
to
the
results
of
operations
presented
in
accordance
with
Generally
Accepted
Accounting
Principles (GAAP), S&T management uses and this presentation
contains or references, certain non-GAAP financial measures, such as net interest income
on a fully taxable equivalent basis, that S&T believes provide information useful to
investors in understanding our underlying operational performance and our business and
performance trends as they facilitate comparisons with the performance of others in the
financial services industry. Although S&T believes
that
these
non-GAAP
financial
measures
enhance
investors’
understanding
of
S&T’s
business and performance, these non-GAAP financial measures should not be considered an
alternative to GAAP. The non-GAAP financial measures contained therein should be read in
conjunction with the audited financial statements and analysis as presented in the Annual
Report on Form 10-K as well as the unaudited financial statements and analyses as
presented in the respective Quarterly Reports on Forms 10-Q for S&T Bancorp, Inc. and
subsidiaries. |
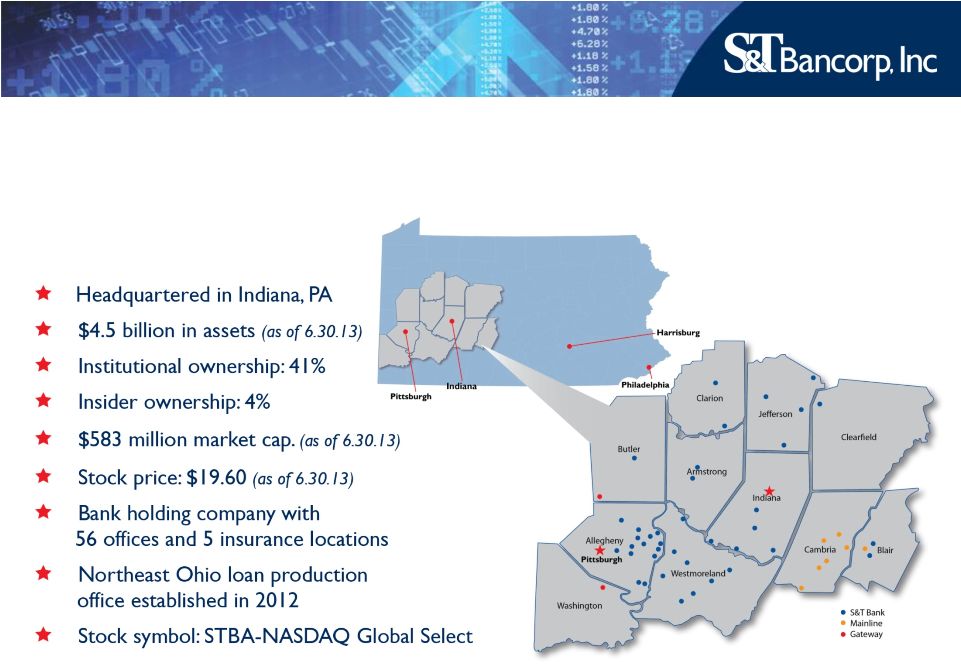 5
Corporate Profile |
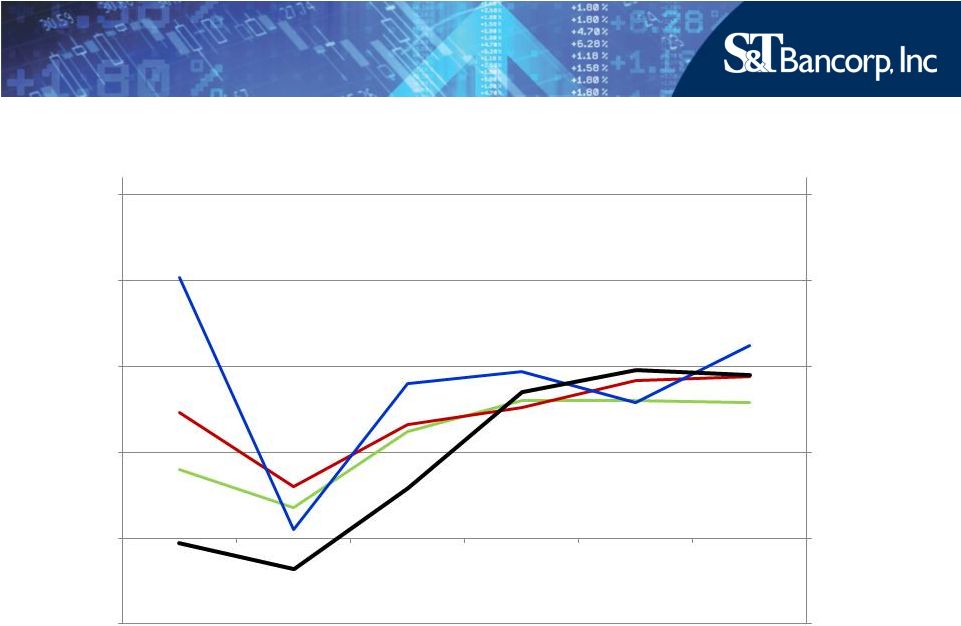 6
*
Peer banks per 2013 proxy statement
**
QTD annualized
Common Return on Assets
2.0%
1.5%
1.0%
0.5%
0.0%
-0.5%
2008
2009
2010
2011
2012
1Q 2013**
2.0%
1.5%
1.0%
0.5%
0.0%
-0.5%
BHC $3-10B
PA Banks
Peer Bank Median*
STBA |
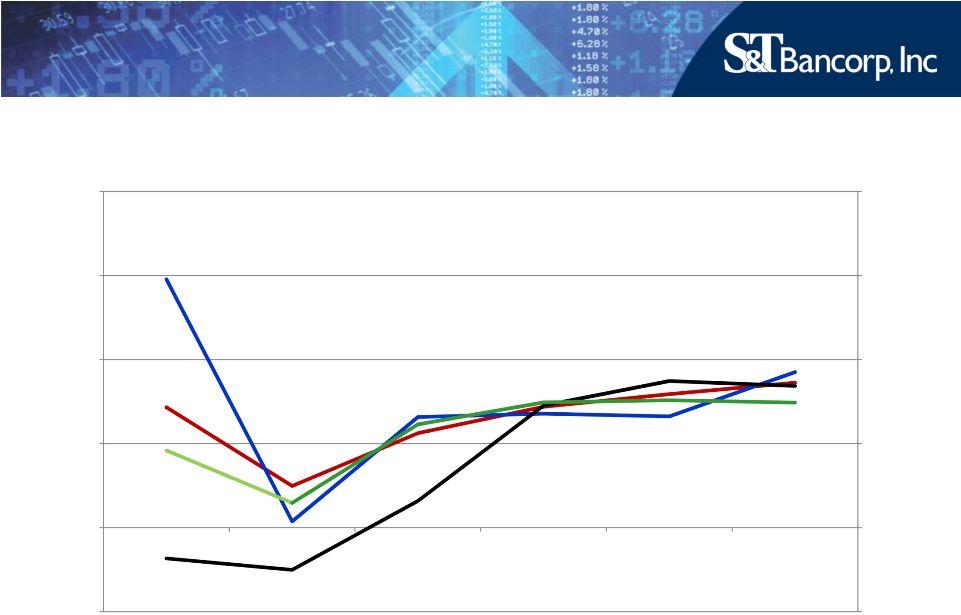 7
Common Return on Equity
*
Peer banks per 2013 proxy statement
**
QTD annualized
20%
15%
10%
5%
0%
-5%
2008
2009
2010
2011
2012
1Q 2013**
20%
15%
10%
5%
0%
-5%
BHC $3-10 B
PA Banks
Peer Bank
Median*
STBA |
 8
4 Lines of Business
Commercial Banking
Retail Banking
Wealth Management
Insurance |
 Commercial Banking
•
37 commercial lenders
•
14 business bankers
•
Privately held companies with sales
up to $150 million
•
Adding
producers; 8 new lenders this year
•
Northeast Ohio loan production office,
August 2012
9 |
 Retail Banking
•
Over 100,000 households
•
56 branches
•
Average branch size of $61.5 million
•
HOME Center
•
92% of customers highly satisfied
•
Over 70,000 customers enrolled in online banking
•
Over 14,000 customers enrolled in mobile banking
10 |
 Wealth Management
•
$1.7 billion AUM
•
3 divisions
–
S&T Trust
–
S&T Financial Services
–
RIA/Stewart Capital
•
Annual revenue of $9.8 million
•
Adding financial advisors
11 |
 Insurance
•
Full service agency
–
Commercial P&C (65%)
–
Group life and health (20%)
–
Personal lines (15%)
•
Annual revenue of $5.2 million
•
Focus on increasing
penetration of
S&T customer base
12 |
 13
Quarterly Summary
2013
2013
2012
Second
Quarter
First
Quarter
Second
Quarter
Net Income
$14.1
$12.3
$8.6
Diluted Earnings per Share
$0.47
$0.41
$0.30
Return on Average Assets
*
1.26%
1.12%
0.80%
Return on Average Shareholders Equity
10.36%
9.25%
6.80%
Dollars in millions, except per share data
*
Annualized
* |
 14
Income Statement
Dollars in millions, except per share data
*
Refer to appendix for reconciliation of Non-GAAP financial measures
2013
2013
2012
Second
Quarter
First
Quarter
Second
Quarter
Net Interest Income –
FTE
*
$35.8
$34.8
$34.9
Noninterest Income
12.9
11.7
12.5
Total Revenue
48.7
46.5
47.4
Noninterest Expense
(28.4)
(31.6)
(29.3)
Gain on sale of merchant card servicing business
-
3.1
-
Provision for Loan Losses
(1.0)
(2.3)
(7.0)
Net Income Before Taxes
19.3
15.7
11.1
Taxes
(5.2)
(3.4)
(2.5)
Net Income
$14.1
$12.3
$8.6
Diluted Earnings per Share
$ 0.47
$ 0.41
$0.30 |
 15
Balance Sheet
Dollars in millions
June 30,
2013
March 31,
2013
June 30,
2012
Securities
$ 480
$ 469
$ 369
Interest Bearing Balances
191
215
343
Loans, Net
3,400
3,339
3,151
Other
458
457
484
Total assets
$4,529
$4,480
$4,347
Deposits
$3,649
$3,639
$3,518
Borrowings
268
228
247
Other Liabilities
65
68
71
Equity
547
545
511
Total Liabilities & Equity
$4,529
$4,480
$4,347 |
 16
Loan Portfolio
Dollars in millions
June 30,
2013
March 31,
2013
June 30,
2012
Consumer
Residential Mortgage
$ 463
$ 443
$ 399
Home Equity
414
416
434
Installment and Other Consumer
68
69
79
Construction
3
3
2
Total Consumer
948
931
914
Commercial
Commercial Real Estate
1,501
1,480
1,402
Commercial & Industrial
827
806
717
Construction
167
165
163
Total Commercial
2,495
2,451
2,282
Total Portfolio Loans
3,443
3,382
3,196
Total Loans Held for Sale
3
3
2
Total Loans
$3,446
$3,385
$ 3,198 |
 Asset Quality
June 30,
2013
March 31,
2013
June 30,
2012
Nonaccrual Loans / Total Loans
1.10%
1.37%
2.16%
Nonperforming Assets / Total Loans Plus
OREO
1.11
1.39
2.25
Net Charge-offs / Average Loans*
0.10
0.34
1.02
Loan Loss Reserve / Total Loans
1.34
1.36
1.46
Loan Loss Reserve / Nonaccrual Loans
122
99
68
17
*
QTD annualized |
 18
Nonperforming Loans
Nonperforming Loans (NPL) are loans where collection of interest or
principal is doubtful or generally when interest or principal payments are
90 days or more past due. Dollars in millions
56.3
1.23
30.7
Total Commercial
13.6
2.86
4.8
Construction
6.8
0.63
5.2
Commercial
& Industrial
35.9
1.38
20.7
Commercial
Real Estate
Commercial
12.8
0.76
7.2
Total Consumer
0.4
-
Construction
-
-
-
Installment and Other Consumer
3.4
0.89
3.7
Home Equity
$ 9.0
0.75%
$ 3.5
Residential Mortgage
June 30,
2012
Consumer
% NPL
June 30,
2013
Total Nonaccrual Loans
$69.1
1.10%
$37.9
$ 2.0
$ 0.1
Specific Reserves
- |
 19
Net Interest Margin
2013
2013
2012
Second
Quarter
First
Quarter
Second
Quarter
Securities –
FTE*
2.58%
2.65%
3.15%
Interest Bearing Deposits
0.28
0.23
0.22
Loans –
FTE*
4.28
4.32
4.67
Total Earning Assets-FTE
3.89
3.91
4.14
Deposits
0.44
0.49
0.68
Borrowings
1.65
1.61
1.75
Total Costing Liabilities
0.54
0.58
0.77
Net Interest Margin
3.51%
3.49%
3.57%
*
Refer to appendix for reconciliation of Non-GAAP financial measures
* |
 20
Noninterest Income
Dollars in millions
2013
2013
2012
Second
Quarter
First
Quarter
Second
Quarter
Debit and Credit Card
$ 3.2
$ 2.5
$ 2.8
Wealth Management
2.8
2.6
2.6
Service Charges on Deposit Accounts
2.5
2.4
2.4
Insurance
1.6
1.8
1.5
Mortgage Banking
0.9
0.5
0.7
Gain on Sale of Merchant Card Servicing Business
-
3.1
-
Other
1.9
1.9
2.5
Total
$12.9
$14.8
$12.5 |
 21
Securities
June 30,
2013
March 31,
2013
June 30,
2012
Agencies
$233
$231
$173
Agency CMO
47
52
49
Agency Residential MBS
54
47
43
Agency Commercial MBS
31
22
-
Municipals
106
108
93
Equities
9
9
11
Total
$480
$469
$369
All securities are classified as available-for
sale Dollars in
millions |
 22
Deposits
Dollars in millions
June 30,
2013
March 31,
2013
June 30,
2012
Noninterest-bearing Demand
$ 948
$ 951
$ 887
Interest-bearing Demand
297
305
315
Money Market
329
327
305
Savings
1,004
993
912
Certificates of Deposit < $100K
636
655
730
Certificates Of Deposit > $100K
435
408
369
Total
$3,649
$3,639
$3,518 |
 23
Capital Ratios
June 30,
2013
March 31,
2013
June 30,
2012
Well-
Capitalized
Leverage
9.54%
9.42%
8.94%
5.00%
Tier 1 –
Risk-Based Capital
12.28
12.20
11.82
6.00
Total –
Risk-Based Capital
14.30
15.60
15.33
10.00
Tangible Common Equity /
Tangible Assets
*
8.43
8.46
7.99
NA
*
Refer to appendix for reconciliation of Non-GAAP financial measures
|
 Growth –
Merger & Acquisition Activity
•
2012 -
Gateway Bank of Pennsylvania
$ 105
•
2012 -
Mainline Bancorp
206
•
2008 -
IBT Bancorp
793
•
2002 -
Peoples Financial Corp
295
•
1998 -
Branch Purchase from Mellon
39
•
1997 -
Peoples Bank of Unity
288
•
1991 -
Atlantic Financial Savings Bank
100
•
1991 -
Vanguard Savings Bank
112
24
Assets/Deposits Acquired
$1,938
Dollars in Millions |
 25
The Right Size
•
Big Enough to:
–
Provide full complement of products and services
–
Access technology
–
Access Capital Markets
–
Attract talent
–
Expand –
mergers and acquisitions/de novo
•
Small Enough to:
–
Stay close to our customers
–
Understand our markets
–
Be responsive |
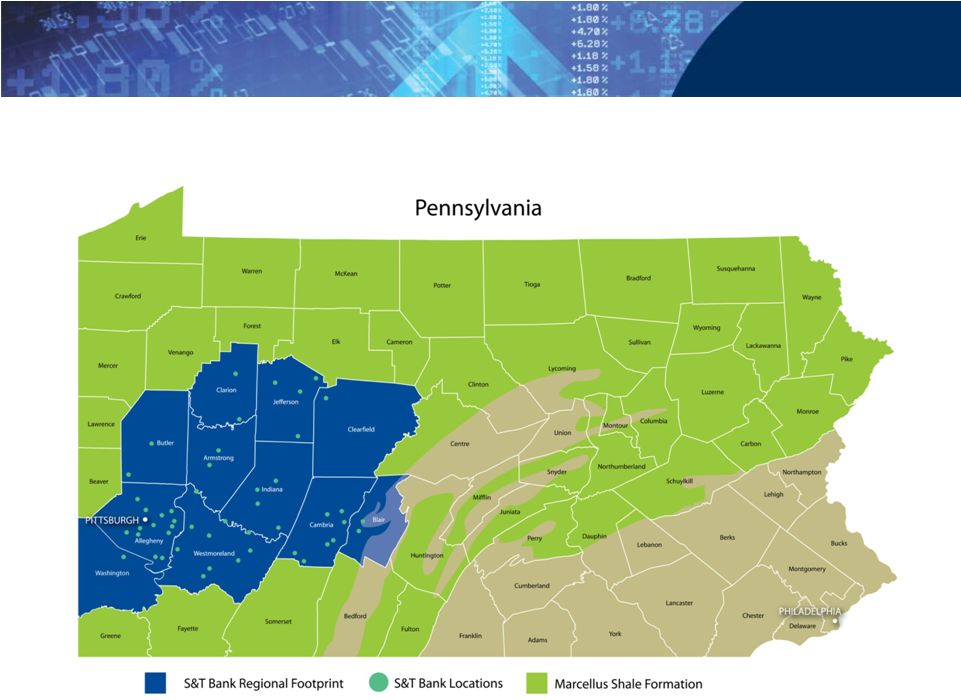 26
Marcellus Shale Distribution |
 STBA Investment
Thesis •
Stable Western PA economy
•
Long-term Marcellus Shale benefit
•
Renewed emphasis on loan growth
•
Improved asset quality
•
Expense discipline
•
Opportunistic acquirer
•
Historically high performing
27 |
 2013
2013
2012
Second
Quarter
First
Quarter
Second
Quarter
Interest Income per Consolidated Statements of Income
$38.6
$37.8
$39.4
Adjustment to Fully Taxable-equivalent Basis
1.2
1.2
1.1
Interest Income Adjusted to Fully Taxable-equivalent Basis
39.8
39.0
40.5
Interest Expense per Consolidated Statements of Income
4.0
4.2
5.6
Net Interest Income Adjusted to Fully Taxable-equivalent
Basis (non-GAAP)
$35.8
$34.8
$34.9
APPENDIX –
Non-GAAP Measures
Dollars in millions
28 |
 2013
2013
2012
Second
Quarter
First
Quarter
Second
Quarter
Securities
2.19%
2.27%
2.67%
Adjustment to Fully Taxable-equivalent Basis
0.39
0.38
0.48
Securities Adjusted to Fully Taxable-equivalent Basis
2.58
2.65
3.15
Loans
4.20
4.23
4.58
Adjustment to Fully Taxable-equivalent Basis
0.08
0.09
0.08
Loans Adjusted to Fully Taxable-equivalent Basis
4.28
4.32
4.67
Total Earning Assets
3.78
3.79
4.02
Adjustment to Fully Taxable-Equivalent Basis
0.11
0.12
0.12
Total Earning Assets Adjusted to Fully Taxable-equivalent Basis
3.89
3.91
4.14
Net Interest Margin
3.40
3.37
3.45
Adjustment to Fully Taxable-Equivalent Basis
0.12
0.12
0.12
Net Interest Margin Adjusted to Fully Taxable-equivalent Basis
3.51
3.49
3.57
APPENDIX –
Non-GAAP Measures /cont./
29 |
 June
30, 2013
March 31,
2013
June 30,
2012
Tangible Common Equity/Tangible Assets
Shareholders’
Equity/Assets
(GAAP
Basis)
12.08%
12.16%
11.74%
Effect of Excluding Intangible Assets
(3.65%)
(3.70%)
(3.75%)
Tangible Common Equity/Tangible Assets
8.43%
8.46%
7.99%
APPENDIX –
Non-GAAP Measures /cont./
30 |
 |